Article

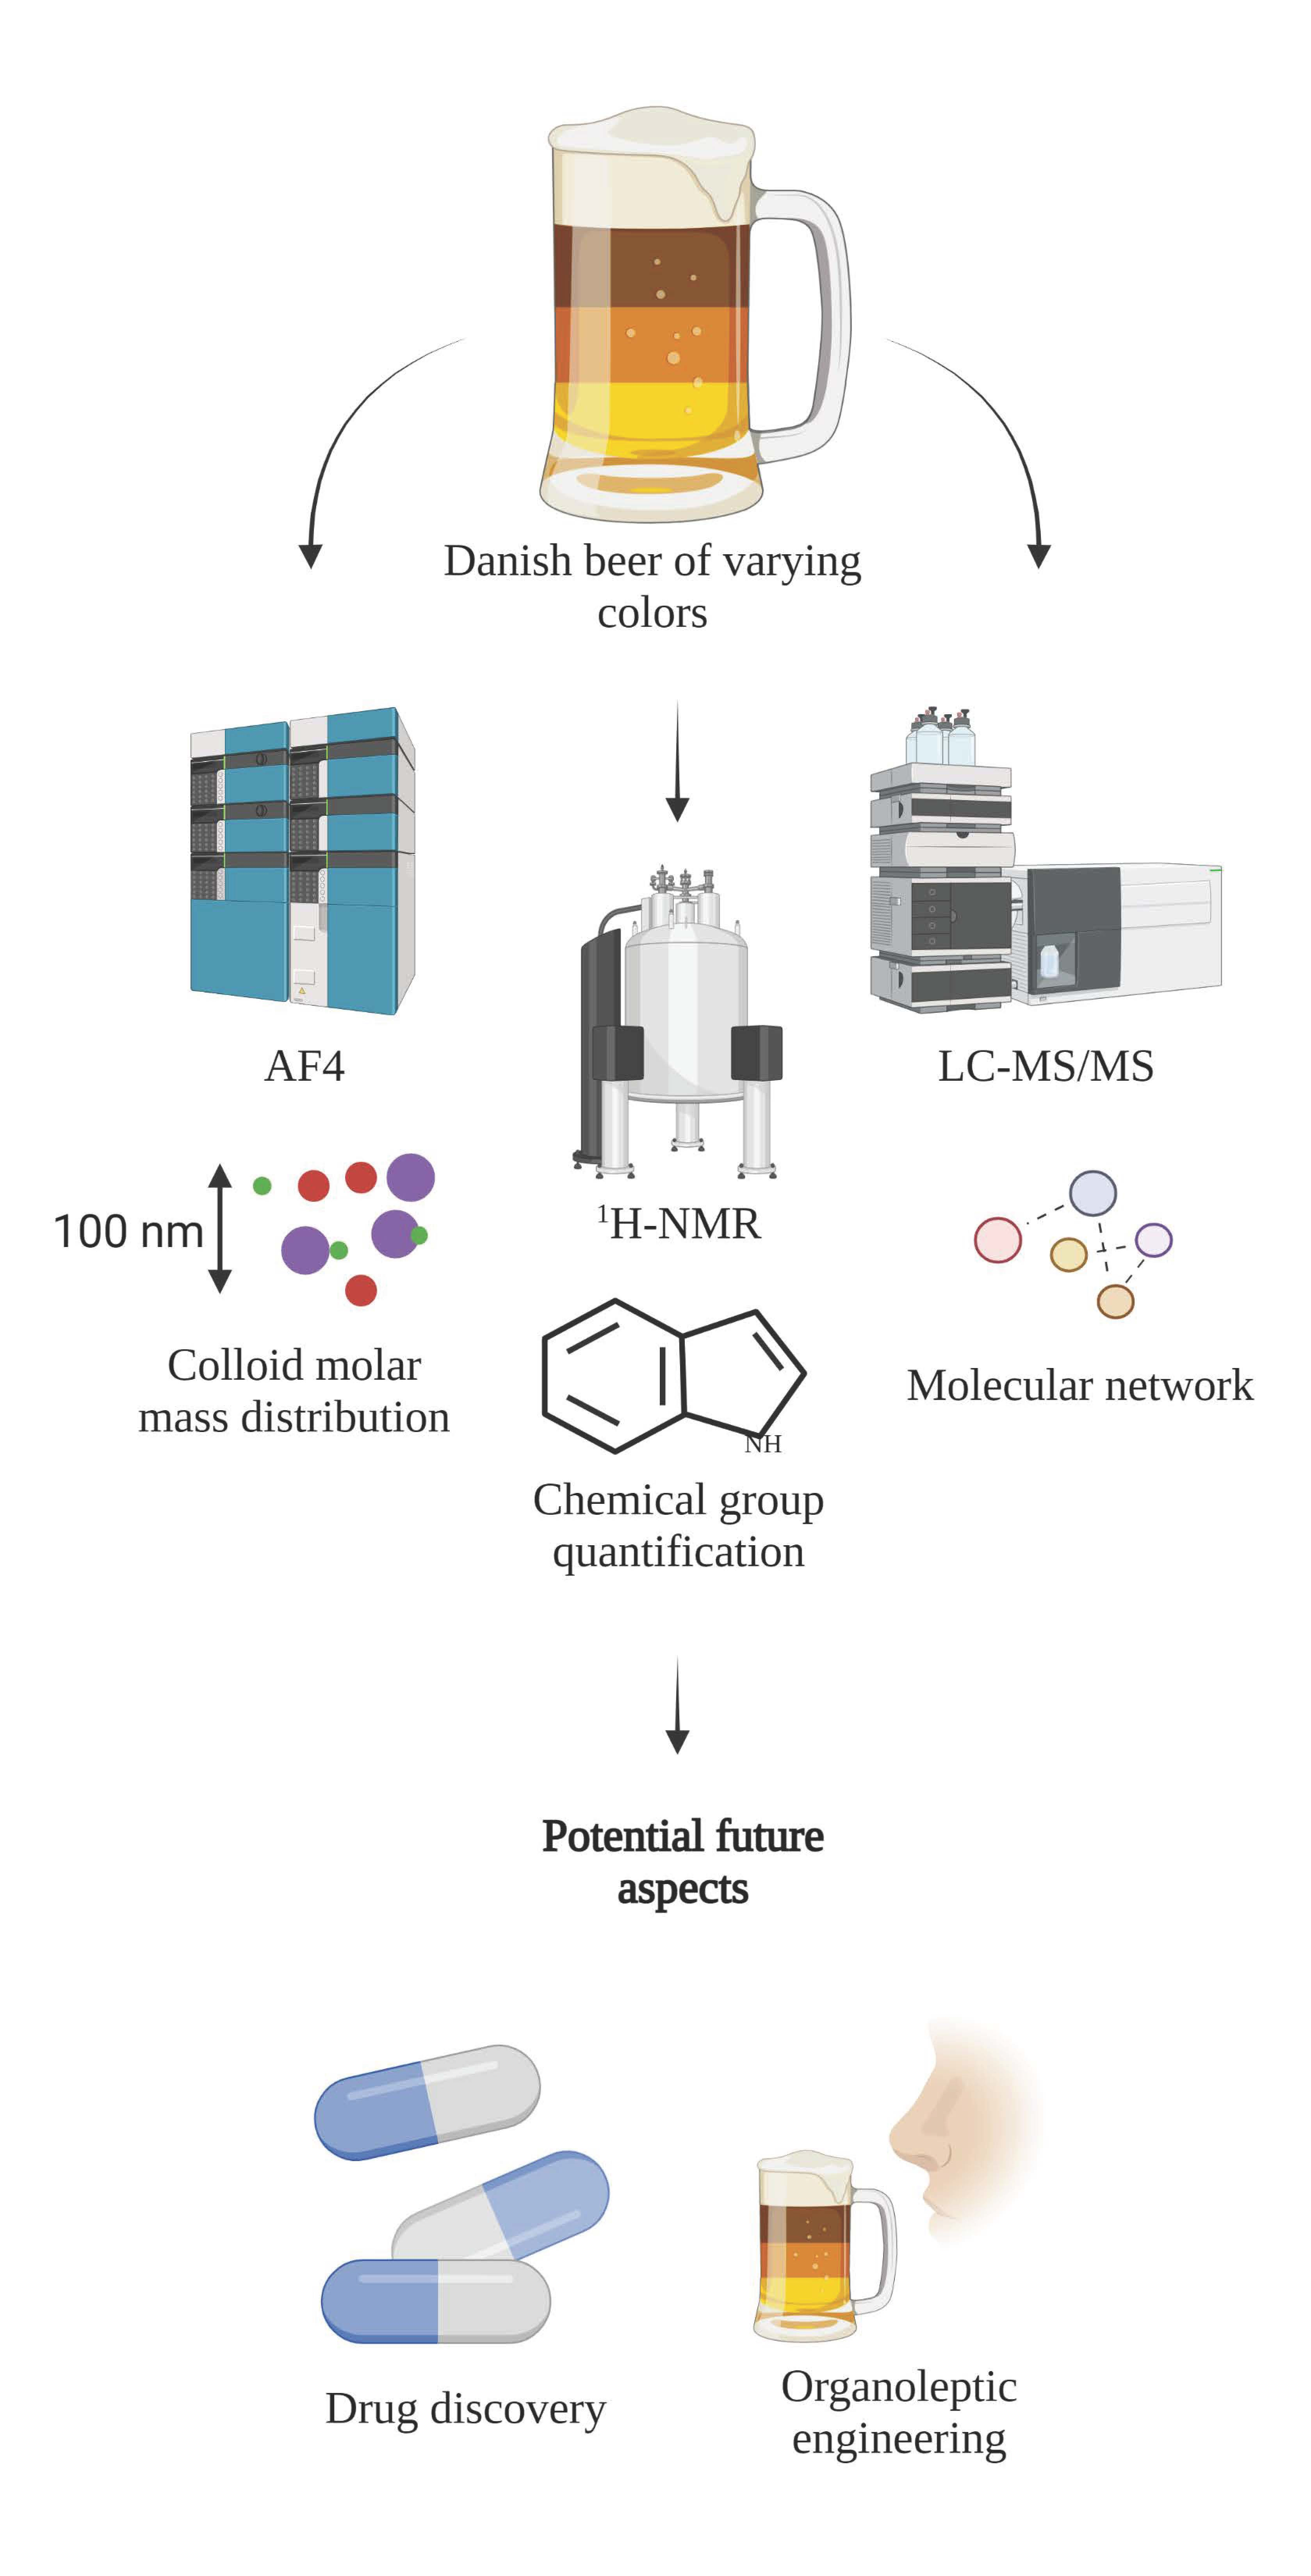
Molecular Networks and Macromolecular Molar Mass Distributions for Preliminary Characterization of Danish Craft Beers

by
Marcus M. K. Nielsen
1,
Sean Sebastian Hughes
2,
Judith Kuntsche
1,
Anders Malmendal
2,
Håvard Jenssen
2,
Carsten Uhd Nielsen
1 and
Bala Krishna Prabhala
1,*
1
Department of Physics, Chemistry, and Pharmacy, University of Southern Denmark, Campusvej 55, 5230 Odense M, Denmark
2
Department of Science and Environment, Roskilde University, Universitetsvej 1, 4000 Roskilde, Denmark
*
Author to whom correspondence should be addressed.
Beverages 2022, 8(2), 35; https://doi.org/10.3390/beverages8020035
Submission received: 13 May 2022 / Revised: 10 June 2022 / Accepted: 13 June 2022 / Published: 15 June 2022
(This article belongs to the Special Issue Featured Papers in Malting, Brewing and Beer Section)

Abstract

:
Beer is one of the most widely consumed beverages containing up to 200,000 unique small molecules and a largely uncharacterized macromolecular and particulate space. The chemical profiling of beer is difficult due to its complex nature. To address this issue, we have used various state-of-the-art methods to determine the physicochemical characteristics of beer. Specifically, we have successfully generated an LC-MS-based molecular network with minimal sample preparation to profile indoles in beer and confirmed their presence using 1H-NMR. In addition, we have identified different macromolecular signatures in beer of different colors by utilizing AF4-MALS. These preliminary findings lay the foundation for further research on the physicochemical nature of beer.

Graphical Abstract

1. Introduction

Beer is the most widely consumed alcoholic beverage in the world, and the third most consumed drink after water and tea [1]. It is a complex mixture of volatile and non-volatile compounds containing up to 200,000 unique small molecules [2]. These compounds either stem from unprocessed natural ingredients or are formed during fermentation or storage [2]. Yeast fermentation of amino acids and their metabolites, together with other compounds generated during the manufacturing of beer, contributes to the overall nutritional content of the beer [3]. The organoleptic properties of beer are mainly affected by aromatic and aliphatic alcohols, esters, aldehydes, some organic acids and carbonyls, and a range of terpenes [4] The most abundant amino acid in beer is proline [5] and tryptophan in minor amounts has also been observed [6]. The color of beer is generally imparted by the use of different malts, with darker beers using more caramelized malt, and lighter beers using paler, less caramelized, malts [7]. The variety of the malts impacts not just the flavor, but also the metabolic signature of the beer, both pre- and post-fermentation [7,8]. In general, craft beers tend to have more complex metabolic signatures than industrial beers due to more expensive and varied ingredients and brewing processes [9].
Molecular networking is a computational method useful for analyzing and visualizing data-dependent LC-MS/MS datasets. They can be generated by using the Global Natural Products Social Molecular Networking (GNPS) web-based ecosystem [10]. First, a data-dependent MS/MS survey needs to be acquired and used as input. GNPS assigns a score for any pair of features across spectra, based on their fragmentation pattern, i.e., any similar fragment ions or m/z shifts. It then uses specified spectral libraries to try to annotate the features. Based on the assigned score, the features may be connected to form a network. The method has previously been used to putatively annotate unknown compounds of a certain chemical group based on their fragmentation patterns [11,12].
Tryptophan is a large neutral amino acid containing an indole side chain and is also a precursor to several neurotransmitters. During fermentation processes, yeast transforms tryptophan into several other tryptophan-like compounds such as melatonin, serotonin, and tryptophol [13]. These compounds are associated with a slight bitter sensation in the taste of the beer [14]. As tryptophan-like compounds can cross the blood–brain barrier, they are also often used as drug substances to positively affect sleep, social function, depression, and cognitive function [15,16]. Several methods have been used to detect tryptophan though mass spectrometry coupled to various separation techniques (gas chromatography, liquid chromatography, and capillary electrophoresis) is the most frequently used [3,17,18,19,20]. Moreover, LC-MS systems have also been used to profile the compounds in beer, but the complex nature of beer poses significant challenges in the sample preparation [21]. Furthermore, the targeted profiling of compounds needs special methods depending upon the nature of the compounds, which often encounter sensitivity issues when dealing with large numbers of compounds. Previously, a more targeted approach using solid-phase extraction has successfully been used to detect various indoles in beer [18]. As tryptophan, melatonin, and serotonin have already been detected in beer, it seems likely that additional indoles could be present in beer. By utilizing molecular networking, the present study aims to putatively annotate indoles in beer, with the presumption that the method can be extrapolated to most other chemical groups.
In addition to small molecules, beer contains vesicles secreted by yeast during the fermentation [22]. These vesicles have largely gone uncharacterized, and therefore so has their effect on taste and mouthfeel. Asymmetrical flow field-flow fractionation (AF4) coupled with multi-angle light scattering (MALS) has previously been utilized to determine the molar mass distribution of macromolecules in beer and for quality control purposes, i.e., to verify batch consistency [23,24].
Thus, the overall aim of the present study was threefold: To investigate the possibility of generating molecular networks, to identify different indoles in beer and confirm their presence using NMR spectroscopy [17,25], and to analyze the sizes of the different colloidal fractions of beer samples using AF4 coupled to MALS.

2. Materials and Methods

A number of beers were purchased from three different Danish microbreweries: Holbæk Bryghus (Holbæk, Denmark), Ribe Bryghus (Ribe, Denmark), Theodor Schiøtz Brewing Co (Faxe, Denmark). The beers are listed in Table 1 along with the qualitatively observed colors split into three categories: Light, medium, or dark.

2.1. LC-MS

The beer samples were prepared as previously described [26]. The beers were aliquoted in 50 mL centrifuge tubes and bubbled with nitrogen for 3–4 h followed by storage at −80 °C. On the day of analysis, the samples were thawed and equilibrated at room temperature under light protection. The samples were run without further sample preparation on a Waters 2695 HPLC equipped with a Waters Spherisorb ODS-2, C-18 column (15 cm, 3 µm, 4.6 mm) coupled to a Waters Q-TOF Premier using electrospray ionization in positive mode. Chromatographic separation was performed using an injection volume of 5 µL and a flow rate of 0.3 mL/min at a linear gradient from 100% mobile phase A (5% acetonitrile in water with 0.1% (v/v) formic acid) to 100% mobile phase B (95% (v/v) acetonitrile in water with 0.1% (v/v) formic acid) over 40 min, and then a linear gradient back to 100% mobile phase A until 45 min. The samples were run in a data-dependent acquisition under survey mode (product ion scan), which alternates between a scan and MS/MS modes in a data-dependent manner in a range of 100–1000 m/z. The top eight ions with the largest ion currents (“top N ions”) were set to be measured in MS/MS when the total ion current was >4. The survey was set to change from scan to MS/MS at a total ion current of <10 count/second and changed back to scan after 30 s regardless of ion current. A collision energy ramp of 5 (low energy)–40 (high energy) was used for scan and MS/MS modes to obtain all ions at both low and high collision energy to generate a spectrum easier to network. A full list of LC-MS apparatus and method parameters can be seen in Table 2.
A molecular network was created using the online workflow (https://ccms-ucsd.github.io/GNPSDocumentation/ (accessed on 20 December 2021)) on the GNPS website (http://gnps.ucsd.edu (accessed on 20 December 2021)). MS/MS spectra were window-filtered by choosing only the top 6 fragment ions in the +/− 50 Da window throughout the spectrum. The precursor ion mass tolerance was set to 0.3 Da with a MS/MS fragment ion tolerance of 0.3 Da. A network was then created where edges were filtered to have a cosine score above 0.5 and more than 1 matched peak. Further, edges between two nodes were kept in the network if and only if each of the nodes appeared in each other’s respective top 100 most similar nodes. Finally, the maximum size of a molecular family was set to 100, and the lowest-scoring edges were removed from molecular families until the molecular family size was below this threshold. The spectra in the network were then searched against 6 of GNPS’ spectral libraries. The library spectra were filtered in the same manner as the input data. All matches kept between network spectra and library spectra were required to have a score above 0.5 and at least 1 matched peak. The parameters for the generation of the network, including the specific spectral libraries utilized, can be found on the GNPS website at https://gnps.ucsd.edu/ProteoSAFe/status.jsp?task=978c630557b94eddaaf8fedcbea12e64 (accessed on 20 December 2021). The specific steps in the generation of networks using GNPS are detailed in their documentation at https://ccms-ucsd.github.io/GNPSDocumentation/ (accessed on 20 December 2021).
The generated network was manually curated using Cytoscape [27], to remove non-annotated nodes and isolate the subnetwork containing tryptophan.

2.2. NMR Spectroscopy

Samples for NMR spectroscopy were prepared by adding 50 μL of phosphate buffer (100 mM, pH 5.4) in D2O containing 10 μM of trimethylsilylpropanoic acid (TSP) d4 and 10 μM NaN3 to 550 μL of beer and loading it into 5 mm NMR tubes. NMR measurements were performed at 300 K on a Bruker AVANCE 800 MHz NMR spectrometer (Bruker BioSpin, Rheinstetten, Germany), operating at a 1H frequency of 800.08 MHz and equipped with a cryogenically cooled, triple-resonance (1H, 13C, 15N) CPP-TCI probe. The 1D 1H NMR spectra were acquired using a standard zgesgp experiment. A total of 256 transients of 64 K data points spanning a spectral width of 16 ppm were collected. A 2D TOCSY spectrum of Dybsort porter was acquired using a standard dipsi2esgpph experiment. A total of 1024 increments with 32 transients of 4 K data points spanning a spectral width of 10 ppm were collected.
The 1D spectra were processed and analyzed in Chenomx NMR Suite (Chenomx Inc., Edmonton, AB, Canada). The signals at 7.72, 7.53, and 7.27 ppm from the indole group of tryptophan were identified and the tryptophan concentrations were estimated by comparison to the intensity of the ethanol signals at 3.64 and 1.17 ppm. The 2D TOCSY spectrum was processed using Topspin (Bruker Biospin, Rheinstetten, Germany).

2.3. AF4-MALS

The AF4 instrument (Eclipse 3+, Wyatt) was connected to an isocratic pump, degasser, and thermostated autosampler (all from Agilent, 1200 series). The trapezoidal-shaped AF4 channel (length 265 mm, largest width 22 mm, height 350 µm, Wyatt) was assembled with a polyether sulphone membrane (MWCO 10 kDa, Millipore, Bedford, MA, USA). The separation system was connected to a variable wavelength detector set to 280 nm (VWD, Agilent, 1200 series), a differential refractive index (dRI) detector (Optilab rEx, Wyatt), and a multi-angle light scattering (MALS) detector (HELEOS II, Wyatt Technology). Different volumes (50 to 100 μL) of beer samples (1:1 diluted or original) were injected into the AF4 channel with 0.2 mL/min over 7 min (focus flow 2 mL/min) and then eluted at constant detector flow (1 mL/min) applying an initial constant cross flow of 3 mL/min for 10 min followed by an exponentially decreasing cross flow from 3.0 to 0 mL/min over 30 min and elution without cross flow over 10 min. Purified water preserved with 0.02% sodium azide was used as carrier liquid and for sample dilution.
Data were analyzed with the Astra software version 8. For molar mass determination, the Debye-fitting method was applied and dRI detector signals were used to determine sample concentration (dn/dc 0.185). Particle sizes (RMS radius) were determined in the particle mode by applying the Berry fit method. Blank injections were used for baseline correction of the dRI signals. The concentrations of colloids in the beer samples were calculated by the detected mass (dRI signals) and taking the injection volume and sample dilution into account.

3. Results and Discussion

The 11 beers of different colors (Table 1) were analyzed by LC-MS to identify indoles, and 1H-NMR was used to confirm their presence and quantify them. Features identified in LC-MS were used to generate a molecular network of indoles. The macromolecular fractions of 3 beers of varying colors, light (Holbæk Pilsner), medium (Vikingebryg), and dark (Dybsort porter), were analyzed using AF4-MALS.

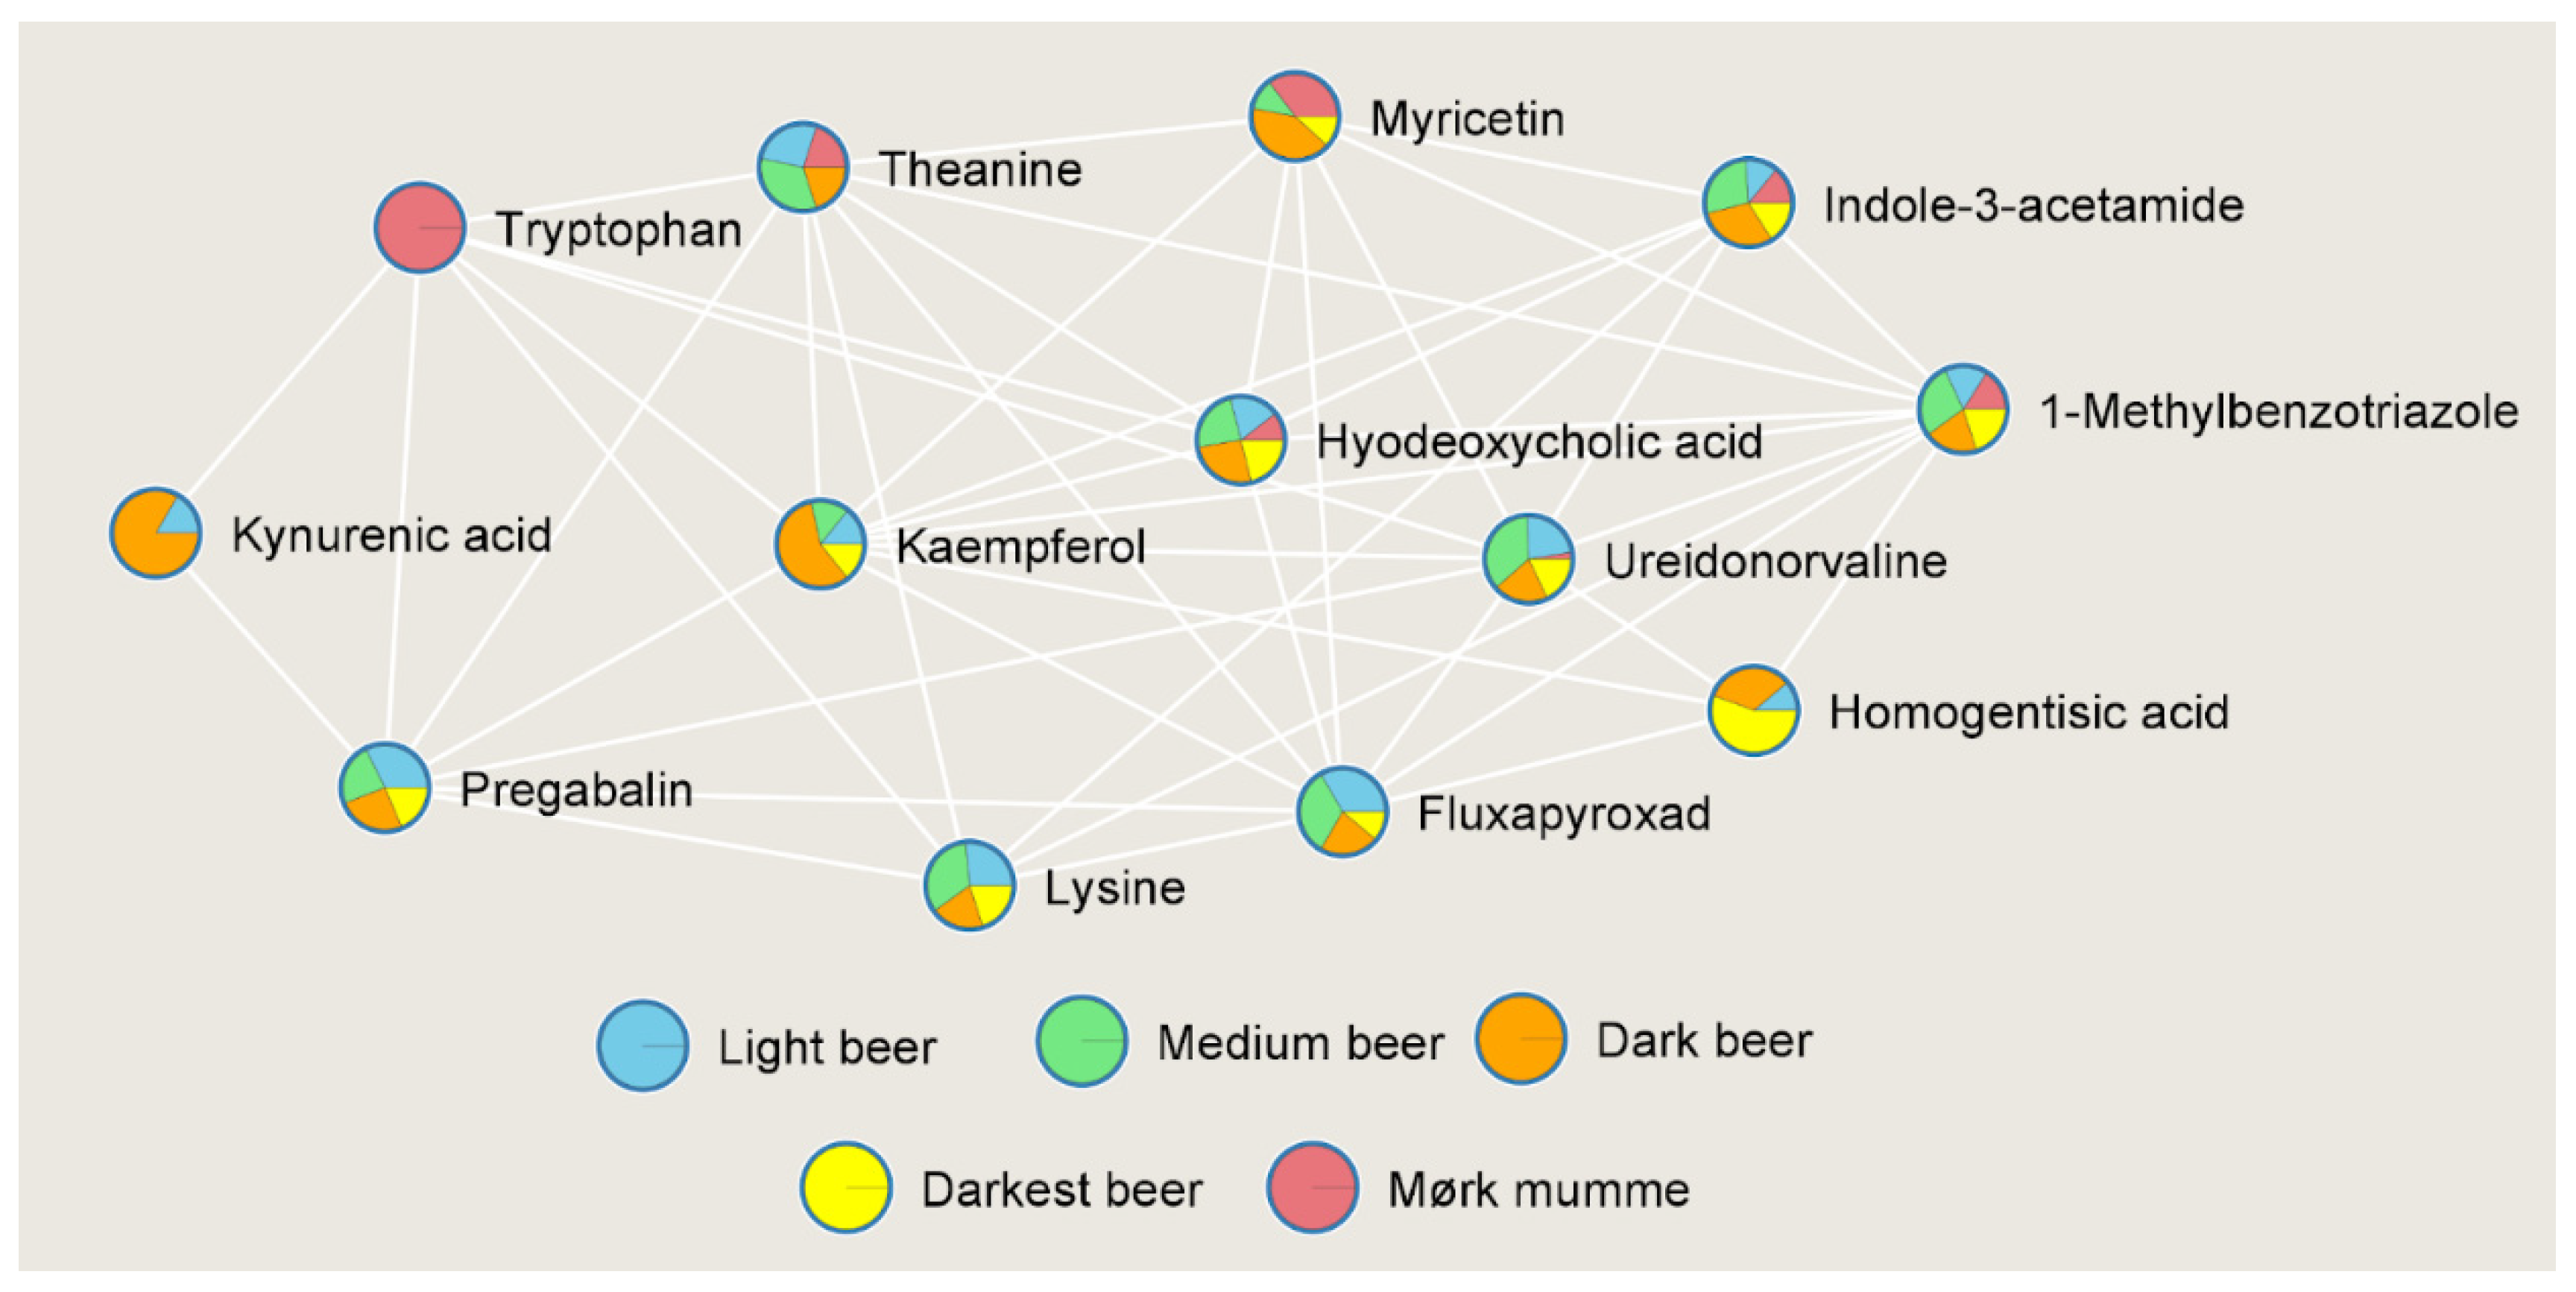
3.1. LC-MS and Molecular Network
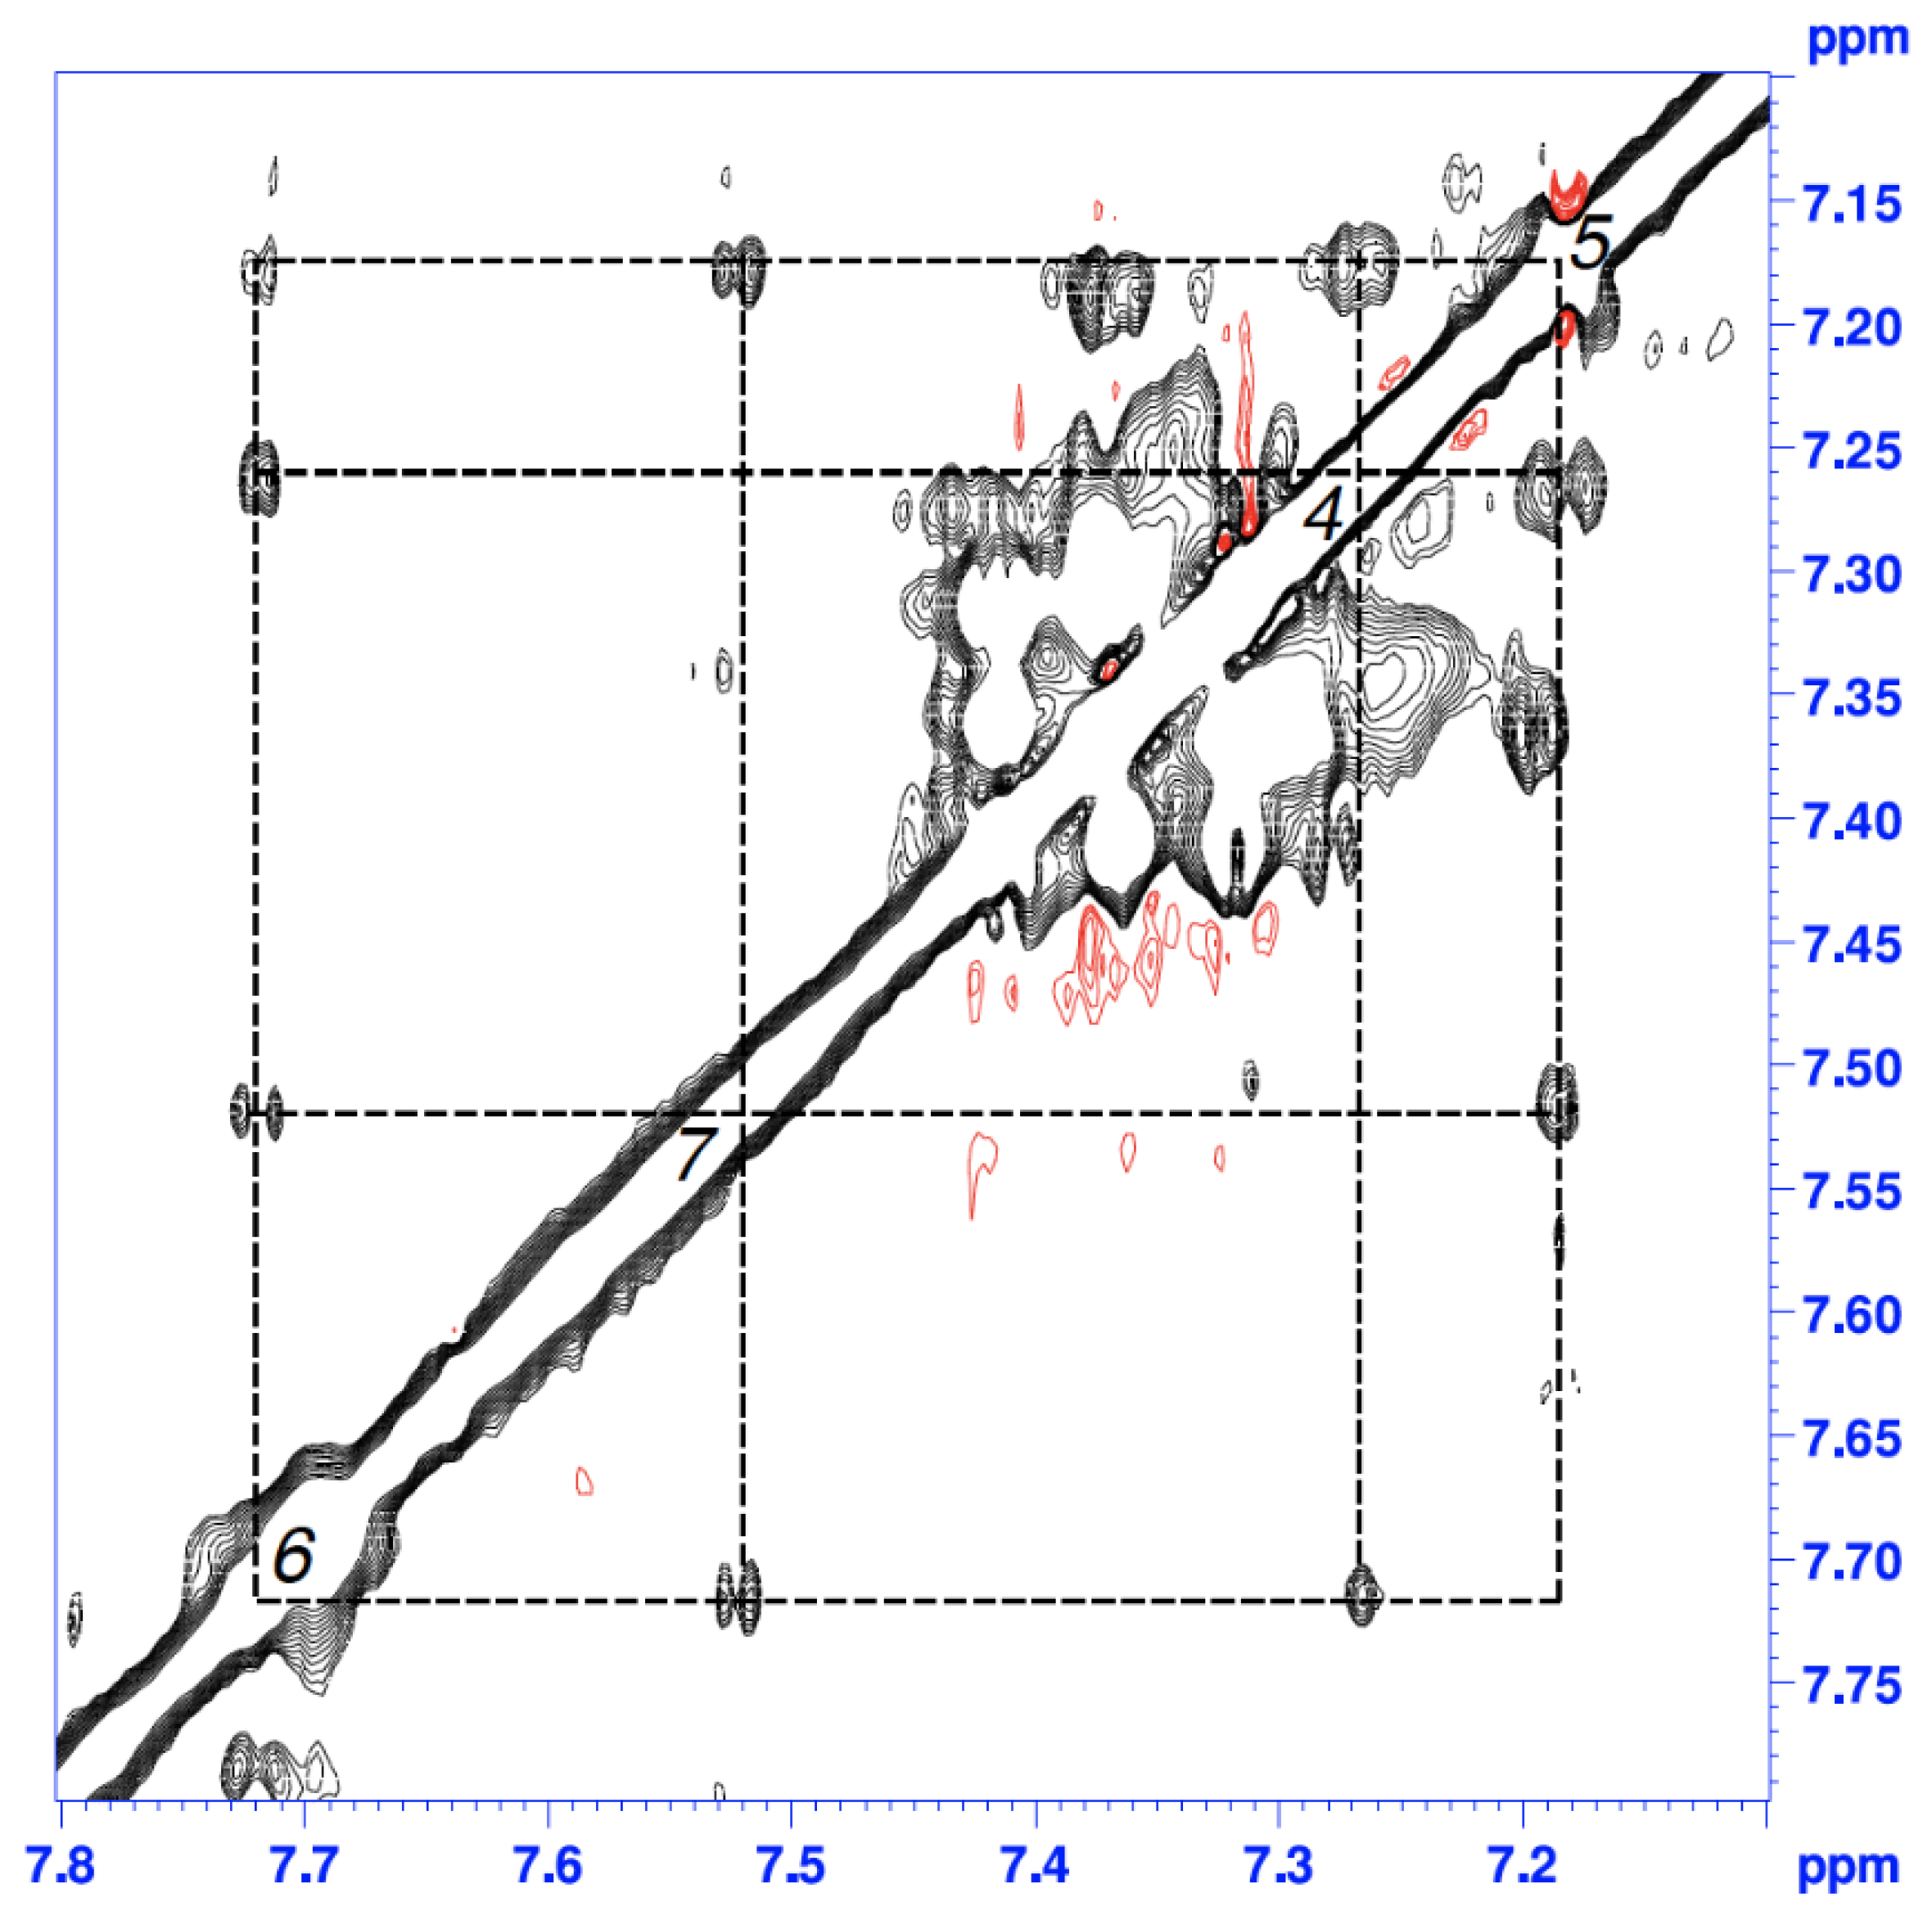
As discussed previously, beer is a complex sample and capable of inducing matrix effects. We have observed the same, nevertheless, we did manage to create a molecular network that putatively identifies the indoles in beer (Figure 1).
The generated uncurated network contained 74 nodes and 663 edges. The 17 nodes of the subnetwork that contained tryptophan were isolated, and the 4 unannotated nodes were filtered off. GNPS lists the names of the metabolites as they are stated in the library from which the metabolite was tagged. This means the names of the metabolites vary based on the library source. This was manually edited, so the nomenclature remained coherent. For example, “(S)-2-Amino-3-(3-indolyl)propionic acid” was changed to “Tryptophan”.
Notably, Mørk mumme is the only beer in which tryptophan was putatively annotated. Kynurenic acid and indole-3-acetamide are both tryptophan metabolites [28] and are thus likely correctly annotated. Kynurenic acid has also previously been observed in beer [28] but to our knowledge, this is the first observation of indole-3-acetamide in beer. In addition to indoles, we also observed flavonoids such as myricetin and kaempferol that have also been previously detected in beer [29]. Amino acids and their derivatives have already been known to exist in beer and therefore their presence in the network further verifies the previously published results [6,19].
In this network, we have not taken into account the formation of different adducts as it accurately annotates some of the features. Tryptophan creates a network with other indoles which shows that molecular networking can be used for future analyses of beer and likely also for other groups of compounds. The putative identification of flavonoids demonstrates that molecular networking can aid the elucidation of the chemical space of beer, which in turn could be useful for the organoleptic engineering of beer.
Not shown in the network are four unannotated nodes. These nodes could be artifacts of a matrix effect or similar sources of inaccuracy, or they could be chemicals with no entry in the utilized databases or fragmentation patterns that differs from the databases’. In this way, molecular networks have the advantage over traditional MS/MS analysis, in that the structure is likely similar to the connected nodes. This also exemplifies the potential use of molecular networks in drug discovery, as the identification and mapping of metabolites in beer have been shown to potentially aid the discovery and/or development of novel drugs [30,31].
The uncurated network has relatively few nodes, which increases the likelihood of correct putative identification meaning that the network is not exhaustive. We have used a relatively short runtime and few top N ions in the data-dependent acquisition to show that it is possible to perform these experiments quickly and with little sample preparation, but increasing the runtime and the number of top N ions could provide larger molecular networks, which would require additional curation by computational methods. The small size of the presented network allowed for manual curation, which would not be a possibility for larger networks.

3.2. NMR Analysis

To confirm the presence of indoles we have acquired a TOCSY NMR (Figure 2) spectrum showing carbons 4–7 on the indole ring, which verifies the presence of indoles in beer.
To obtain an estimate of the indole content, we have used the indole NMR signals associated with the indole group of tryptophan as a representative of the total indole content (Table 3).
Two beers were found to contain no tryptophan at all: the wheat beer Nordisk hvede and the Brown ale, both from Theodor Schiøtz Brewing Co. The concentration of indoles is generally higher in Ribe Bryghus beers compared to beers from Theodor Schiøtz Brewing Co., with mean concentrations of 43 and 102 μM, respectively, irrespective of beer type. This is consistent with previously reported observations as the raw materials and the style of brewing have been proposed as the main contributors to the amino acid content, factors that are more likely to be similar within the same brewery [18]. There is no apparent correlation between the color of the beer and the concentration of indoles.

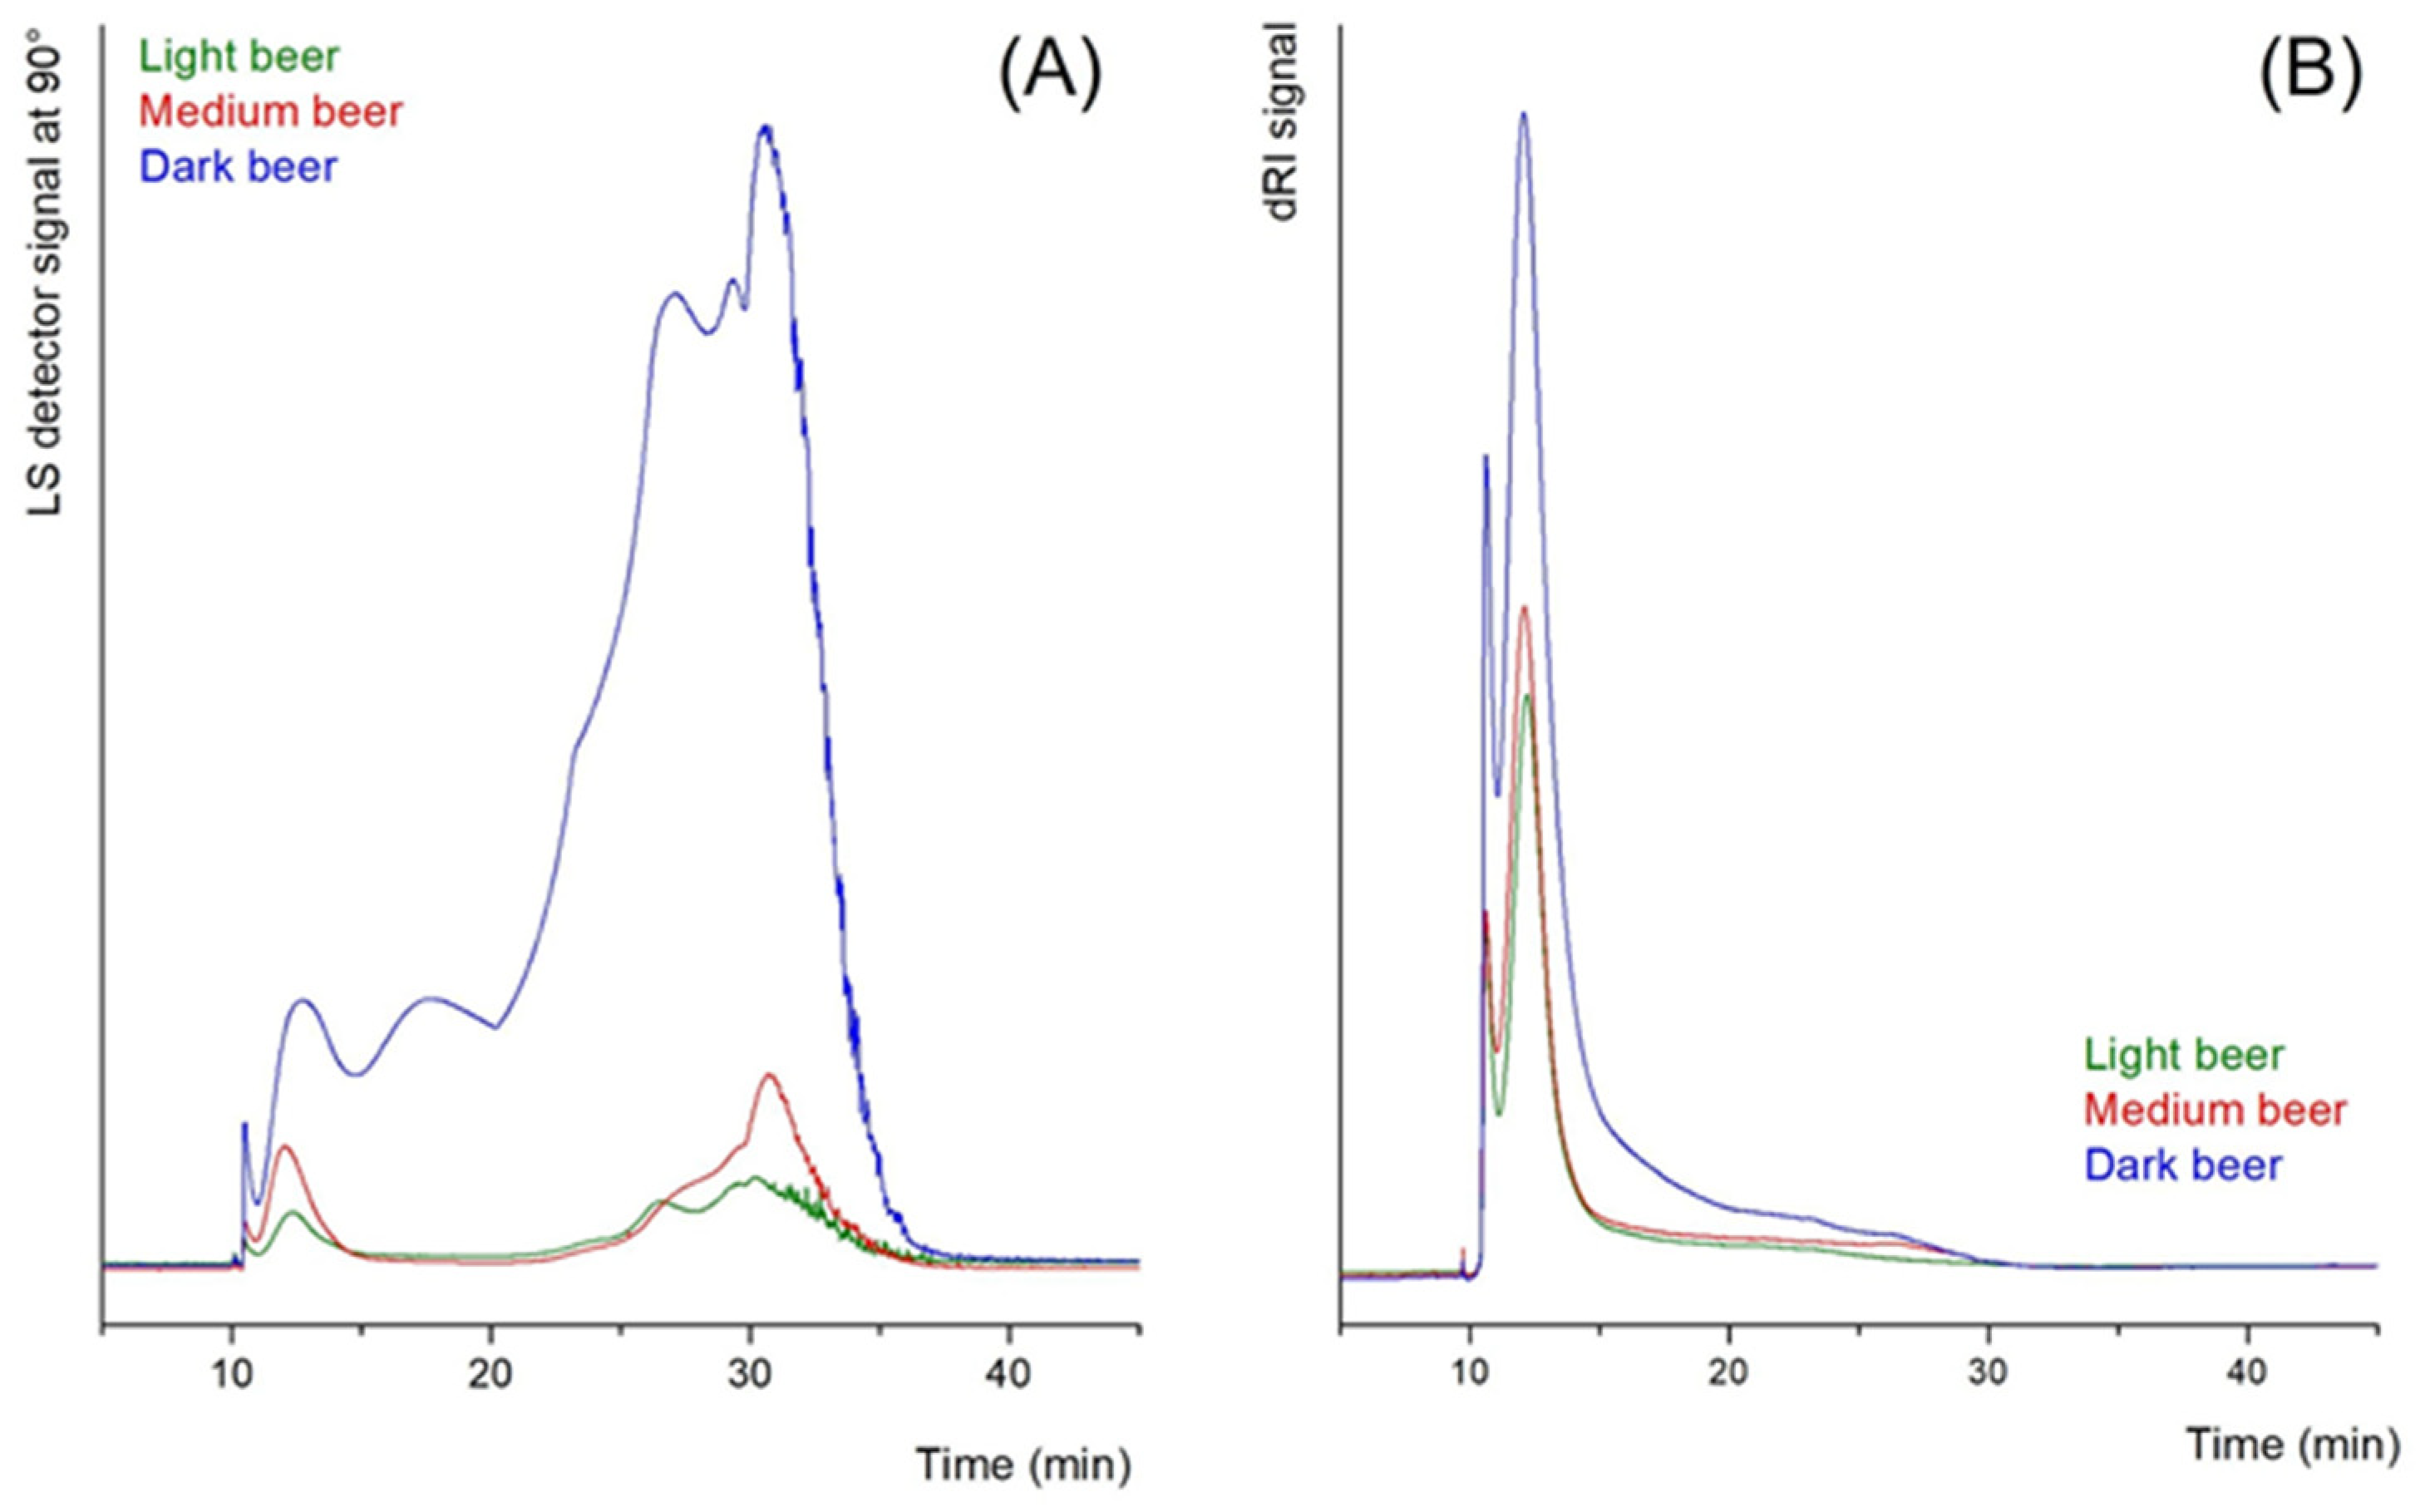
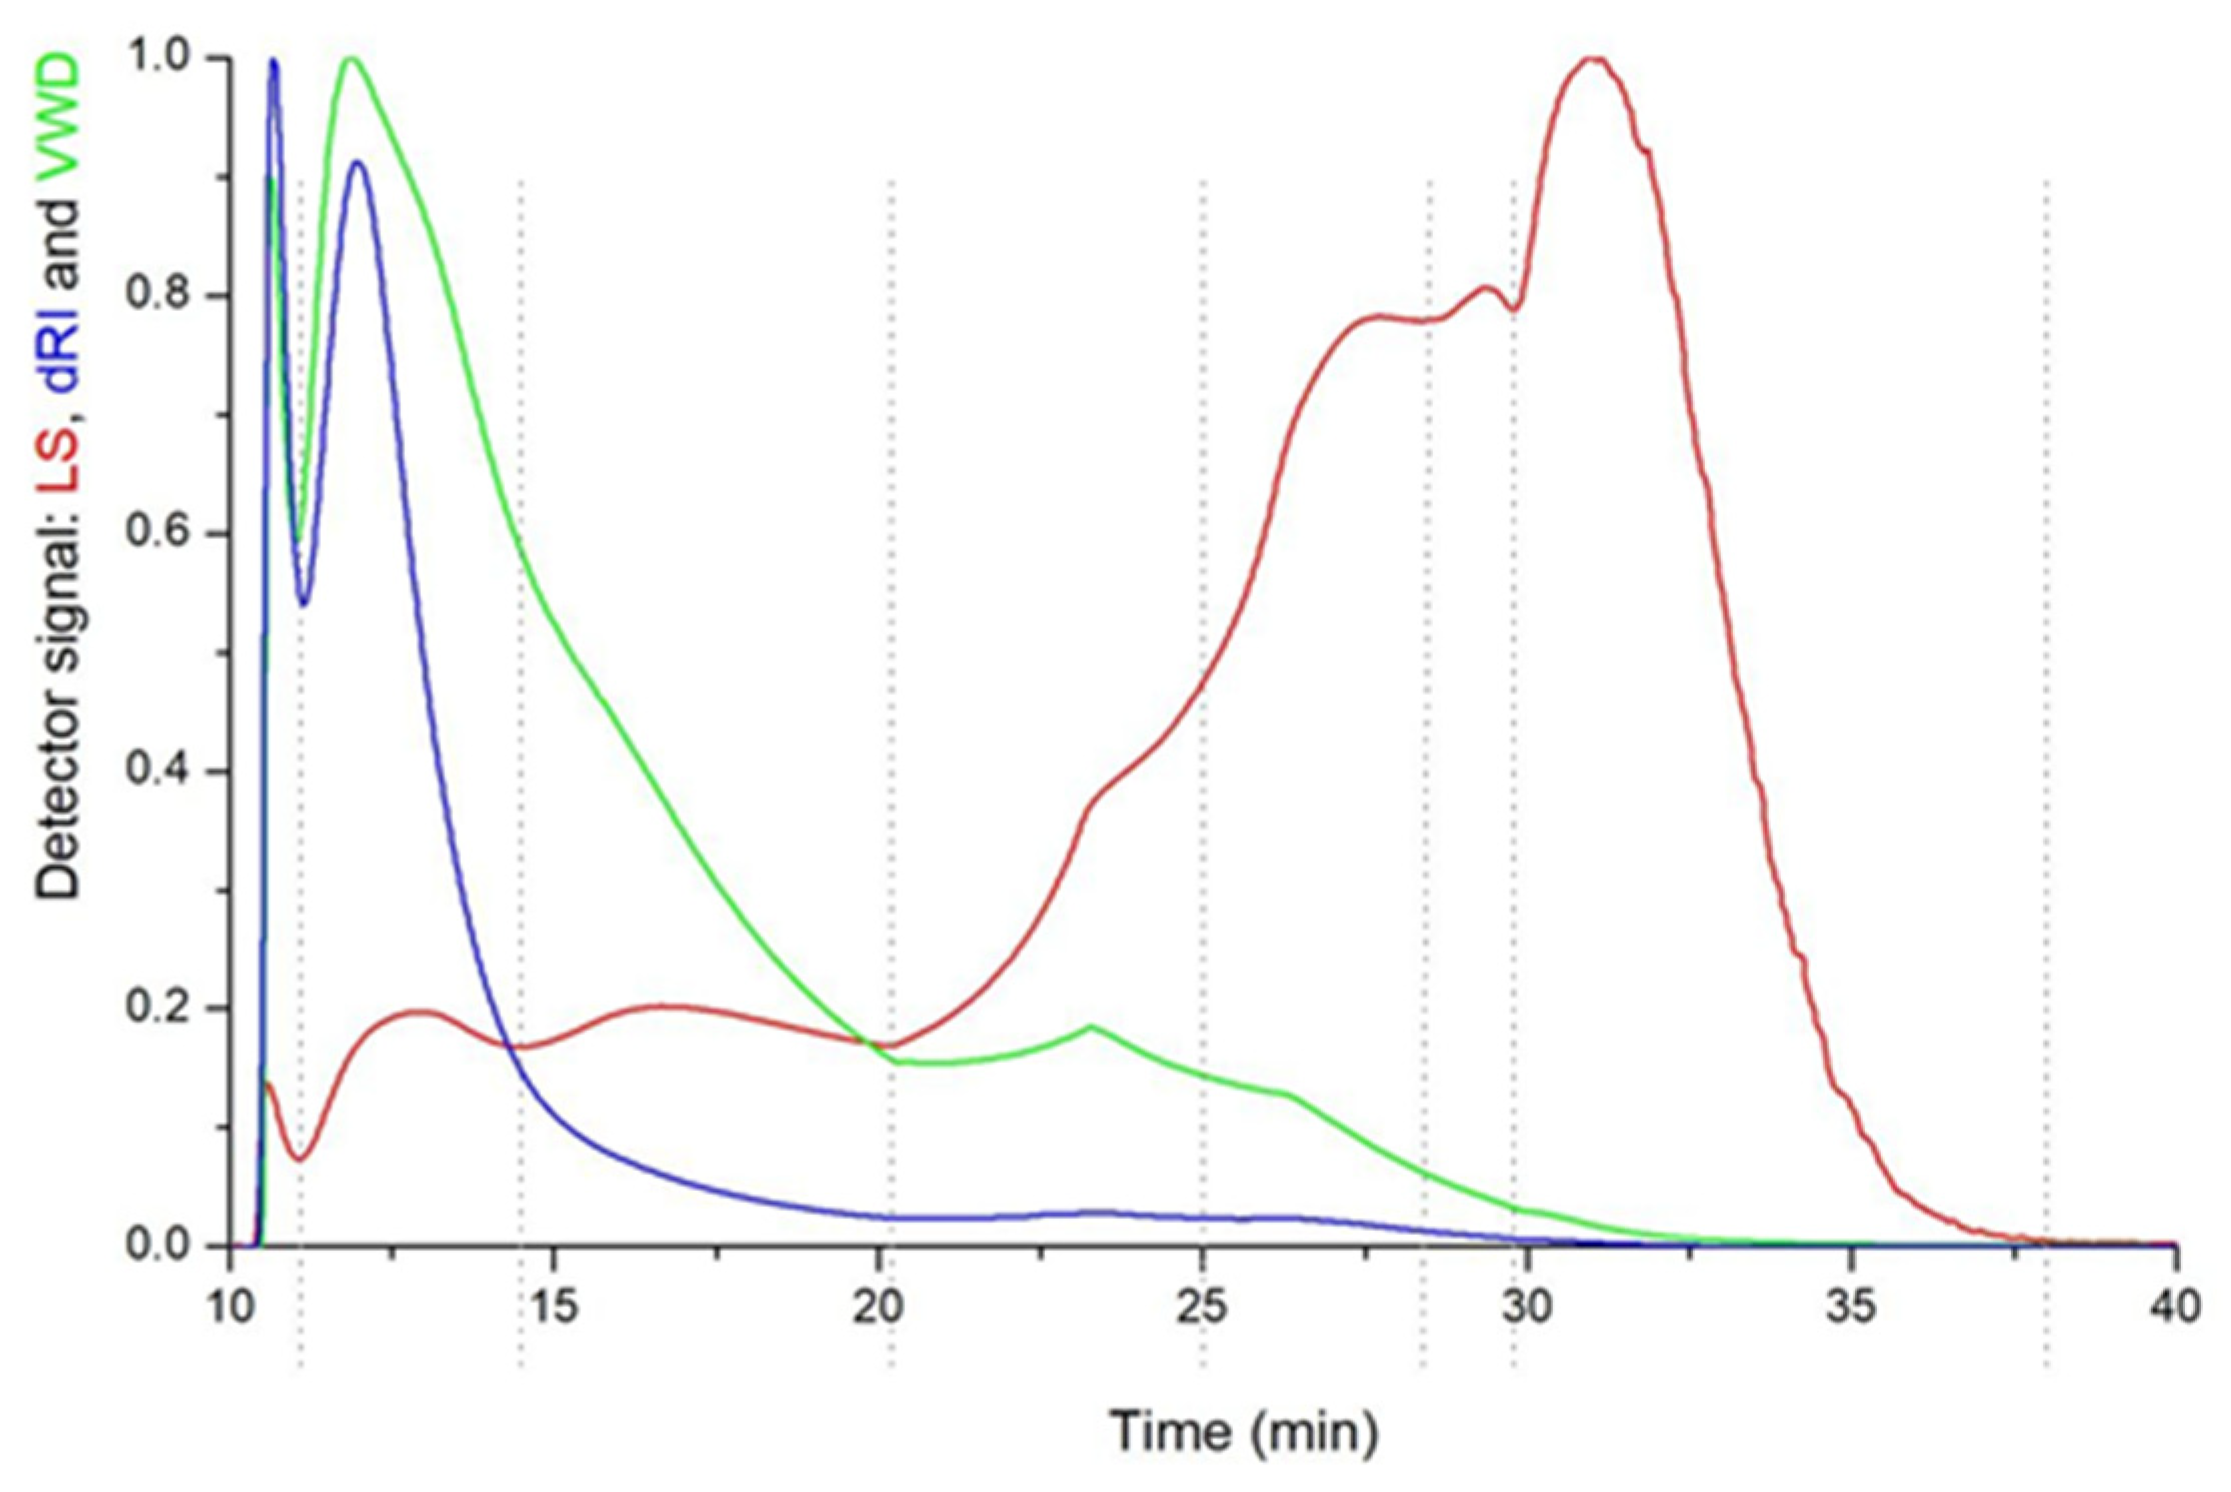
3.3. Macromolecular Analysis by AF4-MALS

Samples from three selected beers [light (Holbæk Pilsner), medium (Vikingebryg), and dark (Dybsort porter)] were analyzed by AF4/MALS and the representative elution profiles are shown in Figure 3.
In all three beers, one fraction eluted between 11 and 15 min and another between 25 and 38 min. According to literature, the first fraction is likely proteins and low-Mw β-glucans and the second one is likely high-Mw β-glucans [23,24]. Due to the lack of, or very weak, dRI detector signals, molar masses could not satisfactorily be determined in fraction 2 and the particle mode (analyzing only the angle-dependent light scattering) was applied instead. The results of the AF4/MALS analysis are summarized in Table 4.
In dark beer, the elution profile was more complex (presence of an additional fraction between 15 and 20 min, Figure 3) and all fractions had much higher intensities (Figure 3). The dark beer was therefore submitted for further analysis and the beer was also injected directly without dilution.
Based on the signals of all three detectors (light scattering, absorbance, and refractive index), six fractions could clearly be distinguished in dark beer (Figure 4). The results of the measurements are summarized in Table 5.
The fractions cover a very broad size range from a few nm (about 30 kDa in Mw) up to 200–300 nm in diameter (last fraction). The first two fractions are most predominant with considerably higher molecular concentrations of about 8 mg/mL and 2 mg/mL in the beer. Comparing the dark beer with the light and medium beers, it is interesting to note the absence of the fraction between 15 and 20 min in the light and medium beer. It could thus be possible that these molecules are characteristic of dark beer. However, a chemical analysis would be necessary for further interpretation of the results and to evaluate the importance of the detected differences in the colloidal structures on beer quality.

4. Conclusions

We have shown that LC-MS-based molecular networking can be utilized to putatively identify both known and previously unidentified indoles in beer and have suggested that this method can be applied to other chemical groups as well. Although the generated network was small in size, we propose that an optimized high-resolution LC-MS/MS method and additional cheminformatic analysis and curation could result in a larger network. We believe that these fuller networks could have potential in the organoleptic engineering of beer and possibly also in the field of drug discovery.
To verify the presence of indoles in beer, we utilized NMR. Here, our results show that beers contain an estimated 0–170 μM of indoles, with an indole content that varies between breweries. This exemplifies how the metabolic signature of beer may vary between breweries. Similar results have also previously been reported [18].
In addition, we have performed AF4-MALS to identify the colloidal fractions of beer. Here, we have discovered clear differences between light and dark beer, with dark beer having a more complex profile. Additional chemical analysis is needed to determine the effects of the specific colloids on the organoleptic properties of beer.
Although our research is preliminary, it lays the foundation for the further analysis of beer components using state-of-the-art methods. More extensive molecular networks and chemical analysis of colloidal fractions could provide an insight into the chemical composition of beer, with potential utility in the brewing and pharmaceutical industries.

Author Contributions

Conceptualization, B.K.P., M.M.K.N., S.S.H., H.J., C.U.N. and J.K.; methodology, M.M.K.N., B.K.P., S.S.H., J.K. and A.M.; software, M.M.K.N.; formal analysis, M.M.K.N., B.K.P., J.K. and A.M.; investigation, S.S.H., M.M.K.N., A.M. and J.K.; resources, C.U.N., B.K.P., J.K. and A.M.; data curation, M.M.K.N., A.M., S.S.H. and J.K.; writing—original draft preparation, M.M.K.N., J.K., A.M. and B.K.P.; writing—review and editing, M.M.K.N., B.K.P., J.K., A.M. and C.U.N.; visualization, M.M.K.N., A.M., S.S.H. and J.K.; supervision, B.K.P., J.K. and C.U.N. All authors have read and agreed to the published version of the manuscript.

Funding

This research received no external funding.

Institutional Review Board Statement

Not applicable.

Informed Consent Statement

Not applicable.

Data Availability Statement

The full, uncurated, molecular network can be retrieved at https://gnps.ucsd.edu/ProteoSAFe/status.jsp?task=978c630557b94eddaaf8fedcbea12e64 (accessed on 20 December 2021).

Acknowledgments

The authors wish to acknowledge Rasmus Voersa Jonsbo, Carl Peter Vittrup Petersen, and Nicklas Christoffersen Fogh for the donation of the beers used in the analysis. The authors also wish to thank Simon Meski for his assistance in reviewing the manuscript.

Conflicts of Interest

The authors declare no conflict of interest.

References

  1. Dabija, A.; Ciocan, M.E.; Chetrariu, A.; Codină, G.G. Buckwheat and Amaranth as Raw Materials for Brewing, a Review. Plants 2022, 11, 756. [Google Scholar] [CrossRef]
  2. Pieczonka, S.A.; Paravicini, S.; Rychlik, M.; Schmitt-Kopplin, P. On the Trail of the German Purity Law: Distinguishing the Metabolic Signatures of Wheat, Corn and Rice in Beer. Front. Chem. 2021, 9, 715372. [Google Scholar] [CrossRef] [PubMed]
  3. Zhu, L.; Hu, Z.; Gamez, G.; Law, W.S.; Chen, H.; Yang, S.; Chingin, K.; Balabin, R.M.; Wang, R.; Zhang, T.; et al. Simultaneous sampling of volatile and non-volatile analytes in beer for fast fingerprinting by extractive electrospray ionization mass spectrometry. Anal. Bioanal. Chem. 2010, 398, 405–413. [Google Scholar] [CrossRef] [PubMed] [Green Version]
  4. Humia, B.V.; Santos, K.S.; Barbosa, A.M.; Sawata, M.; Mendonça, M.d.C.; Padilha, F.F. Beer Molecules and Its Sensory and Biological Properties: A Review. Molecules 2019, 24, 1586. [Google Scholar] [CrossRef] [PubMed] [Green Version]
  5. Guo, C.; Guo, Z.; Chen, Y. A bi-end injection capillary electrophoresis method for simultaneous determination of 37 cations and anions in beers. Anal. Bioanal. Chem. 2019, 411, 4113–4121. [Google Scholar] [CrossRef]
  6. Fontana, M.; Buiatti, S. Amino acids in beer. In Beer in Health and Disease Prevention; Academic Press: Cambridge, MA, USA, 2009; pp. 273–284. [Google Scholar]
  7. Bettenhausen, H.M.; Barr, L.; Broeckling, C.D.; Chaparro, J.M.; Holbrook, C.; Sedin, D.; Heuberger, A.L. Influence of malt source on beer chemistry, flavor, and flavor stability. Food Res. Int. 2018, 113, 487–504. [Google Scholar] [CrossRef]
  8. Byeon, Y.S.; Hong, Y.-S.; Kwak, H.S.; Lim, S.-T.; Kim, S.S. Metabolite profile and antioxidant potential of wheat (Triticum aestivum L.) during malting. Food Chem. 2022, 384, 132443. [Google Scholar] [CrossRef]
  9. Buiatti, S.; Guglielmotti, M.; Passaghe, P. Industrial beer versus craft beer: Definitions and nuances. In Case Studies in the Beer Sector; Woodhead Publishing: Cambridge, MA, USA, 2021; pp. 3–13. [Google Scholar]
  10. Wang, M.; Carver, J.J.; Phelan, V.V.; Sanchez, L.M.; Garg, N.; Peng, Y.; Nguyen, D.D.; Watrous, J.; Kapono, C.A.; Luzzatto-Knaan, T.; et al. Sharing and community curation of mass spectrometry data with Global Natural Products Social Molecular Networking. Nat. Biotechnol. 2016, 34, 828–837. [Google Scholar] [CrossRef] [Green Version]
  11. Cortelo, P.C.; Demarque, D.P.; Dusi, R.G.; Albernaz, L.C.; Braz-Filho, R.; Goncharova, E.I.; Bokesch, H.R.; Gustafson, K.R.; Beutler, J.A.; Espindola, L.S. A Molecular Networking Strategy: High-Throughput Screening and Chemical Analysis of Brazilian Cerrado Plant Extracts against Cancer Cells. Cells 2021, 10, 691. [Google Scholar] [CrossRef]
  12. Vincenti, F.; Montesano, C.; Di Ottavio, F.; Gregori, A.; Compagnone, D.; Sergi, M.; Dorrestein, P. Molecular Networking: A Useful Tool for the Identification of New Psychoactive Substances in Seizures by LC–HRMS. Front. Chem. 2020, 8, 527952. [Google Scholar] [CrossRef]
  13. Hornedo-Ortega, R.; Cerezo, A.B.; Troncoso, A.M.; Garcia-Parrilla, M.C.; Mas, A. Melatonin and Other Tryptophan Metabolites Produced by Yeasts: Implications in Cardiovascular and Neurodegenerative Diseases. Front. Microbiol. 2016, 6, 1565. [Google Scholar] [CrossRef]
  14. Dunn, H.C.; Lindsay, R.C. Evaluation of the Role of Microbial Strecker-Derived Aroma Compounds in Unclean-Type Flavors of Cheddar Cheese. J. Dairy Sci. 1985, 68, 2859–2874. [Google Scholar] [CrossRef]
  15. Soh, N.L.; Walter, G. Tryptophan and depression: Can diet alone be the answer? Acta Neuropsychiatr. 2011, 23, 3–11. [Google Scholar] [CrossRef]
  16. Quesada-Molina, M.; Muñoz-Garach, A.; Tinahones, F.J.; Moreno-Indias, I. A New Perspective on the Health Benefits of Moderate Beer Consumption: Involvement of the Gut Microbiota. Metabolites 2019, 9, 272. [Google Scholar] [CrossRef] [Green Version]
  17. Cavallini, N.; Savorani, F.; Bro, R.; Cocchi, M. A Metabolomic Approach to Beer Characterization. Molecules 2021, 26, 1472. [Google Scholar] [CrossRef]
  18. Jastrzębska, A.; Kowalska, S.; Szłyk, E. Determination of Free Tryptophan in Beer Samples by Capillary Isotachophoretic Method. Food Anal. Methods 2020, 13, 850–862. [Google Scholar] [CrossRef] [Green Version]
  19. Palomino-Vasco, M.; Acedo-Valenzuela, M.I.; Rodríguez-Cáceres, M.I.; Mora-Diez, N. Automated chromatographic method with fluorescent detection to determine biogenic amines and amino acids. Application to craft beer brewing process. J. Chromatogr. A 2019, 1601, 155–163. [Google Scholar] [CrossRef]
  20. Witrick, K.; Pitts, E.R.; O’Keefe, S.F. Analysis of Lambic Beer Volatiles during Aging Using Gas Chromatography–Mass Spectrometry (GCMS) and Gas Chromatography–Olfactometry (GCO). Beverages 2020, 6, 31. [Google Scholar] [CrossRef]
  21. Oladokun, O.; Smart, K.; Cook, D. An improved HPLC method for single-run analysis of the spectrum of hop bittering compounds usually encountered in beers. J. Inst. Brew. 2016, 122, 11–20. [Google Scholar] [CrossRef] [Green Version]
  22. Stensballe, A. Unfiltered beer: A rich source of yeast extracellular vesicles. In Proceedings of the Third International Meeting of ISEV, Rotterdam, The Netherlands, 30 April–3 May 2014; p. 27, No. OP22-121. [Google Scholar]
  23. Choi, J.; Zielke, C.; Nilsson, L.; Lee, S. Characterization of the molar mass distribution of macromolecules in beer for different mashing processes using asymmetric flow field-flow fractionation (AF4) coupled with multiple detectors. Anal. Bioanal. Chem. 2017, 409, 4551–4558. [Google Scholar] [CrossRef]
  24. Krebs, G.; Becker, T.; Gastl, M. Characterization of polymeric substance classes in cereal-based beverages using asymmetrical flow field-flow fractionation with a multi-detection system. Anal. Bioanal. Chem. 2017, 409, 5723–5734. [Google Scholar] [CrossRef]
  25. Vasas, M.; Tang, F.; Hatzakis, E. Application of NMR and Chemometrics for the Profiling and Classification of Ale and Lager American Craft Beer. Foods 2021, 10, 807. [Google Scholar] [CrossRef]
  26. Hughes, S.S.; Nielsen, M.M.K.; Jonsbo, R.V.; Nielsen, C.U.; Lauritsen, F.R.; Prabhala, B.K. BeerMIMS: Exploring the Use of Membrane-Inlet Mass Spectrometry (MIMS) Coupled to KNIME for the Characterization of Danish Beers. Eur. J. Mass Spectrom. 2021, 27, 266–271. [Google Scholar] [CrossRef]
  27. Shannon, P.; Markiel, A.; Ozier, O.; Baliga, N.S.; Wang, J.T.; Ramage, D.; Amin, N.; Schwikowski, B.; Ideker, T. Cytoscape: A Software Environment for Integrated Models of Biomolecular Interaction Networks. Genome Res. 2003, 13, 2498–2504. [Google Scholar] [CrossRef]
  28. Turska, M.; Rutyna, R.; Paluszkiewicz, M.; Terlecka, P.; Dobrowolski, A.; Pelak, J.; Turski, M.P.; Muszyńska, B.; Dabrowski, W.; Kocki, T.; et al. Presence of kynurenic acid in alcoholic beverages—Is this good news, or bad news? Med. Hypotheses 2019, 122, 200–205. [Google Scholar] [CrossRef]
  29. Gouvinhas, I.; Breda, C.; Barros, A.I. Characterization and Discrimination of Commercial Portuguese Beers Based on Phenolic Composition and Antioxidant Capacity. Foods 2021, 10, 1144. [Google Scholar] [CrossRef]
  30. Urban, J.; Dahlberg, C.J.; Carroll, B.J.; Kaminsky, W. Absolute Configuration of Beer′s Bitter Compounds. Angew. Chem. Int. Ed. 2013, 52, 1553–1555. [Google Scholar] [CrossRef] [Green Version]
  31. Sommer, T.; Hübner, H.; El Kerdawy, A.; Gmeiner, P.; Pischetsrieder, M.; Clark, T. Identification of the Beer Component Hordenine as Food-Derived Dopamine D2 Receptor Agonist by Virtual Screening a 3D Compound Database. Sci. Rep. 2017, 7, 44201. [Google Scholar] [CrossRef] [Green Version]
Figure 1. Curated molecular subnetwork containing tryptophan, as generated from different beer samples.
Beverages 08 00035 g001
Figure 2. TOCSY spectra of Dybsort porter beer showing the indole signals. Numbers in italics refer to the position in the indole ring.
Beverages 08 00035 g002
Figure 3. Elution profiles of the different beer samples (1:1 dilution, injection volume 50 µL): Light scattering at 90° (A) and dRI (B) signals.
Beverages 08 00035 g003
Figure 4. Representative elution profile of dark beer together with the peak settings. Detector signals: red—light scattering at 90°, green—absorbance at 280 nm, and blue—differential refractive index.
Beverages 08 00035 g004
Table 1. Overview of the beers used in the study.
BrandTypeColorBrewery
Holbæk pilsnerPilsnerLightHolbæk Bryghus
RemisePilsnerLightRibe Bryghus
VadehavsbrygPilsnerMediumRibe Bryghus
VikingebrygBockMediumRibe Bryghus
PorterPorterDarkRibe Bryghus
Dybsort porterPorterDarkRibe Bryghus
Nordisk hvedeWheatLightTheodor Schiøtz Brewing Co
Gylden IPAIPAMediumTheodor Schiøtz Brewing Co
Brown aleBrown aleDarkTheodor Schiøtz Brewing Co
Mørk mummeBrown aleDarkTheodor Schiøtz Brewing Co
Table 2. The relevant LC and MS parameters for the apparatuses and the utilized method.
LC Parameters
HPLC systemWaters 2695 separations module
Analytical columnWaters Spherisorb ODS-2, C-18 column (15 cm, 3 µm, 4.6 mm)
Mobile phase A5% acetonitrile, 95% water, 0.1% formic acid (v/v)
Mobile phase B95% acetonitrile, 5% water, 0.1% formic acid (v/v)
Injection volume5 µL
Column temperature40 °C
Flow rate0.3 mL/min
MS Parameters
MS systemWaters Q-TOF Premier
SourceStandard ESI (positive ionization)
Source temperature95 °C
Desolvation temperature250 °C
Desolvation gas (nitrogen) flow rate400 L/h
Cone gas (nitrogen) flow rate95 L/h
Backing gas pressure3 mbar
Collision gas (nitrogen) flow rate21 mL/h
Collision cell pressure4 nbar
Ion guide gas (nitrogen) flow rate1 L/h
Capillary voltage2.7 kV
Sampling cone voltage61 V
Extraction cone voltage106.5 V
MS scan time1 s
MS/MS scan time1 s
Interscan delay0.1 s
Collision energy ramp5–40 V
m/z range100–1000 m/z
Table 3. Quantitative estimate of indoles in Danish beers based on NMR.
BrandBreweryIndoles (μM)
Holbæk pilsnerHolbæk Bryghus69
RemiseRibe Bryghus111
VadehavsbrygRibe Bryghus170
VikingebrygRibe Bryghus37
PorterRibe Bryghus61
Dybsort porterRibe Bryghus131
Nordisk hvedeTheodor Schiøtz Brewing Co0
Bohemian pilsnerTheodor Schiøtz Brewing Co85
Gylden IPATheodor Schiøtz Brewing Co63
Brown aleTheodor Schiøtz Brewing Co0
Mørk mummeTheodor Schiøtz Brewing Co24
Table 4. Summary of AF4 results for fraction 1 and fraction 2 in the different diluted beer samples. Values present the average and standard deviation of 3 or 6 (*) measurements. n.d. = not determined.
ColorInjection Volume (µL)Fraction 1 (11–15 min)Fraction 2 (25–38 min)
c (mg/mL)Mw (kDa)PI(Mw/Mn)rz (nm)rw (nm)
Light503.4 ± 0.49.4 ± 0.61.12 ± 0.02n.d.n.d.
1005.1 ± 0.48.1 ± 0.61.21 ± 0.01164 ± 1856 ± 3
Medium504.1 ± 0.117.8 ± 0.51.04 ± 0.00n.d.n.d.
1005.1 ± 0.116.7 ± 0.41.09 ± 0.00122 ± 250 ± 5
ark50 *8.0 ± 0.530.7 ± 2.21.34 ± 0.04n.d.n.d.
10010.3 ± 0.427.5 ± 0.81.47 ± 0.03110 ± 336 ± 3
Table 5. Results of analysis of dark beer (50 µL original and 100 µL 1:1 diluted sample measured each in triplicate). Values are given as average and standard deviation of all measurements (n = 6). Note that different peak settings have been applied compared to the values given in Table 4. n.d. = not determined.
Peak 1Peak 2Peak 3Peak 4Peak 5Peak 6
Limits (min)11.1–14.514.5–20.220.2–2525–28.428.4 + 29.829.8–38
c (mg/mL)8.3 ± 0.21.9 ± 0.10.7 ± 0.10.4 ± 0.00.1 ± 0.0n.d.
Mw (kDa)29.7 ± 1.1240.2 ± 12.8821.2 ± 71.02681 ± 1477216 ± 685n.d.
Mn (kDa)23.4 ± 1.1195.9 ± 7.6726.2 ± 71.52377 ± 1316921 ± 607n.d.
PI (Mw/Mn)1.27 ± 0.021.23 ± 0.021.13 ± 0.011.13 ± 0.001.04 ± 1.01n.d.
Rz (nm)n.d.n.d.n.d.19.5 ± 0.334.4 ± 0.2132.8 ± 1.4
Rw (nm)n.d.n.d.n.d.16.9 ± 0.433.6 ± 0.298.92 ± 1.0
Publisher’s Note: MDPI stays neutral with regard to jurisdictional claims in published maps and institutional affiliations.

