Article

Kavalactones and Flavokavins Profiles Contribute to Quality Assessment of Kava (Piper methysticum G. Forst.), the Traditional Beverage of the Pacific

1
Centre de Coopération Internationale en Recherche Agronomique pour le Développement (CIRAD), Amélioration Génétique et Adaptation des Plantes (AGAP), P.O. Box 946 Port-Vila, Vanuatu
2
CNRS UMR 5557 & INRA UMR 1418, Université de Lyon, F-69622 Villeurbanne, France
*
Author to whom correspondence should be addressed.
Beverages 2019, 5(2), 34; https://doi.org/10.3390/beverages5020034
Submission received: 18 January 2019 / Revised: 8 March 2019 / Accepted: 1 April 2019 / Published: 2 May 2019

Abstract

:
Kava (Piper methysticum) is increasingly traded internationally and there is need for a rapid method to analyze kava raw material before export. The objectives of the present study were: (i) to develop a simple and robust protocol for high throughput simultaneous quantification of kavalactones (KLs) and flavokavins (FKs) in kava and (ii) to assess its potential for quality control. Methysticin; dihydromethysticin; kavain; desmethoxyyangonin; dihydrokavain; yangonin; and flavokavin A, B and C were quantified using HPTLC in acetonic extracts of 174 kava varieties. UHPLC analysis was conducted on a subset of six varieties representing the genetic variation of the species. The genetically distinct groups of nobles, two-day and wichmannii varieties were clearly differentiated and multivariate analyses of UHPLC and HPTLC data were congruent. Noble varieties have significantly low FKs/KLs (0.13) and high kavain/flavokavin B (K/FKB = 7.31). Two-day and wichmannii varieties are characterized by high FKs/KLs (0.36, 0.21) and low K/FKB (1.5, 1.7). A high-throughput HPTLC protocol was developed with a total analytical time of 50 min for 20 samples and only 10 mL of mobile phase. The use of acetone, sonication and two different detection wavelengths improves the accuracy compared to previous HPLC studies and confirms that kava varieties exhibit distinct chemotypes clearly differentiated by their FKs/KLs profiles. These results will strengthen the use of Codex Alimentarius regional standards.

1. Introduction

Piper methysticum G. Forst. (Piperaceae) rhizomes and roots are peeled, grinded, macerated in cold water, and pressed through a cloth strainer to prepare kava, a non-alcoholic beverage. In the Pacific Islands, it is consumed on a daily basis for social purposes, at home or in urban kava bars. During the last two decades, it has become more widely used as a recreational beverage by the international community, and it is appreciated for the relaxing and anxiety-relieving properties of its active ingredients called kavalactones [1]. The two major producers are Fiji and Vanuatu and it is estimated that around 4000 ha are harvested every year to satisfy a regional market of approximately 6000 tons (dry weight) per year [2]. In the Pacific, kava is considered to be a safe beverage and no evidence of harm is observed among regular drinkers. In Europe, kava has been used as raw material by the pharmaceutical industry to prepare acetonic or ethanol extracts, and in 2002, kava-based products were suspected of hepatotoxicity and banned by the German health authorities (BfArM). The German ban has been contested because of the poor evidence of risks associated to kava extracts and two German administrative court decisions concluded in 2015 that the ban was inappropriate [3]. However, a concern regarding kava stems not only from Germany, but is worldwide (e.g., FDA issued warnings). Kava extract is also considered by the International Agency for Research on Cancer (IARC) as group 2B, which is possibly carcinogenic to humans, but this classification applies to the extract and not the traditional beverage stricto sensu [4].
The composition and quality of kava can be highly variable, depending on the age of the plant, the variety, and the part used to prepare the beverage: roots, rhizomes or basal stems. In Vanuatu, the “Kava Act” was passed in Parliament in 2002 to regulate the industry. Based on traditional knowledge, this Act stipulates that only “noble” varieties locally known for their pleasant effect and being harmless for daily consumption must be used, while “wild kava” (P. methysticum var. wichmannii) and “two-day” varieties, known for their lasting effect causing nausea and hangover, are illegal [5]. DNA markers studies have shown that these varieties correspond to three distinct groups of genotypes [6].
The six major kavalactones (KLs: yangonin = Y, dihydrokavain = DHK, desmethoxyyangonin = DMY, kavain = K, dihydromethysticin = DHM and methysticin = M) are responsible for the physiological effect and are usually quantified with HPLC [7,8]. There is a second group of molecules, flavokavins (FKs: A, B, C), which has recently attracted attention (Figure 1).
Some studies suggest that FKA and FKB are cytotoxic to cancer cells [9,10,11] and that FKB is a major hepatotoxin in organic kava extracts [12], although others have questioned whether the levels in these extracts are high enough to produce hepatotoxicity [13,14]. FKC has been shown to have the potential to prevent the inflammation process with antioxidant properties [15]. However, when cytotoxicity against human lung adenocarcinoma A549 cancer cells was tested with kava extracts, FKA and FKB were found to be the major but not sole compounds responsible for the extract toxicity while KLs were less likely to be involved [16]. Codex Alimentarius regional quality standards have been developed for kava products for use as a beverage [17].
The chemical composition of the kava extract is strongly influenced by the extraction solvent [18]. Acetone is the most effective solvent in terms of yield of KLs, followed by water whereas chloroform, hexane, methanol, and ethanol are less efficient [19]. Sonication has been shown to improve the solvent extraction efficiency [20]. HPLC protocols are based on ethanol, methanol or chloroform extracts to avoid undesirable compounds in the separation columns [8], but their results are biased by the limited efficiency of these solvents. Another major analytical constraint comes from the different absorption wavelengths maxima of the target substances. M, DHM, K, and DHK are better detected at 240 nm while Y, DMY, FKA, FKB, and FKC are well separated at 355 nm [21,22]. Finally, the natural variation in content and composition within the plant itself is remarkable and it is appropriate to extract sufficient raw material to obtain a fair representation of the variation within the plant tissues [23]. Hence, depending on the analytical protocols, the chemical composition of kava samples can present significant discrepancies.
New analytical techniques capable of identifying the chemical components of the plant are urgently needed [24] now that the international market is expanding rapidly. HPLC and GC protocols have been used for the simultaneous detection of KLs and FKs on a limited number of samples because of the cumbersome and lengthy analytical procedures [20]. HPTLC has been used to detect the three FKs in kava samples [25], but four major KLs were not quantified, including kavain the most important for quality assessment. Due to the increasing consumption, export of unregulated products seems to be increasing and the chemical composition of kava traded internationally varies widely [16]. There is, therefore, a need for a rapid and easily applied method to characterize kava raw material. The objectives of the present study are: (i) to develop a simple and robust protocol for high throughput simultaneous quantification of KLs and FKs in 174 kava acetonic extracts representing the genetic variation of the plant and (ii) to assess its potential for quality control.

2. Materials and Methods

2.1. Plant Materials

Kava varieties analyzed in the present study originated from the germplasm collection of the Vanuatu Agricultural Research and Technical Centre (VARTC) in Santo, Vanuatu (15°23′ S and 166°51′ E, ~80 m above sea level). All plants were clones of local varieties collected throughout the major islands of Vanuatu and were grown in a common field to minimize variation due to environmental factors. Following a previous DNA classification done using SSR and DArT markers [6], accessions were grouped in three genotype clusters): noble (N), two-day (TD) and wichmannii (W) varieties. After harvest, roots and peeled rhizomes were washed by hand under cold running water and cut into small pieces with a knife. Following traditional practices, pieces were sun-dried for 3 days. Dry matter was ground into powder in VARTC, Santo, using a Forplex F00 1218 hammer mill (Boulogne, France) with <2 mm particle size, packed into zip-lock plastic bags and labeled. Powder samples were then sent to the Food Lab (Department of Agriculture and Rural Development, Port-Vila, Efaté, Vanuatu) and stored at room temperature. The samples were ground again into very fine flour using a coffee grinder (SEB, Prep’Line 850, Dijon, France). The kava powder was weighed and dried again for 6 h in an oven at 60 °C.

2.2. Preparation of Extracts and Standards

For each sample, 10 g of powder was transferred to a 50-mL polypropylene centrifuge tube (CellStar Tubes, Greiner Bio-One GmBH, Frickenhausen, Germany) and 30 mL of acetone was added. These tubes were sonicated in a water bath (Lab Companion UC-02, Cole Parmer, Vernon Hills, IL, US) for 30 min and then centrifuged at 4500 rpm for 10 min in a Universal 32 centrifuge (Hettich Zentrifugen, Tuttlingen, Germany). Finally, part of the supernatant was transferred to a 9-mm-wide opening screw thread vial of 2 mL in amber glass (ChromacolTM, Thermo FisherTM, Waltham, MA, USA) and stored in a refrigerator at 4 °C in the dark until analysis.
Methysticin, dihydromethysticin, kavain, dihydrokavain, yangonin, and desmethoyyangonin analytical grade standards were purchased from Sigma–Aldrich (Fluka, France). Flavokavin A, flavokavin B and flavokavin C were purchased from LKT Laboratories Inc. (St. Paul, MN, USA). Standard stock solutions were prepared by dissolving 1.0 mg of pure standard powder in 1.0 mL of acetone. Standard solutions were stored in the dark at 4 °C and were stable for several weeks. Following a previously described protocol [25], peak purity tests were done by comparing UV spectra of the six individual KLs and three FKs in standard and sample tracks. For the determination of the standards linearity curve, different amounts of stock solutions (0.1, 0.2, 0.4, 0.6, 0.8, 1.0 µL) of the six KLs and three FKs were applied on HPTLC plates that were developed and scanned at 240 nm (for M, DHM, K, DHK) and at 355 nm (for Y, DMY, FKA, FKB, FKC).

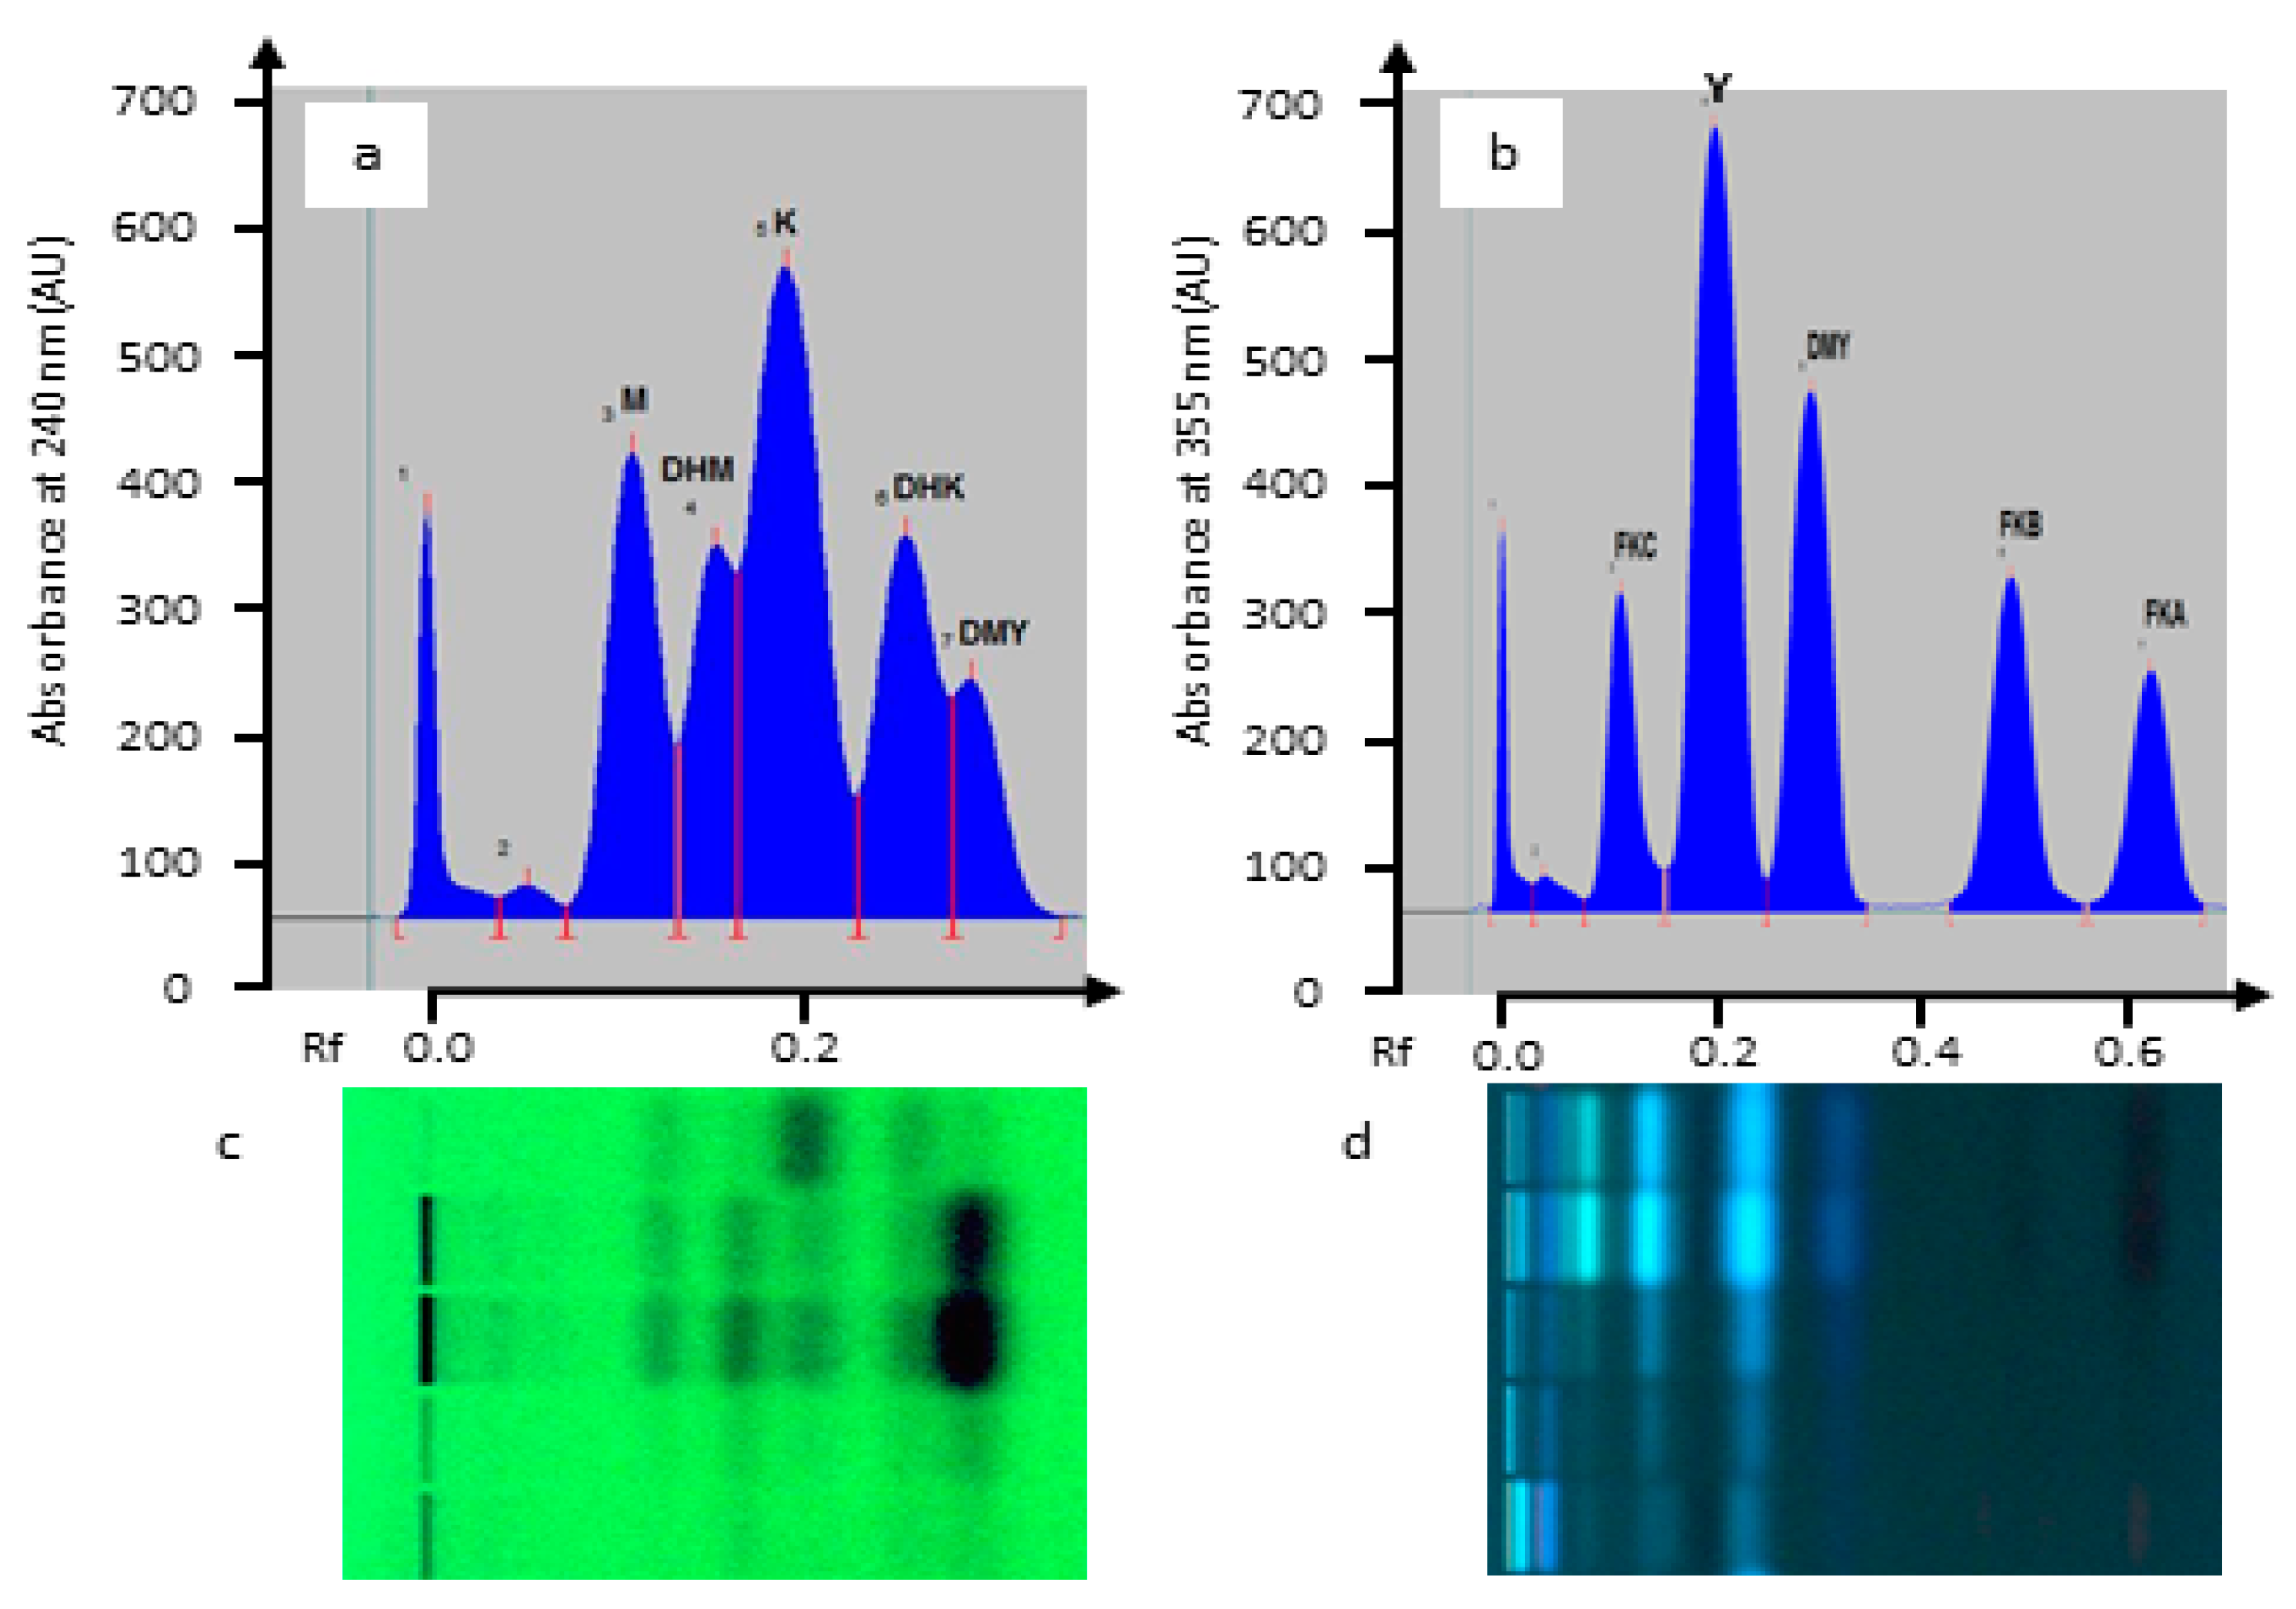
2.3. High Performance Thin Layer Chromatography (HPTLC)

Analytical grade solvents (acetone, dioxane, hexane, and methanol) were from Sigma–Aldrich. All analyses were performed with Merck (Darmstardt, Germany) silica gel 60 F254 plates (20 × 10 cm), using a Camag (Muttenz, Switzerland) HPTLC system equipped with an automatic TLC sampler (ATS 4), an automatic developing chamber (ADC 2), a visualizer, and a TLC scanner 4 controlled with winCATS software (version 1.1.10, CAMAG, Muttenz, Switzerland). Standards and sample solutions were applied as bands (length of 8 mm, 250 nL/s delivery speed, track distance 8.0 mm, and distance from the edge of 15 mm). The 10-mL mobile phase used to develop the plates was hexane:dioxane (8:2 v/v) with a migration distance of 80 mm at room temperature after 30 s of pre-drying and no tank saturation. Visual documentation of the plates was carried out at 254 nm and 366 nm. The plates were then scanned in reflectance mode at 240 nm (for M, DHM, K and DHK) and at 355 nm (for Y, DMY, FKA, FKB, FKC) with D2 and W lamp slit dimension 8.00 mm × 0.20 mm, scanning speed 20 mm/s, and data resolution 100 μm/step. Peak area measurements (in area units, AU) were used. The total analytical time was 50 min for 20 samples and 10 mL of mobile phase (corresponding to 2.5 min and 0.5 mL per sample).

2.4. Ultra High Performance Liquid Chromatography (UHPLC)

To confirm the HPTLC results, LC analysis was conducted on a subset of six varieties representing the genetic diversity of the species (2 accessions of TD, 2 acc. of N, 2 acc. of W). UHPLC-DAD-ESI-MS/MS (Q/TOF) analyses were performed on an Agilent Infinity® 1290 system (Agilent Technologies, Santa Clara, CA, USA) coupled to a UV/vis DAD detector and equipped with a QTOF 6530 detector (Agilent) controlled by MassHunter® software (version B.08.00, Agilent, Santa Clara, CA, USA). Analytic separation was carried out on a Poroshell® 120 EC-C18 column (100 mm × 3.0 mm, 2.7 μm) equipped with a pre-column (Poroshell® 20 EC-C18, 5 mm × 3.0 mm, 2.7 µm). A gradient of 0.4% formic acid in water (A) and acetonitrile (B) was used as follows: 0 min, 1% B; 1.0 min, 1% B; 6 min, 15% B; 12 min, 45% B; 14 min, 100% B; and 16 min, 100% B. The flow rate and column temperature were 0.9 mL min−1 and 60 °C, respectively. A total of 1.0 µL of sample extract was injected. The ESI source was optimized as follows for positive and negative ionization modes (in “Auto MSMS” acquisition mode): scan spectra from m/z 50 to 2000, capillary voltage 3.5 kV, nozzle voltage 2000 V, fragmentor 110 V, and fixed collision-induced dissociation (CID) energy at 20 eV. Nitrogen was used as the nebulizing gas with a flow rate of 12 L min−1 and a temperature of 310 °C at 40 psi. DAD was set at 240 nm and 355 nm. Peaks of the target KLs and FKs were spotted on the MS chromatograms based on their high resolution masses [26] and quantified by integrating manually peak areas at 240 nm (for M, DHM, K and DHK) or 355 nm (for Y, DMY, FKA, FKB, FKC).

2.5. Statistical Analyses

For HPTLC repeatability accuracy assessment, linear ranges were computed using the least squares method. Repeatability was confirmed by applying five repetitions of each standard at five different concentration levels (0.1, 0.2, 0.3, 0.4, and 0.5 µL) and the variance among repetitions was expressed as the repeatability standard deviation (%RSD). The repeatability was assessed over 3 days using the same standard solutions. Peak area measurements (in area units, AU) were compared to individual standards and corresponding values were quantified in mg/g DW. Raw data (peak areas and their transformation in %DW) were recorded using ExcelTM (Microsoft Corporation) spreadsheet format (see Table S1, Supplementary Materials). Statistical analyses were performed using ExcelStat software (Microsoft, Redmond, WA, USA) for linearity curves, normality of distribution tests, and principal components analysis (PCA, Spearman coefficients of correlation, mean standard deviation, and ANOVA Fisher’s test of Least Significant Difference (LSD) at p ≤ 0.05). As the data was not following a normal distribution after being tested with Shapiro-Wilk, Anderson-Darling, Lilliefors, and Jarque-Bora tests (p < 0.0001), non-parametric tests were applied to test the variance (Kruskal-Wallis and Friedman tests for k samples). The quantitative peak areas for nine compounds (variables, 6KLs + 3FKs) were combined with a qualitative variable corresponding to the genotype group defined using DNA markers: N = nobles, TD = two-day, W = wichmannii [6] and the mixed data matrix was analyzed with ExcelStat™ using the factorial analysis of mixed data called PCAmix. This analysis can be seen as a mixture of PCA (Principal Component analysis) and MCA (Multiple Correspondence Analysis) which allows the study of qualitative variables. PCAmix aims at reducing data dimensionality as well as to identify nearness between variables (6 KLs, 3 FKs) and also proximity between the observations (N, TD, W). Finally, Partial Least Square Regression (PLS-R) was used to analyze the contribution of the nine variables to each group of varieties.

3. Results and Discussion

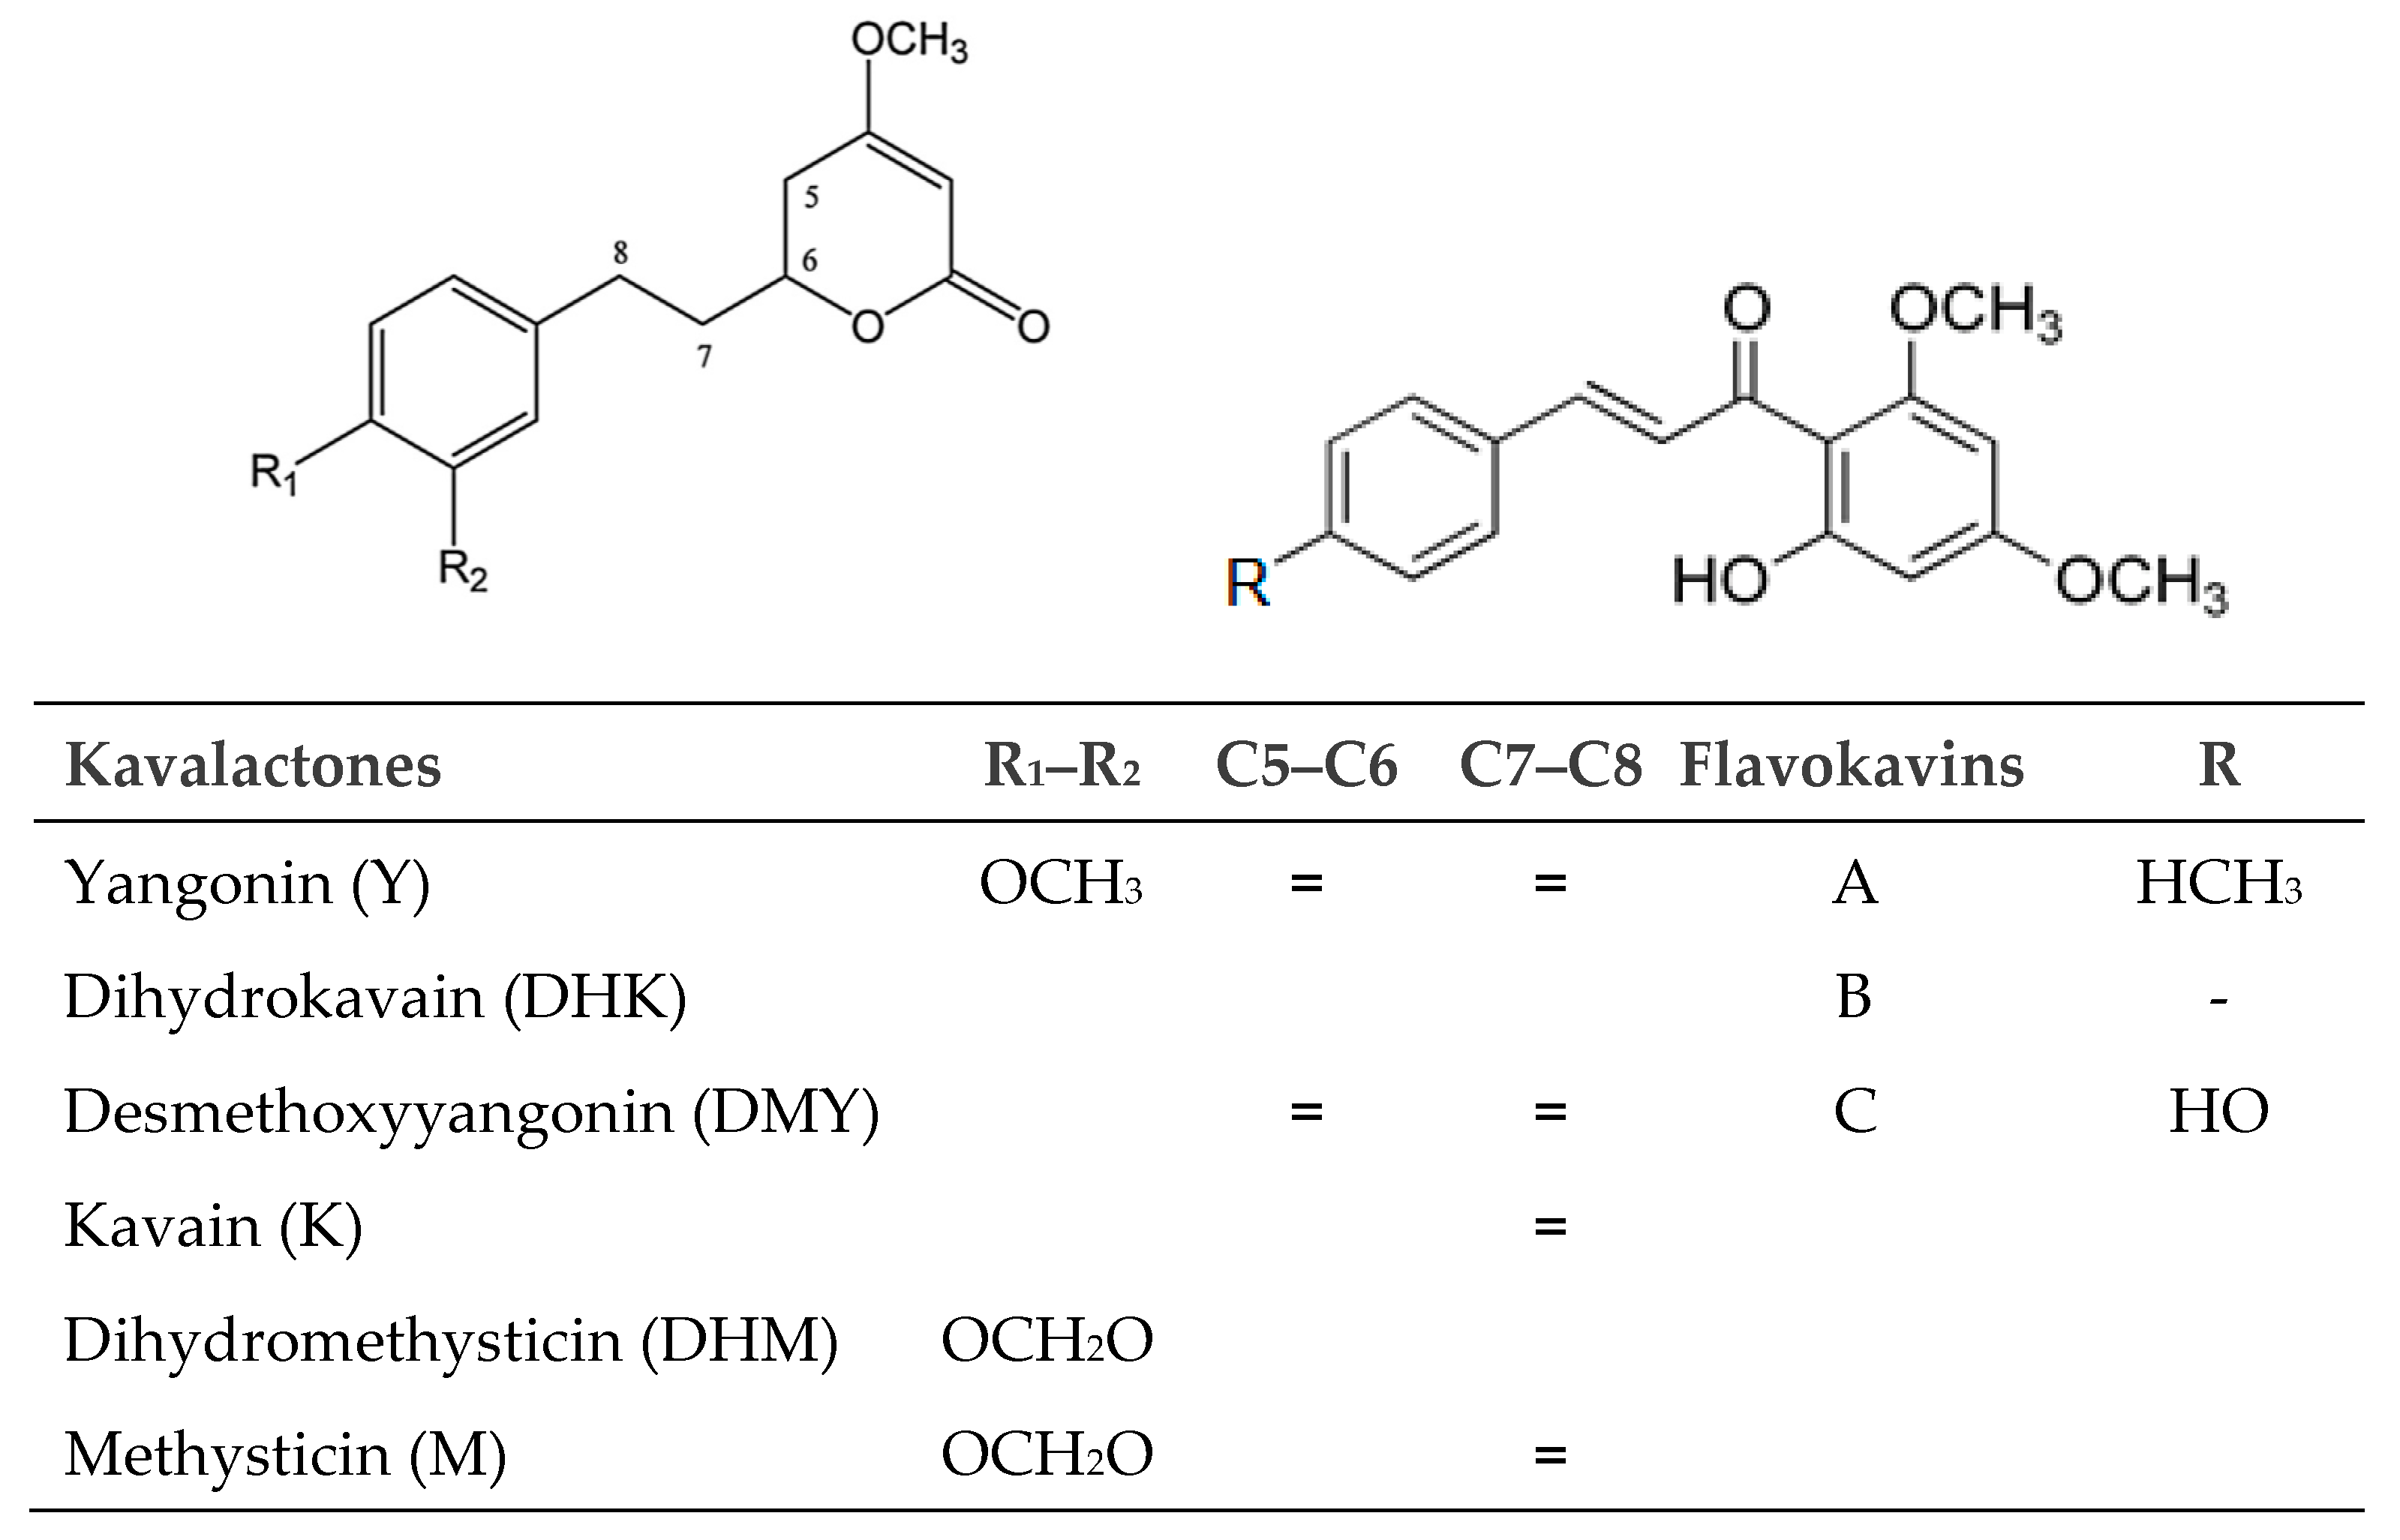
3.1. Quantification of Individual Kavalactones and Flavokavins

The repeatability of the HPTLC measurements was assessed for each individual standard and the calibration plots (peaks areas versus concentrations) are linear for all nine analytical standards with all R2 > 0.99 (p = 0.01). For each compound, %RSD values are low (<3.5%) indicating that the HPTLC measurements are accurate enough to be used for the quantification of the six KLs and the three FKs (Table 1). The nine compounds of interest are easily detected, identified and quantified when scanning the same plate at two different wavelengths: 240 nm for M, DHM, K, and DHK (Figure 2a); and 355 nm for Y, DMY, FKA, B, and C (Figure 2b). At 240 nm, the peaks for DHM and DMY were not clearly separated from K and DHK (Figure 2a). However, DMY produced a clearly separated peak at 355 nm (Figure 2b) and was quantified at this wavelength. DHM was quantified at 240 nm. As DHM is significantly negatively correlated with K (−0.922) [7], the quantification accuracy of DHM improves when the K values decrease. The nine compounds are quantified using the peak areas of the analytical standards. The results (in mg/g DW) are presented in Table 2.
Noble varieties are characterized by high Y and K (37.9, 36.4 mg/g) and very low FKA, B and C (7.6, 6.0, 5.8 mg/g). Two-day varieties have similar values for Y and K (39.4, 37.2 mg/g), with much higher DHK (33.8 vs. 23.5 mg/g) and very high FKA, B and C (24.0, 26.3, 14.3 mg/g). Wichmannii varieties have lower Y and K (28.3, 12.5 mg/g), high DMY (35.5 mg/g) and very high DHM (29.4 mg/g) compared to other groups, with intermediate values for FKA, B and C (7.5, 11.7, 7.9 mg/g) (Table 2). Two-day varieties present a mean total KLs content significantly higher (176.1 mg/g) than nobles (149.9 mg/g) and wichmannii varieties (138.8 mg/g). They also present a mean total FKs content significantly higher (64.7 mg/g) than nobles (19.4 mg/g) and wichmannii varieties (27.2 mg/g). When comparing the percentages of each of the nine compounds to their total in the acetonic extract (total KLs + FKs), it appears that noble varieties are characterized by very high K (21.7%) compared to two-day (15.4%) and wichmannii (8.6%). The use of two ratios clearly differentiates the three groups of varieties. Noble varieties have significantly low FKs/KLs (0.13) and very high K/FKB (7.31). Two-day and wichmannii varieties are characterized by high FKs/KLs (0.36, 0.21) and low K/FKB (1.50, 170). The ratio K/FKB is also highly discriminant (Table 2).
Previous HPLC studies aiming at characterizing kava varieties focused on the six major KLs quantified in chloroform extracts [7]. The results presented here reveal higher total KLs (KLs%DW, Table 2) due to the extraction efficiency of acetone and sonication. The present results also give much higher Y and DMY values, due to the use of a different wavelength (355 nm) for their quantification, rather than the same (240 nm) as used for other metabolites in previous HPLC study [7]. A recent HPLC protocol based on methanol extraction of 0.2 g raw material also confirmed that when these two KLs are quantified using a proper wavelength (355 nm), their values are significantly increased compared to their measurements at 240 nm [22]. Despite these differences due to different analytical protocols, the present results confirm that noble varieties have higher K and this is probably one of the reasons for their appreciated physiological effect. The comparable K, Y and DMY values found in the present study are similar to those reported in diethyl ether extracts with GC-MS and LC-MS analyses [26].
FKs are minor constituents in the kava root, representing only 1.9%DW in noble varieties, but up to 6.5%DW in two-day and 2.7%DW in wichmannii varieties (Table 2). These high levels of FKs in two-day and wichmannii kavas might contribute to the nausea and hangover caused by these varieties, although more research is needed to confirm this hypothesis. FKs have been studied for their potential toxicity, and in vitro studies have shown that they possess increased cytotoxicity compared to KLs [27]. Consequently, they have been suspected to be the constituents responsible for initiating the skin rash linked to the high consumption of kava [12,28,29]. The mechanism of FKB cytotoxicity has been described to be mediated through oxidative stress and depletion of glutathione, and this has also been shown for other FKs. When the potential toxicity of the three FKs was compared with six KLs, it was found that all three FKs displayed higher toxicity than the most toxic KL [10].

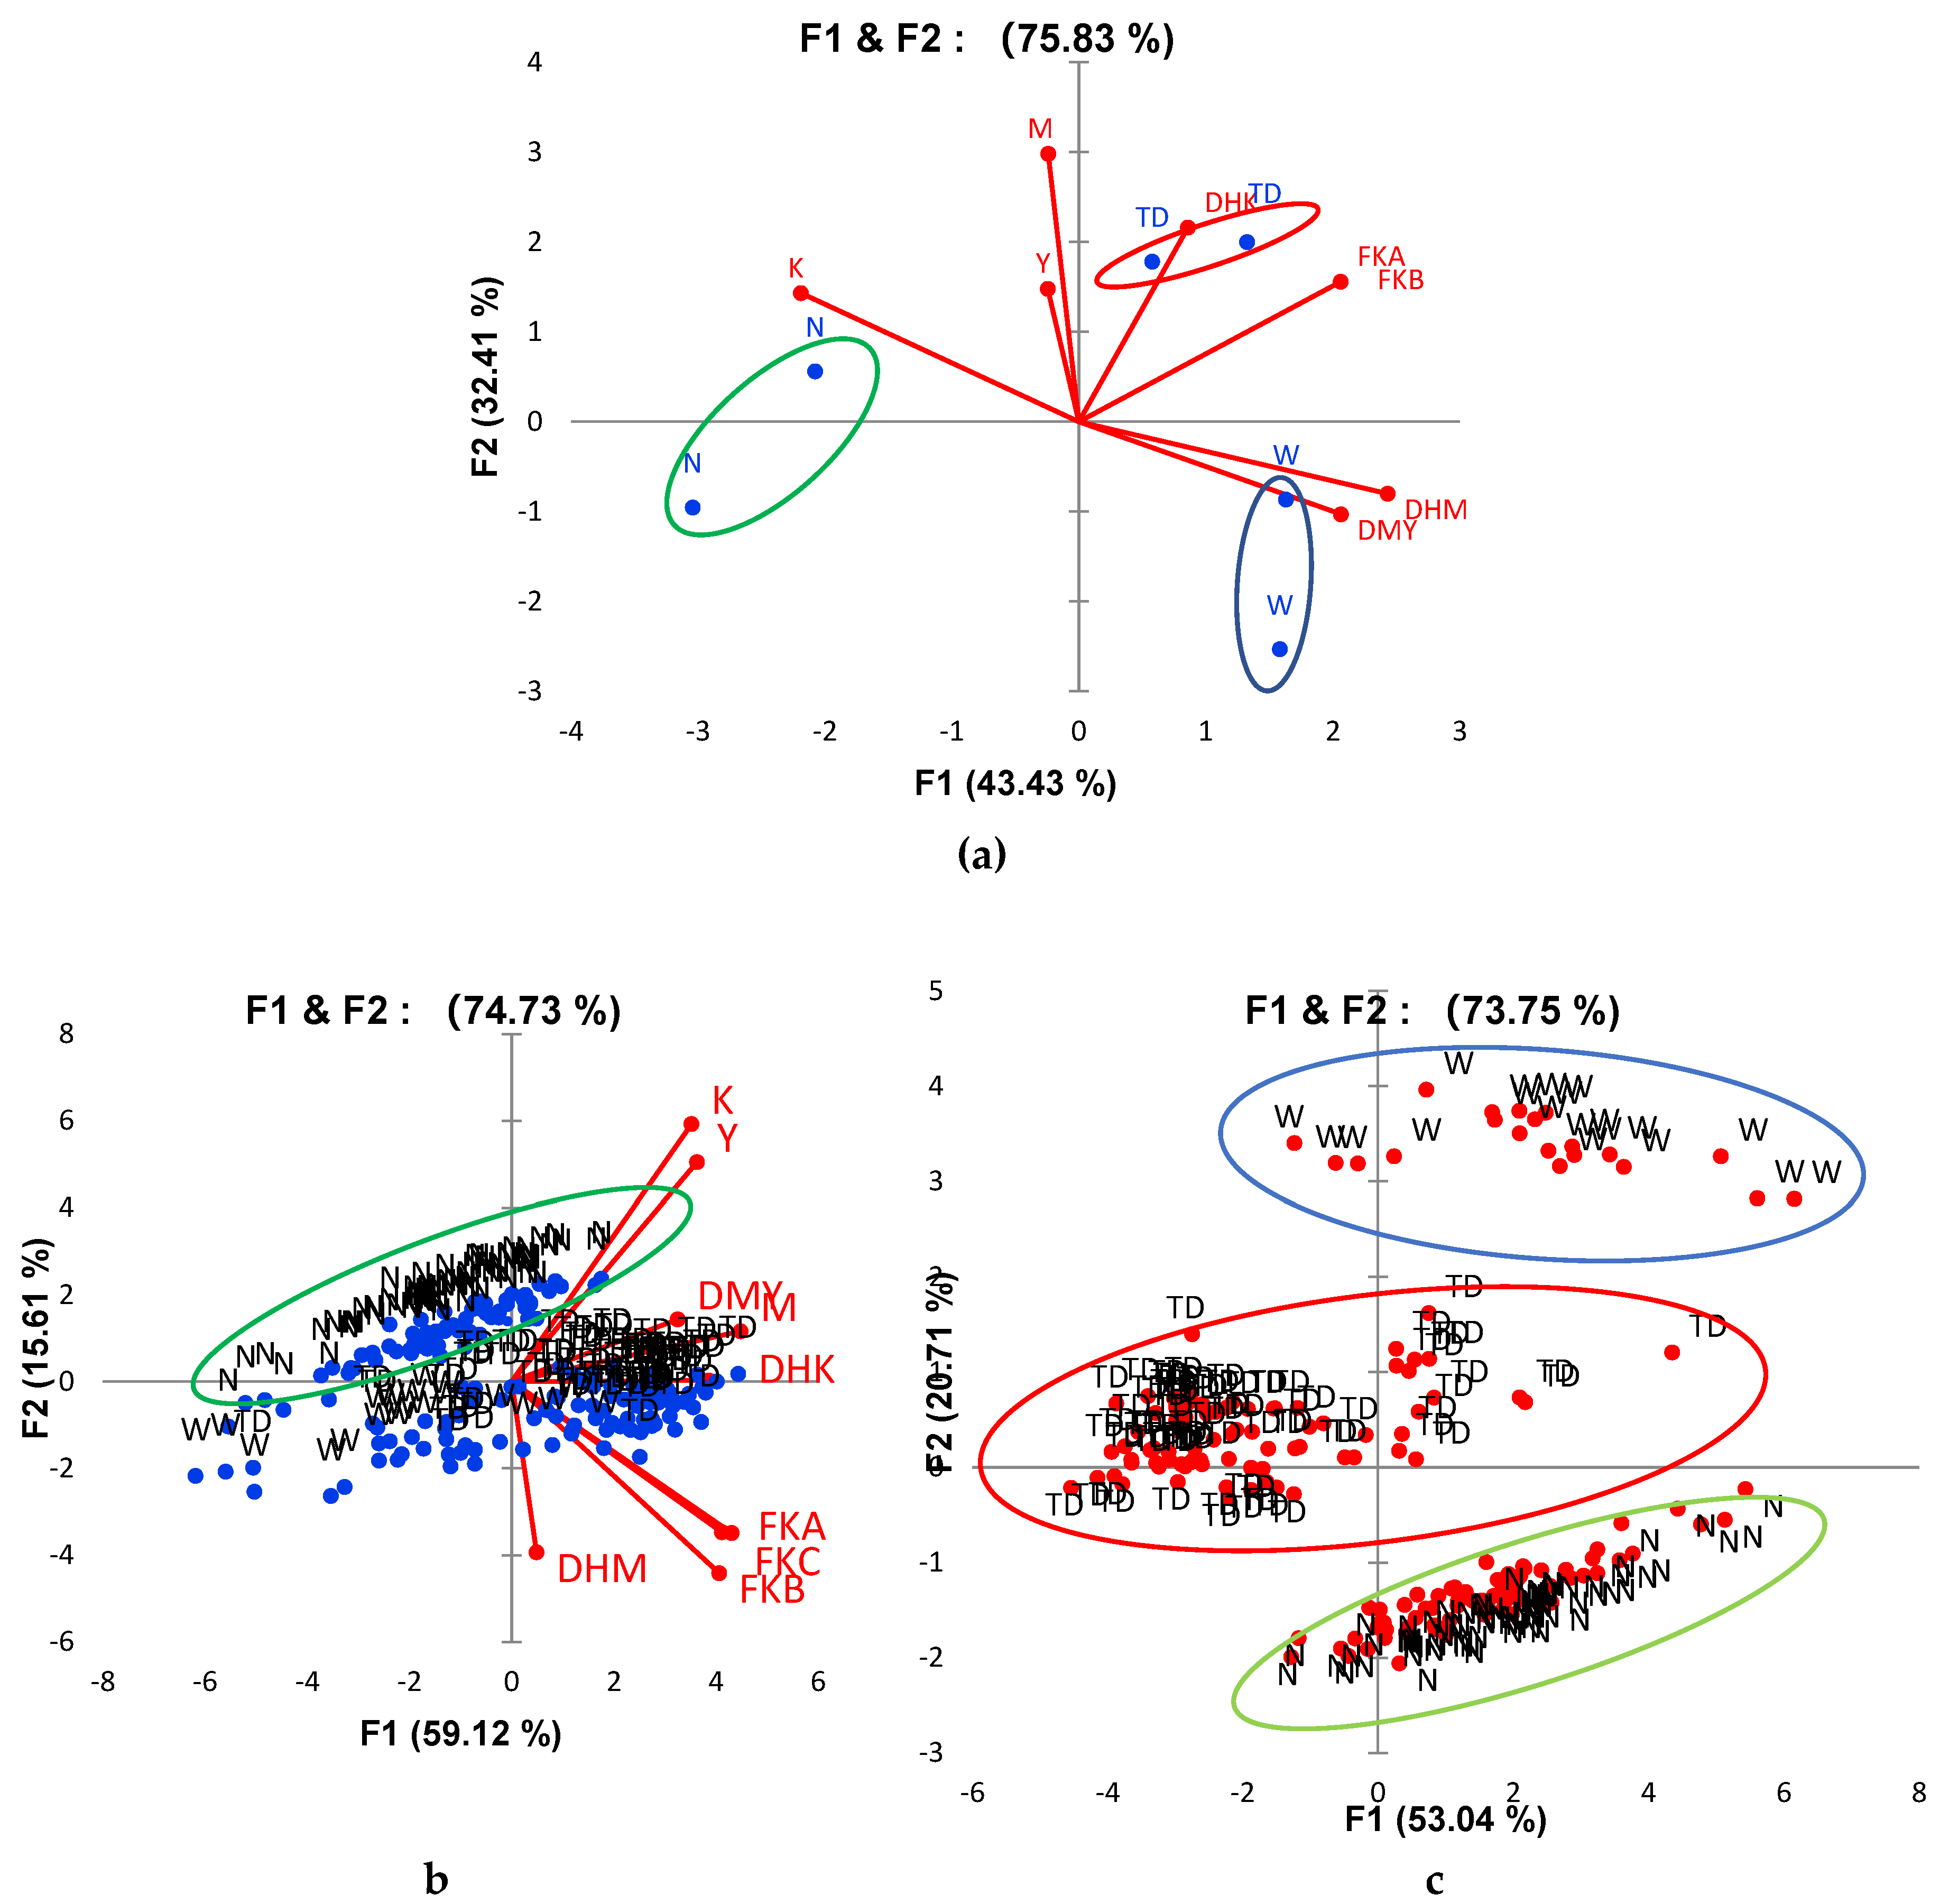
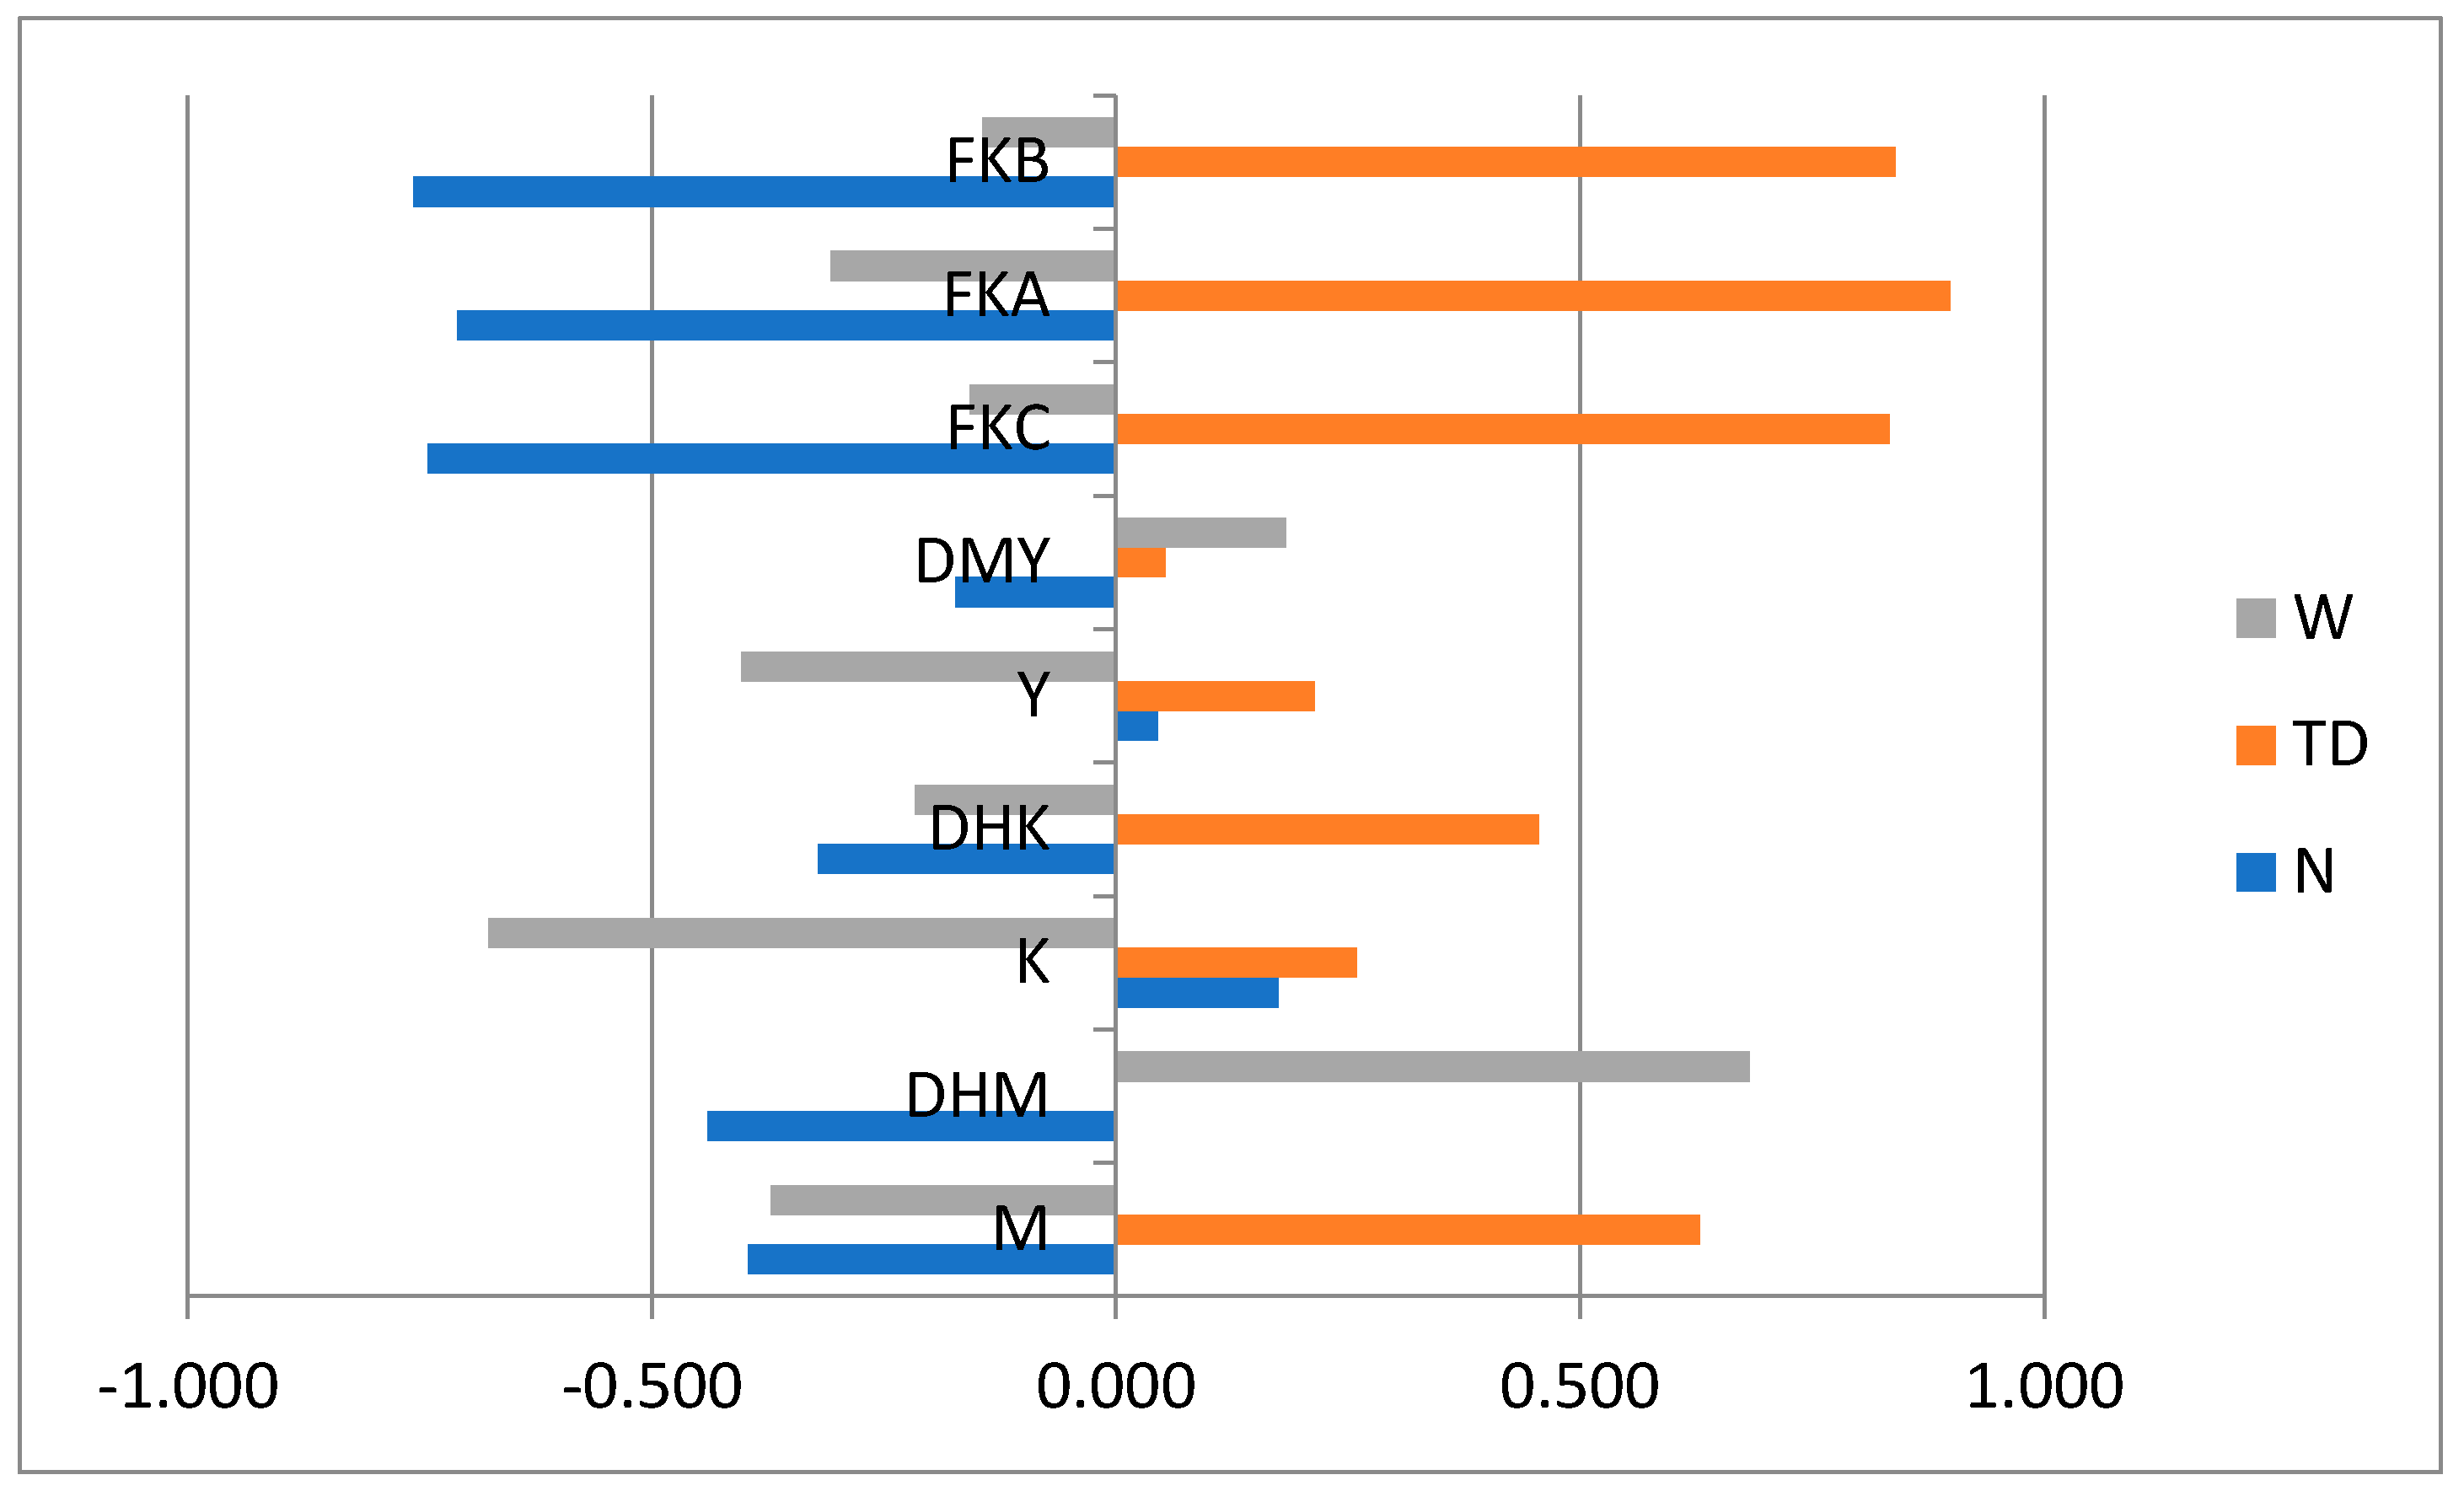
3.2. Multivariate Analyses

The PCA of six varieties analyzed with UHPLC (using peak areas values) is presented in Figure 3a. The three different groups of varieties are well differentiated. Principal Component Analysis (using Spearman coefficient of correlation) (graph not shown here) was conducted on the data matrix corresponding to 174 observations X 9 variables (6 KLs + 3 FKs) with peak areas values (in AU). Due to the high number of samples (n = 174), most correlation coefficients are significant but some correlations appear to be weak (it is generally accepted that Spearman coefficients are strong for 0.60–0.79 values and very strong for 0.80–1.0). It appears that the three FKs are highly correlated with each other with very strong correlation coefficients (0.882 **, 0.905 **, 0.926 **), and K is strongly correlated with Y (0.839 **). These results would suggest that the contents of the three FKs and of Y and K are controlled by common genes but more research is needed to understand this observation. The PCA results show that N varieties are well differentiated while some TD varieties are very close to W varieties.
The PCAmix graph is presented in Figure 3c. The three groups of varieties are differentiated with axes 1 and 2 representing 73.75% of the total variation. Noble varieties are clearly differentiated from two-day and wichmannii varieties by their high Y and K, and two-day varieties are clearly differentiated due to their high FKs. There are two groups of variables: contents of K, Y, DMY, M and DHK are strongly correlated and characterize noble varieties, while high contents of FKC, FKA, FKB and DHM are characterize two-day and wichmannii varieties.
The results of the PLS-R analysis are presented in Table 3 and Figure 4. For each variable (6 KLs and 3 FKs), the correlation values with the three groups of varieties (N, TD, W) indicate that the FKs values clearly discriminate N (significant negative coefficients) from TD varieties (significant positive coefficients). Overall, their contribution to the differentiation of these two groups of varieties is greater than the contribution of the six KLs. W varieties are differentiated by their DHM content (+0.683 **) (Table 3).

3.3. Chemotypes

In a previous HPLC study, the six major KLs were numbered in their order for elution (1 = DMY, 2 = DHK, 3 = Y, 4 = K, 5 = DHM, 6 = M), and these were coded in decreasing order of percentage in the chloroform extract to define kava chemotypes [7]. HPLC analysis of 121 varieties from the Pacific Islands revealed that the most appreciated noble varieties presented chemotype 426135 chemotype with 246531 used for daily drinking. Chemotype 256431 was composed of two-day varieties known for their pronounced physiological and long lasting effect. It was, therefore, concluded that drinkers do not appreciate a high DHK (2) and DHM (5) and that chemotypes with a high K (4) and a low DHM (5) produce a desirable effect. The present HPTLC study confirms these previous HPLC analyses but the percentages of Y and DMY are much higher, because acetone extraction and two different wavelengths (240 and 355 nm) were used for quantification. However, the mean values for Y and DMY in nobles and two-day varieties are not significantly different (at p ≤ 0.05) and therefore, Y and DMY are not useful to differentiate chemotypes (Table 2). Noble varieties are still characterized with higher K (24.5%) than two-day (21.0%) and wichmannii varieties (10.3%). They also present lower DHK and DHM (15.5, 6.0%) compared to two-day (19.0, 7.8%) and wichmannii varieties (14.2, 21.2%) (Table 2).
These HPTLC results are clarifying the potential role of FKs in the different physiological effects induced by each varietal group. It appears that the major difference between nobles, two-day and wichmannii varieties might not be due only to their different KLs chemotypes as previously suggested [7] but rather their very high FKs. Although more research is needed, this observation would suggest that the side effects produced by beverages prepared with these two groups of varieties would result from high FKs and not from DHK and DHM alone [7].

3.4. Implications for Quality Control

Various analytical protocols have been developed for kava using HPLC [8,22], but these protocols did not use acetonic extracts. Acetone is, however, the most efficient solvent to extract KLs and FKs [19], and protocols based on ethanol, methanol or chloroform cannot quantify accurately KLs and FKs in the raw material because of their weak extraction efficiency. The combination of acetone and sonication allows the most efficient extraction [20]. The present HPTLC analysis of acetonic extracts allows fast quantification of the six KLs and three FKs when the plate is scanned at 240 and 355 nm. However, the chemical composition of the traditional beverages, obtained by cold water extraction of dried or fresh roots, cannot be considered as identical to the chemical composition of its acetonic extract. This is due to the very poor water solubility of kavalactones (at 21 °C): DHK = 8.1 mg/100 mL, DHM = 1.5; K = 2.2, M = 1.2, DMY = 0.5 and Y = 0.3 [30]. Hence, the Y and DMY values have limited incidence on beverage quality because of their very low water solubility and, therefore, bioavailability. These two KLs are not significantly different between two-day and noble varieties and their contribution to the physiological effect is probably limited. HPTLC analysis of acetonic extracts also allows the quantification of compounds unsuitable for kava consumption such as FKs, and the results are congruent with UHPLC analysis.
Noble varieties are known for their high K content inducing the pleasant effect sought by consumers, and K is quickly metabolized via the first pass effect [31]. Kavain is supposed to have a similar effect to benzodiazepines with an influence on the GABAA receptor complex, through which the anxiolytic and antidepressant effect is explained [32]. Unsuitable varieties, such as wichmanni and two-day kavas have low K and high DHK and DHM, and the slow metabolization of these two later KLs is suspected to contribute to the nausea and long-lasting effect. The results presented here indicate that DHK is significantly higher in two-day (33.8), and DHM is significantly higher in wichmannii (29.4). DNA analysis of kava varieties using SSR and DArT markers has shown that they correspond to three distinct genotypes with somatic mutants within each group [6]. The PCA and PCAmix results (Figure 3) are in agreement with the three genetic groups. Although wichmannii and two-day varieties are considered as P. methysticum, it is quite clear that they represent very different plants characterized by very high FKs.
The occurrence of suspected hepatotoxicity in German acetonic extracts was most likely caused by non KLs compounds. KLs have been tested in different assays but were never found to be toxic [33,34]. FKB and FKA have been found to be potentially hepatotoxic for mice [35]. It has been shown that oral consumption of FKB leads to the inhibition of hepatic transcriptional activity in vivo and severe liver damage. FKB has been identified as a potent GSH-sensitive hepatotoxin and it was advised that its levels should be controlled in kava-containing herb products [10]. It has also been shown that FKs are high in the bark of the plant [36] and could contribute to protection against potential predators, due to their potential cytotoxicity. The significant volume of data recently produced on the potential cytotoxic properties of FKs [27,29] implies that new routine analytical protocols for kava should quantify them accurately. Their extractability is also constrained by the efficiency of the solvent used so that it is necessary to use acetone for both KLs and FKs analysis.
Health Authorities in the Netherlands, UK and France have decided to follow the German decision and banned kava under all its forms, although kava, the traditional beverage per se, was never consumed in these countries. The IARC has classified kava extracts (not the kava beverage stricto sensu) as possibly carcinogenic to humans (Group 2B) but it recognizes that there is inadequate evidence in humans for the carcinogenicity of kava extract. The IARC Working Group also noted that the influences on composition may hinder the comparison of toxicological studies when the applied kava material is not specified exactly [4]. When the German Health Authorities decided to ban kava in 2003, the control quality system used at that time was not efficient and individual KLs and FKs were not quantitated in the extracts [3]. It is therefore possible that two-day and/or wichmannii varieties were imported into Germany and extracted. In Vanuatu, the “Kava Act” declares illegal for trade the use of two-day and wichmannii varieties [5]. It is mandatory to cultivate kava organically, to harvest after a minimum of three years of age, to separate the different parts of the plant, and to mention the village of origin of the plant for traceability purposes. The results presented in this study confirm that these two groups of varieties present high FKs, and based on the possible cytotoxicity effect of this group of metabolites, it seems appropriate to avoid their trade although more research is still needed to clarify their exact physiological effect. However, FKs have also been shown to be effective in cell culture and animal models for the treatment of various cancers [11,37,38,39], and two-day varieties might have potential as raw material for the extraction of these particular secondary metabolites. The Kava Act of 2002 considers this option, and their export as raw material for the pharmaceutical industry is legal if a specific demand from the importer is provided (point 6.4 of the Kava Act).
The HPTLC protocol developed here was successfully tested for its repeatability but it is usually recommended that HPTLC methods should also be validated for stability, precision and robustness. In our study, stability was not tested using a specific protocol; however, the comparison of 174 samples and the analysis of different samples per varietal group (N, TD, W) allowed for a fair assessment of their profile’s stability (Figure 2). However, the precision of HPTLC profiles depends on the positions of well separated bands (and their Rf-values), and the results are generally affected by the relative humidity to which the plate was exposed prior to chromatography. For the present study, the application of 20 different kava varieties on the same plate allowed for a fair comparison of their profiles and these were very stable. The protocol robustness was evaluated during its development and included the comparison of different mobile phases composition, tank saturation times and migration distances on the plate [25]. However, there is still a technical constraint for the accurate quantification of DHM as its peak (Figure 2a) is not clearly separated from K. This point needs more work (adjustment of tank saturation time) in order to improve the method further. As shown in previous studies [19], acetone is the most effective solvent but the composition of the extract does not necessarily reflect the real composition of the product extract with water, the traditional beverage. So, acetone is an interesting solvent from a fast procedure point of view, but our results should be carefully considered, since in general some potential harmful compounds extracted with acetone could remain intact when using water, and this is especially true for FKs. If it confirmed that FKs are potentially toxic and if these compounds are water extracted from varieties rich in FKs, such as TD varieties, then they present a real concern.

4. Conclusions

This is the first time that the three FKs, suspected of being cytotoxic, are accurately measured on numerous samples of kava powders originating from a wide sample of distinct kava varieties. In the past, different solvents (chloroform, ethanol, hexane, and methanol) have been used to develop HPLC and GC protocols for KLs and FKs but their results were hardly comparable because of the significant differences in the solvents’ extraction efficiencies. Acetone is the most efficient solvent to extract KLs and FKs but it has often been avoided due to technical constraints for HPLC column separations. In the present study, we developed an analytical protocol for raw material extracted with acetone. The different chemical compositions in noble, two-days and wichmannii varieties were confirmed using UHPLC and HPTLC. Noble varieties with pleasant effect are characterized with low FK/KL and high K/FKB values. These two ratios, measured with HPTLC, can be used for the qualitative assessment of raw material and powders prepared for export to avoid the trade of unsuitable kava.
Our findings reveal chemotype groups different than those previously described because we have used two different detection wavelengths that allow for a better quantification of yangonin and desmethoxyyangonin. It appears that these two compounds were underestimated in previous HPLC studies because they were quantified at 240 nm. This is the first time that the three FKs are simultaneously quantified with the six major KLs in 174 kava varieties. This quantification allows a clear differentiation of kava varieties into three distinct chemical groups. The three FKs appear as the compounds contributing the most to the differentiation. The chemical groups are consistent with genetic groups revealed by DNA markers. It is therefore concluded that the analytical protocol presented here is accurate and reliable for quality control based on varietal differentiation.

Supplementary Materials

The following are available online at https://www.mdpi.com/2306-5710/5/2/34/s1, Table S1: List of varieties analysis.

Author Contributions

V.L.: prepared the samples for HPTLC analysis, performed the HPTLC experiments, analyzed and interpreted the HPTLC and statistical data, wrote and reviewed drafts of the manuscript, prepared the final writing. S.M.: performed the UHPLC analysis. L.L.: analyzed and interpreted the UHPLC and statistical data, reviewed drafts of the manuscript, and contributed to the final writing. All authors read and approved the final manuscript.

Funding

This study would not have been possible without the financial support of the ANR (Agence Nationale pour la Recherche, France) through the project “Végé-Culture” (no ANR-10-STRA-007) and the Ministry of Quarantine, Agriculture, Fishery and Forestry of Vanuatu.

Acknowledgments

Special thanks are due to Madeleine Shem for laboratory technical assistance in preparing the samples and to VARTC staff for assisting with the fieldwork, germplasm characterization and sample collection.

Conflicts of Interest

The authors declare that they have no conflict of interest.

References

  1. Showman, A.F.; Baker, J.D.; Linares, C.; Naeole, C.K.; Borris, R.; Johnston, E.; Konanui, J.; Turner, H. Contemporary Pacific and Western perspectives on awa (Piper methysticum) toxicology. Fitoterapia 2015, 100, 56–67. [Google Scholar] [CrossRef] [PubMed]
  2. Fiji Kava Value Chain Analysis; Pacific Horticultural and Agricultural Market Access (PHAMA): Suva, Fiji, 2015; p. 124. Available online: http://phama.com.au/wp-content/uploads/2018/06/Fiji-Kava-Value-Chain-Analysis-Report-FINAL.pdf (accessed on 7 January 2019).
  3. Kuchta, K.; Schmidt, M.; Nahrstedt, A. German Kava Ban Lifted by Court: The Alleged Hepatotoxicity of Kava (Piper methysticum) as a Case of Ill-Defined Herbal Drug Identity, Lacking Quality Control and Misguided Regulatory Politics. Plant Med. 2015, 81, 1647–1653. [Google Scholar] [CrossRef]
  4. IARC Monograph. 2018, Volume 108. IARC-WHO, Lyon, France. Available online: https://monographs.iarc.fr/wp-content/uploads/2018/06/mono108-04.pdf (accessed on 14 January 2019).
  5. Republic of Vanuatu. Kava Act No. 2 of 2002; Government of the Republic of Vanuatu: Port-Vila, Vanuatu, 2002. Available online: http://www.paclii.org/vu/legis/num_act/toc-K.html (accessed on 8 January 2019).
  6. VandenBroucke, H.; Mournet, P.; Malapa, R.; Glaszmann, J.C.; Chair, H.; Lebot, V. Comparative analysis of genetic variation in kava (Piper methysticum) assessed by SSR and DArT reveals zygotic foundation and clonal diversification. Genome 2015, 58. [Google Scholar] [CrossRef]
  7. Lebot, V.; Lévèsque, J. Genetic control of kavalactone chemotypes in Piper methysticum cultivars. Phytochemistry 1996, 43, 397–403. [Google Scholar] [CrossRef]
  8. Bilia, A.; Scalise, L.; Bergonzi, M.; Vincieri, F. Analysis of kavalactones from Piper methysticum (kava-kava). J. Chromatogr. B 2004, 812, 203–214. [Google Scholar] [CrossRef]
  9. Zi, X.; Simoneau, A.R.; Flavokawain, A. A novel chalcone from kava extract, induces apoptosis in bladder cancer cells by involvement of bax protein-dependent and mitochondria-dependent apoptotic pathway and suppresses tumor growth in mice. Cancer Res. 2005, 65, 3479–3486. [Google Scholar] [CrossRef] [PubMed]
  10. Zhou, P.; Gross, S.; Liu, J.H.; Yu, B.Y.; Feng, L.L.; Nolta, J.; Sharma, V.; Piwnica-Worms, D.; Qiu, S.X. Flavokawain B, the hepatotoxic constituent from kava root, induces GSH-sensitive oxidative stress through modulation of IKK/NF-kappaB and MAPK signaling pathways. FASEB J. 2010, 24, 4722–4732. [Google Scholar] [CrossRef] [PubMed]
  11. Yeap, S.K.; Abu, N.; Akthar, N.; Ho, W.Y.; Ky, H.; Tan, S.W.; Alitheen, N.B.; Kamarul, T. Gene Expression Analysis Reveals the Concurrent Activation of Proapoptotic and Antioxidant-Defensive Mechanisms in Flavokawain B–Treated Cervical Cancer HeLa Cells. Integr. Cancer Ther. 2017, 16, 373–384. [Google Scholar] [CrossRef]
  12. Ji, T.; Lin, C.; Krill, L.S.; Eskander, R.; Guo, Y.; Zi, X.; Hoang, B.H.; Flavokawain, B. A kava chalcone, inhibits growth of human osteosarcoma cells through G2/M cell cycle arrest and apoptosis. Mol. Cancer 2013, 12, 55. [Google Scholar] [CrossRef]
  13. Teschke, R.; Sarris, J.; Schweitzer, I. Kava hepatotoxcity in traditional and modern use: The presumed Pacific kava paradox hypothesis revisited. Br. J. Clin. Pharmacol. 2012, 73, 170–174. [Google Scholar] [CrossRef]
  14. Olsen, L.R.; Grillo, M.P.; Skonberg, C. Constituents in kava extracts potentially involved in hepatotoxicity: A review. Chem. Res. Toxicol. 2011, 24, 992–1002. [Google Scholar] [CrossRef]
  15. Park, C.; Han, J.M. Anti-inflammatory Effects of Flavokavain C from Kava (Piper methysticum) Root in the LPS-induced Macrophages. J. Soc. Cosmet. Sci. Korea 2016, 42, 311–320. [Google Scholar]
  16. Martin, A.C.; Johnston, E.; Xing, C.; Hegeman, A.D. Measuring the Chemical and Cytotoxic Variability of Commercially Available Kava (Piper methysticum G. Forster). PLoS ONE 2014, 9, e111572. [Google Scholar] [CrossRef] [PubMed]
  17. Codex Alimentarius, Commission E. Discussion Paper on the Development of a Standard for Kava. In Proceedings of the Joint FAO/WHO Food Standards Programme, Thirteenth Session, Kokopo, Papua New Guinea, 19–22 September 2012; Available online: http://www.fao.org/tempref/codex/Meetings/CCNASWP/CCNASWP13/na13_08e.pdf (accessed on 7 January 2019).
  18. Wang, J.; Qu, W.; Jun, S.; Li, Q.X.; Bittenbender, H.C. Kavalactone content and chemotype of kava beverages prepared from roots and rhizomes of Isa and Mahakea varieties and extraction efficiency of kavalactones using different solvents. J. Food Sci. Technol. 2013, 52, 1164–1169. [Google Scholar] [CrossRef] [PubMed] [Green Version]
  19. Xuan, T.D.; Fukuta, A.A.; Wie, A.C.; Elzaawely, A.A.; Khanh, T.D.; Tawata, S. Efficacy of extracting solvents to chemical compounds of kava (Piper methysticum) root. J. Nat. Med. 2008, 62, 188–194. [Google Scholar] [CrossRef] [PubMed]
  20. Warburton, E.; Norris, P.L.; Goenaga-Infante, H. Comparison of the Capabilities of Accelerated Solvent Extraction and Sonication as Extraction Techniques for the Quantification of Kavalactones in Piper methysticum (Kava) Roots by High Performance Liquid Chromatography with Ultra Violet Detection. Phytochem. Anal. 2007, 18, 98–102. [Google Scholar] [CrossRef] [PubMed]
  21. Meissmer, O.; Häberlein, H. HPLC analysis of flavokavins and kavapyrones from Piper methysticum Forst. J. Chromatogr. B 2005, 826, 46–49. [Google Scholar] [CrossRef]
  22. Liu, Y.; Lund, J.A.; Murch, S.J.; Brown, P.N. Single-Lab Validation for Determination of Kavalactones and Flavokavains in Piper methysticum (Kava). Planta Med. 2018, 84. [Google Scholar] [CrossRef]
  23. Siméoni, P.; Lebot, V. Identification of factors determining kavalactones content and chemotype in kava (Piper methysticum Forst. f.). Biochem. Syst. Ecol. 2002, 30, 413–424. [Google Scholar] [CrossRef]
  24. FAO/WHO. Kava: A Review of the Safety of Traditional and Recreational Beverage Consumption; Technical Report; Food and Agriculture Organization of the United Nations World Health Organization: Rome, Italy, 2016; p. 35. [Google Scholar]
  25. Lebot, V.; Do, T.K.; Legendre, L. Detection of Flavokavins (A, B, C) in cultivars of kava (Piper methysticum) using HP-TLC. Food Chem. 2014, 151, 554–560. [Google Scholar] [CrossRef]
  26. Lhuissier, T.; Mercier, P.E.; Michalet, S.; Lebot, V.; Legendre, L. Colorimetric assessment of kava (Piper methysticum Forst.) quality. J. Food Compos. Anal. 2017, 59, 27–34. [Google Scholar] [CrossRef]
  27. Narayanapillai, S.C.; Leitzman, P.; O’Sullivan, M.G.; Xing, C. Flavokawains A and B in Kava, Not Dihydromethysticin, Potentiate Acetaminophen-Induced Hepatotoxicity in C57BL/6 Mice. Chem. Res. Toxicol. 2014, 27, 1871–1876. [Google Scholar] [CrossRef] [PubMed]
  28. Jhoo, J.W.; Freeman, J.P.; Heinze, T.M.; Moody, J.D.; Schnackenberg, L.K.; Beger, R.D.; Dragull, K.; Tang, C.S.; Ang, C.Y.W. In vitro cytotoxicity of nonpolar constituents from different parts of kava plant (Piper methysticum). J. Agric. Food Chem. 2006, 54, 3157–3162. [Google Scholar] [CrossRef] [PubMed]
  29. Backleh, M.; Ekici, P.; Leupold, G.; Parlar, H. Quantitative elimination of Flavokavines A and B from Kava Kava (Piper methysticum G. Forst.) by isoelectric focused adsorptive bubble separation. Naturwissenschaften 2003, 90, 366–369. [Google Scholar] [CrossRef] [PubMed]
  30. Kurth, H. Kava-Kava Chemical Analysis: Methods for Analytical Investigation of Active and Marker Components. Finzelgerg Presentation. Presented at the International Symposium on Kava and Other Medicinal Plants of the South Pacific, Kona, HI, USA, 14–17 May 1997. [Google Scholar]
  31. Saletu, B.; Grunberger, J.; Linzmayer, L.; Anderer, P. EEG-Brain Mappin Psychometric and Psychophysiological Studies on Central Effects of Kavain—A Kava Plant Derivative. Hum. Psychopharm. Clin. Exp. 1989, 4, 169–190. [Google Scholar] [CrossRef]
  32. Tsutsui, R.; Shinomiya, K.; Takeda, Y.; Obara, Y.; Kitamura, Y.; Kamei, C. Hypnotic and sleep quality-enhancing properties of kavain in sleep-disturbed rats. J. Pharmacol. Sci. 2009, 293–298. [Google Scholar] [CrossRef] [PubMed]
  33. Tarbak, F.A. Analytical studies on the kavain metabolism in human specimen and liver cell lines. Ph.D. Thesis, Forensic Toxicology Institut für Rechtsmedizin, Heinrich-Heine-Universität, Düsseldorf, Germany, 2004; pp. 89–92. [Google Scholar]
  34. Chua, H.C.; Christensen, E.T.H.; Hoestgaard-Jensen, K.; Hartiadi, L.Y.; Ramzan, I.; Jensen, A.A.; Absalom, N.L.; Chebib, M. Kavain, the Major Constituent of the Anxiolytic Kava Extract, Potentiates GABAA Receptors: Functional Characteristics and Molecular Mechanism. PLoS ONE 2016, 11, e0157700. [Google Scholar] [CrossRef]
  35. Schmidt, M.; Carreno, I.; Vergano, P. Technical Assistance to the Integration to the Multilateral Trading System and Support to the Integrated Framework; Ref. 9 ACP RPR 140-039/11: Establishment of Health and Safety Standards for the Production and Export of Kava-Based Products; ACP6EU-TBT: Brussels, Belgium, 14 March 2012. [Google Scholar]
  36. Teschke, R.; Wolff, A. Regulatory causality evaluation methods applied in Kava hepatotoxicity: Are they appropriate? Regul. Toxicol. Pharmacol. 2011, 59. [Google Scholar] [CrossRef]
  37. Abu, N.; Mohamed, N.E.; Yeap, S.K.; Lim, K.L.; Akhtar, M.N.; Zulfadli, A.J.; Kee, B.B.; Abdullah, M.P.; Omar, A.R.; Alitheen, N.B. In vivo antitumor and antimetastatic effects of flavokawain B in 4T1 breast cancer cell-challenged mice. Drug Des. Dev. Ther. 2015, 9, 1401–1417. [Google Scholar] [Green Version]
  38. Pinner, D.D.; Wales, C.T.K.; Gristock, R.A.; Vo, H.T.; So, N.; Jacobs, A.T. Flavokavins A and B from kava (Piper methysticum) activate heat shock and antioxidant responses and protect against hydrogen peroxide-induced cell death in HepG2 hepatocytes. Pharm. Biol. 2016, 54, 1503–1512. [Google Scholar] [CrossRef]
  39. Rossette, M.C.; Moraes, D.C.; Sacramento, E.K.; Romano-Silva, M.A.; Carvalho, J.L.; Gomes, D.A.; Caldas, H.; Friedman, E.; Bastos-Rodrigues, L.; De Marco, L. The In Vitro and In Vivo Antiangiogenic Effects of Flavokawain B. Phytother. Res. 2017, 31, 1607–1613. [Google Scholar] [CrossRef] [PubMed]
Figure 1. Chemical structure of kavalactones and flavokavins (=: presence of double bond).
Beverages 05 00034 g001
Figure 2. (a) Scan at 240 nm allowing the detection and quantification of methysticin (M), dihydromethysticin (DHM), kavain (K) and dihydrokavain (DHK). (b) Scan of the same plate at 355 nm, allowing detection and quantification of flavokavin C (FKC), yangonin (Y), desmethoxyyangonin (DMY), flavokavin B (FKB) and flavokavin A (FKA). Under each HPTLC chromatogram are photos taken at 254 nm (c) and 366 nm (d) of the corresponding plates.
Beverages 05 00034 g002
Figure 3. (a) PCA of a subset of six varieties representing the genetic diversity of the species analyzed by UHPLC (peak area values were used) shows that the three groups of varieties (N, TD, W) are well differentiated. (b) PCA of 174 varieties analyzed by HPTLC (peak area values) and the contribution of the nine variables shows that the N varieties are well differentiated but some TD varieties are clustering with W varieties. (c) PCAmix identifying nearness between variables and proximity between the 174 observations (N = 72 acc., TD = 82 acc., W = 20 acc.) shows that the three groups are well separated.
Beverages 05 00034 g003
Figure 4. Graphic representation of correlation values of the PLS-R analysis for each varietal group (W = wichmannii, TD = two-day, N = noble) for the 6 KLs and 3 FKs.
Beverages 05 00034 g004
Table 1. Linearity of HPTLC measurements, accuracy and precision of repetitions (peak areas versus concentrations applied).
Compound Linear EquationR2%RSD
Desmethoxy yangoninDMYy = −6371.5x2 + 18248x + 192.530.99860.66
DihydrokavainDHKy = −1964.8x2 + 6264.1x + 139.460.99961.54
YangoninYy = −3216.6x2 + 10984x + 466.080.99930.93
KavainKy = −5080.5x2 + 17784x + 949.510.99770.89
DihydromethysticinDHMy = 63.386x2 + 580.73x + 142.820.99822.61
MethysticinMy = 126.34x2 + 898.66x + 559.520.99971.79
Flavokavin AFKAy = 74.691x2 + 690.57x + 0.630.99911.01
Flavokavin BFKBy = −33.325x2 + 1023.7x + 196.280.99990.52
Flavokavin CFKCy = 80.65x2 + 653.67x − 147.660.99971.33
R2, p < 0.01; RSD: repeatability standard deviation (n = 5).
Table 2. Quantification of six major kavalactones and three flavokavins (in mg/g *) in 174 varieties of root samples from Vanuatu (nobles, two-day, wichmannii).
GroupDMY
(1)
DHK
(2)
Y
(3)
K
(4)
DHM
(5)
M
(6)
FKAFKBFKCTotal KLsTotal FKsKLs
%DW
FKs/
KLs
K/
FKB
Nobles (n = 72)
Mean29.3 a23.5 b37.9 a36.4 a8.9 b13.7 b7.6 b6.0 c5.8 b149.9 b19.4 c15.00.13 c7.31 a
Std8.49.37.87.72.44.92.62.71.736.06.03.60.033.46
Min8.23.715.311.42.82.82.10.91.148.65.14.90.072.85
Max43.145.855.348.915.323.415.212.09.5223.730.522.30.2217.71
%KLs + FKs17.113.822.821.75.37.94.53.53.488.611.4
%KLs19.415.525.724.56.08.9
Two-Day (n = 82)
Mean 31.6 a33.8 a39.4 a37.2 a13.3 b20.8 a24.0 a26.3 a14.3 a176.1 a64.6 a17.60.36 a1.50 b
Std6.69.95.98.33.34.55.27.73.031.815.33.20.050.42
Min7.811.412.28.64.04.27.27.03.351.817.65.20.250.69
Max41.249.949.150.723.727.632.737.519.2229.585.723.00.542.96
% KLs + FKs13.113.916.615.45.78.610.010.75.973.326.7
%KLs17.919.022.621.07.811.8
Wichmannii (n = 20)
Mean 35.5 a20.9 b28.3 b14.5 b29.4 a10.2 b7.5 b11.7 b7.9 b138.8 c27.2 b13.90.21 b1.70 b
Std13.916.711.86.215.75.32.66.93.655.612.25.60.181.66
Min12.52.65.82.56.50.62.22.41.534.37.23.40.030.43
Max59.356.147.022.254.418.611.927.714.5213.954.121.40.547.95
% KLs + FKs21.911.617.08.617.85.94.97.45.087.717.3
%KLs26.714.220.510.321.27.1
* values in mg/g correspond to peak areas converted into concentrations based on pure standards values. Std = standard deviation of the mean (computed using non parametric tests: Kruskal-Wallis and Friedman). Means with different letters in superscript within each column are significantly different at p ≤ 0.05. %DW: % dry weight.
Table 3. Correlation values for major compounds and groups of varieties (N, TD, W) (PLS-R analysis).
NTDWMDHMKDHKFKCYDMYFKA
TD−0.792 **
W−0.302 **−0.343 **
M−0.404 **0.636 **−0.372 **
DHM−0.437 **−0.007ns0.683 **0.102ns
K0.173ns0.263ns−0.676 **0.773 **−0.306 **
DHK−0.320 **0.455 **−0.218ns0.630 **0.037ns0.547 **
FKC−0.742 **0.833 **−0.160ns0.794 **0.113ns0.427 **0.688 **
Y0.036ns0.222ns−0.403 **0.797 **0.123ns0.853 **0.547 **0.448 **
DMY−0.179ns0.057ns0.186ns0.563 **0.334 **0.465 **0.573 **0.502 **0.634 **
FKA−0.709 **0.898 **−0.311ns0.769 **0.039ns0.460 **0.610 **0.922 **0.421 **0.322 **
FKB−0.755 **0.837 **−0.146ns0.719 **0.100ns0.364 **0.641 **0.946 **0.321 **0.440 **0.952 **
** significant at 1% level tabular value: 0.254, ns = not significant.

