Article

Investigation of Age Gelation in UHT Milk

1
Commonwealth Scientific and Industrial Research Organisation (CSIRO), Agriculture and Food, Werribee, VIC 3030, Australia
2
Department of Economic Development, Jobs, Transport and Resources, AgriBio Centre, Bundoora, VIC 3083, Australia
3
Genedata AG, 4053 Basel, Switzerland
*
Authors to whom correspondence should be addressed.
These authors contributed equally to this work.
Beverages 2018, 4(4), 95; https://doi.org/10.3390/beverages4040095
Submission received: 23 October 2018 / Revised: 16 November 2018 / Accepted: 20 November 2018 / Published: 24 November 2018
(This article belongs to the Special Issue Omics and Beverages)

Abstract

:
Milk samples with twelve combinations of κ- and β-casein (CN) and β-lactoglobulin (β-Lg) variants were obtained to investigate the effect of protein variant on the mechanism/s of age gelation in ultra-high temperature (UHT) skim milk. Only milk groups with κ-CN/β-CN/β-Lg combinations AB/A1A2/AB and AB/A2A2/AB suffered from the expected age gelation over nine months storage, although this could not be attributed to the milk protein genetic variants. Top-down proteomics revealed three general trends across the twelve milk groups: (1) the abundance of intact native proteins decreases over storage time; (2) lactosylated proteoforms appear immediately post-UHT treatment; and (3) protein degradation products accumulate over storage time. Of the 151 identified degradation products, 106 (70.2%) arose from β-CN, 33 (21.9%) from αs1-CN, 4 (2.7%) from β-Lg, 4 (2.7%) from α-La, 3 (2%) from κ-CN and 1 (0.7%) from αs2-CN. There was a positive correlation between milk viscosity and 47 short peptides and four intact proteoforms, while 20 longer polypeptides and 21 intact proteoforms were negatively correlated. Age gelation was associated with specific patterns of proteolytic degradation and also with the absence of the families Bacillaceae, Aerococcaceae, Planococcaceae, Staphylococcaceae and Enterobacteriaceae, present in all the non-gelling milk groups pre-UHT.

1. Introduction

Ultra-high temperature (UHT) treatment (135–150 °C for 2–6 s) is widely used to sterilize milk and extend its shelf-life up to 4–6 months at room temperature [1]. The demand for UHT milk is steadily increasing every year as urbanization continues and refrigerated storage becomes economically and environmentally unviable [2]. UHT milk processing, whilst producing sterile products, induces major physicochemical changes to the milk components, particularly the heat-sensitive whey proteins. These physicochemical changes can lead to a suite of negative sensory attributes such as browning, bitterness, particle formation and gelation that consumers reject, dictating the shelf life of UHT milk rather than shelf life restriction from microbial infection [3].
The mechanisms of these defects have been previously reviewed by several authors [2] with age gelation being the most prominent defect affecting UHT milk. Age gelation can be described as a two-stage process. Firstly, during the UHT of milk, β-lactoglobulin (β-Lg), the major whey protein in milk, denatures, because of the applied heat. It complexes with κ-casein (κ-CN) forming a β-Lg-κ-CN complex on the surface of the casein micelles. The second stage, whereby a three-dimensional gel network is formed, is less well understood but is hypothesized to occur via a number of mechanisms [1].
The aggregation mechanism has been proposed by [4] to fit with the intrinsic chaperone action of κ-CN, where κ-CN may complex with β-Lg to inhibit the aggregation and precipitation of β-Lg. κ-CN also has the ability to form protein aggregates called amyloid fibrils following dissociation from the casein micelle [5], and it is known that concentrated solutions of amyloid fibrils may form gels [6]. The ‘protuberances’ and ‘tendrils’ seen in UHT milk samples with transmission electron microscopy (TEM) [7] also fit this hypothesis as this morphology is very similar to the morphology of amyloid fibrils when viewed by TEM. We have also recently shown that the amyloid fibril hypothesis is possible by investigating a model system containing purified β-Lg and κ-CN that showed the two proteins are able to co-polymerize to form heteropolymorphic amyloid fibrils together when heated [8].
The mechanism by which the β-Lg-κ-CN complex dissociates from the casein micelle is proposed to occur either enzymatically through proteases or non-enzymatically through physicochemical processes. The enzymatic process is based around proteolytic degradation of the milk proteins by either the endogenous protease plasmin or heat resistant bacterial proteases, such as those from Pseudomonas, causing the release of the β-Lg-κ-CN complex from the casein micelle which eventually forms the protein network and gelation [9]. The non-enzymatic process was suggested as there was no clear relationship between the amount of proteolytic activity and gelation [10]. The non-enzymatic process is thought to be caused by polymerization of casein and whey proteins by Maillard reactions [11] or by a lowered surface potential of some casein micelles, which over time aggregate together and cause gelation [12].
Factors that may also influence the shelf life of UHT milk have previously been reviewed [1] and include: the age of cow, stage of lactation, season, somatic cell count and microbiological quality of the raw milk, storage temperature and the milk’s fat content. Whilst this list is extensive, the interplay between all these factors is difficult to ascertain and hence why the exact mechanism for age gelation is still currently unknown. For example, increased storage temperature up to 30 °C increases both proteolytic degradation and gelation, yet above 35 °C where proteolysis is even more pronounced, gelation is in fact inhibited, thought to be due to the speed of proteolysis not allowing physical interaction of casein micelles [13].
A potentially overlooked factor in the progression of age gelation is the diverse milk functionality afforded by the presence of different protein genetic variants of both the casein and whey proteins [14]. The protein variants of three milk proteins, κ-CN, β-CN and β-Lg, are known to strongly influence milk functionality, for example, rennet coagulation time is affected by κ- and β-CN genetic variants [15], total protein concentration is affected by all three [16] and casein micelle size is affected by κ-CN and possibly β-CN [17]. The most common variants in dairy cows of these three proteins are κ-CN A and B, β-CN A1 and A2, β-Lg A and B with each containing a slightly altered amino acid sequence and protein functionality.
κ-CN A and B differ at position 137, Thr to Ile, and 149, Asp to Ala, respectively. These substitutions make the B variant more highly glycosylated than the A variant [14] and the A variant more susceptible to the protease chymosin involved in cheese making compared to B [18]. β-CN A1 and A2 differ by one amino acid at position 67, His to Pro, respectively. This substitution produces different protease cleavage products upon simulated gastrointestinal digestion [19], and we showed that A2 β-CN forms into a smaller self-associating micelle and functions more efficiently as a molecular chaperone to inhibit protein aggregation [20]. β-Lg A and B differ at position 64, Asp to Gly, and 118, Val to Ala, respectively. This difference has been shown to lower the thermal denaturation temperature of the B variant compared to A [21], increase thiol group reactivity at 60 °C of the A variant compared to B [22] and lower the gelation point and increase the initial gelation rate for a 7% solution at pH 7.0 of the A variant compared to B [23].
Clearly, milk protein variants influence the functionality of not only the individual proteins, but also on the overall functionality of milk. For this reason, we set out to explore the relationship between the commonly found protein variants of β-CN, κ-CN and β-Lg and their influence on the age gelation phenomenon in UHT milk to ascertain whether there is an optimal genetic profile to produce a more stable UHT milk and to probe the mechanism of age gelation. In this study, milk samples from 12 groups of cows with unique β-CN, κ-CN and β-Lg genetic variants were collected, UHT treated and stored in ambient conditions for nine months. Milk samples aliquoted every month were subject to physical measurements and top-down proteomics analyses.
An important contributor to proteolysis in milk is the microbial population, also called the microbiome, present in raw milk and containing hundreds of bacterial and other microbial species. Many proteases produced by bacteria have been described and some of these may explain the occurrence of age gelation [24]. As well as a basic colony growth test we carried out a metagenomic analysis of the milk samples using DNA sequencing of an amplified region of the bacterial 16s rRNA gene.

2. Materials and Methods

2.1. General

All chemicals were purchased from Sigma-Aldrich unless otherwise stated.

2.2. Milk Parameters

Milk samples with defined combinations of the genetic variants of κ- and β-CN and β-Lg were obtained from the research herd maintained at the Department of Economic Development, Jobs, Transport and Resources (DEDJTR) at Ellinbank, Victoria, Australia (latitude 38°14′ S, longitude 145°56′ E). In general, cows of Holstein-friesian breed were managed as a single herd following typical management practices for this region and grazed perennial ryegrass pasture supplemented with cracked wheat grain offered in the dairy and pasture silage in the paddock. The average age, days in lactation, number of lactations and average seven days milk for the twelve cow groups can be found in Table 1.
Twelve groups of cows were selected based upon their κ- and β-CN and β-Lg genetic variants determined by peak retention time using an established Reversed-Phase High-Performance Liquid Chromatography (RP-HPLC) technique [17]. The genetic profiles were chosen as the best representative variants from the Ellinbank research herd of cows. For example, κ-CN BB and β-Lg AA are rare phenotypes and we could not find all the variants needed to be able to include full complementary sets. Where possible each group contained at least five cows. However, for the rare BB variants of κ-CN required for groups 7 and 8, only two and one cows could be identified, respectively. The twelve milk groups are listed in Table 1.
Milk was collected from each cow at consecutive evening (stored under refrigerated conditions until the following morning) and morning milkings, pooled into groups according to the protein variant profile, cooled to 4 °C then transported under to the CSIRO Werribee site immediately.
The pooled milk samples were first skimmed using a Westfalia Separator (model MTA 20-03-024, GEA Westfalia, Thomastown, Victoria, Australia) and then their proximate composition for protein and lactose were measured using a LactoScope FTIR 20 (Delta Instruments, Drachten, The Netherlands). Because protein concentration is known to effect gelation rates, the milk samples were standardized so all were equal to the group with the lowest protein concentration (G7) using a standard milk permeate obtained from Murray Goulburn Cooperative in Victoria.
These experiments were conducted in accordance with the Australian Code of Practice for the Care and Use of Animals for Scientific Purposes (National Health and Medical Research Council (Canberra, Australia) 2004). Approval to proceed was obtained from the DEPI Agricultural Research and Extension Animal Ethics Committee.

2.3. Nitrogen and Mineral Analysis

The nitrogen contents were analyzed using the TruMac nitrogen determinator (TruMac® N, LECO Corp. St. Joseph, MI, USA). The protein content was calculated as N × 6.38. Mineral analyses (calcium, Ca; potassium K; magnesium Mg; sodium, Na; phosphorus, P) of initial skim milk samples and supernatants (monthly) was carried out using inductively coupled plasma optical emission spectrometer (ICP-OES-730, Agilent, Mulgrave, Victoria, Australia). Samples (3 g) were dispersed in 5 mL concentrated nitric acid (50%). The solution was transferred to a microwave tube and 5 mL of H2O2 was added before microwave digestion at 900 W with a 15 min ramp, 15 min hold and then cooling. The max temp was 240 °C and the max pressure was 60 bars (Multiwave 3000, Anton Paar GmbH, Graz, Austria). The digested solutions were transferred and made up to 50 mL with a cesium solution. The final solution contained 5 g cesium chloride/L as an internal reference. Cesium is added to improve accuracy by ionization suppression of easily ionized elements such as Na or K.

2.4. Processing and Storage Conditions

The UHT milk was prepared using a pilot scale plant located at the CSIRO Food Innovation, Werribee, Australia. Raw milk was preheated to 75 °C prior to UHT treatment at 140 °C for 5 s using a tube in tube heat exchanger plant and collected directly into sterile 500 mL plastic containers and stored at a constant 23 °C. At each time point, including before UHT treatment, two containers for each group were used for the analyses with one taken for the metagenomic and proteomic and the other for all other analyses. Following photography of the samples, the samples were well mixed by inversion before performing each analysis.

2.5. Microbial Total Plate Count Analysis

Serial dilutions of the raw standardized skim milk were made using Maximum Recovery Diluent (MRD, CM0733, Oxoid Limited, Hampshire, UK) and plated on Plate Count Agar and grown at 30 °C for 72 h before counting the total number of colonies.

2.6. Viscosity Measurements

The change in viscosity as a function of shear was measured for each milk sample using a Paar-Physica 302 (Anton Paar GmbH, Graz, Austria) fitted with a cup and bob geometry. Duplicate measurements were performed for each time point at 20 °C using a shear-rate sweep mode from 1 to 1000 s−1. Apparent viscosity at a shear rate of 48.3 s−1 is used for the measurements.

2.7. Dynamic Light Scattering

Milk samples were diluted 1:100 using deionized water before casein micelle size measurements were made at 25 °C using a Malvern Zetasizer Nano ZS (Malvern Instruments, Malvern, UK). Water was used as the diluent as it was not found to alter micelle size compared to using permeate for dilution. The refractive index for the casein micelle and water were 1.57 and 1.33, respectively [25]. A cumulate analysis correlation function was used to obtain the intensity mean diameter (z-average diameter). All samples were measured in triplicate and the data quality was checked using the internal software data quality check.

2.8. Cryo-Transmission Electron Microscopy (Cryo-TEM)

A laboratory-built humidity-controlled vitrification system was used to prepare the samples for Cryo-TEM. Humidity was kept close to 80% for all experiments, and ambient temperature was 22 °C. Two-hundred-mesh copper grid coated with perforated carbon film (C-flat grids: Protochips, USA or lacey carbon film: ProSciTech, Thuringowa Central QLD, Australia) were glow-discharged for 3–4 s in nitrogen, then 4 μL aliquots of the sample were pipetted onto each grid prior to plunging. After 30 s adsorption the grid was blotted manually using Whatman 541 filter paper for 2 s. Blotting time was optimized for each sample. The grid was then plunged into liquid ethane cooled by liquid nitrogen. Frozen grids were stored in liquid nitrogen until required.
The samples were examined using a Gatan 626 cryoholder (Gatan, Pleasanton, CA, USA) and Tecnai 12 Transmission Electron Microscope (FEI, Eindhoven, The Netherlands) at an operating voltage of 120 kV. At all times low dose procedures were followed, using an electron dose of 8–10 electrons/Å2 for all imaging. Images were recorded using a FEI Eagle 4k × 4k charge-coupled device (CCD) camera using magnifications of 15,000×.

2.9. Plasmin Activity

Plasmin activity measurements were adapted from [26] for use in a 96 well plate format. Briefly, 7.5 mL of skimmed milk were mixed with 2.5 mL 0.4 M sodium citrate solution to disrupt the casein micelles and centrifuged at 100,000 g for 1 h at 4 °C. Three 1 mL aliquots were removed from below the fat layer and stored at −80 °C until the analysis. Following defrosting, 50 µL of sample was placed in a Perkin Elmer Optiplate 96F and mixed with 110 µL of 0.05 M Tris buffer pH 7.5 and left to equilibrate for 5 min at room temperature. Forty microliters of 0.2 mM coumarin peptide was added to each sample and measurements were performed every 30 s for 45 min using an excitation and emission wavelengths of 360 and 460 nm, respectively. A linear regression was performed on the data and compared to the standard curve generated from 0–0.5 µM AMC peptide. All measurements were performed in triplicate.

2.10. pH Measurements

The milk sample pH was measured in duplicate at 20 °C using a PHM 93 Reference pH Meter (Radiometer, Copenhagen, Denmark) with a 2-point calibration (pH 4 and pH 7).

2.11. Microbial Population Analysis Using Metagenomics

Genomic DNA was isolated from whole microbial populations in the milk samples based on [27]. Briefly, Triton-X100 detergent was added to the milk to 1% v/v to lyse bovine cells and dissolve fat globules. Microbes were pelleted by centrifugation at 3220 g and suspended in saline. Casein micelles were solubilized and removed by the addition of Ethylenediaminetetraacetic acid (EDTA), further centrifugation and saline washes. Genomic DNA was extracted using a QIAamp DNA Mini Kit (Qiagen, Chadstone Centre, Victoria, Australia).
Variable region 4 from the prokaryote 16s rRNA gene was amplified by polymerase chain reaction (PCR) using the F515/R806 primers (5′-GTGCCAGCMGCCGCGGTAA-3′/5′ -GGACTACHVGGGTWTCTAAT-3′) [28]. The Illumina MiSeq system was used to generate DNA sequence data from the PCR fragments (251 × 2 cycles, paired-end sequencing), according to the manufacturer’s instructions. The unprocessed DNA sequence fastq files are available on the figshare website (https://figshare.com/s/c9e963c8fe0fef4089a2).

2.11.1. Processing of 16s V4 amplicon DNA Sequences

After initial manual examination of DNA sequence quality score by base position plots using fastQC (Babraham Bioinformatics, Babraham Institute, Cambridge, UK), processing of DNA sequence fastq files was carried out with scripts in a linux environment using bash utilities. For initial sequence processing, pairs of files in fastq format from MiSeq paired end (PE) sequencing, containing overlapping 5′ or 3′ end sequences were assembled using the PANDAseq program [29], relying on PANDAseq for alignment-based quality filtering. Assembled sequence pairs were retained if they contained both 5′ and 3′ PCR primer sequences at their ends (using regular expressions based on the above sequences). Primer sequences were then removed from the sequence ends and sequences rejected if an ambiguous base (an N character) was present anywhere in the assembled sequence. Basic Unix utilities such as grep, gawk, sort and uniq were then used to group and count replicate (100% identical) sequences, creating files of de-replicated, unique, sequences in FASTA format. See Table S1 for a summary of 16 s sequence diversity.
MegaBLAST [30] was used to compare the 16s V4 amplicon DNA sequences to the Greengenes ribosomal RNA gene sequence database (August 2013 version, ftp://greengenes.microbio.me). A bash script was used to parse the BLAST output file, extracting the query name, count and percent identity to a Greengenes sequence. Blast parameters were set such that sequence alignments must be full length (253 bases) and of at least 97% identity to be accepted, otherwise being classified as no hits. This process also eliminates chimeric sequences except potentially where a sequence in the Greengenes database is itself a chimera. Python scripts were used to construct sample by taxon abundance counts tables. Taxonomies were assigned based on the Greengenes rRNA OTU database. The counts tables are in the standard data frame format for R and are imported into various R scripts for analysis. Bash and python scripts for carrying out the above procedures, and R scripts used for further analysis and plotting, are available from the authors (KWS).

2.11.2. Analysis of 16s V4 Sequences

R scripts were used for analysis of abundance data, calculation of Shannon species diversity index using the vegan R package [31] and Chao1 species richness estimates (Table S1) using the fossil R library [32]. Base R functions were used, together with functions from the permute and lattice libraries [33]. A stacked bar chart was plotted, using base R functions, of the 20 most abundant bacterial families in all milk samples from each protein group over the 9 months experiment. Differentially abundant bacterial species (viscous versus non-viscous) were identified using the edgeR library in R [34]. Species selected as differentially abundant for further analysis had a false discovery rate less the 0.02 and fold change greater than 3. The abundance of these species was visualized using a heatmap in R. As above, all scripts are available on request from the authors (KWS).

2.12. Top-Down Proteomics Analysis by Liquid Chromatography–mass Spectrometry (LC-MS) and Liquid Chromatography–tandem Mass Spectrometry LC-MS/MS

Sample preparation and liquid chromatography–mass spectrometry (LC-MS) analysis using myoglobin as internal standard (IS) was as described in [35], yet data processing was modified as explained hereafter.
The data files obtained following LC-MS analysis were processed in the Refiner MS module of Genedata Expressionist® 10.5 with the following parameters: chromatogram lock mass using the IS ion series, retention time (RT) range restriction from 3 to 25 min, baseline subtraction using a 80% Quantile method with a 10 m/z window, spectrum smoothing using the Savitzky-Golay algorithm with 7 points for the m/z window and a polynomial order of 3, a chromatogram noise subtraction with a 41 scans RT window 50% Quantile and a clipping below an intensity of 200, an RT alignment using a Pairwise Alignment Based Tree method with 50 scans search intervals, a peak detection using a Curvature-based Intensity-weighed (70% intensity) and Inflection Points method, isotope clustering using a Peptide Isotope Shaping method with 2 to 25 charges log-ratio distance measure, and a charge and adduct grouping using a 50 ppm mass tolerance 1 min RT tolerance and a dynamic adduct list of protons, sodium and potassium neutrals.
The protein mapping was performed in Refiner MS using a text file containing all the AA sequences in FASTA format of the bovine allelic variants of milk caseins, alpha-lactalbumin and beta-lactoglobulin (Farrell et al., 2004) with the following variables modifications: carboxymethyl (K), pyro-Glu (N-term Q), Hex(2) (K), Allysine (K), Oxidation (M), and Phospho (ST).
Quantitative data (volumes) and annotations were then exported to the Analyst module of Genedata Expressionist® to perform statistical analyses. To account for protein content variation in the different milk samples and variation during the LC-MS run, the volumes were normalized using the protein concentrations of the milk samples and the volume of the IS. Principal Component Analyses (PCA), Partial Least Square (PLS) analyses, two-dimensional Hierarchical Clustering Analyses (2-D HCA), Self-Organizing Maps (SOM), Generalized Linear Model (GLM) and correlation analyses using viscosity measurements were then performed.
LC-MS/MS experiments were performed on the last collection point (12 samples) using the same LC parameters and MS1 parameters on the Q-TOF mass spectrometer as described in [35]; however top-down MS/MS fragmentation steps using CID were added as follows. The Auto MS/MS mode was activated for two precursors per 3 s cycle time with an absolute threshold of 2550 counts, with Active Exclusion after three spectra and release after 5 min. The quadrupole Ion Energy was set at 5 eV and the collision cell energy was set at 10 eV with a 120 μs transfer time and pre-pulse storage for 10 μs. Data were processed in Refiner MS as described above and additional steps of 1/ a MS/MS consolidation using 0.1 Da m/z 0.1 min windows, no consolidation strategy and MS/MS peak filter, with extended peak boundaries and the nearest algorithm, and 2/ MS/MS deisotoping using a 0.05 Da m/z tolerance, a Peptide Isotope Shaping method with one to five charges, a log-ratio distance measure, and variable charge dependency cluster size restriction.
Top-down sequencing annotation was performed in Refiner MS by using the Peptide Mapping activity with a 10 ppm mass tolerance, unspecific cleavage, and the variable modifications detailed above. Annotations of peptide and intact proteins were consolidated in the Analyst module.
All MS and MS/MS files are available from the stable public repository MassIVE hosted at the Centre for Computational Mass Spectrometry of the University of San Diego (San Diego, CA, USA) (http://massive.ucsd.edu/ProteoSAFe/datasets.jsp, Accession Number: MSV000081618).

3. Results

3.1. Milk Parameters

The milk parameters for the twelve groups are summarized in Table 1. These parameters show that all the milk groups generally had similar initial parameters apart from the casein micelle diameter, which have previously shown to be related to the genetic variants of κ- and β-casein [36]. The initial microbial load of the milk groups ranged from 4.11 to 6.34 Log CFU/mL and their pH ranged from 6.61 to 6.87 (Table 1). The milk groups contained 3.08–3.21% protein. Milk samples were standardized to the milk with the lowest protein content (group 7, 3.08%) with commercial permeate.
A PCA was used to determine any relationships between the initial milk parameters and the groups (Figure S1). The PCA clusters plasmin activity, the number of lactations and average age together, opposite to Log CFU. The analysis shows groups 7 and 12 to be different from the other groups, due to initial milk pH and Log CFU, as well as days in lactation and average age for the cows.

3.2. Protein Genetic Variant Differences

Using chromatographic peak areas (Figure S2 and Table S2), the relative concentrations of the major milk proteins in each milk group was computed (Table S3). Milk groups containing the B variant of κ-CN (groups 7–12) contained significantly (p = 0.001) more total κ-CN (14.2% ± 1.7 vs. 10.5% ± 0.8) than milk groups homozygous for A κ-CN (groups 1–6), and also significantly more non-glycosylated (7.2% ± 0.8 vs. 5.1% ± 0.5) (p = 0.001) and glycosylated (7.0% ± 1.1 vs. 5.4% ± 0.6) (p = 0.01) κ-CN (Table S4). Milk groups homozygous for B β-Lg (groups 2, 4, 6, 8, 10 and 12) contained significantly (p = 0.0001) lower amounts of total β-Lg (11.3% ± 0.9 vs. 14.6% ± 0.7).

3.3. Plasmin Activity

The endogenous plasmin activity of the raw milk samples varies among groups (Table 1). Groups 7𲀓9 contain the highest plasmin activity. Post-UHT treatment, plasmin activity was not detectable in any of the milk samples at any stage of the storage trial, indicating that the UHT treatment had destroyed any residual plasmin activity, although plasminogen may still be present. (data not shown).

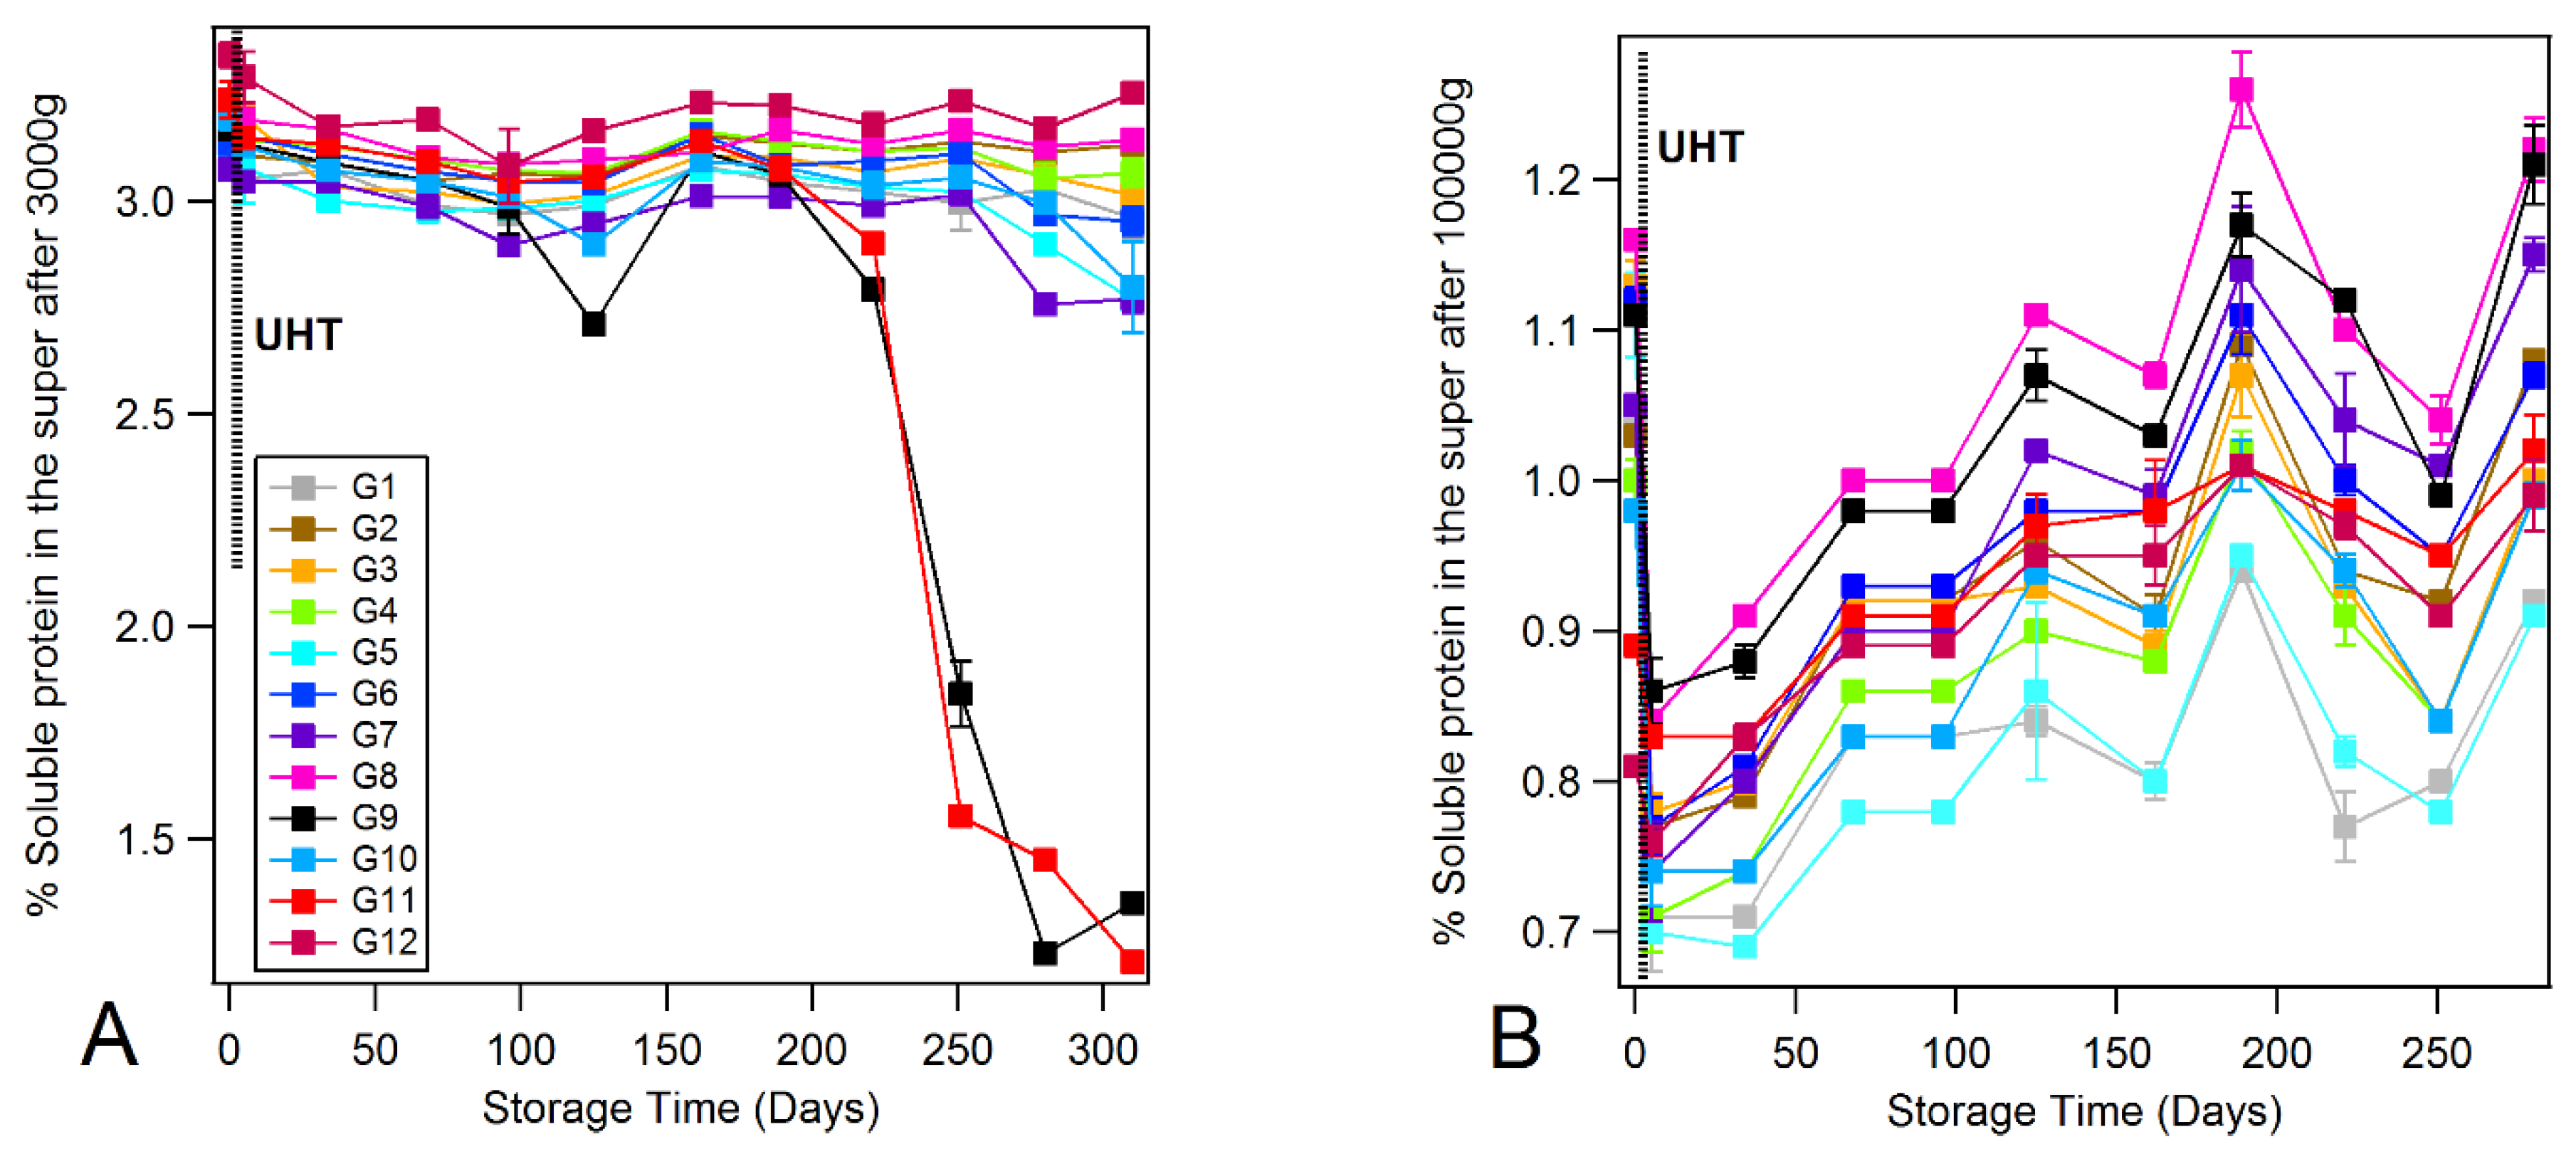
3.4. Monitoring the Protein Solubility State

The balance between the soluble and insoluble phases and the casein and non-casein protein phases were established at each time point using a low (3000 g) and high (100,000 g) centrifugation speed, respectively, and measuring the nitrogen content of the supernatant (Figure 1).
Under low speed centrifugation, a stable milk should remain fully suspended and not form large aggregates. As can be seen in Figure 1A, groups 9 and 11 start to lose soluble proteins by day 221. By day 251 they have lost considerably more soluble proteins, indicating that groups 9 and 11 have formed large insoluble aggregates as the age gelation process has progressed. On the other hand, when the groups were centrifuged at high speed to pellet the casein micelles, all groups behaved similarly, that is, an initial loss of soluble proteins post-UHT treatment due to the denaturation of β-Lg and movement to the surface of the casein micelles, as evidenced by the loss of β-Lg from the pH 4.6 soluble fraction as analyzed by RP-HPLC (data not shown), followed by the development of progressively more soluble protein due to peptide formation from protease activity with storage time (Figure 1B). The percentage of increase soluble peptides was calculated from the centrifugation data (Figure S3). Groups containing only BB β-Lg and AA κ-CN (2, 4, 6) within groups 1–6 display an increase in soluble peptides, and therefore more prone to proteolytic activity. We do not observe a relationship between the increase in soluble peptides and age gelation, indicating that the total amount of protein hydrolysis is not associated with age gelation.

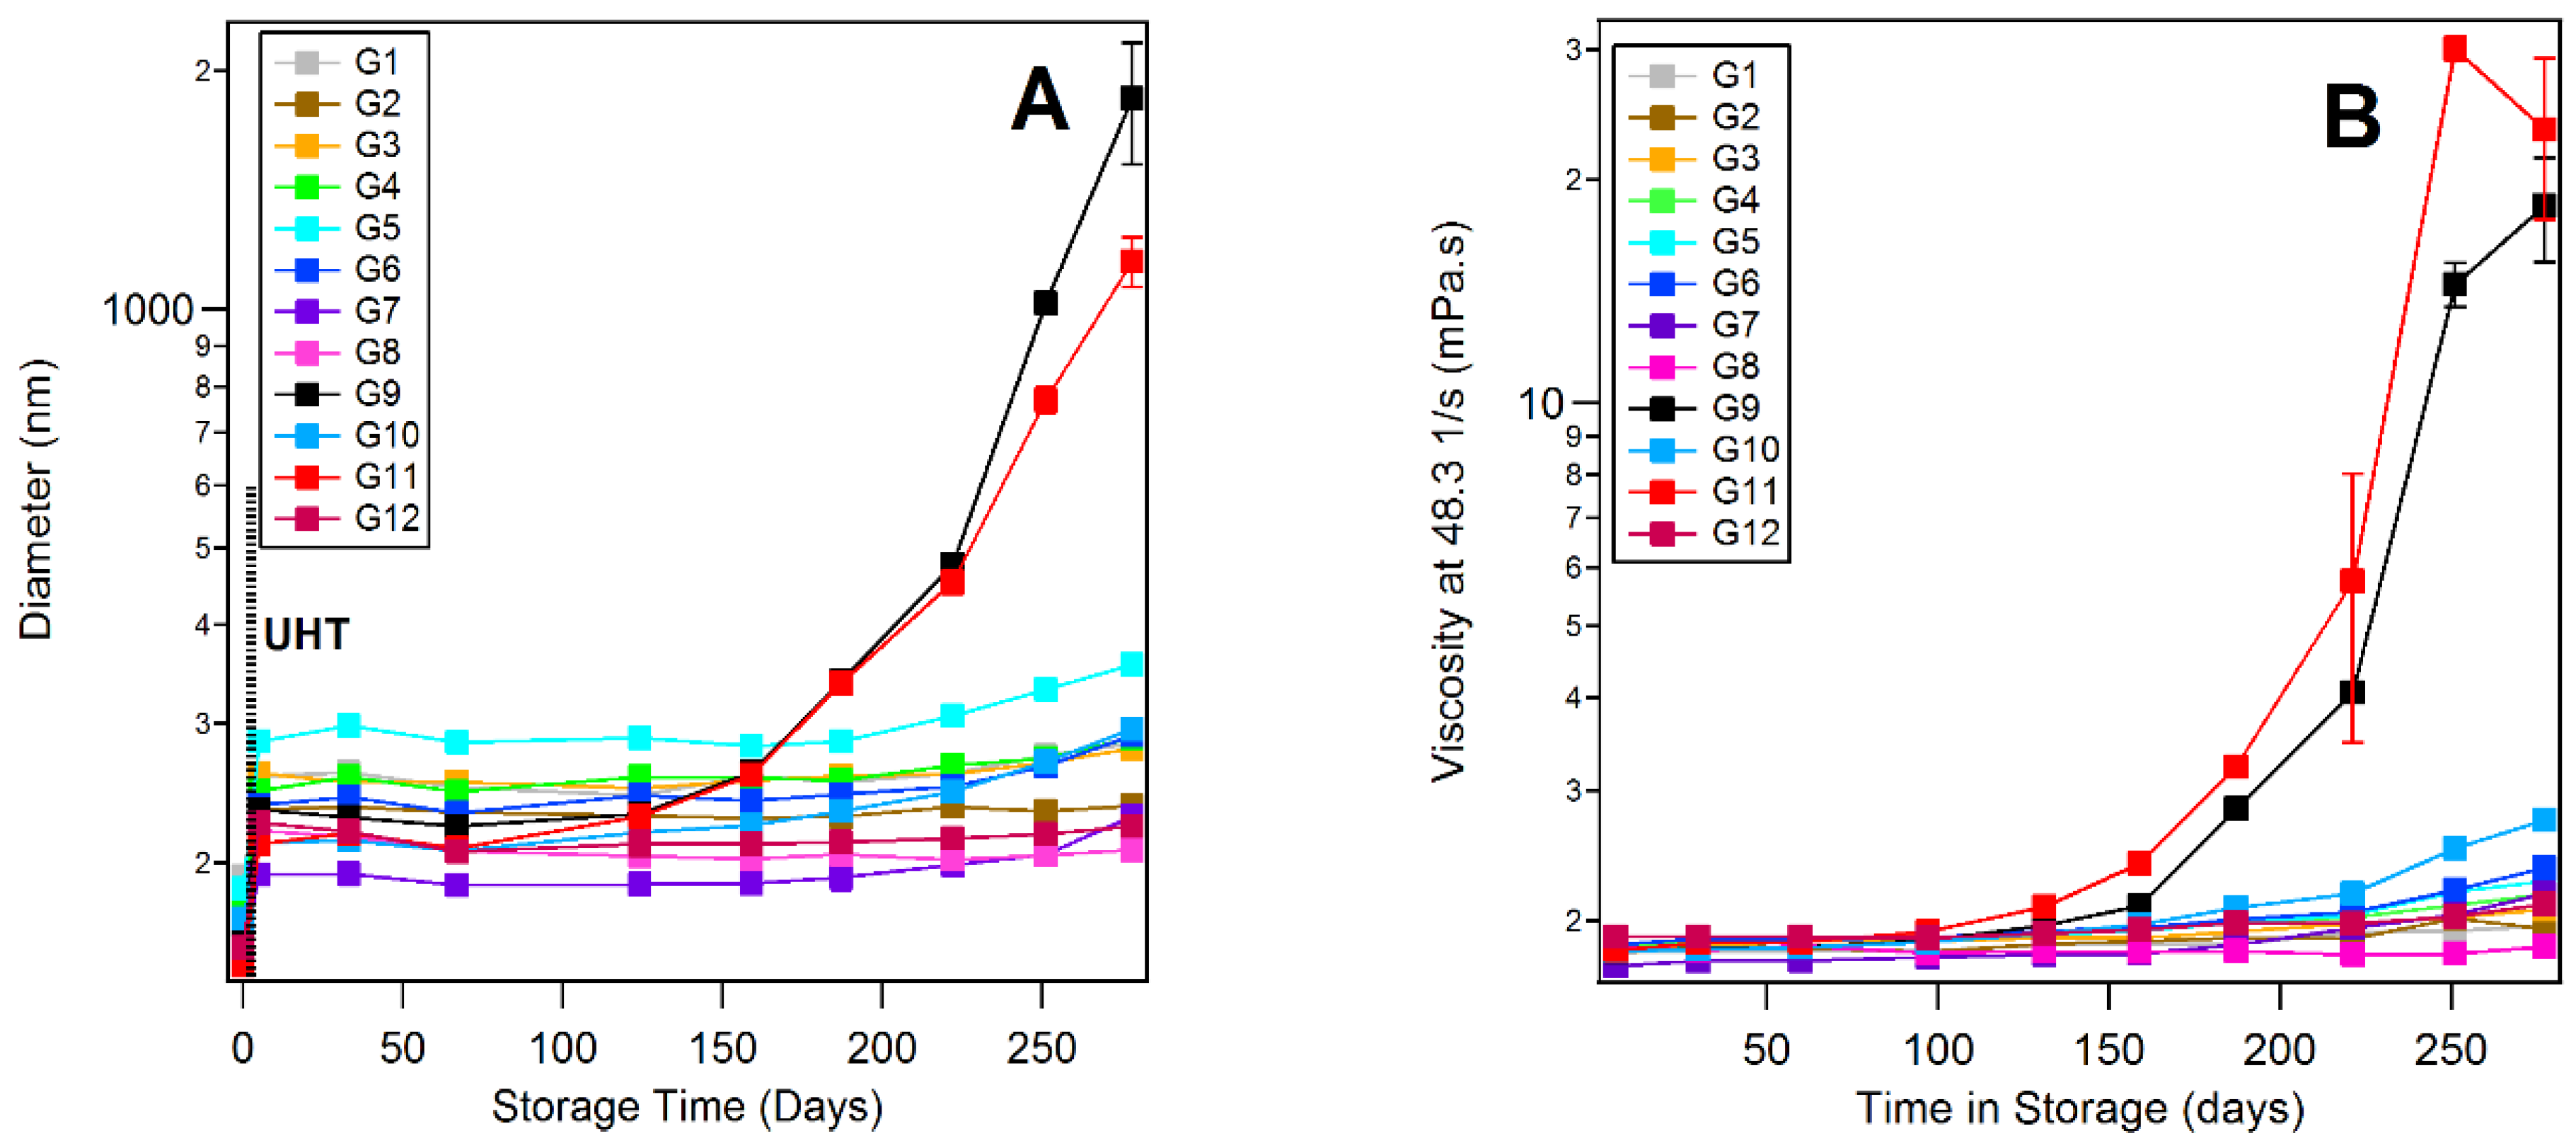
3.5. Dynamic Light Scattering and Rheology of Milk Samples

Dynamic light scattering (DLS) was used to monitor the size of casein micelles and the formation of protein aggregates with storage time (Figure 2A).
Micelle sizes of all groups increased directly post-UHT treatment, in agreement with the loss of β-Lg from the soluble phase to the surface of the casein micelles due to denaturation as demonstrated by RP-HPLC. DLS also confirms an expected increase in size of the casein aggregates of group 9 and 11 which led to their loss of solubility.
Age gelation of milk is accompanied by an increase in the viscosity of the milk which was monitored over time using rheology (Figure 2B). Groups 9 and 11 showed a marked increase both in their viscosities and micelle size starting from day 159 relative to the other groups, indicating that the milk had formed a gel. This confirms our observations from DLS and the amount of soluble nitrogen when centrifuged at 3000 g.

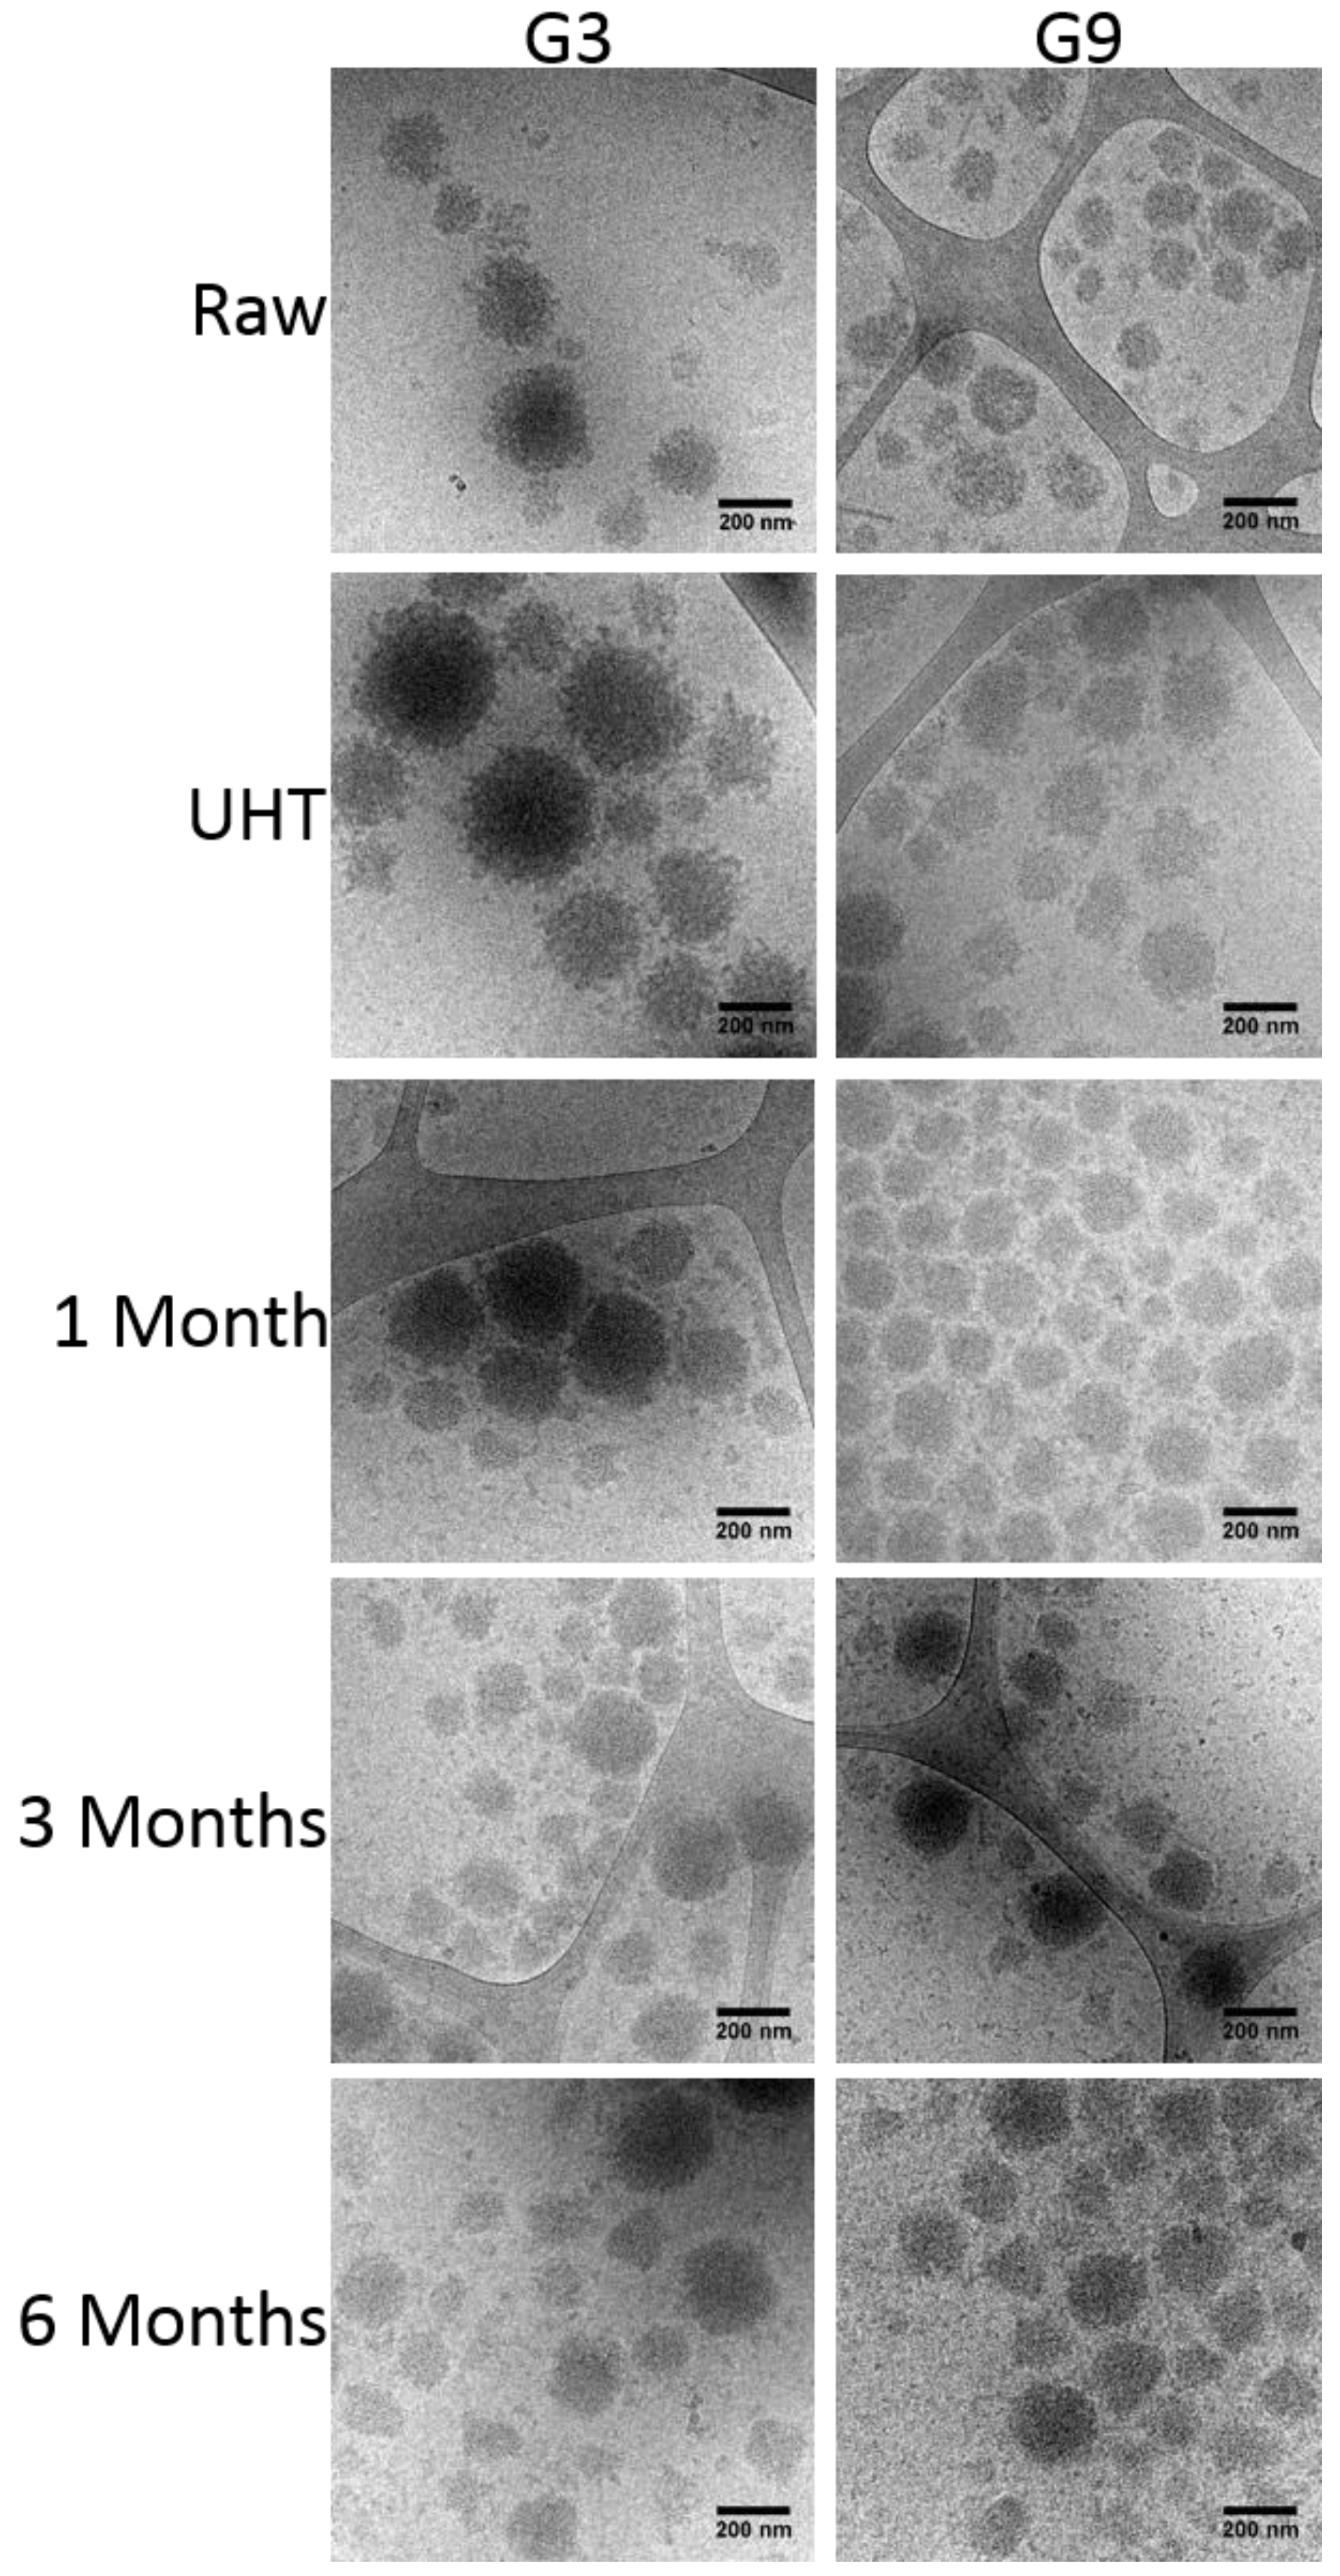
3.6. Cryo-Transmission Electron Microscopy (Cryo-TEM)

The progression of morphological changes to the casein micelles were investigated using Cryo-TEM. Using groups 3 and 9 as representative examples of milks that were stable and unstable, respectively, the sizes of casein micelles in raw milk range from 50–400 nm and display a relatively smooth surface, but no obvious differences (Figure 3).
Post-UHT small proteins can be seen to assemble on the surface of the micelles in both groups, and again there are no obvious morphological differences between the stable (group 3) and unstable (group 9) milks. This has been linked to the denaturation of β-Lg and interaction with κ-casein on the surface of the casein micelles [13].
During storage, there is a progressive increase in the background electron density for both the stable (group 3) and unstable (group 9) milks over storage time, and in some micrographs the appearance of small linear fibers is observed (Figure S4). Comparing group 3 to 9, there is no obvious morphological differences pre- and post-gelation, indicating that the morphology of the casein micelles does not differ between stable and unstable milks before gelation occurs. Because preparation of the TEM grids was not possible after gelation had occurred, there is no micrograph of the later time points.

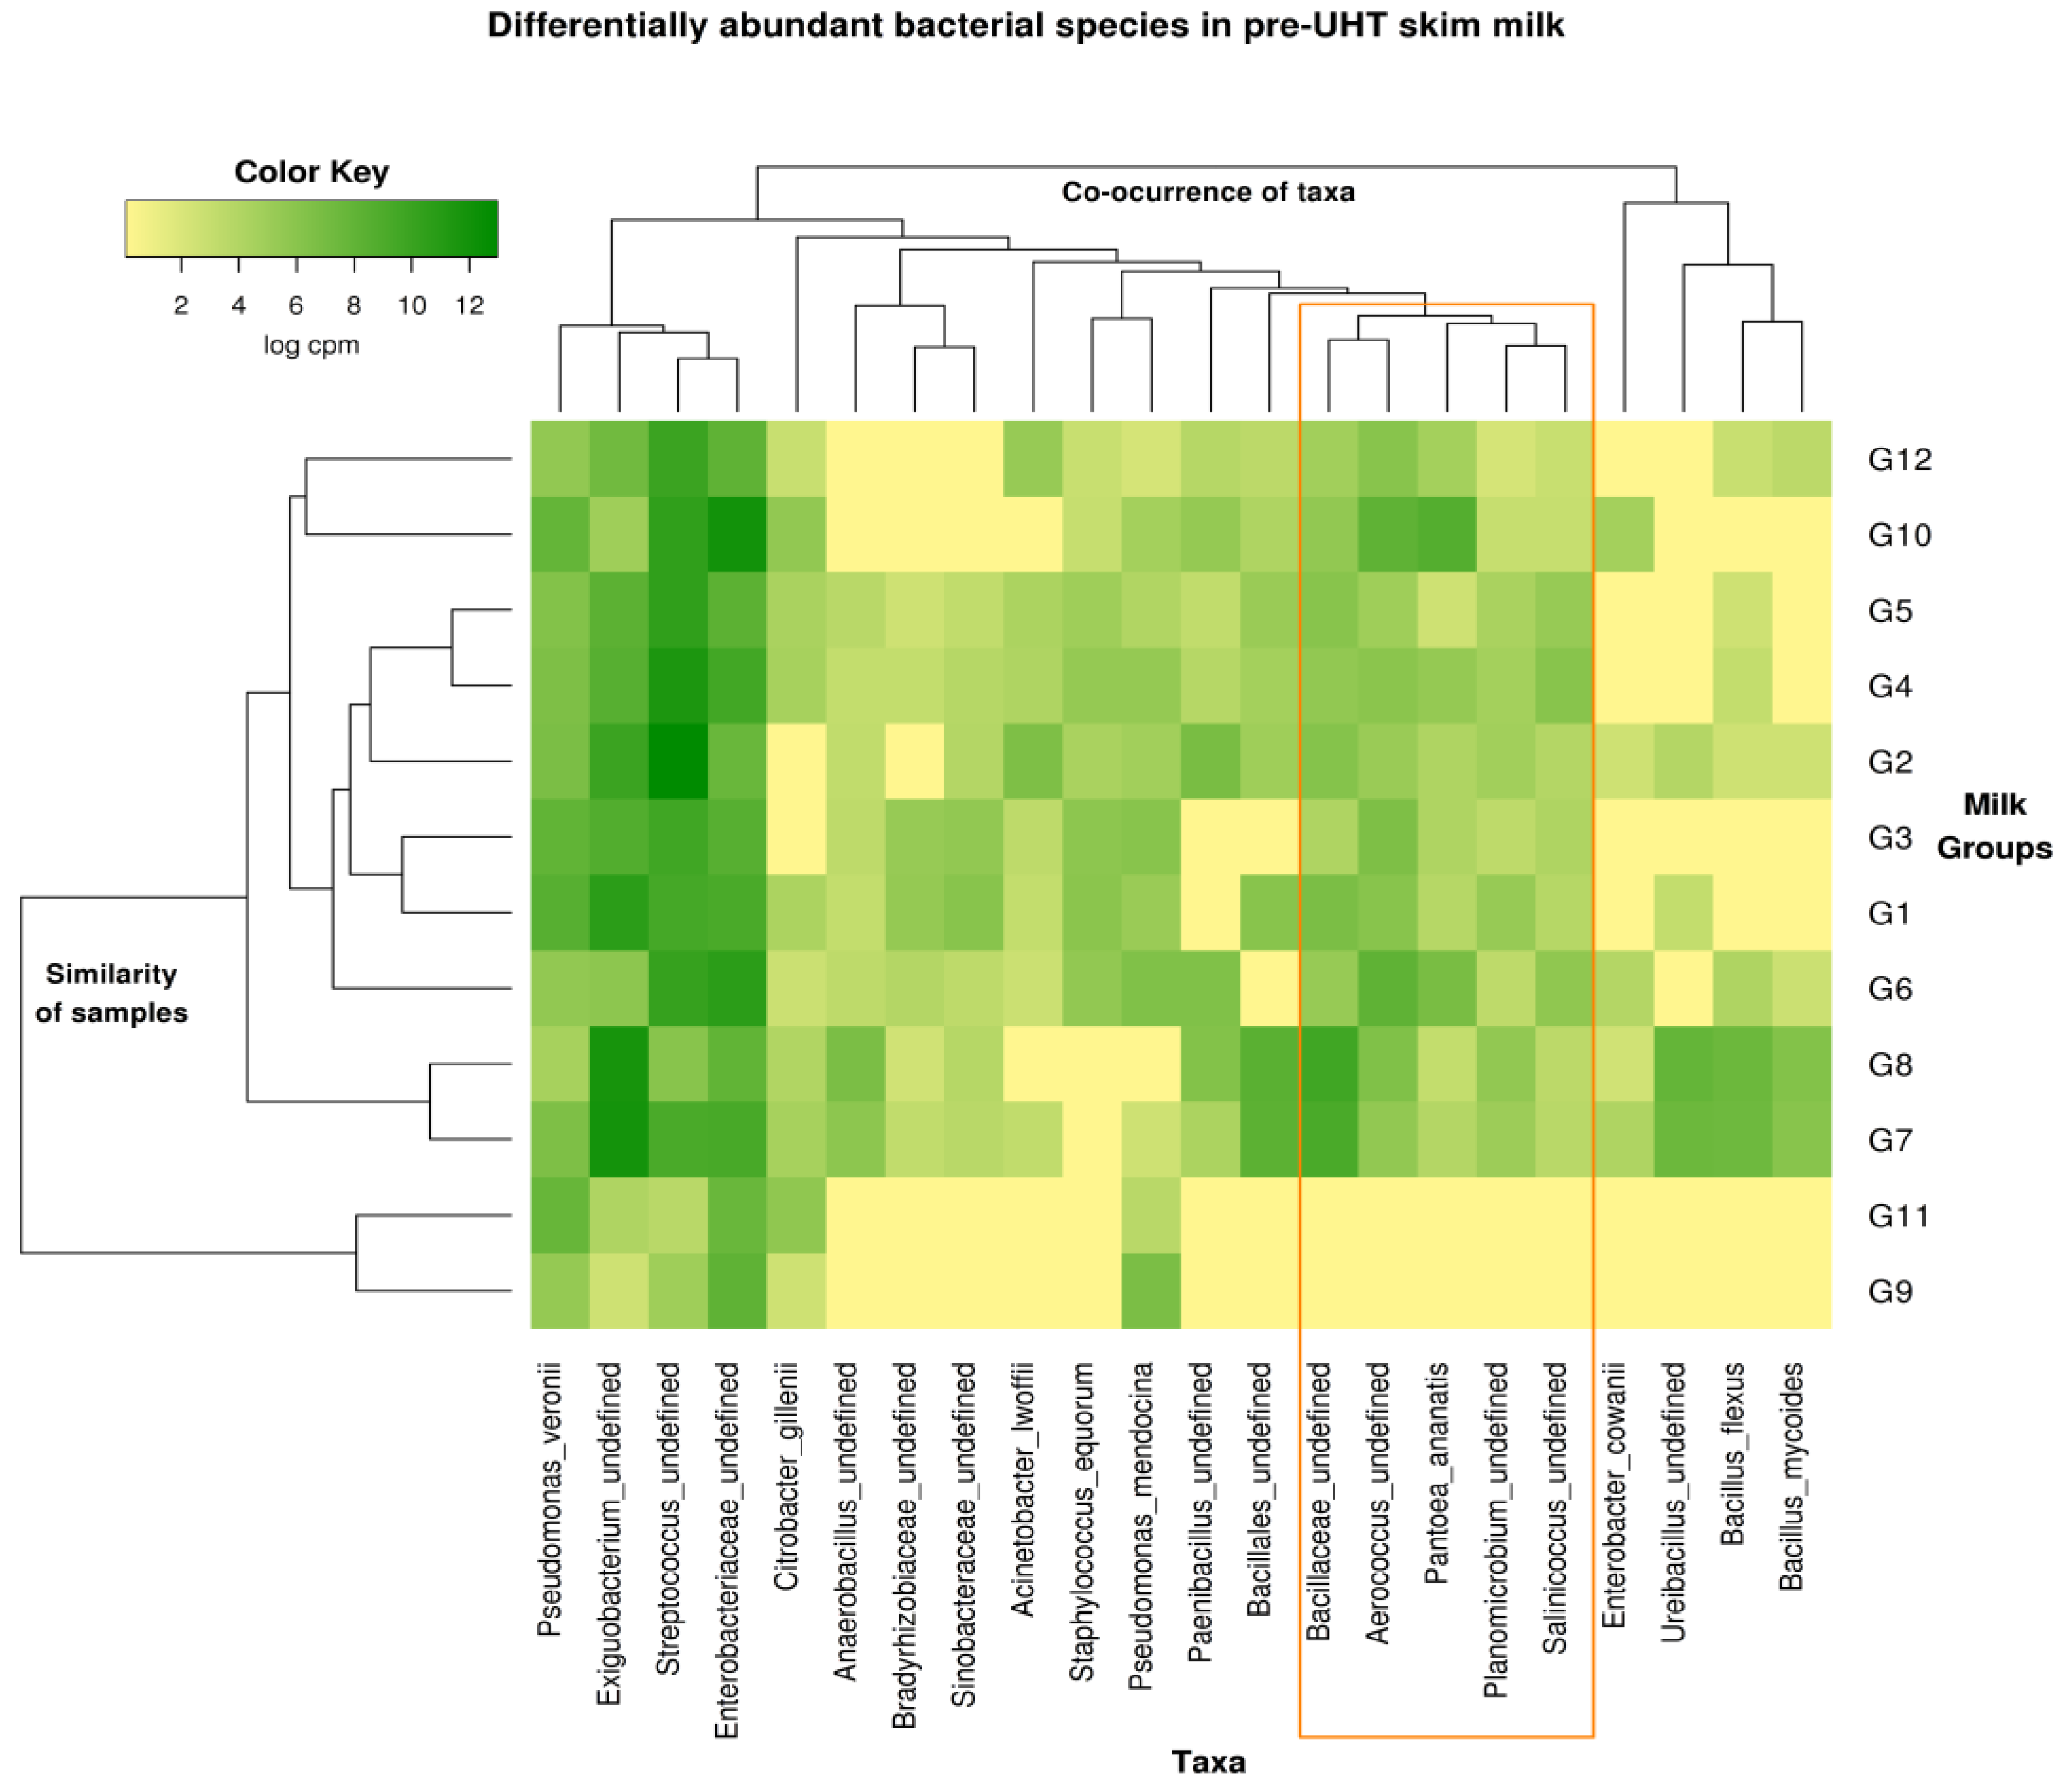
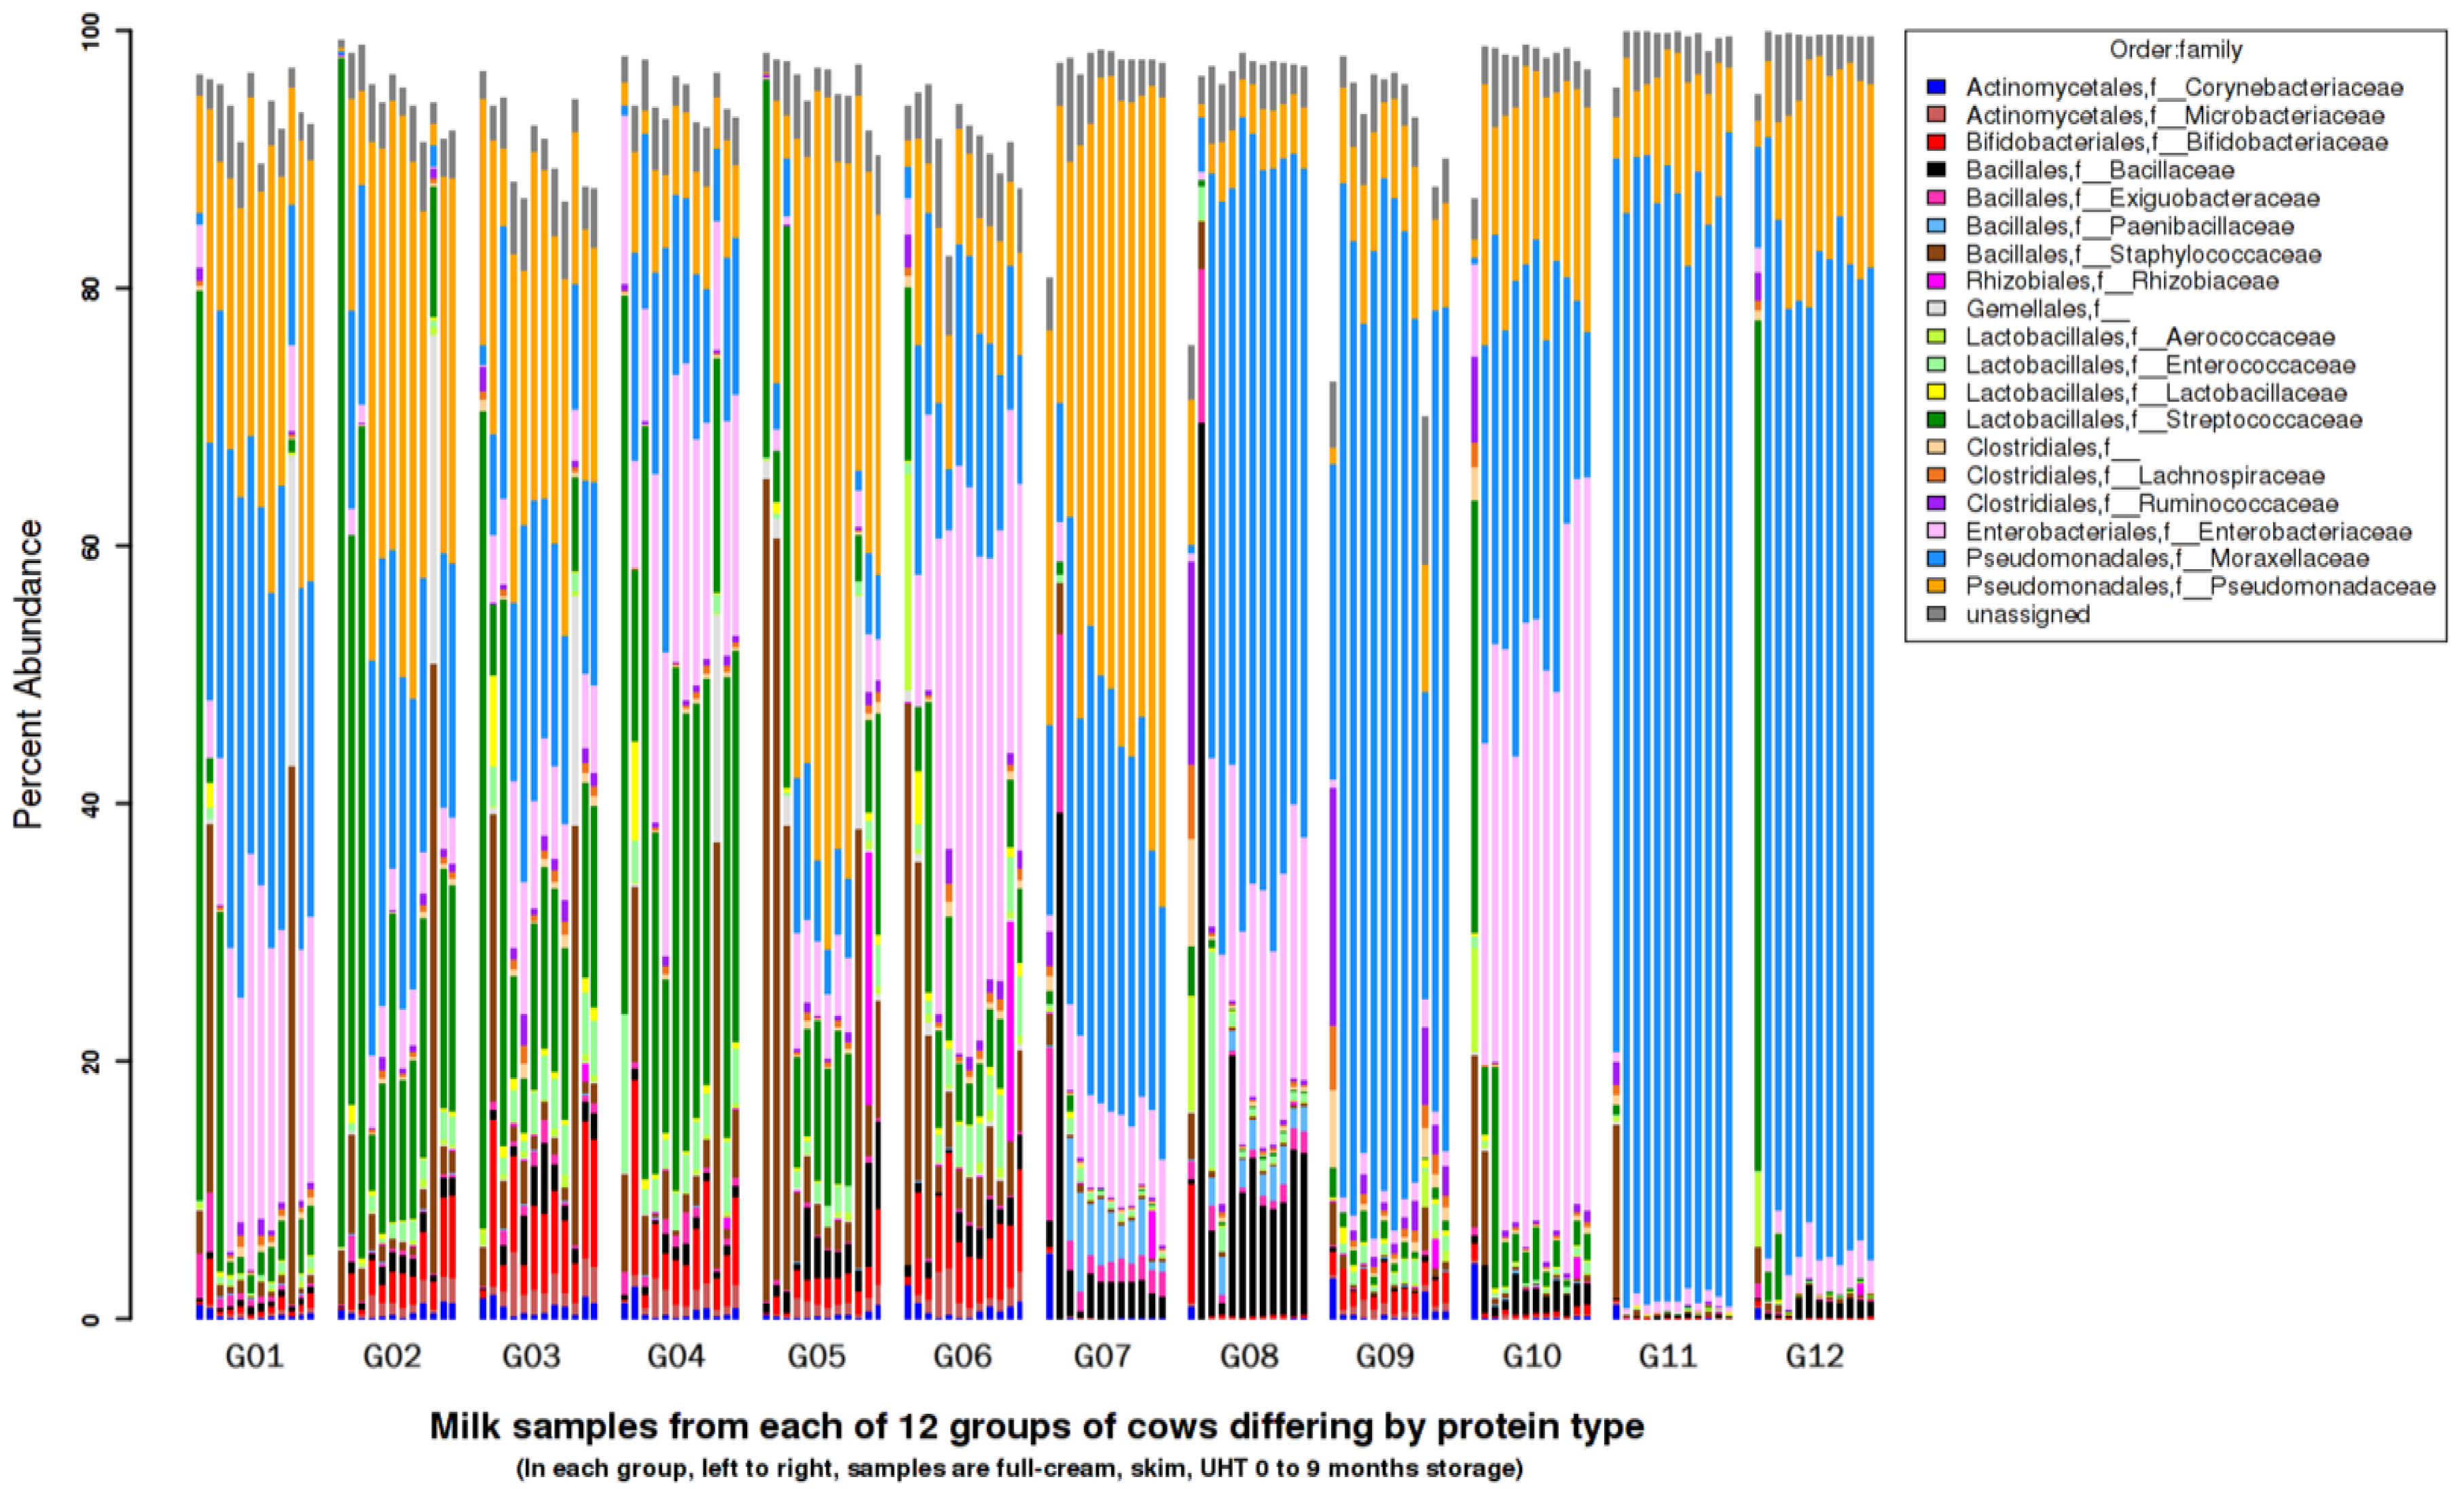
3.7. Metagenomics Microbial Population Analysis

Microbial population analysis by sequencing of amplified DNA fragments from variable region 4 (V4) of the bacterial 16s ribosomal RNA gene was undertaken to investigate any differences in the microbial communities present in the milk from viscous versus non-viscous groups. Initial Shannon diversity and Chao1 species richness calculations indicated reduced diversity in groups 11 and 12 (Table S1) but this does not explain the gelling behavior of groups 9 and 11. A bar plot of bacterial family abundances (as counts per million) from each milk sample (Figure 4) shows many family abundance differences across the various time points and protein groups.
In the bar plot (Figure 4), the Moraxellaceae (blue colour) dominate groups 9 and 11 and could be gelation-related but for their prevalence also in group 12. The Bacillaceae family is not visible in groups 9 and 11 (black colour) but is present in all other milk groups and as such may be correlated with lack of gelation. There are many genera in the Bacillaceae family, however, and an analysis at the family level may be insufficient to determine important differences.
The R package, edgeR, was used to compare groups of microbial populations (viscous versus non-viscous) by identifying differentially abundant taxa. A heatmap of the most differentially abundant taxa identified by edgeR (Figure 5) shows large variability in the abundance of a small number of different bacterial taxa across the twelve groups.
The two viscous groups (9 and 11) differ from the other ten groups by lacking a family and three genera from the Bacilli class, as yet undefined at the species level (Bacillaceae (f), Aerococcus, Planomicrobium and Salinicoccus), plus the Enterobacterium Pantoea ananatis. These are highlighted in Figure 5 by the orange box.

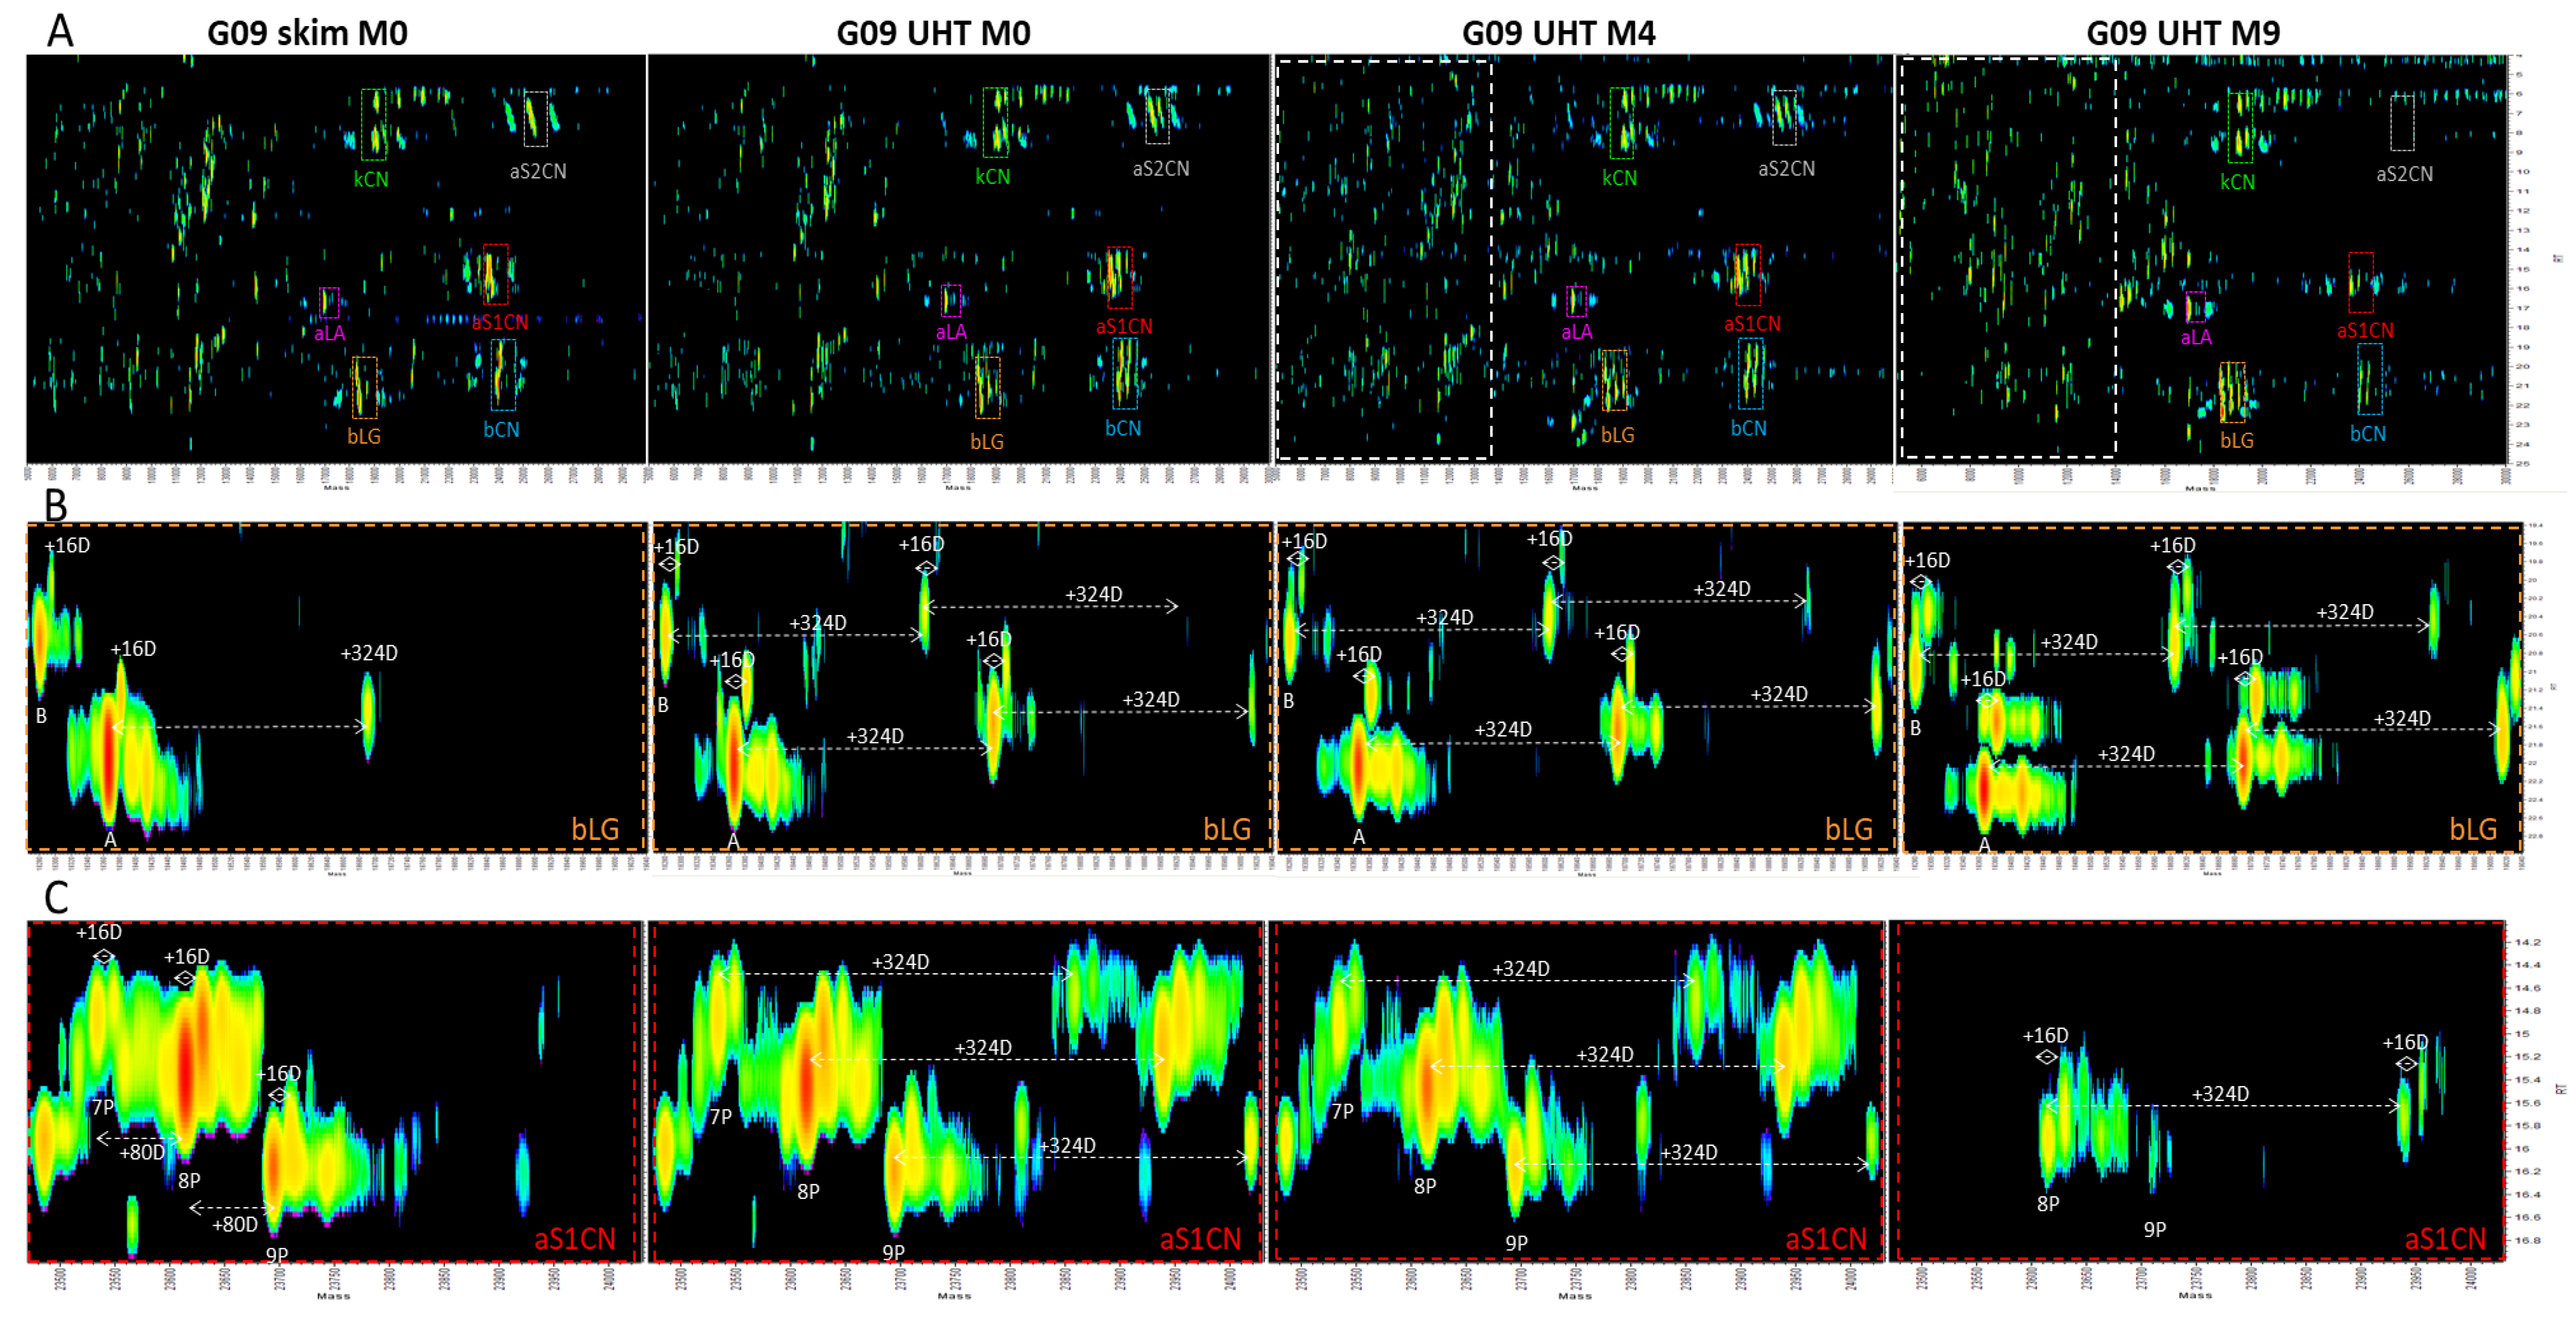
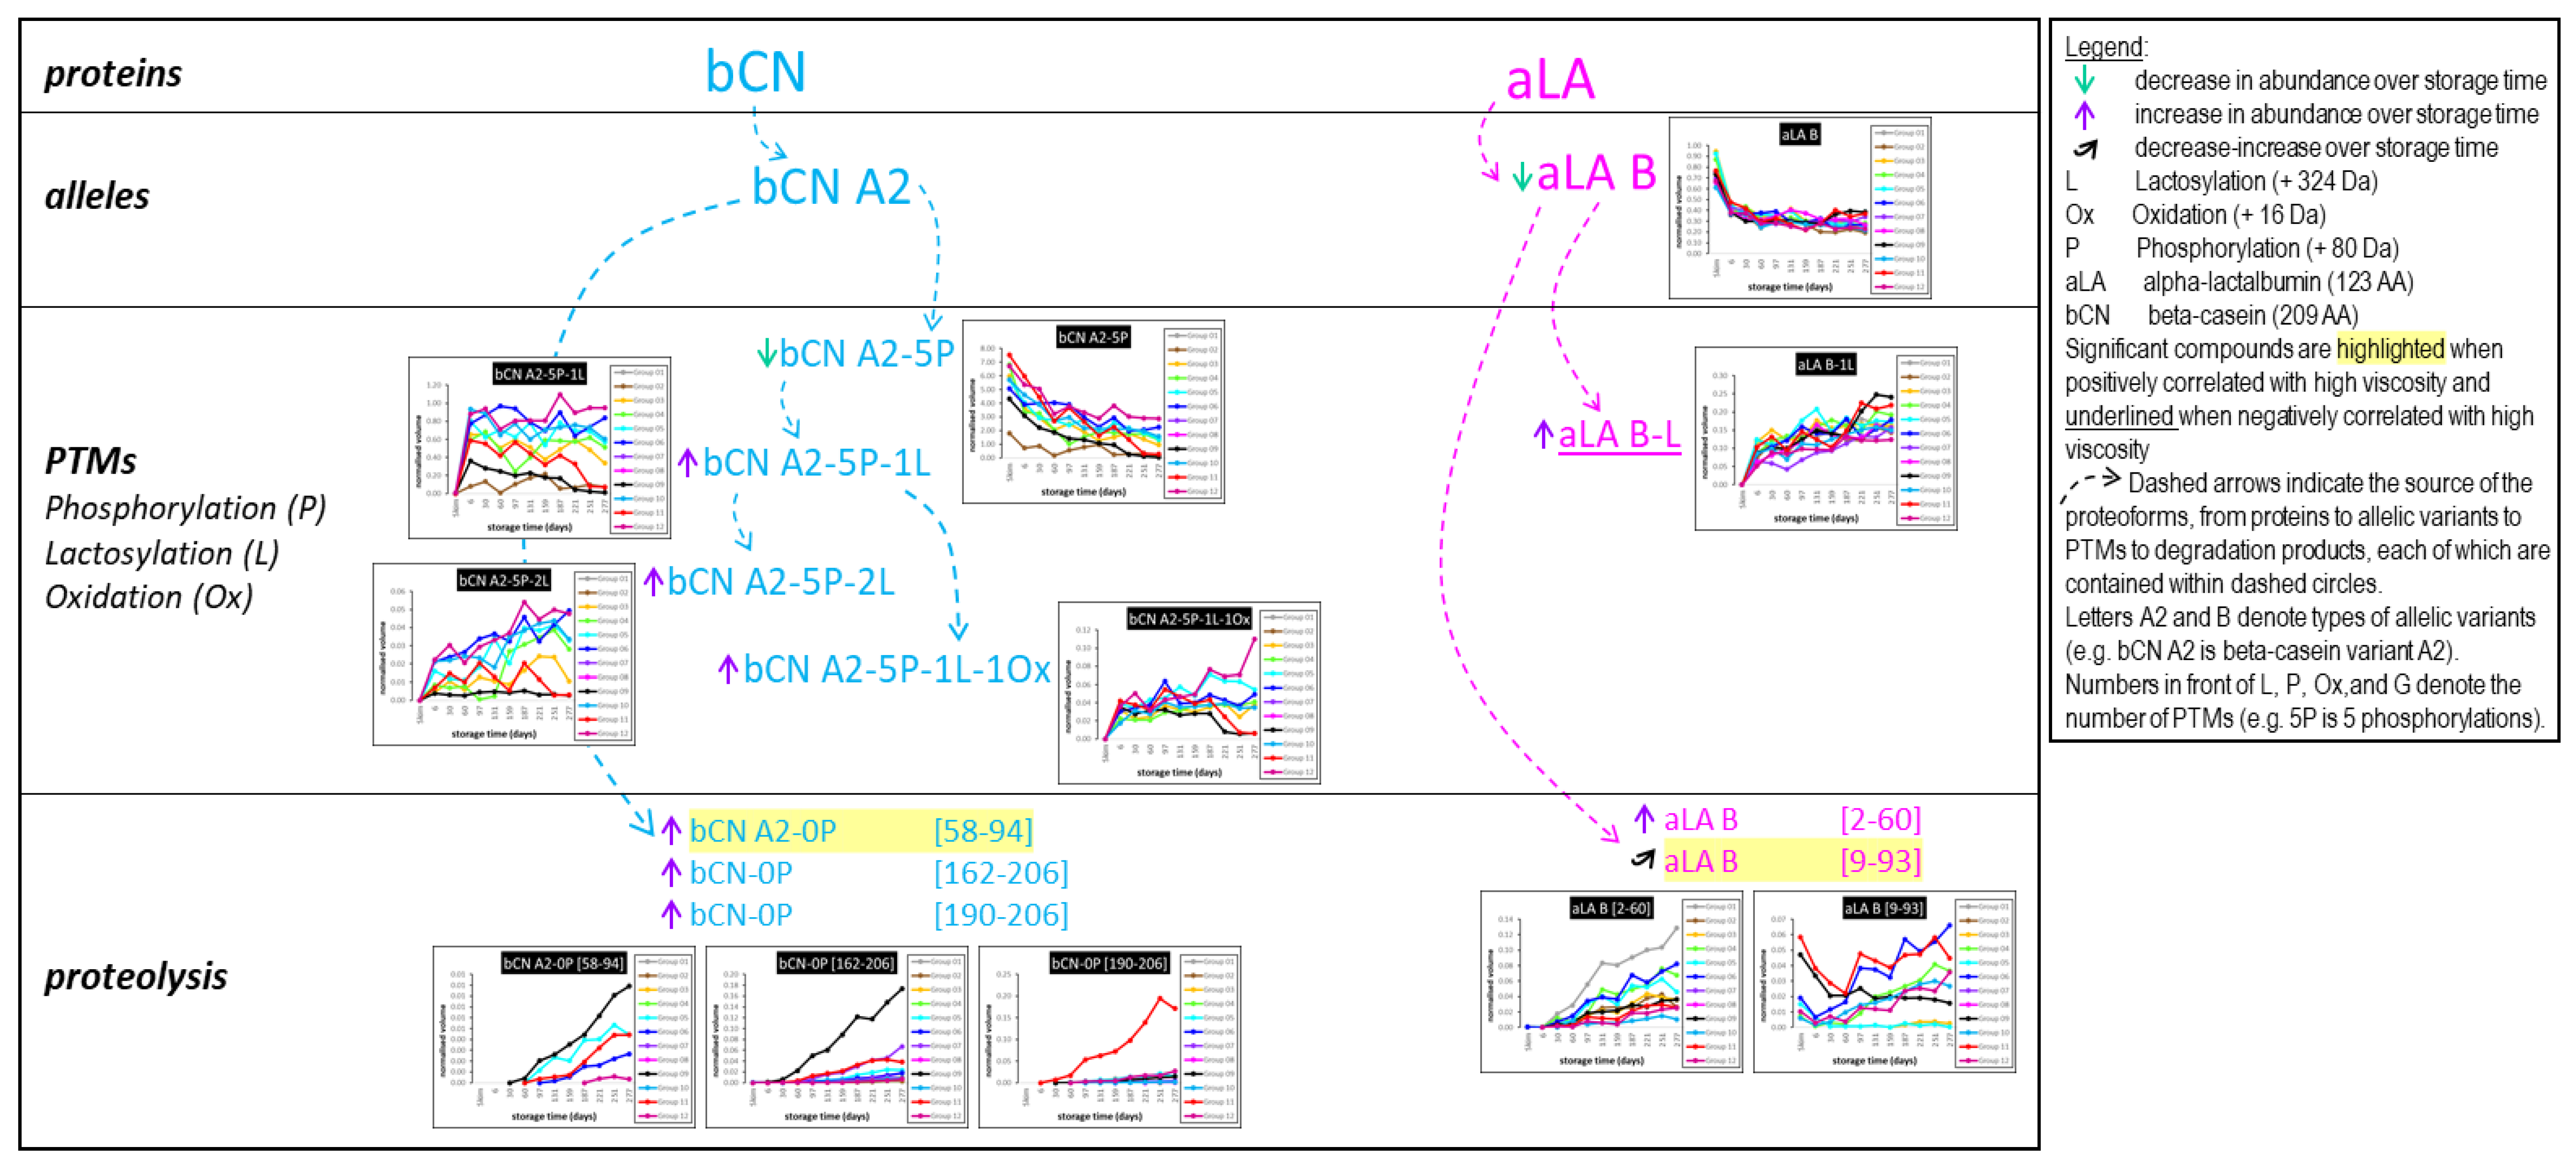
3.8. Top-Down Proteomics

Top-down proteomics, a term invented almost twenty years ago [37], simply describes the analysis of intact proteins, either in their native form or, more often, in a denatured state, which allows for a characterization of proteoforms as comprehensively as possible. Coined in 2014, the term proteoform “designates all of the different molecular forms in which the protein product of a single gene can be found, encompassing all forms of genetic variation, alternative splicing of RNA transcripts, and post-translational modifications (PTMs)” [38]. Typical PTMs include phosphorylation, glycosylation, oxidation and protein degradation due to proteolysis. If the PTMs incurs a mass shift in the proteoform, it can be detected by MS. RP-HPLC separation coupled with mass spectrometry (MS1) and tandem mass spectrometry (MS2) were used to analyze the relative abundance of intact proteins and peptides in the twelve milk groups during the 9 months storage at ambient temperatures. Overall, 209 proteoforms originating from the six most abundant milk proteins (αS1-CN, αS2-CN, β-CN, κ-CN, α-LA, and β-LG) were identified and quantified. The full list is available in Table S5 and their full abundance profiles can be plotted in Table S6. The 209 proteoforms included 58 intact proteins and 151 degradation products. The most prominent PTMs are lysis (97, 46.4%) and lactosylation (29, 13.9%) (Table S7). The effect of UHT treatment on intact proteins from raw milk and UHT milks from group 9 stored at ambient temperatures after 4 and 9 months can be visualized in Figure 6.
Upon UHT treatment, major intact proteins (caseins, α-La, β-Lb) immediately become lactosylated (+324 Da) and are proteolyzed during storage from 4 months onwards (Figure 6A). This is exemplified by β-LG (Figure 6B) and αS1-CN (Figure 6C) whose various allelic variants (β-LG a and β-LG B) and phosphorylated proteoforms (αS1-CN B-7P, 8P and 9P) gain lactose groups during UHT treatment (M0). Lactosylated proteoforms remain abundant at four months of storage (M4) but their abundance is significantly reduced after nine months of storage (M9) (Figure 6B,C). Lactosylation is a non-enzymatic glycation process whereby the amine moiety of lysine residues in milk proteins covalently reacts with lactose, the major carbohydrate in milk, to form lactulosyl-lysine residues [39], which incurs an increase of 324 Da in the total mass of the milk protein readily detected by MS (Figure 6). Lactosylated proteins were also reported in UHT milk stored at increasing temperatures for up to six months [13,20]. Statistical analyses were performed on MS1 quantitative data of the 209 identified proteoforms. Self-organizing maps (SOM) illustrate that the abundance of most proteoforms (157 out of 209, 75.1%) decrease with varying slopes over the course of 9 months of storage at ambient temperature, while 49 (24%) proteoforms accumulate over time in all twelve milk groups (Figure S5). This suggests that protein composition is not stable over UHT milk shelf-life, and gradually changes. Principal Component Analysis (PCA) shows that the main component (PC1 variance of 30.9%, i.e., 63 proteoforms) separates intact proteoforms from degraded ones (Figure S6). This indicates that the proteoforms mass (ranging from 1263 to 25,537 Da) alone, and no other features, is strongly associated to abundance profiles. Partial Least Squares (PLS) analysis using viscosity measurements as a response further shows that milk samples from groups 9 and 11 harbor most of the smallest peptides (Figure S7). This suggests that proteolysis is more prevalent in viscous UHT milk samples relative to non-viscous samples. Two-dimensional Hierarchical Clustering (2-D HCA) confirms that these short degradation products (1264–7026 Da) accumulate during the storage of UHT milk in ambient conditions from month 7 onward (M7, M8, and M9) (Figures S8 and S9), when the gelation has become well established in milk samples from groups 9 and 11 (Figure 2B). General Linear Model (GLM) and correlation analyses using viscosity measurements as a covariate were performed (Table 2).
A total of 51 significant proteoforms positively correlated with high viscosity (accumulating over time, left hand side of Table 2); they were mostly degradation products from β-CN and αS1-CN. Conversely 41 significant proteoforms negatively correlated with high viscosity (whose abundance decreased over time, right hand side of Table 2); they were native intact proteins with one or more PTMs including oxidation (Ox) and lactosylation (L). The expression profiles of all significant proteoforms per milk group can be viewed in Supplementary Files (Figures S10–S15, and Supplementary Table S6). Decrease in abundance of intact major proteins in UHT milk stored for six months was also demonstrated using SDS-PAGE [40].
An overview of the proteins and peptides identified and quantified by MS with their abundance profiles over storage time for all milk groups is illustrated in Supplementary Figure S16. An excerpt of Supplementary Figure S16 is presented below to illustrate the main patterns revealed by top-down proteomics results (Figure 7).
From all the top-down proteomics results presented above, three general trends can be highlighted:
  • Appearance of the lactose-modified forms of the milk proteins immediately following UHT treatment.
  • Decrease over time in the abundance of all the native intact milk proteins identified.
Accumulation of small degradation products formed over time, particularly in viscous milks from groups 9 and 11. The smaller the peptide, the more it accumulates over storage time. Of the 151 identified peptides, 106 (70.2%) arose from β-CN, 33 (21.9%) were degradation products from αS1-CN and 4 (2.7%) from β-Lg, 4 (2.7%) from α-La, 3 (2%) from κ-CN and 1 (0.7%) from αS2-CN.

4. Discussion

The progression of age gelation in UHT milk is a well-studied phenomenon yet understanding the mechanism/s of age gelation are obscured by the complicated interplay of known gelling factors. To try to simplify the experimental parameters and gain insight into how different milk protein genetic variants respond to UHT treatment and storage for nine months, twelve milk samples, grouped based on their genetic variants of κ- and β-CN and β-Lg were investigated by a suite of different techniques.
Of the twelve milk groups, only groups 9 (AB κ-CN, A1A2 β-CN and AB β-Lg) and 11 (AB κ-CN, A2A2 β-CN and AB β-Lg) suffered from age gelation over the length of the storage trial. The initial parameters measured (Table 1) showed that the milk groups were similar to each other, but when a PCA was performed, groups 7 and 12 were significantly different from the other groups, not groups 9 and 11. This result shows that the initial milk parameters investigated here cannot be used to predict age gelation of milk samples. This has also been shown recently in reconstituted skim milk [40].
The twelve combinations of milk protein genetic variants investigated in this study were not able to establish if a particular milk protein genetic combination provided improved storage stability. What was confirmed, however, was that the presence of the B variant of κ-CN confers statistically significant smaller diameter casein micelles, as we have previously shown [17]. Milk homozygous for the B variant of β-Lg was shown to contain significantly lower total protein concentrations of β-Lg [16] and this was confirmed here. Cows homozygous for B β-Lg presented significantly higher amounts of proteose-peptone in their milk, meaning an enhanced protease activity, although no relationship was established between proteose-peptone and the other variants of milk proteins [41]. Our results followed this trend for groups 1–6 whereby the groups homozygous for BB β-Lg (2, 4, 6) were more susceptible to proteolytic activity as indicated by the increase in soluble nitrogen over time.
Proteolysis by plasmin has been previously identified as a prime culprit in the progression of age gelation through the proteolytic degradation of milk proteins [9,42]. Whilst group 9 had the highest amount of initial plasmin activity, group 11 showed little activity, yet both suffered from age gelation. Initial plasmin activity also did not correlate with the initial concentrations of γ2- and γ3-CN, although plasmin activity did correlate well with the average age of the cows and the number of lactations, which agrees with literature [9]. Apart from proteose peptone component 8-fast (ppc8f [1–28]) from β-CN, none of the other degradation products identified in this study by top-down proteomics were reported as plasmin-released peptides [42], thus confirming that the proteolysis observed here does not originate from plasmin activity. Proteolysis by other proteases such as the thermostable protease ArpX from Pseudomonas or Serratia liquefaciens have also been shown to hydrolyse caseins in UHT milk during storage [43]. Of the 34 peptides from β-casein positively correlated with an increase in viscosity, 20 had cleavage sites previously identified from ArpX from Pseudomonas LBSA1 [43], indicating that proteolysis occurring in groups 9 and 11 may originate from exogenous sources.
Cryo-TEM was used to visualize the casein micelles of the milk groups to try and establish if any differences in morphology occur based on the genetic variants of the milk proteins. For example, there is a difference in how the A and B variants of β-Lg and κ-CN interact with each other post-UHT treatment. Again, there were no distinguishable visual differences between groups 9 and 11 compared to the other groups that provide visual information on the increase in viscosity. β-Lg can be seen to come to the surface of the casein micelles post-UHT treatment in all the milk groups and the morphological progression of the milks during storage are all very similar. In some of the micrographs amyloid-like protuberances can be seen, although there is not a clear increase in these structures during storage. The increase in background electron density observed with storage time fits with the theory that dissociation of β-Lg and/or the caseins occurs, and the linear fibers could be from the formation of amyloid-like fibrils from either β-Lg, κ-CN or mixtures of them both which we have previously shown to be possible [8].
Monitoring the concentration of soluble nitrogen in the supernatant following ultracentrifugation to pellet the casein micelles (Figure 1B) showed that all the milk groups exhibited proteolytic degradation during storage. The rate of increase in soluble nitrogen was not significantly different between the milk groups and the percent change in the amount of soluble nitrogen did not correlate with an increase in viscosity. This was also confirmed by the top-down proteomics results which showed that all milk groups had a progressive loss of the intact proteoforms of the main milk proteins identified. The correlation analysis of the MS data with viscosity measurements (Table 2) showed that certain peptides were highly correlated with an increase in the viscosity of groups 9 and 11, and that the presence of intact and intact modified (e.g., lactosylated) proteoforms were negatively correlated with an increase in the viscosity of the other milk groups. This is clear evidence that proteolysis plays a role in the progression of age gelation, although from our results specific proteolysis producing the peptides positively associated with the increase in viscosity needs to occur in order for age gelation to be triggered.
Analyses of the milk microbial populations were undertaken in an attempt to identify bacterial species potentially associated with age gelation. For example, initial analysis of bacterial families indicated some milk groups had high levels of the Moraxellaceae family while the two non-viscous milk groups had undetectable levels of the Bacillaceae family.
To compare groups of microbial populations (viscous versus non-viscous) in a more robust way than a simple histogram (Figure 4), by identifying differentially abundant taxa, we employed the R library edgeR. According to the authors, edgeR implements a range of statistical methodologies and can be applied to a variety of differential signal analysis data that produce counts (such as the sample x taxon counts matrix described above). A heatmap of the most differentially abundant taxa identified by edgeR (Figure 5) shows large variability in the abundance of a small number of different bacterial taxa across the twelve groups.
Of special interest are the taxa absent from groups 9 and 11 but present in all the non-viscous milk groups. The two viscous groups (9 and 11) differ from the other ten groups by lacking four genera from the Bacilli class as yet undefined at the species level plus the Enterobacterium Pantoea ananatis (although the accuracy of analysis using the 16 s variable regions may not be sufficient for identifying taxa to the species level in this case).
We could hypothesize that enzyme activity from certain members of the Bacillaceae family, or the genera Aerococcus, Planomicrobium, Salinicoccus (all Bacilli class) and Pantoea (a Gammaproteobactreium), present only in the non-viscous groups is able to protect against the gelation process affecting groups 9 and 11, perhaps by inhibiting a specific enzyme. Alternatively, modification of the k-CN/β-Lg fibrils, believed to form post-UHT, may be promoted by heat-resistant components released from the latter bacteria prior to UHT treatment. However, these data only give us a correlation, not a cause of gelation. Further experiments, such as adding milk from non-viscous groups to milk from group 9, would be needed.

5. Conclusions

We have shown that during the storage of genetically selected UHT milk there is a progressive increase in the proteolytic degradation of the major milk proteins, whether milk displayed age gelation or not. For the two milk groups which suffered from age gelation (groups 9 and 11), the peptides that were associated with an increase in milk viscosity were predominantly from β-CN. The abundance of native intact proteins was negatively correlated with an increase in milk viscosity, again implying that proteolysis is a leading mechanism for the instability of stored milk. Metagenomics analyses demonstrated that milk groups lacking certain bacterial genera, mainly from the Bacilli class, were prone to gelation. However, if this is the cause of age gelation in the two milk groups, the mechanism is unknown. Further work is required to elucidate the relationship between bacterial species and age gelation.

Supplementary Materials

The following are available online at https://www.mdpi.com/2306-5710/4/4/95/s1, Table S1: Bacterial 16s sequence diversity from metagenomics analyses. Table S2: Calculated chromatographic peak areas for the twelve milk groups. Table S3: The amount of each protein as a percentage of the total protein. Table S4: Paired T-tests of total κ-CN, non-glycosylated κ-CN, glycosylated κ-CN and β-Lg protein concentrations. Table S5: List of the 209 milk proteoforms of alpha-lactalbumin, beta-lactoglobulin, alpha-S1-casein, alpha-S2-casein, beta-casein, and kappa-casein identified by top-down proteomics. Table S6: Quantitative data of the 209 milk proteoforms obtained by LC-MS. Table S7: Number of proteoforms per type of protein across all UHT milk samples over storage time. This table illustrates how diverse prominent milk proteins become following UHT treatment. This is particularly well exemplified in the high level of lactosylation and degradation of milk most abundant proteins αS1CN and βCN. Figure S1: Principle component analysis of initial milk parameters from Table 1. Figure S2: Protein genetic variant differences illustrated by two RP-HPLC chromatograms of groups 1 and 12. Figure S3: Percentage of increased soluble peptides for each milk group. Figure S4: Cryo-TEM micrograph showing the presence of short linear amyloid-like fibres in group 11 milk after five months storage at room temperature. Figure S5: Self-Organised Maps (SOM) using a 2 × 2 matrix, sorted by milk groups and within the group by storage time. Figure S6: Principal Component Analysis from top-down proteomics data. Figure S7: Partial Least Square analysis of top-down proteomics data with viscosity measurements as a response. Figure S8: Two-Dimensional Hierarchical Clustering Analysis of all milk samples represented by milk group versus all proteoforms represented by their post-translational modification types. Figure S9: High viscosity cluster. Figure S10: Quantitative analysis of alpha-lactalbumin (aLA) proteoforms in skim and UHT milk over storage time. Figure S11: Quantitative analysis of beta-lactoglobulin (bLG) proteoforms in skim and UHT milk over storage time. Figure S12: Quantitative analysis of alpha-S1 casein (aS1CN) proteoforms in skim and UHT milk over storage time. Figure S13: Quantitative analysis of alpha-S2 casein (aS2CN) proteoforms in skim and UHT milk over storage time. Figure S14: Quantitative analysis of beta-casein (bCN) proteoforms in skim and UHT milk over storage time. Figure S15: Quantitative analysis of kappa-casein (kCN) proteoforms in skim and UHT milk over storage time. Figure S16: Overview of the 209 proteoforms found in all the UHT milk groups by LC-MS and LC-MS/MS over 9 months storage time at ambient temperature.

Author Contributions

Conceptualization, J.K.R., R.P.W.W., A.L. and J.L.Z.; methodology, J.K.R., D.V., J.L.Z., K.S.; proteomics, D.V.; metagenomics, J.L.Z.; software, D.V., K.S., D.M.; writing—original draft preparation, J.K.R.; writing—review and editing, A.L.; visualization, J.K.R., D.V., K.S.

Funding

This research received no external funding.

Acknowledgments

The authors would like to acknowledge the CSIRO and the DEDJTR for funding this research. The authors would also like to acknowledge Rangika Weerakkody for the HPLC analysis, Mi Xu, Allison Williams, Amirtha Puvanenthiran and Li Hui for performing laboratory analyses, Leonie Walter for the microbial analysis, Lynne Waddington for the TEM analysis, and the factory staff for help with processing the milk samples.

Conflicts of Interest

The authors declare no conflict of interest.

References

  1. Datta, N.; Deeth, H.C. Age Gelation of UHT Milk—A Review. Food Bioprod. Process. 2001, 79, 197–210. [Google Scholar] [CrossRef]
  2. Chavan, R.S.; Chavan, S.R.; Khedkar, C.D.; Jana, A.H. UHT Milk Processing and Effect of Plasmin Activity on Shelf Life: A Review. Compr. Rev. Food Sci. Food Saf. 2011, 10, 251–268. [Google Scholar] [CrossRef] [Green Version]
  3. Hough, G.; Garitta, L.; Sánchez, R. Determination of consumer acceptance limits to sensory defects using survival analysis. Food Qual. Prefer. 2004, 15, 729–734. [Google Scholar] [CrossRef]
  4. Holt, C.; Carver, J.A.; Ecroyd, H.; Thorn, D.C. Caseins and the Casein Micelle: Their Biological Functions, Structures, and Behavior in Foods. J. Dairy Sci. 2013, 96, 6127–6146. [Google Scholar] [CrossRef] [PubMed]
  5. Ecroyd, H.; Koudelka, T.; Thorn, D.C.; Williams, D.M.; Devlin, G.; Hoffmann, P.; Carver, J.A. Dissociation from the Oligomeric State Is the Rate-limiting Step in Fibril Formation by κ-Casein. J. Biol. Chem. 2008, 283, 9012–9022. [Google Scholar] [CrossRef] [PubMed] [Green Version]
  6. Guijarro, J.I.; Sunde, M.; Jones, J.A.; Campbell, I.D.; Dobson, C.M. Amyloid Fibril Formation by an SH3 Domain. Proc. Natl. Acad. Sci. USA 1998, 95, 4224–4228. [Google Scholar] [CrossRef] [PubMed]
  7. McMahon, D.J. Age-Gelation of UHT Milk: Changes That Occur During Storage, Their Effect on Shelf Life and the Mechanism by Which Age-Gelation Occurs. In Heat Treatments and Alternative Methods, IDF Symposium; International Dairy Federation: Brussels, Belgium, 1996; pp. 315–326. [Google Scholar]
  8. Raynes, J.K.; Day, L.; Crepin, P.; Horrocks, M.H.; Carver, J.A. Coaggregation of κ-casein and β-lactoglobulin produces morphologically distinct amyloid fibrils. Small 2017, 13, 1–11. [Google Scholar] [CrossRef] [PubMed]
  9. Ismail, B.; Nielsen, S.S. Invited review: Plasmin protease in milk: Current knowledge and relevance to dairy industry. J. Dairy Sci. 2010, 93, 4999–5009. [Google Scholar] [CrossRef] [PubMed]
  10. Manji, B.; Kakuda, Y. The Role of Protein Denaturation, Extent of Proteolysis, and Storage Temperature on the Mechanism of Age Gelation in a Model System. J. Dairy Sci. 1988, 71, 1455–1463. [Google Scholar] [CrossRef]
  11. Andrews, A.T. Properties of aseptically packed ultra-high-temperature milk: III. Formation of polymerized protein during storage at various temperatures. J. Dairy Res. 1975, 42, 89. [Google Scholar] [CrossRef]
  12. Harwalkar, V.R. Age Gelation of Sterilized Milks. In Advanced Dairy Chemistry, Volume 1: Proteins; Fox, P.E., McSweeney, P.L.H., Eds.; Elsevier Science Publisher Ltd.: Essex, UK, 1992; Volume 1, pp. 691–734. [Google Scholar]
  13. Malmgren, B.; Ardö, Y.; Langton, M.; Altskär, A.; Bremer, M.G.E.G.; Dejmek, P.; Paulsson, M. Changes in proteins, physical stability and structure in directly heated UHT milk during storage at different temperatures. Int. Dairy J. 2017, 71, 60–75. [Google Scholar] [CrossRef]
  14. Caroli, A.M.; Chessa, S.; Erhardt, G.J. Invited review: Milk protein polymorphisms in cattle: Effect on animal breeding and human nutrition. J. Dairy Sci. 2009, 92, 5335–5352. [Google Scholar] [CrossRef] [PubMed]
  15. Hallén, E.; Allmere, T.; Näslund, J.; Andrén, A.; Lundén, A. Effect of genetic polymorphism of milk proteins on rheology of chymosin-induced milk gels. Int. Dairy J. 2007, 17, 791–799. [Google Scholar] [CrossRef]
  16. Hallén, E.; Wedholm, A.; Andrén, A.; Lundén, A. Effect of β-casein, κ-casein and β-lactoglobulin genotypes on concentration of milk protein variants. J. Anim. Breed. Genet. 2008, 125, 119–129. [Google Scholar] [CrossRef] [PubMed]
  17. Day, L.; Williams, R.P.W.; Otter, D.; Augustin, M.A. Casein polymorphism heterogeneity influences casein micelle size in milk of individual cows. J. Dairy Sci. 2015, 98, 3633–3644. [Google Scholar] [CrossRef] [PubMed]
  18. Jensen, H.B.; Pedersen, K.S.; Johansen, L.B.; Poulsen, N.A.; Bakman, M.; Chatterton, D.E.W.; Larsen, L.B. Genetic variation and posttranslational modification of bovine κ-casein: Effects on caseino-macropeptide release during renneting. J. Dairy Sci. 2015, 98, 747–758. [Google Scholar] [CrossRef] [PubMed]
  19. Haq, M.R.U.; Kapila, R.; Kapila, S. Release of β-casomorphin-7/5 during simulated gastrointestinal digestion of milk β-casein variants from Indian crossbred cattle (Karan Fries). Food Chem. 2015, 168, 70–79. [Google Scholar] [CrossRef] [PubMed]
  20. Raynes, J.K.; Day, L.; Augustin, M.A.; Carver, J.A. Structural differences between bovine A1 and A2 β-casein alter micelle self-assembly and influence molecular chaperone activity. J. Dairy Sci. 2015, 98, 2172–2182. [Google Scholar] [CrossRef] [PubMed]
  21. Hill, J.P.; Boland, M.J.; Creamer, L.K.; Anema, S.G.; Otter, D.E.; Paterson, G.R.; Lowe, R.; Motion, R.L.; Thresher, W.C. Effect of the Bovine β-Lactoglobulin Phenotype on the Properties of β-Lactoglobulin, Milk Composition, and Dairy Products. In Macromolecular Interactions in Food Technology; American Chemical Society: Washington, DC, USA, 1996; Volume 650, pp. 281–294. [Google Scholar]
  22. Manderson, G.A.; Hardman, M.J.; Creamer, L.K. Effect of Heat Treatment on Bovine β-Lactoglobulin A, B, and C Explored Using Thiol Availability and Fluorescence. J. Agric. Food Chem. 1999, 47, 3617–3627. [Google Scholar] [CrossRef] [PubMed]
  23. Huang, X.L.; Catignani, G.L.; Foegeding, E.A.; Swaisgood, H.E. Comparison of the Gelation Properties of β-Lactoglobulin Genetic Variants A and B. J. Agric. Food Chem. 1994, 42, 1064–1067. [Google Scholar] [CrossRef]
  24. Mitchell, G.E.; Ewings, K.N. Quantification of bacterial proteolysis causing gelation in UHT-treated milk. N. Z. J. Dairy Sci. Technol. 1985, 20, 65–76. [Google Scholar]
  25. Ambrose Griffin, M.C.; Griffin, W.G. A simple turbidimetric method for the determination of the refractive index of large colloidal particles applied to casein micelles. J. Colloid Interface Sci. 1985, 104, 409–415. [Google Scholar] [CrossRef]
  26. Richardson, B.C.; Pearce, K.N. The determination of plasmin in dairy products. N. Z. J. Dairy Sci. Technol. 1981, 16, 209–220. [Google Scholar]
  27. Murphy, M.A.; Shariflou, M.R.; Moran, C. High quality genomic DNA extraction from large milk samples. J. Dairy Res. 2002, 69, 645–649. [Google Scholar] [CrossRef] [PubMed]
  28. Caporaso, J.G.; Lauber, C.L.; Walters, W.A.; Berg-Lyons, D.; Lozupone, C.A.; Turnbaugh, P.J.; Fierer, N.; Knight, R. Global patterns of 16S rRNA diversity at a depth of millions of sequences per sample. Proc. Natl. Acad. Sci. USA 2011, 108, 4516–4522. [Google Scholar] [CrossRef] [PubMed]
  29. Masella, A.P.; Bartram, A.K.; Truszkowski, J.M.; Brown, D.G.; Neufeld, J.D. PANDAseq: Paired-end assembler for illumina sequences. BMC Bioinform. 2012, 13, 31. [Google Scholar] [CrossRef] [PubMed]
  30. Morgulis, A.; Coulouris, G.; Raytselis, Y.; Madden, T.L.; Agarwala, R.; Schäffer, A.A. Database indexing for production MegaBLAST searches. Bioinformatics 2008, 24, 1757–1764. [Google Scholar] [CrossRef] [PubMed]
  31. Oksanen, J.; Blanchet, F.G.; Friendly, M.; Kindt, R.; Legendre, P.; McGlinn, D.; Minchin, P.R.; O’Hara, R.B.; Simpson, G.L.; Solymos, P.; et al. Vegan: Community Ecology Package, 2.4-3 ed. Available online: https://cran.r-project.org/web/packages/vegan/index.html (accessed on 22 November 2018).
  32. Vavrek, M.J. Fossil: Palaeoecological and Palaeogeographical Analysis Tools. Available online: https://palaeo-electronica.org/2011_1/238/index.html (accessed on 20 November 2018).
  33. Sarkar, D. Lattice Multivariate Data Visualization with R; Springer Science Business Media: New York, NY, USA, 2008. [Google Scholar]
  34. Robinson, M.D.; McCarthy, D.J.; Smyth, G.K. edgeR: A Bioconductor package for differential expression analysis of digital gene expression data. Bioinformatics 2010, 26, 139–140. [Google Scholar] [CrossRef] [PubMed]
  35. Vincent, D.; Elkins, A.; Condina, M.R.; Ezernieks, V.; Rochfort, S. Quantitation and Identification of Intact Major Milk Proteins for High-Throughput LC-ESI-Q-TOF MS Analyses. PLoS ONE 2016, 11, e0163471. [Google Scholar] [CrossRef] [PubMed]
  36. Bijl, E.; de Vries, R.; van Valenberg, H.; Huppertz, T.; van Hooijdonk, T. Factors influencing casein micelle size in milk of individual cows: Genetic variants and glycosylation of κ-casein. Int. Dairy J. 2014, 34, 135–141. [Google Scholar] [CrossRef]
  37. Kelleher, N.L.; Lin, H.Y.; Valaskovic, G.A.; Aaserud, D.J.; Fridriksson, E.K.; McLafferty, F.W. Top Down versus Bottom Up Protein Characterization by Tandem High-Resolution Mass Spectrometry. J. Am. Chem. Soc. 1999, 121, 806–812. [Google Scholar] [CrossRef]
  38. Toby, T.K.; Fornelli, L.; Kelleher, N.L. Progress in Top-Down Proteomics and the Analysis of Proteoforms. Annu. Rev. Anal. Chem. 2016, 9, 499–519. [Google Scholar] [CrossRef] [PubMed] [Green Version]
  39. O’Brien, J. Heat-Induced Changes in Lactose: Isomerization, Degradation, Maillard Browning. Available online: http://agris.fao.org/agris-search/search.do?recordID=BE9500697 (accessed on 22 November 2018).
  40. Anema, S.G. Storage stability and age gelation of reconstituted ultra-high temperature skim milk. Int. Dairy J. 2017, 75, 56–67. [Google Scholar] [CrossRef]
  41. Schaar, J.; Hansson, B.; Pettersson, H.-E. Effects of genetic variants of K-casein and βlactoglobulin on cheesemaking. J. Dairy Res. 1985, 52, 429–437. [Google Scholar] [CrossRef]
  42. Rauh, V.M.; Johansen, L.B.; Ipsen, R.; Paulsson, M.; Larsen, L.B.; Hammershoj, M. Plasmin activity in UHT milk: Relationship between proteolysis, age gelation, and bitterness. J. Agric. Food Chem. 2014, 62, 6852–6860. [Google Scholar] [CrossRef] [PubMed]
  43. Matéos, A.; Guyard-Nicodème, M.; Baglinière, F.; Jardin, J.; Gaucheron, F.; Dary, A.; Humbert, G.; Gaillard, J.L. Proteolysis of milk proteins by AprX, an extracellular protease identified in Pseudomonas LBSA1 isolated from bulk raw milk, and implications for the stability of UHT milk. Int. Dairy J. 2015, 49, 78–88. [Google Scholar] [CrossRef]
Figure 1. Percentage of soluble proteins in the UHT milk samples following centrifugation at 3000 g (A) and 100,000 g (B). The dashed line indicates when UHT treatment was applied. Vertical bars represent standard deviations.
Beverages 04 00095 g001
Figure 2. Micelle size and viscosity of UHT milk groups over storage time. (A). The z-average micelle size of milk groups was measured with dynamic light scattering over storage time. The dashed line indicates when UHT treatment was applied. (B). The viscosity was measured at 48.3 L/s (mPa.s). Vertical bars represent standard deviations.
Beverages 04 00095 g002
Figure 3. Cryo-Transmission Electron Microscopy (TEM) showing the progression of casein micelle morphology of groups 3 (G3) and 9 (G9). The scale bar represents 200 nm.
Beverages 04 00095 g003
Figure 4. Stacked bar plot of the percent abundance of the most abundant 20 bacterial families from each milk sample.
Beverages 04 00095 g004
Figure 5. Heat map of the log counts per million of bacterial species found in the skim milk samples before UHT treatment with the co-occurrence of taxa and similarity of samples. The orange box highlights those taxa absent from groups 9 and 11 but present in all other milk groups.
Beverages 04 00095 g005
Figure 6. Proteomic 2-D map of proteoforms contained in skim and UHT milk samples stored for 0, 4 or 9 months in Group 09 (high viscosity after 6 months) according to their deconvoluted accurate mass (x-axis) and retention time (y-axis) displayed in Refiner MS (Genedata Expressionist). A, whole map (x-axis 5–30 kD, y-axis 4–25 min) with areas corresponding to α-LA, β-LG, α-CN, β-CN and κ-CN intact proteoforms boxed; B, zoom in on β-LG area; C, zoom in on αS1-CN area. Lactosylation, +324 D; Oxidation, +16D. Proteoform abundance is denoted by spectral colors; they range from blue, green, yellow to red, the most intense signal. After 4 months of storage, UHT milk proteins become increasingly degraded as can be seen in the accumulation of low molecular weight compounds in the white dashed box (panel A), the appearance of lactosylated (+324 D) proteoforms (e.g., bLG, panel B) and the decrease in abundance of the intact unmodified proteoform of αS1-CN, milk most prominent protein (panel C).
Beverages 04 00095 g006
Figure 7. Abundance profiling of some proteoforms of beta-casein variant A2 (bCN A2) and alpha-lactalbumin (aLA) 9 months storage time of UHT milk samples. Brackets indicate the parts of the full protein sequences spanned by the degradation products (e.g., bLG B [8–110] corresponds to the degradation product covering the 8th til the 110th amino acid (AA) of variant B of bLG full AA sequence). Dashed arrows depict the source of each proteoform from protein, to allelic variants, to PTMs and finally degradation products (e.g., bCN → bCN A2 → bCN A2-5P → bCN A2-5P-1L etc.). Full compound profiles over time located next to the corresponding proteoform are also summarized here by up and down arrows (see legend for details). Milk group colours correspond to the ones used in Figure 1 and Figure 2. Proteoforms that positively correlate with high viscosity are highlighted. Underlined proteoforms indicate they negatively correlate with high viscosity. Correlations are listed in Table S6. The complete diagram is available in Supplementary Figure S16.
Beverages 04 00095 g007
Table 1. Genetic variants and raw milk parameters of the 12 milk groups.
Groupκ-CNβ-CNβ-LgAgeDays in LactNo. of Lact7 Day MilkProtein%Lactose %Ca mg/kgK mg/kgMg mg/kgNa mg/kgP mg/kgpHCasein Micelle Diameter nmlog CFU/mLPlasmin Activity (nM AMC/min)
1AAA1A1AB5.6 ± 1.3160 ± 273 ± 123.1 ± 4.73.174.97110015301104609906.66192.45.82 ± 0.160.51 ± 0.07
2AAA1A1BB5.6 ± 0.9162 ± 323 ± 123.6 ± 4.93.165.321080158011045010806.61177.25.98 ± 0.040.40 ± 0.11
3AAA1A2AB6.6 ± 1.9175 ± 194 ± 222.1 ± 2.83.145.241120170011052010706.67185.55.14 ± 0.040.85 ± 0.08
4AAA1A2BB6.4 ± 1.1167 ± 284 ± 122.5 ± 1.93.225.381160152010051010706.68178.85.94 ± 0.020.95 ± 0.08
5AAA2A2AB6.2 ± 1.6175 ± 254 ± 123.4 ± 1.23.185.271160156010050010406.68185.66.23 ± 0.120.88 ± 0.08
6AAA2A2BB6 ± 1.2237 ± 1543 ± 120.3 ± 5.53.135.181130167011054010406.691625.05 ± 0.050.80 ± 0.05
7ABA1A1AB7.5 ± 0.7337 ± 2455 ± 319.5 ± 4.23.084.0811501150904309006.87156.34.86 ± 0.131.91 ± 0.05
8ABA1A1BB7171525.13.214.689601340905509606.68161.45.00 ± 0.131.23 ± 0.06
9ABA1A2AB6.6 ± 1.1177 ± 274 ± 123.2 ± 3.23.175.111150143010056010406.71165.14.11 ± 0.052.39 ± 0.07
10ABA1A2BB4.2 ± 0.4172 ± 252 ± 020.0 ± 1.83.205.171220159010045011006.72170.25.81 ± 0.090.32 ± 0.08
11ABA2A2AB5.8 ± 2.2179 ± 173 ± 223.7 ± 4.53.245.201230151010049010706.7148.66.34 ± 0.030.77 ± 0.09
12ABA2A2BB4.4 ± 0.5239 ± 1552 ± 020.3 ± 3.43.354.9410301280903909106.7156.36.07 ± 0.050.16 ± 0.05
Table 2. Proteforms significantly (p ≤ 0.05) positively or negatively correlated with viscosity measurements.
ProteoformMassp-ValuesPositive CorrelationProteoformMassp-ValuesNegative Correlation
bLG [127–153] *3125.75.2 × 10−340.79ppc5.1 A1-2P [1–105]11,970.35.2 × 10−34−0.71
bCN-0P [190–206] *1928.15.2 × 10−340.73aS1CN B-8P-1L-1Ox23,940.45.2 × 10−34−0.69
bCN-0P-1L [125–138]1898.04.6 × 10−150.67aS1CN B-8P-1L23,924.48.3 × 10−13−0.62
bCN-0P-1Ox [37–59]2727.45.0 × 10−140.65aS1CN B-8P-1L-2Ox23,956.51.2 × 10−10−0.57
bCN-0P [133–161] *3364.91.2 × 10−130.64aS1CN B-8P-1Ox23,616.31.0 × 10−09−0.55
bCN-0P-1Ox [139–162]2810.42.3 × 10−130.63aS1CN B-8P-2Ox23,632.32.6 × 10−09−0.54
aS1CN B-0P [180–199] *2215.13.7 × 10−130.63aS1CN B-0P [158–199] *4650.24.6 × 10−06−0.43
bCN A2-0P [58–94] *3992.25.4 × 10−120.60aS1CN B-9P-1L24,004.41.4 × 10−05−0.42
bCN-0P-1Ox [162–206]5014.81.4 × 10−110.59aS1CN B-8P23,600.43.8 × 10−05−0.40
bCN-0P [127–138] *1359.82.5 × 10−110.59aS1CN B-8P [39–135]11,800.25.1 × 10−05−0.39
bCN-0P-1Ox [107–154]5604.04.2 × 10−110.58aS1CNB-8P-2Ox [39–135]11,832.32.0 × 10−04−0.37
bCN-0P [192–206] *1667.95.5 × 10−110.58bCN A2-5P-1Ox23,984.12.5 × 10−04−0.36
bCN-0P [139–161] *2695.41.4 × 10−100.57aS1CN B-0P [125–199]8633.36.6 × 10−04−0.34
bCN-0P-1Ox [96–138]4918.51.4 × 10−100.57aS1CN B-0P [1–34] *3981.27.3 × 10−04−0.34
bCN-0P [139–162] *2794.45.8 × 10−100.55bCN-0P [170–209] *4481.59.2 × 10−04−0.33
bCN-0P [107–154]5588.04.8 × 10−090.53g3CN-0P [108–209]11,551.19.8 × 10−04−0.33
bCN-0P [125–138] *1573.95.1 × 10−090.53aS1CNB-8P-1Ox [39–135]11,816.31.2 × 10−03−0.33
bCN-0P [162–206] *4998.85.4 × 10−080.50aS1CN B-9P-1Ox23,696.13.3 × 10−03−0.30
bCN-0P [37–59] *2711.43.2 × 10−070.48bLG B18,269.55.5 × 10−03−0.29
bCN-0P [190–209] *2253.33.4 × 10−070.48aS1CN B-7P [22–110]10,871.76.0 × 10−03−0.28
aLA B-1L14,501.01.4 × 10−060.45aS1CN B-0P [1–36]4238.37.0 × 10−03−0.28
bCN-0P [96–138] *4902.51.7 × 10−060.45aS1CN B-8P-2L24,248.67.0 × 10−03−0.28
bCN-0P-1L [106–138]4157.13.0 × 10−060.44aS1CN B-9P23,680.39.4 × 10−03−0.27
bCN A2-0P-1Ox [58–105]5176.84.2 × 10−060.44bCN-0P [177–209] *3720.01.0 × 10−02−0.27
bCN-0P-1Ox [108–138]3583.86.5 × 10−060.43aS1CN B-0P [1–33] *3853.11.2 × 10−02−0.26
bCN-0P [108–138] *3567.81.1 × 10−050.42aS1CN B-8P [22–109]10,822.82.0 × 10−02−0.24
aS1CN B-5P-1L [9–67]7350.45.6 × 10−050.39bCN A1-5P-1L–1Ox24,347.32.0 × 10−02−0.24
aS1CN B-2P-1L [24–63]4985.62.5 × 10−040.36bCN A1-5P-1L24,332.32.1 × 10−02−0.24
bCN-0P-1Ox [162–209]5340.03.7 × 10−040.35aS1CN B-7P [32–89]7051.02.1 × 10−02−0.24
bCN-0P [192–209] *1993.24.1 × 10−040.35kCN A-1P-1G(947.3D)19,971.92.3 × 10−02−0.24
aS2CN A-0P [71–117]5725.16.6 × 10−040.34g3CN-0P-1Ox [108–209]11,567.12.4 × 10−02−0.24
bCN-0P [106–138] *3833.01.4 × 10−030.32bLG B-1L18,593.72.4 × 10−02−0.24
aLA B [9–93]9707.91.4 × 10−030.32bCN A1-5P-1L-2Ox24,364.32.4 × 10−02−0.24
bCN-0P [139–164] *2994.52.1 × 10−030.31aS1CNB-8P-3Ox [39–135]11,848.33.0 × 10−02−0.23
bCN-0P [191–209] *2106.22.2 × 10−030.31bCN A1-5P24,007.33.7 × 10−02−0.22
bCN-0P [108–124] *2011.92.7 × 10−030.31kCN A-1P19,025.63.8 × 10−02−0.22
aS1CN B-0P [3–37] *4084.33.3 × 10−030.30bCN-0P [98–203]12,004.74.0 × 10−02−0.22
kCN A-0P [125–150] *2589.33.3 × 10−030.30aS1CN B-0P [1–38] *4451.54.4 × 10−02−0.21
bCN A2-0P [58–105] *5160.86.0 × 10−030.28bCN A1-5P-1Ox24,023.34.5 × 10−02−0.21
bCN-0P-1L [162–209]5648.16.5 × 10−030.28kCN A-1P-1L19,349.74.6 × 10−02−0.21
bLG A-2L19,003.87.0 × 10−030.28bCN-0P-1Ox [98–203]12,020.74.7 × 10−02−0.21
aLA B-1Allys [9–93]9706.77.4 × 10−030.28
bCN-0P [198–209] *1263.87.4 × 10−030.28
bLG A-3Ox-1L18,727.68.9 × 10−030.27
aS1CN B-2P-1Ox [1–56]6592.31.1 × 10−020.26
bCN-0P [71–169]11,100.91.2 × 10−020.26
bCN A2-0P [58–106]5298.91.2 × 10−020.26
bLG A-1Ox18,371.51.5 × 10−020.25
aS1CN B-5P [9–67]7026.31.6 × 10−020.25
aS1CN B-2P [24–63]4661.52.1 × 10−020.24
aS1CNB-0P-1Ox [176–199]2633.34.2 × 10−020.22
* identified by MS2.

