Communication

Discrimination of Juice Press Fractions for Sparkling Base Wines by a UV-Vis Spectral Phenolic Fingerprint and Chemometrics

1
Horticulture Centre, Tasmanian Institute of Agriculture, University of Tasmania, Prospect, Hobart, TAS 7249, Australia
2
WineTQ, Monash, SA 5342, Australia
*
Author to whom correspondence should be addressed.
Beverages 2018, 4(2), 45; https://doi.org/10.3390/beverages4020045
Submission received: 18 April 2018 / Revised: 24 May 2018 / Accepted: 8 June 2018 / Published: 12 June 2018
(This article belongs to the Special Issue Sparkling Wine)

Abstract

:
The feasibility of an ultraviolet-visible (UV-Vis) spectral phenolic fingerprint (SPF), combined with principal component analysis (PCA), is evaluated as a rapid, simple, and reliable technique for the discrimination of grape juice press fractions destined for the production of sparkling white wines. Juice press fractions of Vitis vinifera L. Chardonnay and Pinot noir grapes comprising free-run (i.e., juice released during the loading of press), cuvée (i.e., first press fraction), and taille (i.e., subsequent press fraction), were analyzed by SPF combined with multivariate data analysis. Two trials were carried out, a laboratory and a commercial scale trial. In both trials, cuvée and taille of Chardonnay and Pinot noir grapes were clearly separated in their corresponding PCA plots based on their SPF. The proposed method enables a rapid and objective discrimination of juice press fractions, which can be obtained using relatively inexpensive UV-Vis spectrophotometric equipment. Insights arising from this research suggest a future possibility of objective, real-time discrimination of juice quality that could liberate the winemaker from tasting juice at the press.

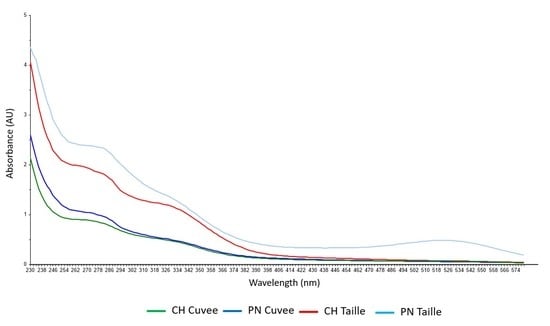
Graphical Abstract

1. Introduction

Over the last decade, the Tasmanian wine industry has grown significantly, primarily due to an escalation in sparkling white wine production (Méthode Traditionelle), with Pinot noir and Chardonnay being the main Vitis vinifera varieties used [1]. Flavor is of primary importance for understanding consumer preference of sparkling white wines and, in general, intense aged/developed and complexity attributes are currently favored [2,3]. A number of viticultural and oenological decisions can affect a sparkling wine’s flavor, such as grape variety selected, origin of grapes, and winemaking procedures adopted (e.g., juice extraction, oxygen management, fining, and length of lees aging) [4,5,6,7].
Particularly for sparkling white wines, the separation of grape juice during a pressing cycle is important, as many blending fractions with varying chemical (e.g., total acidity, pH, phenolic, polysaccharide, and oligosaccharide content) and sensory characteristics (e.g., color, green-grassy aroma, bitterness, astringency) can result from the pomace break-up [6,8,9]. Juice press fractions for sparkling wines are typically classified as free-run, cuvée and taille [6,10,11]. Whereas the free-run is the juice released during the loading of press (in case of whole bunch press), cuvée (i.e., first press fraction) and tailles (i.e., subsequent press fractions) represent the best and lesser quality juice, respectively. These fractions can vary in volume depending on production rules and/or winemaking style. For example, in Champagne, grape juice has to be separated into two tanks according to volumes imposed by law: namely cuvée, consisting of 20.5 hL (after settling) per 4000 kg marc, and tailles, consisting generally of the last 5 hL extracted and corresponding to the first and second taille [6].
The separation of different juice press fractions, for sparkling white wines particularly, has to be carefully monitored, since an excessive extraction of phenolic substances (e.g., flavanols, hydroxycinnamates) may negatively affect the color, taste, and/or mouthfeel attributes of final wines [8,12]. For instance, an excess of hydroxycinnamates (non-flavonoid phenolics) and their derivates, such as caffeic acid and its trans-ester of tartaric acid i.e., caftaric acid (trans-caffeoyl tartaric) in both juice and wine matrices, can lead to the formation of an undesirable oxidative browning [13].
Apart from legislated volumetric requirements that regulate the press fractioning for certain sparkling wines, such as Champagne, typically winemakers discriminate juice press fractions by sensorial assessments for ‘phenolic pick-up’ (i.e., perception of drying, coarse in-mouth sensations). Although this is probably the best option for discriminating a small number of samples, it is limiting when dealing with large batches of juice in part because of inter-individual variability in tolerance thresholds and unreliability of human senses, health condition, and environmental interferences [14,15]. High volume juice production typically relies on empirical methods, such as volume or conductivity, and the opportunity arises to develop an algorithm for an objective method calibrated against sensory data. A rapid and reproducible tool for quality assurance purposes is needed for wine producers to discriminate juice press fractions, in order to ensure the quality and consistency of the final product delivered to the consumer.
Ultraviolet-visible (UV-Vis) spectral fingerprinting is an easy to adopt, inexpensive, and rapid way to discriminate and classify the characteristics and quality of food products including wine [16,17,18,19]. However, it is not well recognized as a technique to discriminate grape juice quality during pressing. Spectral fingerprints are the sum of instrumental signals for each significant compound present in the sample matrix and are normally acquired using detectors that generate high dimensional data (many variables per sample), such as infrared (IR), near-infrared (NIR), mid-infrared (MIR), mass (MS) and nuclear magnetic resonance (NMR) spectrometry [20,21,22,23,24]. The use of a spectrophotometric technique for discriminating juice press fractions could be of particular interest to the wine industry, since most laboratories are equipped with a UV-Vis spectrophotometer for other routine analyses. In addition, UV-Vis spectroscopy relies on π bonding and conjugated double bonds, so phenolics have distinct UV fingerprints, while the most abundant wine components, such as water, alcohol, organic acids, and sugars, have no absorbance in the UV wavelength range used (200–600 nm) [25].
Principal component analysis (PCA) is one of several multivariate methods, applied to convert correlated data (e.g., spectral measures) into linearly uncorrelated variables that describe or predict meaningful patterns from complex spectral fingerprints [26].
In the present study, UV-Vis spectrometry was used to provide a spectral phenolic fingerprint (SPF) that enables the discrimination of Chardonnay and Pinot noir press fractions destined to the production of sparkling white wines. Chardonnay and Pinot noir grapes were used as test material because of their significance to the Australian sparkling wine production and also to that of other regions around the world. PCA was employed to test the hypothesis that differences between juice press fractions produced from a single batch of Chardonnay or Pinot noir grapes can be discriminated based on their SPF that is detectable in UV-Vis spectroscopy.

2. Materials and Methods

2.1. Laboratory Scale Trial

2.1.1. Hydroxycinnamate Standards

Two low molecular weight phenolics, i.e., caffeic and ferulic acids, which are very abundant in Chardonnay and Pinot noir grape juices [27], were used as hydroxycinnamates standards for comparison of the spectral phenolic fingerprints. Standard solutions were prepared by dissolving 0.005 g of each compound in 50 mL of 50% ethanol aqueous solution (v/v), and diluted 1:2 in a stepwise fashion, giving six solutions for each hydroxycinnamate. Each solution was then diluted 1:10 with 1 M HCl, as was the 50% ethanol solution, giving 13 solutions for UV-Vis analysis, which were read against 1 M HCl baseline.

2.1.2. Grape Juice Press Fractioning

The laboratory scale trial was carried out in the 2010/11 season, using Chardonnay and Pinot noir grapes sourced from a commercial vineyard located in the Tamar Valley winegrowing region of Northern Tasmania, Australia. A total of 15 kg of grapes was hand-harvested at a commercial ripeness of 10.5° Baumé. The titratable acidity of the Chardonnay fruit was 13.3 g L−1, with pH 3.03. The titratable acidity of the Pinot noir fruit was 12.4 g L−1, with pH 3.10. Fruit was pressed in a flatbed whole bunch press with rubber membrane pressurized with water at up to 1.0 bar (Solutions in Stainless, Launceston, Tasmania, Australia) with cuvée (i.e., first press fraction) and taille (i.e., subsequent press fraction) cut respectively at approximately 350 L ton−1 and 150 L ton−1 for Chardonnay and 400 L ton−1 and 150 L ton−1 for Pinot noir. These volumetric cut-offs were the average reported in a Tasmanian sparkling wine industry survey carried out by the research team in 2009. Four homogenous juice samples were collected from cuvée and taille respectively, for both Chardonnay and Pinot noir varieties. All samples were frozen at −18 °C for later analysis.

2.2. Commercial Scale Trial

The commercial scale trial was carried out in the 2011/12 season using for Chardonnay and Pinot noir grapes. Samples were supplied by a commercial winery located in the Tamar Valley winegrowing region of Northern Tasmania, Australia. Table 1 details the main processing characteristics of the 2011/12 vintage season, in which grapes were harvested at a commercial ripeness of 10.5° Baumé and pressed in a pneumatic press (RPX 80 model, Bucher Vaslin, Chalonnes-sur-Loire, France). Cuvée and taille cut-off were determined subjectively by an experienced winemaker tasting juice at the press, with particular attention to phenolic pick-up. Cuvée and taille were cut respectively at 481 L ton−1 and 228 L ton−1 for Chardonnay and 502 L ton−1 and 200 L ton−1 for Pinot noir. A juice sample at each pressure, for each press cycle, was collected at the press outflow (42 and 31 samples for Chardonnay and Pinot noir, respectively) and frozen at −18 °C for later analysis.

2.3. UV-Vis Spectcroscopy

Frozen samples of Chardonnay and Pinot noir juices were thawed overnight at 4 °C prior to centrifugation using a 5804 Eppendorf (Hamburg, Germany) at 3350 radial centrifugal force (RCF) for 15 min for clarification. Samples were diluted 1:5 with 1 M HCl (Merck, Darmstadt, Germany) and dark incubated for one hour at ambient temperature (22 °C). Samples were then analyzed using a Genesys 10S UV-Vis scanning spectrophotometer (Thermo Scientific, Waltham, MA, USA) with an absorbance reading taken every 2 nm from 200 to 600 nm inclusive for the spectral phenolic fingerprint (SPF). Samples were analyzed using disposable 10 mm quartz cuvettes (Brand-GMHB, Wetheim, Germany), so wavelengths below 250 nm were discounted due to interferences.

2.4. Chemometrics

The raw spectral data were imported into the Unscrambler X software (ver. 10.2, Camo, Norway) and PCA was performed to discriminate treatment clustering and to determine important wavelengths that contributed to treatment discrimination. Data was evenly weighted and cross validated with 20 segments and 2 samples per segment. The Non-Linear Iterative Partial Least Squares (NIPALS) algorithm was used to perform the PCA.

3. Results and Discussion

3.1. Discrimination of Press Fractions in the Laboratory Scale Trial

The raw spectra of hydroxycinnamate ethanolic solutions and juice press fractions of Chardonnay and Pinot noir grapes are illustrated in Figure 1a,b, respectively. The spectral phenolic fingerprint (SPF) showed moderate to strong absorbance at around 330 nm, which gives an indication of the content of lower molecular weight phenolics, such as hydroxycinnamates, present in the samples [28]. There was also a shoulder at around 280 nm, likely arising from the contribution of total phenolics at this wavelength [29]. This information may be of sensory significance to sparkling wine producers, as total phenolics and hydroxycinnamates (i.e., summed concentration of free hydroxycinnamate acids and their tartaric acid and ethyl esters) have been reported to exert an effect of bitter taste on white wines [8]. However, total phenolics in combination with higher pH have also been shown to elicit perceived viscosity (i.e., overall perception of palate weight) [8], responsible for affecting the quality of some sparkling wines [2].
A comparison between the SPF of cuvée and taille obtained from Chardonnay and Pinot noir grapes at laboratory scale, indicates that most of the variation between these press fractions occurred within the ‘fingerprint’ region of interest; i.e., 230 and 450 nm (Figure 1b). For grape, juice, and wine samples, this region is known to contain absorbance bands attributable to phenolic compounds, and results from the electronic transition of π orbitals [19]. The hydroxycinnamate solutions had a distinct absorbance peak at 330 nm, with a shoulder at 290 nm, a trough at 260 nm and a peak at 238 nm (Figure 1a). Similar wavelengths feature in a comparison of press fractions from the laboratory trial (Figure 1b), with the cuvée fractions having higher absorbance values at 290 and 330 nm, suggesting that hydroxycinnamates may be more readily extracted than other phenolics. Spectra from the commercial trial feature greater separation between cuvée and taille (Figure 1c), with higher absorbances across all wavelengths for Pinot noir and an additional feature around 520 nm in the Pinot noir taille, are indicative of the contribution of anthocyanins from harder pressings (as indicated by press fraction volumes).
The press conformation and mode of operation were different for the laboratory scale and the commercial press. The laboratory press was a flat-bed press with a faster operational cycle, so there was less skin contact time and less berry damage, more akin to a basket press often used for sparkling wine production. The commercial press was a pneumatic press that had long operational cycles with rolling of the press between cycles resulting in more damage and more skin contact, hence the phenolic profiles were different. It seems that gently pressing with minimal skin contact resulted in a different phenolic profile with less material that absorbed at 280 nm. With the more gentle pressing, fractions were best separated at wavelengths associated with hydroxycinnamates, which appeared to be easily extracted. The current data indicates that with both pressing methods, the fractions can be discriminated with spectral data, although the fractions will differ depending on the press type and mode of operation. Ultimately, the spectral data can be calibrated against a winemaker’s preference for the fractions and used as an objective measure that correlates with that sensory data. This could be done using full spectra and chemometrics [30] or simple algorithms could be derived with a small number of critical wavelengths.
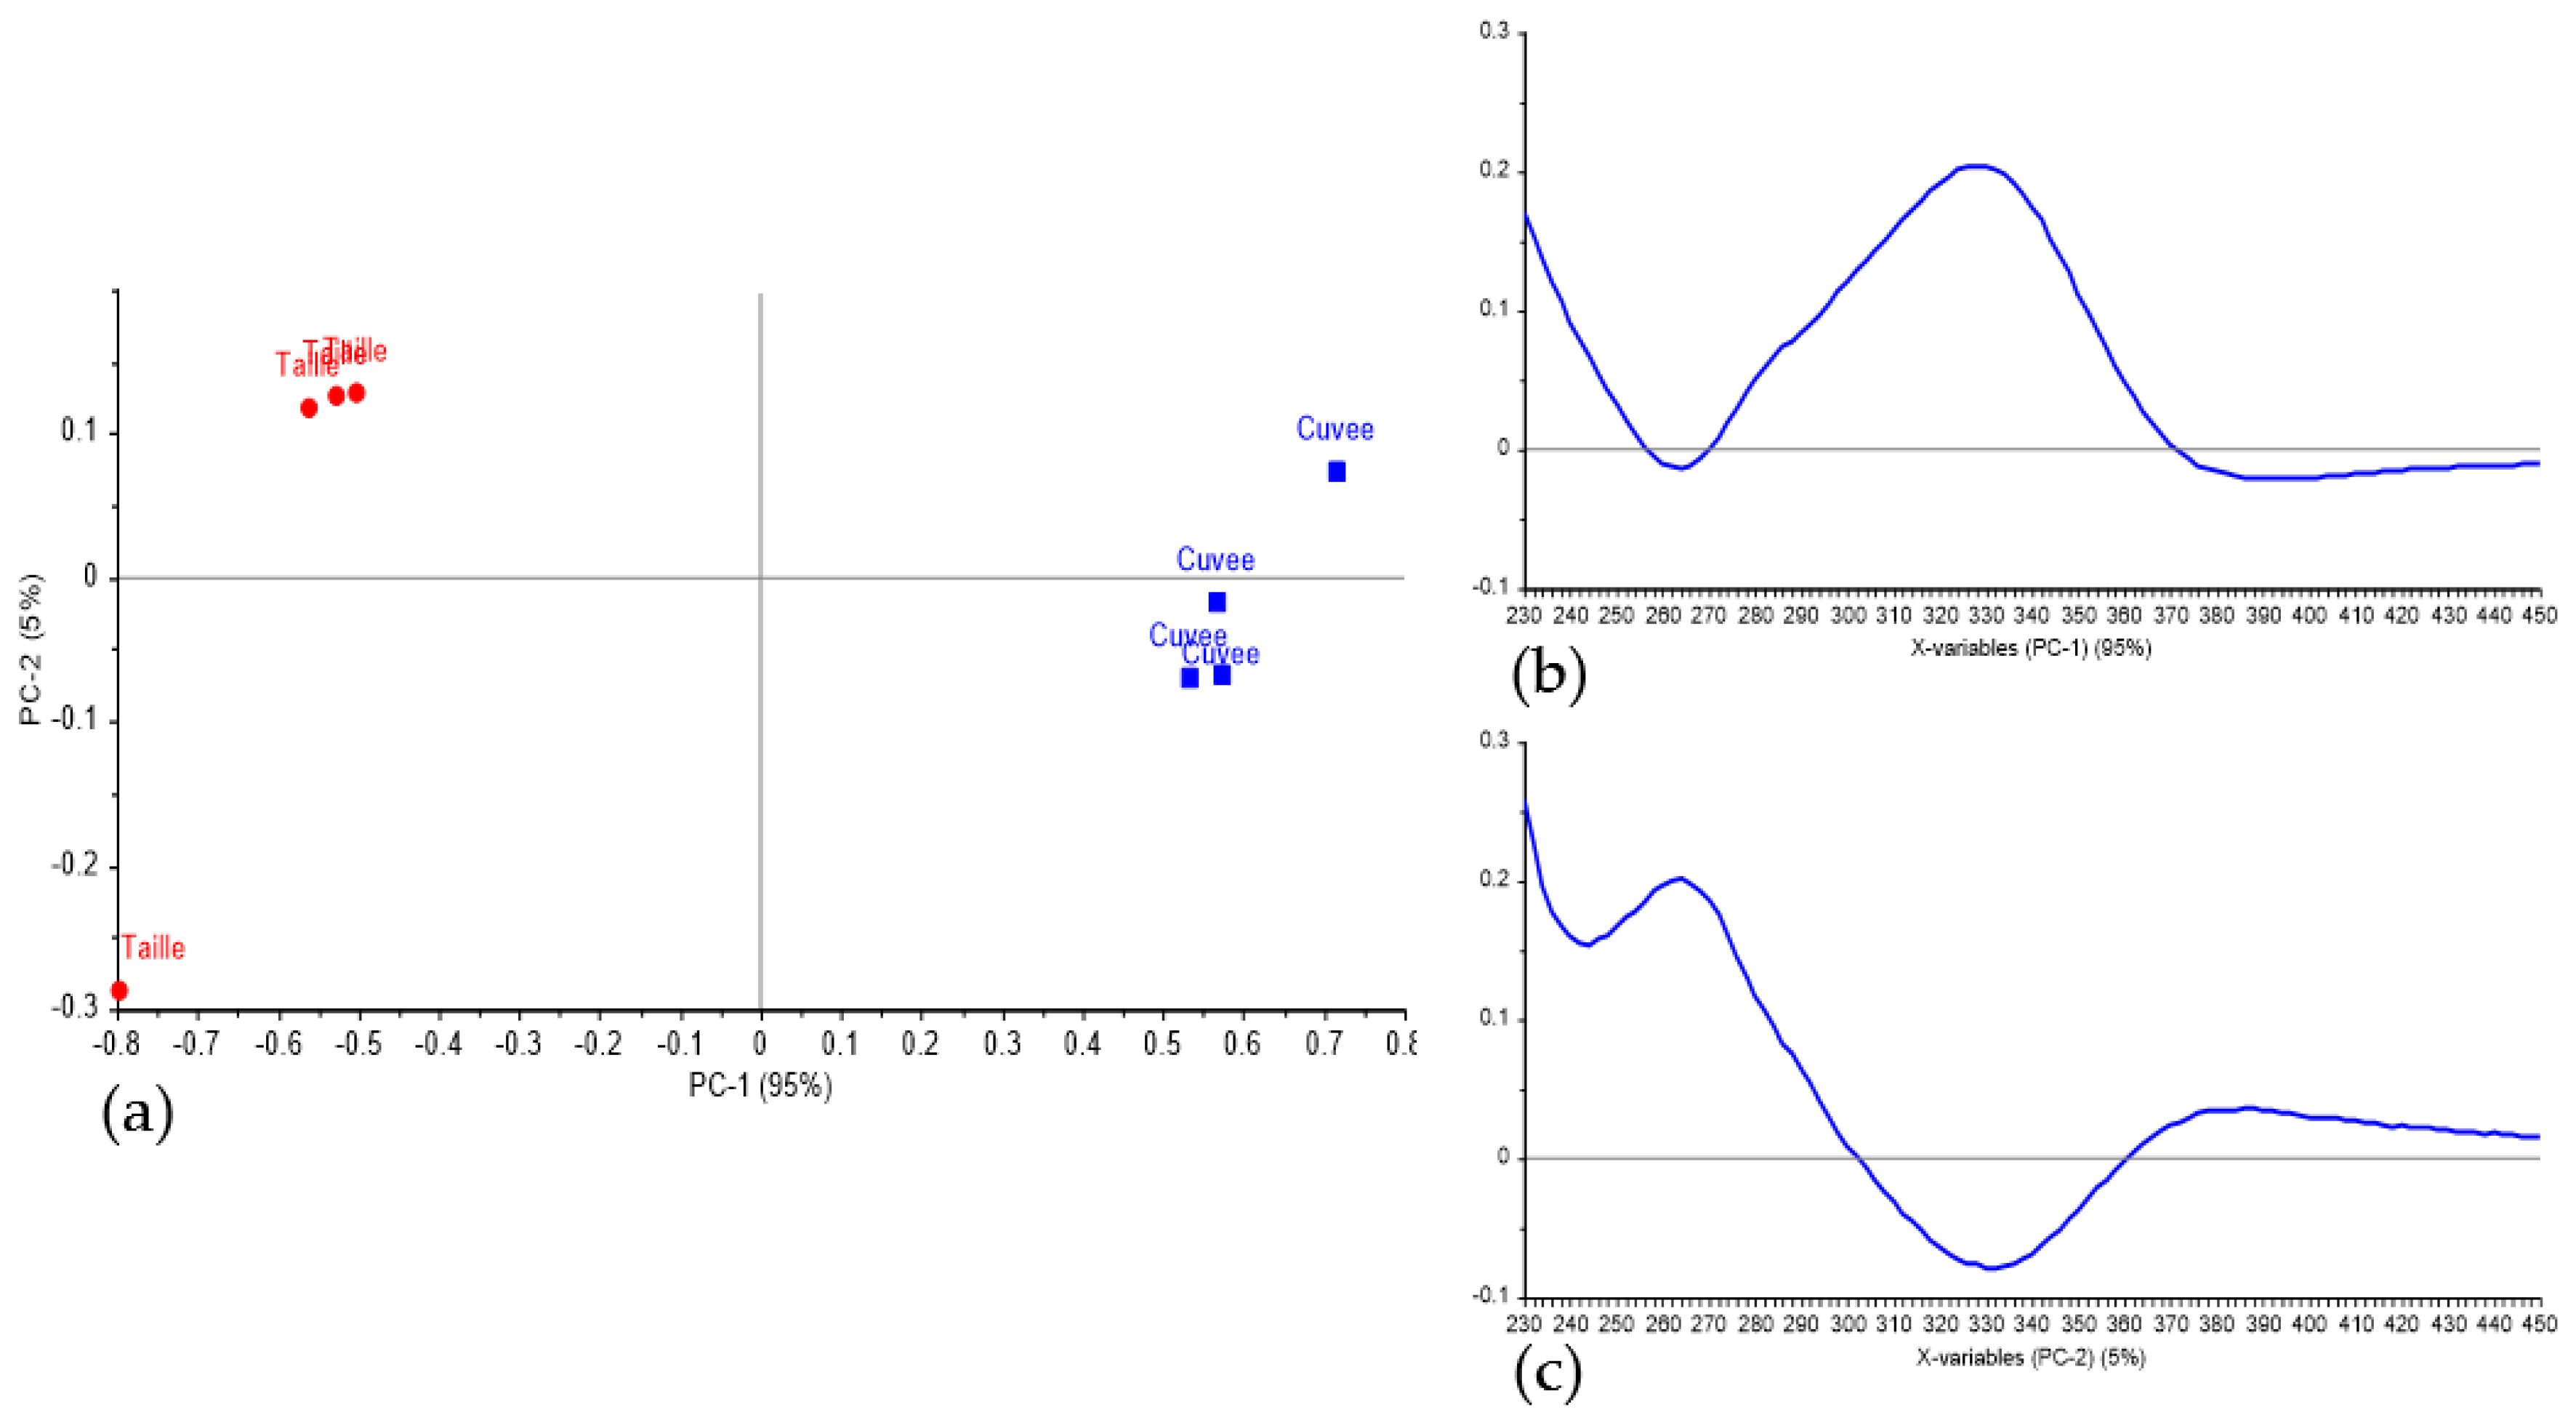
The PCA score plots of the first two principal components (PC), derived from the UV-Vis SPF of all grape juice press fractions obtained during the laboratory scale trial, are shown in Figure 2a and Figure 3a for Chardonnay and Pinot noir, respectively. For Chardonnay samples, PC 1 explained 95% of the variation observed (Figure 2a), and resulted in a strong separation of cuvée from taille. The spectral loadings for PC 1 showed features at 260 nm and 330 nm suggesting influence of hydroxycinnamates, with cuvée having higher levels. Absorbance at 280 nm is often used to estimate total phenolics; the spectral loadings for PC 1 show very little influence by 280 nm in separating cuvée from taille. One outlier was observed, i.e., an individual juice sample that did not cluster with other juice samples of the same treatment, namely a taille sample, that instead was represented in the lower left quadrant, but was still separated from cuvée on PC 1. The clustering pattern of press fractions likely relates to appreciable differences in the concentration of caffeic and ferulic acids, or their esters, between cuvée and taille samples.
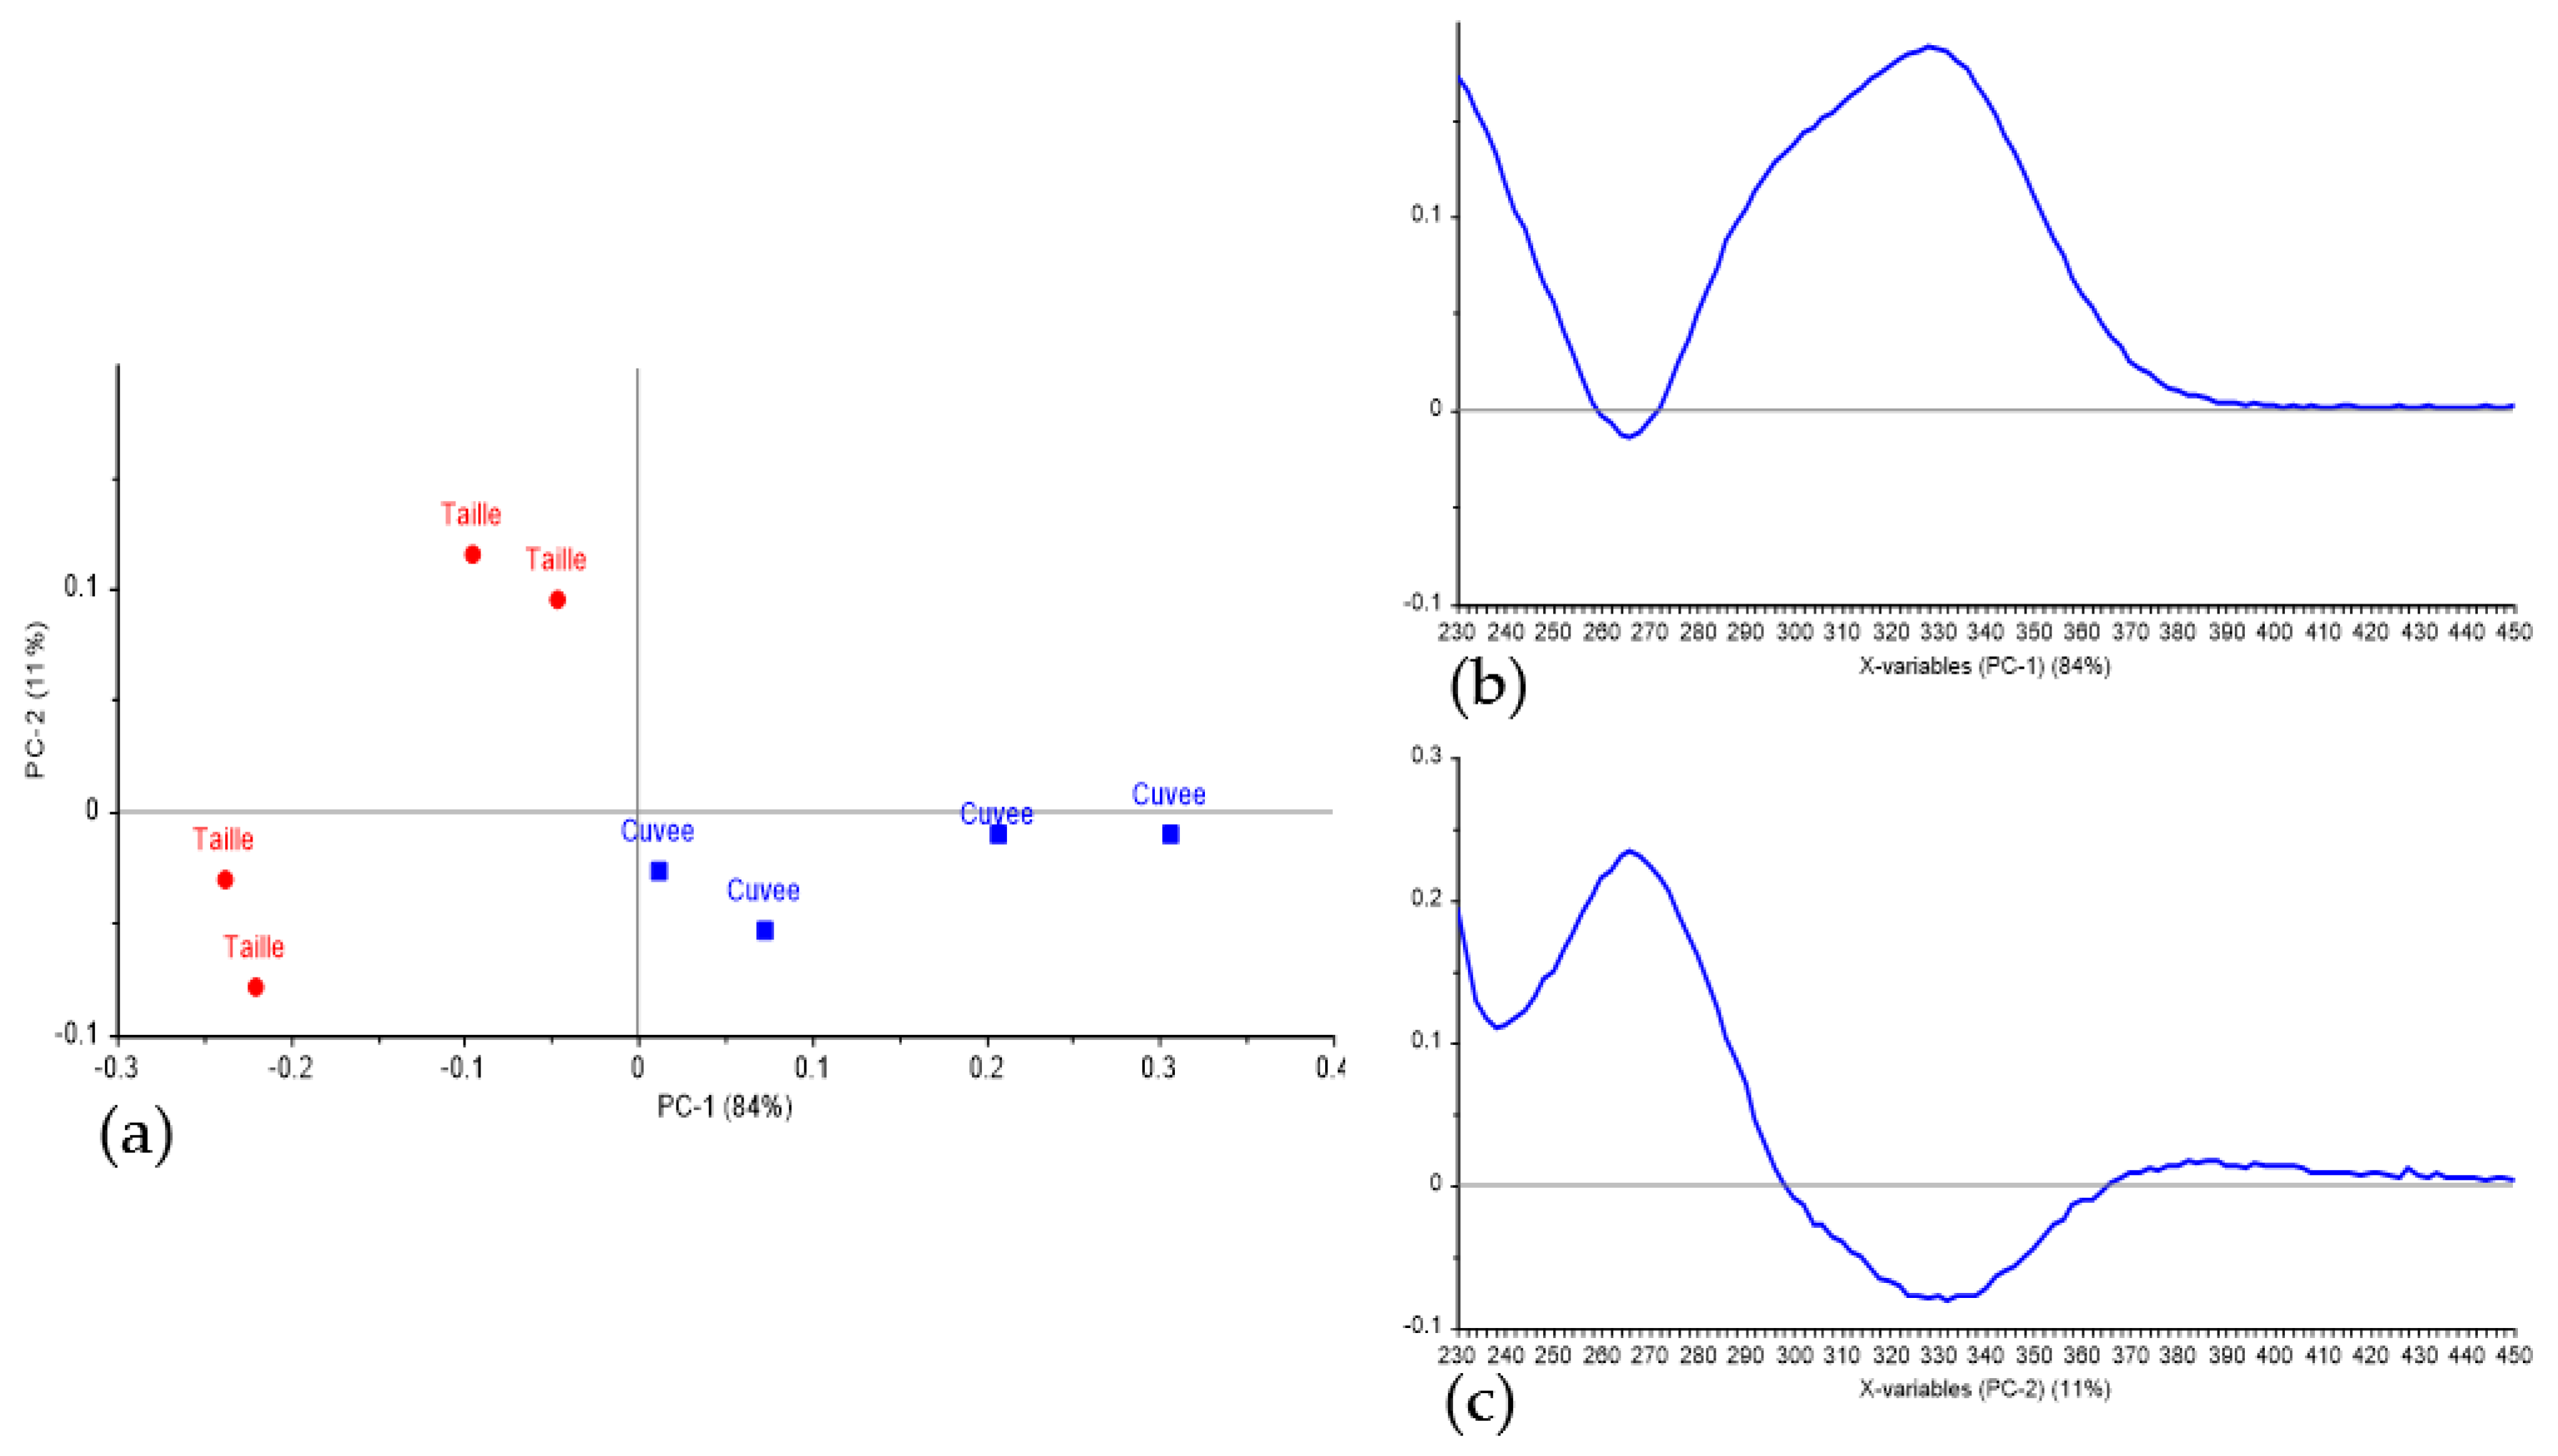
For Pinot noir samples, PC 1 accounts for 84% of the data variability (Figure 3a), and similar to Chardonnay, resulted in a clear separation of cuvée and taille samples. The greatest separation between the cuvée and taille clusters was observed along the horizontal (PC 1) axis. As with Chardonnay PC 1 was influenced by 260 nm and 330 nm features, with cuvée samples having higher absorbance at these wavelengths.
For both varieties, PC 2 provided some separation within each press fraction and it appeared to also be driven by 260 and 330 nm wavelengths, but differences were smaller than between the press fractions (Figure 2c and Figure 3c).

3.2. Classification of Press Fractions in the Commercial Scale Trial

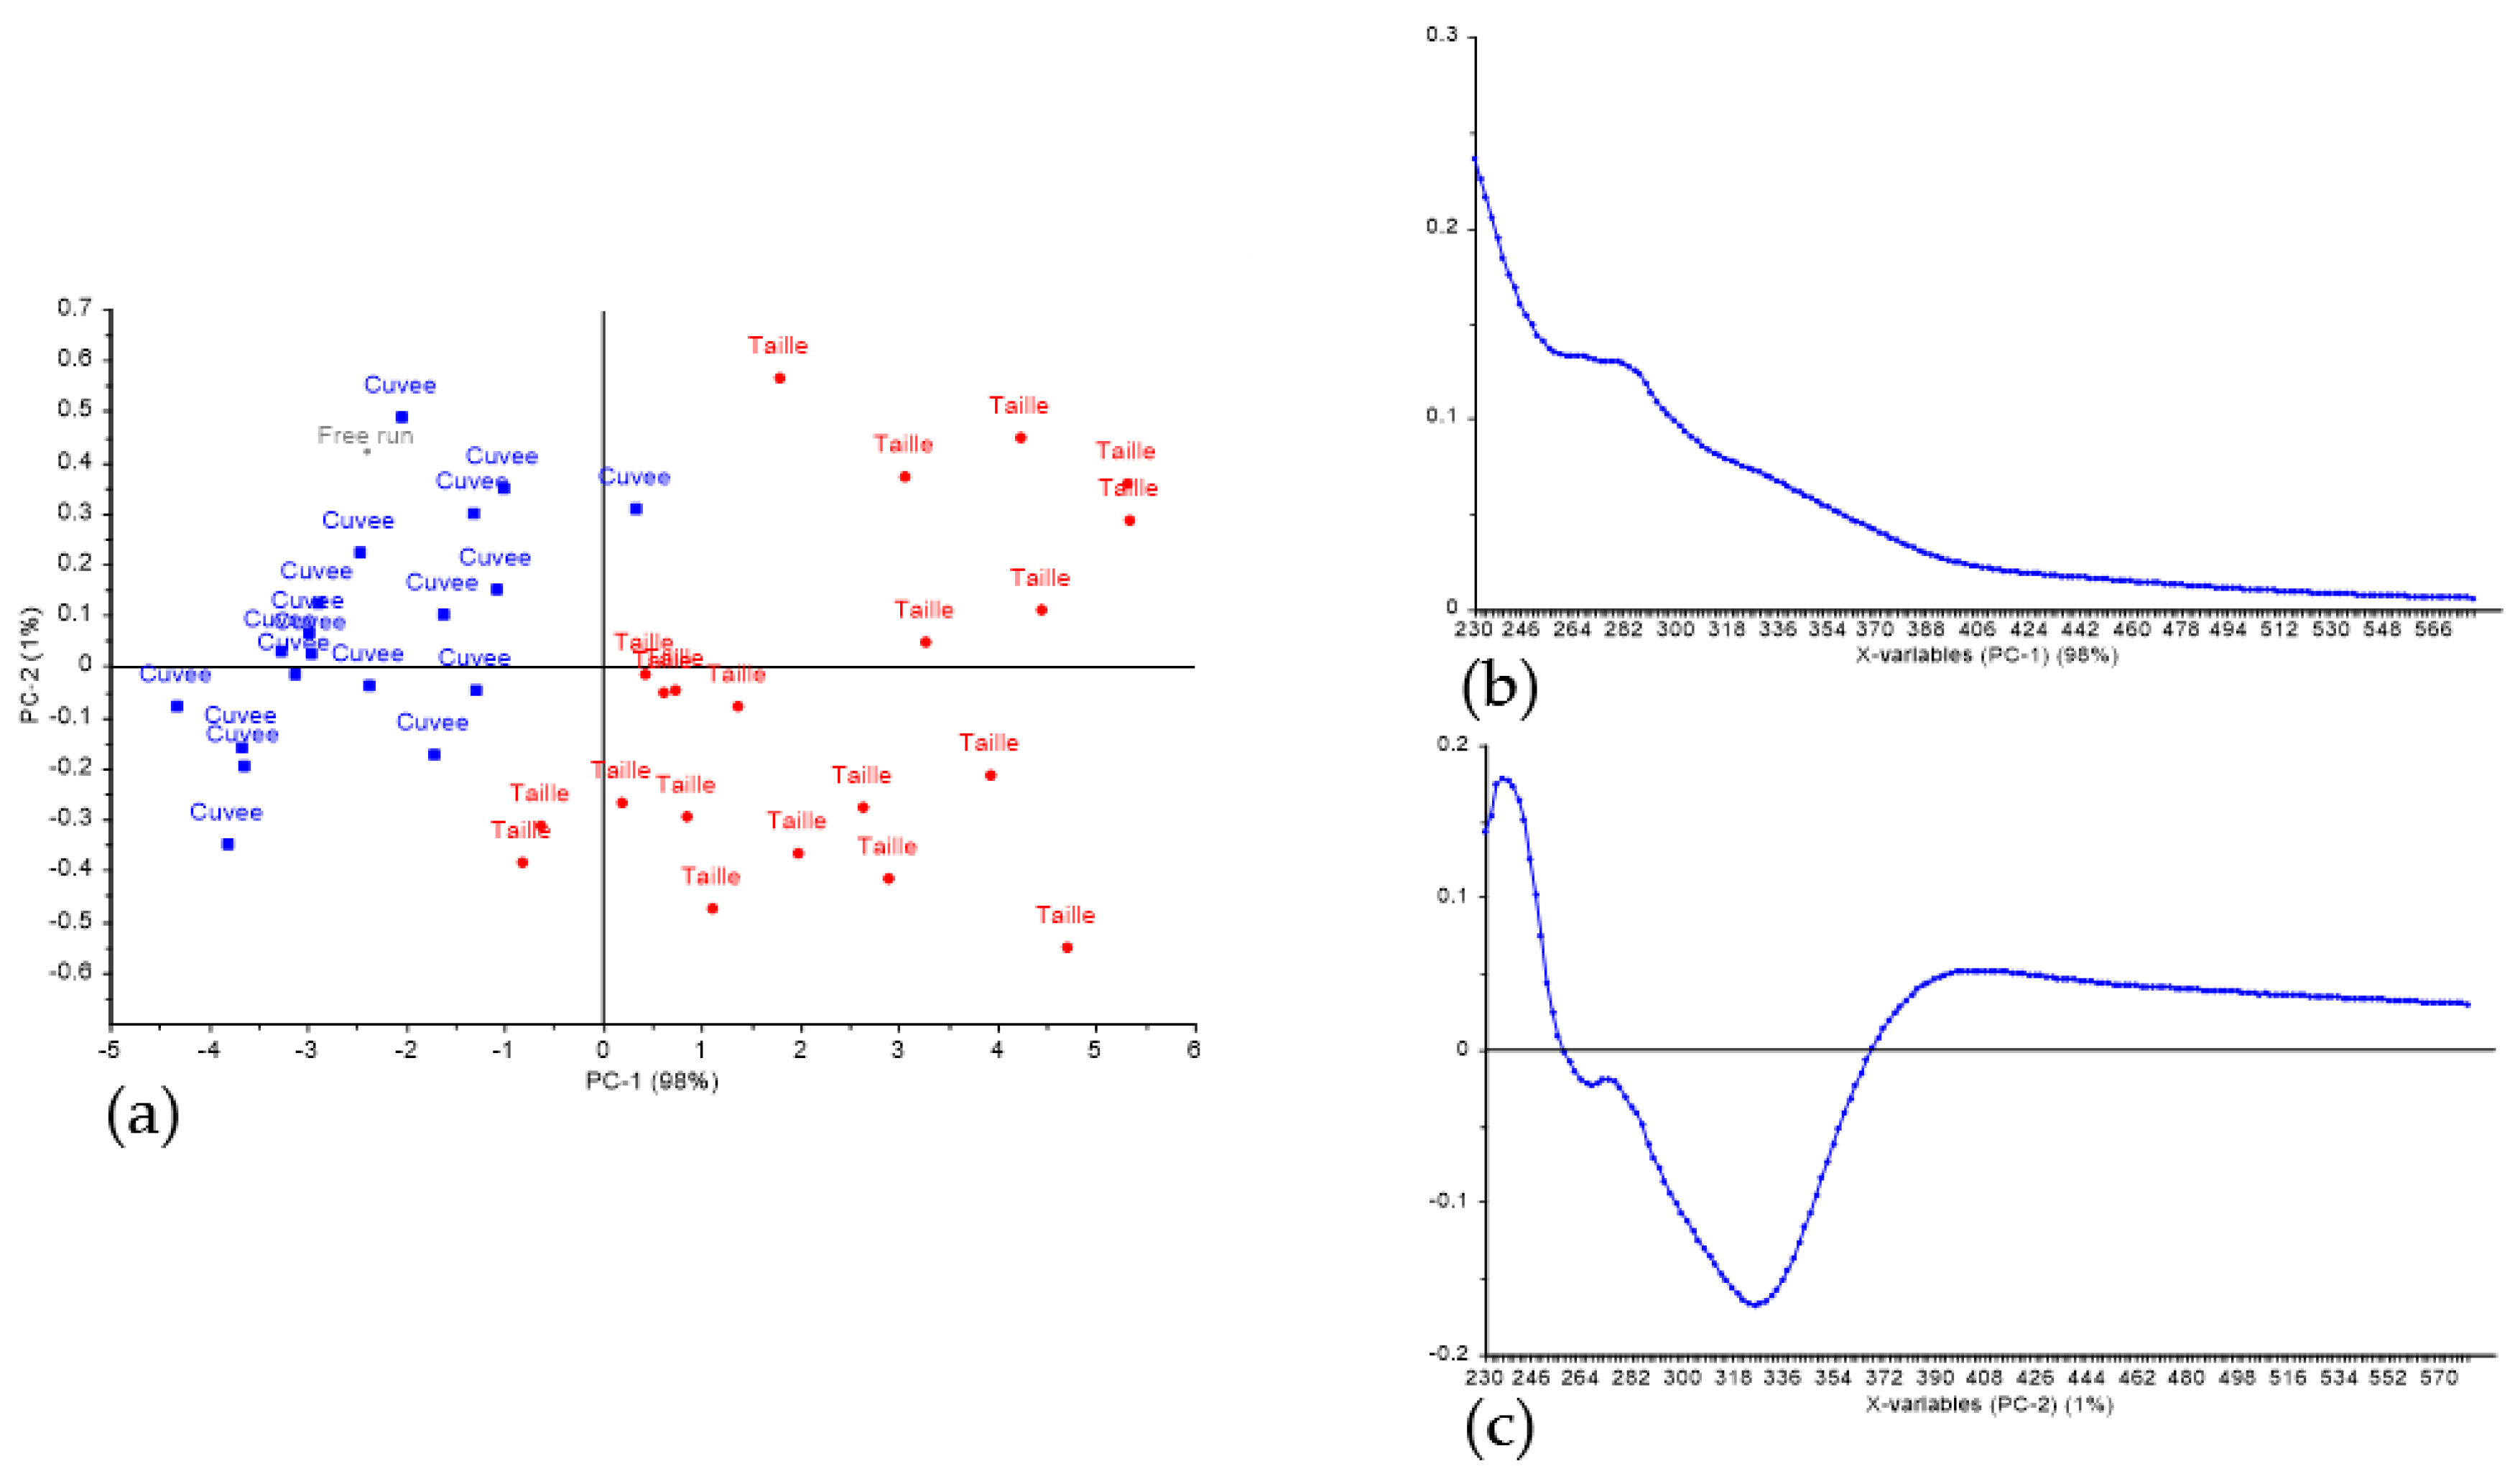
PCA scores and loadings plots of commercial Chardonnay and Pinot noir grape juice press fractions, are reported in Figure 4 and Figure 5 respectively. In the commercial scale trial, Chardonnay juice samples were strongly separated along PC 1 with 98% of the data variation explained (Figure 4a). Winemaker subjective assessment of juice quality as cuvée and taille corresponded with the UV-Vis SPF separation along PC 1. The loadings for PC 1 indicated that the taille fractions had higher phenolics, but unlike the laboratory press, the separation was not specifically influenced by the 330 nm peak indicative of hydroxycinnamates. This may be related to the operational nature of the press type [31] and oxidation conditions during the pomace break-up [32]. The laboratory press was a flat-bed press with only a thin layer of bunches that were pressed relatively quickly and with smaller fraction volumes, whereas the commercial press had greater skin contact time and the press load was rotated and pressed multiple times, allowing more extraction and oxidation. This again suggests that hydroxycinnamates are more readily extracted than other phenolics such as flavanols and tannin, possibly due to their different distribution within the berry of these varieties, or to skin contact conditions [9,33]. However, changes in phenolic composition with pressing could also be related to oxidation reactions occurring within the must when inside the press [8].
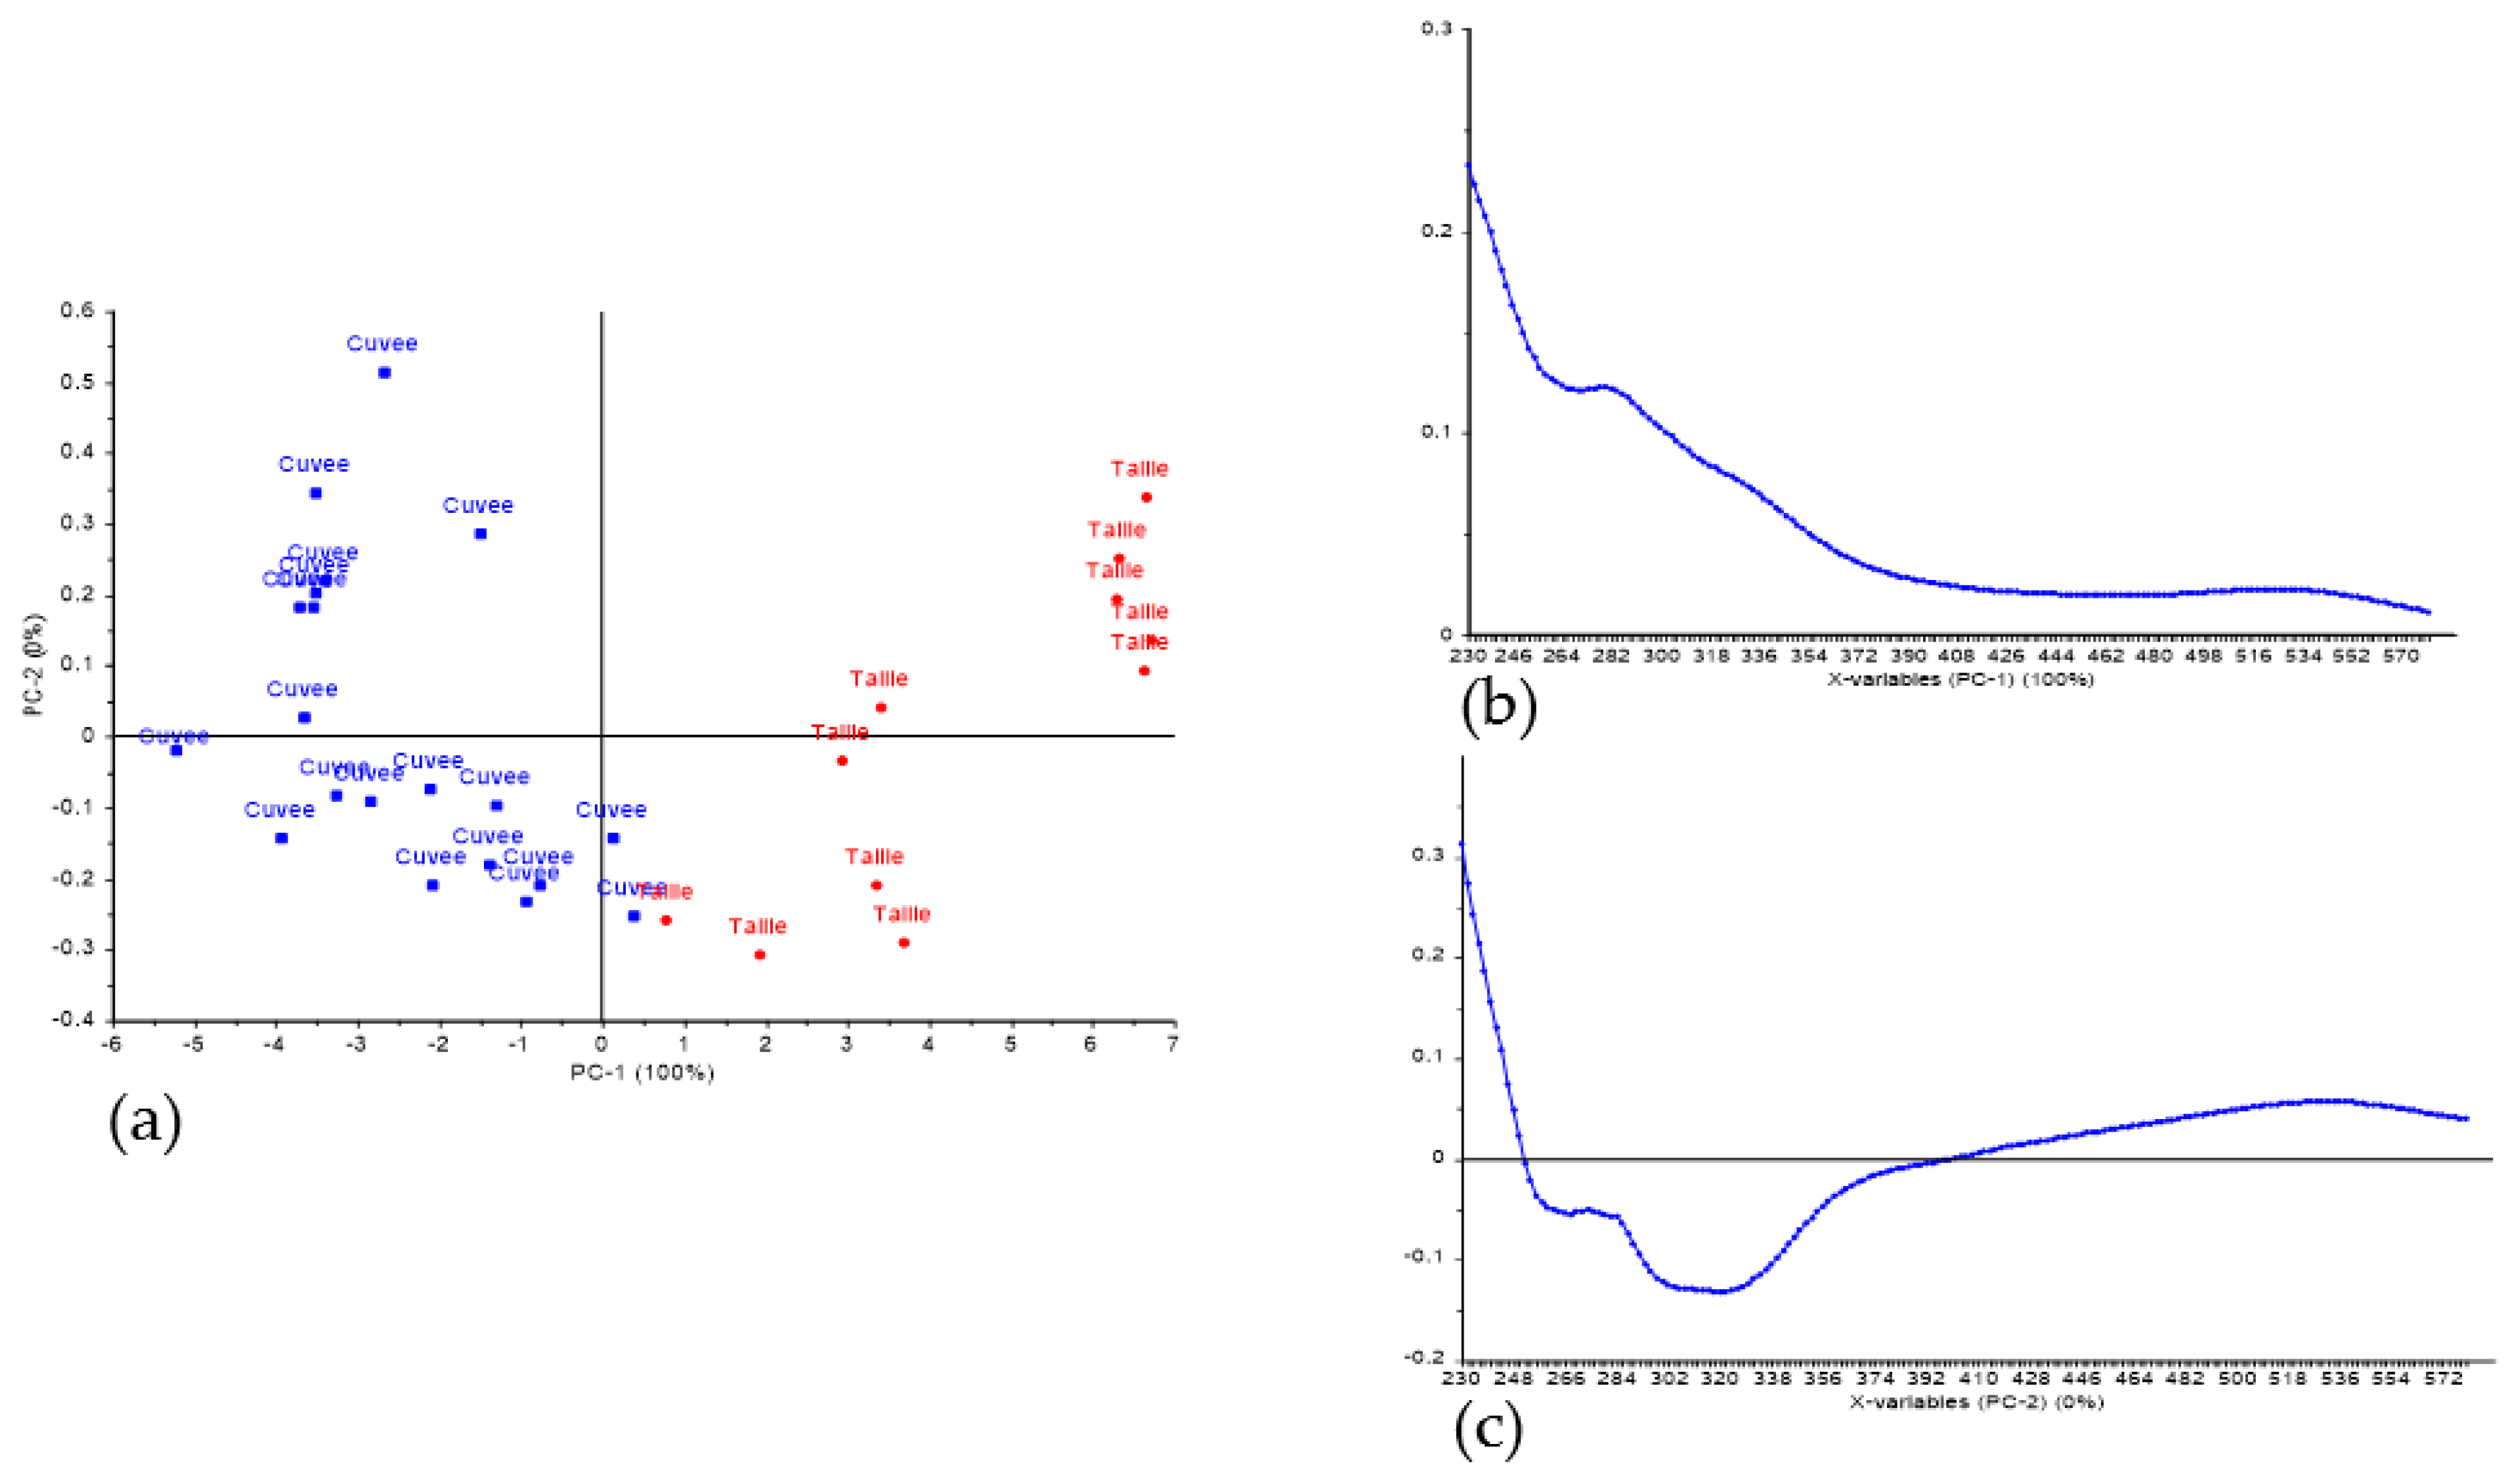
PCA of the 31 Pinot noir juice samples, gave similar associations as observed in the Chardonnay samples. PC 1 explained >99.9% of the data variability (Figure 5) and, the spectral loadings for PC 1 were indicative of higher phenolics in taille fractions without specificity for hydroxycinnamates. The press fractions were collected in chronological order during processing of a batch of grapes, so overlap of SPF would be expected at samples near the boundary of cuvée and taille. In the case of Figure 4a, PC 1 is the main component that separates fractions, but where samples overlap on PC 1, they are separated by PC 2, with cuvée having higher hydroxycinnamates on PC 2, agreeing with the laboratory scale press. In the case of Figure 5a the close samples near the zero point of PC 1 represent the boundary of the cuvée and taille fractions.
For both Chardonnay and Pinot noir, the relatively minor PC 2 indicated that separation within the fractions was influenced by absorbance at 330 nm, a hydroxycinnamate peak (Figure 4c and Figure 5c), particularly for Chardonnay.

4. Conclusions

Ultraviolet-Visible (UV-Vis) spectral phenolic fingerprinting (SPF) proved to be an effective tool when combined with PCA to qualitatively discriminate between cuvée (i.e., first grape juice press fraction) and taille (i.e., subsequent grape juice press fraction) of Chardonnay and Pinot noir grape varieties. As conventional methods for ‘phenolic pick-up’ (i.e., detection of drying, rough in-mouth perceptions) during grape juice press fractioning are often dependent on winemakers’ subjective assessment, UV-Vis SPF could be used as a rapid, reliable, and cost-efficient objective measure for precise grape juice press fractioning. The differences observed between the experimental flat-bed press and the commercial airbag press indicates that juice phenolic composition can be strongly influenced by the pressing method. Further investigation at different ripeness levels and using a broader range of grape varieties is warranted. Finally, using information from spectral data a quantitative quality index may be developed.

Author Contributions

F.K. and R.D. conceived and designed the experiments; F.K and R.D. performed the experiments; F.K., R.D. and R.L. analyzed the data. All authors contributed to the preparation of the manuscript.

Funding

We thank the Australian Government’s Industry Cooperative Innovation Program (ANZSIC 9621), the Tasmanian-based consortium, industry partners, Australian Wine Research Institute, Flextank, Croplands and Josef Chromy Wines.

Acknowledgments

We gratefully acknowledge Richard Smart and Angela Sparrow, formerly of the University of Tasmania, for their technical support and Karina Dambergs, formerly of Clover Hill Wines, for industry perspectives. We also thanks Matt Lowe, of Solutions in Stainless, for press co-design and construction.

Conflicts of Interest

The authors declare no conflicts of interest.

References

  1. Kemp, B.; Kerslake, F.; Nesbitt, A. Global wine regions with a new sparkle. Australian & New Zealand Grapegrower and Winemaker, 23 December 2014. [Google Scholar]
  2. Culbert, J.A.; Ristic, R.; Ovington, L.A.; Saliba, A.J.; Wilkinson, K.L. Sensory profiles and consumer acceptance of different styles of Australian Moscato. Aust. J. Grape Wine Res. 2018, 24, 96–104. [Google Scholar] [CrossRef]
  3. Culbert, J.; Verdonk, N.; Ristic, R.; Olarte Mantilla, S.; Lane, M.; Pearce, K.; Cozzolino, D.; Wilkinson, K. Understanding consumer preferences for Australian sparkling wine vs. French Champagne. Beverages 2016, 2, 19. [Google Scholar] [CrossRef]
  4. Kemp, B.; Alexandre, H.; Robillard, B.; Marchal, R. Effect of production phase on bottle-fermented sparkling wine quality. J. Agric. Food Chem. 2015, 63, 19–38. [Google Scholar] [CrossRef] [PubMed]
  5. Pozo-Bayón, M.Á.; Martínez-Rodríguez, A.; Pueyo, E.; Moreno-Arribas, M.V. Chemical and biochemical features involved in sparkling wine production: From a traditional to an improved winemaking technology. Trends Food Sci. Technol. 2009, 20, 289–299. [Google Scholar] [CrossRef]
  6. Jégou, S.; Hoang, D.A.; Salmon, T.; Williams, P.; Oluwa, S.; Vrigneau, C.; Doco, T.; Marchal, R. Effect of grape juice press fractioning on polysaccharide and oligosaccharide compositions of Pinot Meunier and Chardonnay Champagne base wines. Food Chem. 2017, 232, 49–59. [Google Scholar] [CrossRef] [PubMed]
  7. Culbert, J.A.; McRae, J.M.; Condé, B.C.; Schmidtke, L.M.; Nicholson, E.L.; Smith, P.A.; Howell, K.S.; Boss, P.K.; Wilkinson, K.L. Influence of production method on the chemical composition, foaming properties, and quality of Australian carbonated and sparkling white wines. J. Agric. Food Chem. 2017, 65, 1378–1386. [Google Scholar] [CrossRef] [PubMed]
  8. Gawel, R.; Day, M.; Van Sluyter, S.C.; Holt, H.; Waters, E.J.; Smith, P.A. White wine taste and mouthfeel as affected by juice extraction and processing. J. Agric. Food Chem. 2014, 62, 10008–10014. [Google Scholar] [CrossRef] [PubMed]
  9. Ferreira-Lima, N.E.; Burin, V.M.; Caliari, V.; Bordignon-Luiz, M.T. Impact of pressing conditions on the phenolic composition, radical scavenging activity and glutathione content of Brazilian Vitis vinifera white wines and evolution during bottle ageing. Food Bioprocess Technol. 2016, 9, 944–957. [Google Scholar] [CrossRef]
  10. Hardy, G. Le pressurage, élément primordial de la qualité des vins de base en méthode champenoise. Rev. OEnologues 1990, 55, 17–25. [Google Scholar]
  11. Blanck, G.; Valade, M. Le fractionnement des moûts. Le Vign. Champen. 1989, 5, 266–277. [Google Scholar]
  12. Bosch-Fusté, J.; Sartini, E.; Flores-Rubio, C.; Caixach, J.; López-Tamames, E.; Buxaderas, S. Viability of total phenol index value as quality marker of sparkling wines, “cavas”. Food Chem. 2009, 114, 782–790. [Google Scholar] [CrossRef]
  13. Waterhouse, A.L.; Sacks, G.L.; Jeffery, D.W. Understanding Wine Chemistry; John Wiley & Sons: Hoboken, NJ, USA, 2016. [Google Scholar]
  14. Hayes, J.; Nolden, A. Biologically driven differences in sensation: Implications for the wine industry. In Proceedings of the 16th Australian Wine Industry Technical Conference, Adelaide, Australia, 24–28 July 2016; Beames, K., Robinson, E., Dry, P., Johnson, D., Eds.; Glen Osmond, South Australia, The Australian Wine Industry Technical Conference Inc.: Adelaide, Australia, 2017; pp. 120–127. [Google Scholar]
  15. Saurina, J. Characterization of wines using compositional profiles and chemometrics. Trends Anal. Chem. 2010, 29, 234–245. [Google Scholar] [CrossRef]
  16. Azcarate, S.M.; Cantarelli, M.Á.; Pellerano, R.G.; Marchevsky, E.J.; Camiña, J.M. Classification of Argentinean Sauvignon Blanc wines by uv spectroscopy and chemometric methods. J. Food Sci. 2013, 78, C432–C436. [Google Scholar] [CrossRef] [PubMed]
  17. Casale, M.; Oliveri, P.; Armanino, C.; Lanteri, S.; Forina, M. Nir and UV-Vis spectroscopy, artificial nose and tongue: Comparison of four fingerprinting techniques for the characterisation of Italian red wines. Anal. Chim. Acta 2010, 668, 143–148. [Google Scholar] [CrossRef] [PubMed]
  18. Girschik, L.; Jones, J.E.; Kerslake, F.L.; Robertson, M.; Dambergs, R.G.; Swarts, N.D. Apple variety and maturity profiling of base ciders using UV spectroscopy. Food Chem. 2017, 228, 323–329. [Google Scholar] [CrossRef] [PubMed]
  19. Aleixandre-Tudo, J.L.; Nieuwoudt, H.; Olivieri, A.; Aleixandre, J.L.; du Toit, W. Phenolic profiling of grapes, fermenting samples and wines using UV-Visible spectroscopy with chemometrics. Food Control 2018, 85, 11–22. [Google Scholar] [CrossRef]
  20. Pearce, K.; Culbert, J.; Cass, D.; Cozzolino, D.; Wilkinson, K. Influence of sample storage on the composition of carbonated beverages by MIR spectroscopy. Beverages 2016, 2, 26. [Google Scholar] [CrossRef]
  21. Schmidtke, L.M.; Smith, J.P.; Müller, M.C.; Holzapfel, B.P. Rapid monitoring of grapevine reserves using ATR–FT-IR and chemometrics. Anal. Chim. Acta 2012, 732, 16–25. [Google Scholar] [CrossRef] [PubMed]
  22. Culbert, J.; Cozzolino, D.; Ristic, R.; Wilkinson, K. Classification of sparkling wine style and quality by MIR spectroscopy. Molecules 2015, 20, 8341–8356. [Google Scholar] [CrossRef] [PubMed]
  23. Schueuermann, C.; Khakimov, B.; Engelsen, S.B.; Bremer, P.; Silcock, P. GC-MS metabolite profiling of extreme southern Pinot Noir wines: Effects of vintage, barrel maturation, and fermentation dominate over vineyard site and clone selection. J. Agric. Food Chem. 2016, 64, 2342–2351. [Google Scholar] [CrossRef] [PubMed]
  24. Luthria, D.L.; Mukhopadhyay, S.; Robbins, R.J.; Finley, J.W.; Banuelos, G.S.; Harnly, J.M. UV spectral fingerprinting and analysis of variance-principal component analysis: A useful tool for characterizing sources of variance in plant materials. J. Agric. Food Chem. 2008, 56, 5457–5462. [Google Scholar] [CrossRef] [PubMed]
  25. Dambergs, R.G.; Mercurio, M.D.; Kassara, S.; Cozzolino, D.; Smith, P.A. Rapid measurement of methyl cellulose precipitable tannins using ultraviolet spectroscopy with chemometrics: Application to red wine and inter-laboratory calibration transfer. Appl. Spectrosc. 2012, 66, 656–664. [Google Scholar] [CrossRef] [PubMed]
  26. Brereton, R.G. Chemometrics: Data Analysis for the Laboratory and Chemical Plant; John Wiley & Sons: Hoboken, NJ, USA, 2003. [Google Scholar]
  27. Chamkha, M.; Cathala, B.; Cheynier, V.; Douillard, R. Phenolic composition of Champagnes from Chardonnay and Pinot Noir vintages. J. Agric. Food Chem. 2003, 51, 3179–3184. [Google Scholar] [CrossRef] [PubMed]
  28. Vérette, E.; Noble, A.C.; Somers, T.C. Hydroxycinnamates of Vitis vinifera: Sensory assessment in relation to bitterness in white wines. J. Sci. Food Agric. 1988, 45, 267–272. [Google Scholar] [CrossRef]
  29. Mercurio, M.D.; Dambergs, R.G.; Herderich, M.J.; Smith, P.A. High throughput analysis of red wine and grape phenolics adaptation and validation of methyl cellulose precipitable tannin assay and modified somers color assay to a rapid 96 well plate format. J. Agric. Food Chem. 2007, 55, 4651–4657. [Google Scholar] [CrossRef] [PubMed]
  30. Cozzolino, D.; Cynkar, W.U.; Shah, N.; Dambergs, R.G.; Smith, P.A. A brief introduction to multivariate methods in grape and wine analysis. Int. J. Wine Res. 2009, 2009, 123–130. [Google Scholar] [CrossRef]
  31. Yokotsuka, K. Effect of press design and pressing pressures on grape juice components. J. Ferment. Bioeng. 1990, 70, 15–21. [Google Scholar] [CrossRef]
  32. Cheynier, V.; Masson, G.; Rigaud, J.; Moutounet, M. Estimation of must oxidation during pressing in champagne. Am. J. Enol. Vitic. 1993, 44, 393–399. [Google Scholar]
  33. Gómez-Míguez, M.J.; González-Miret, M.L.; Hernanz, D.; Fernández, M.Á.; Vicario, I.M.; Heredia, F.J. Effects of prefermentative skin contact conditions on colour and phenolic content of white wines. J. Food Eng. 2007, 78, 238–245. [Google Scholar] [CrossRef]
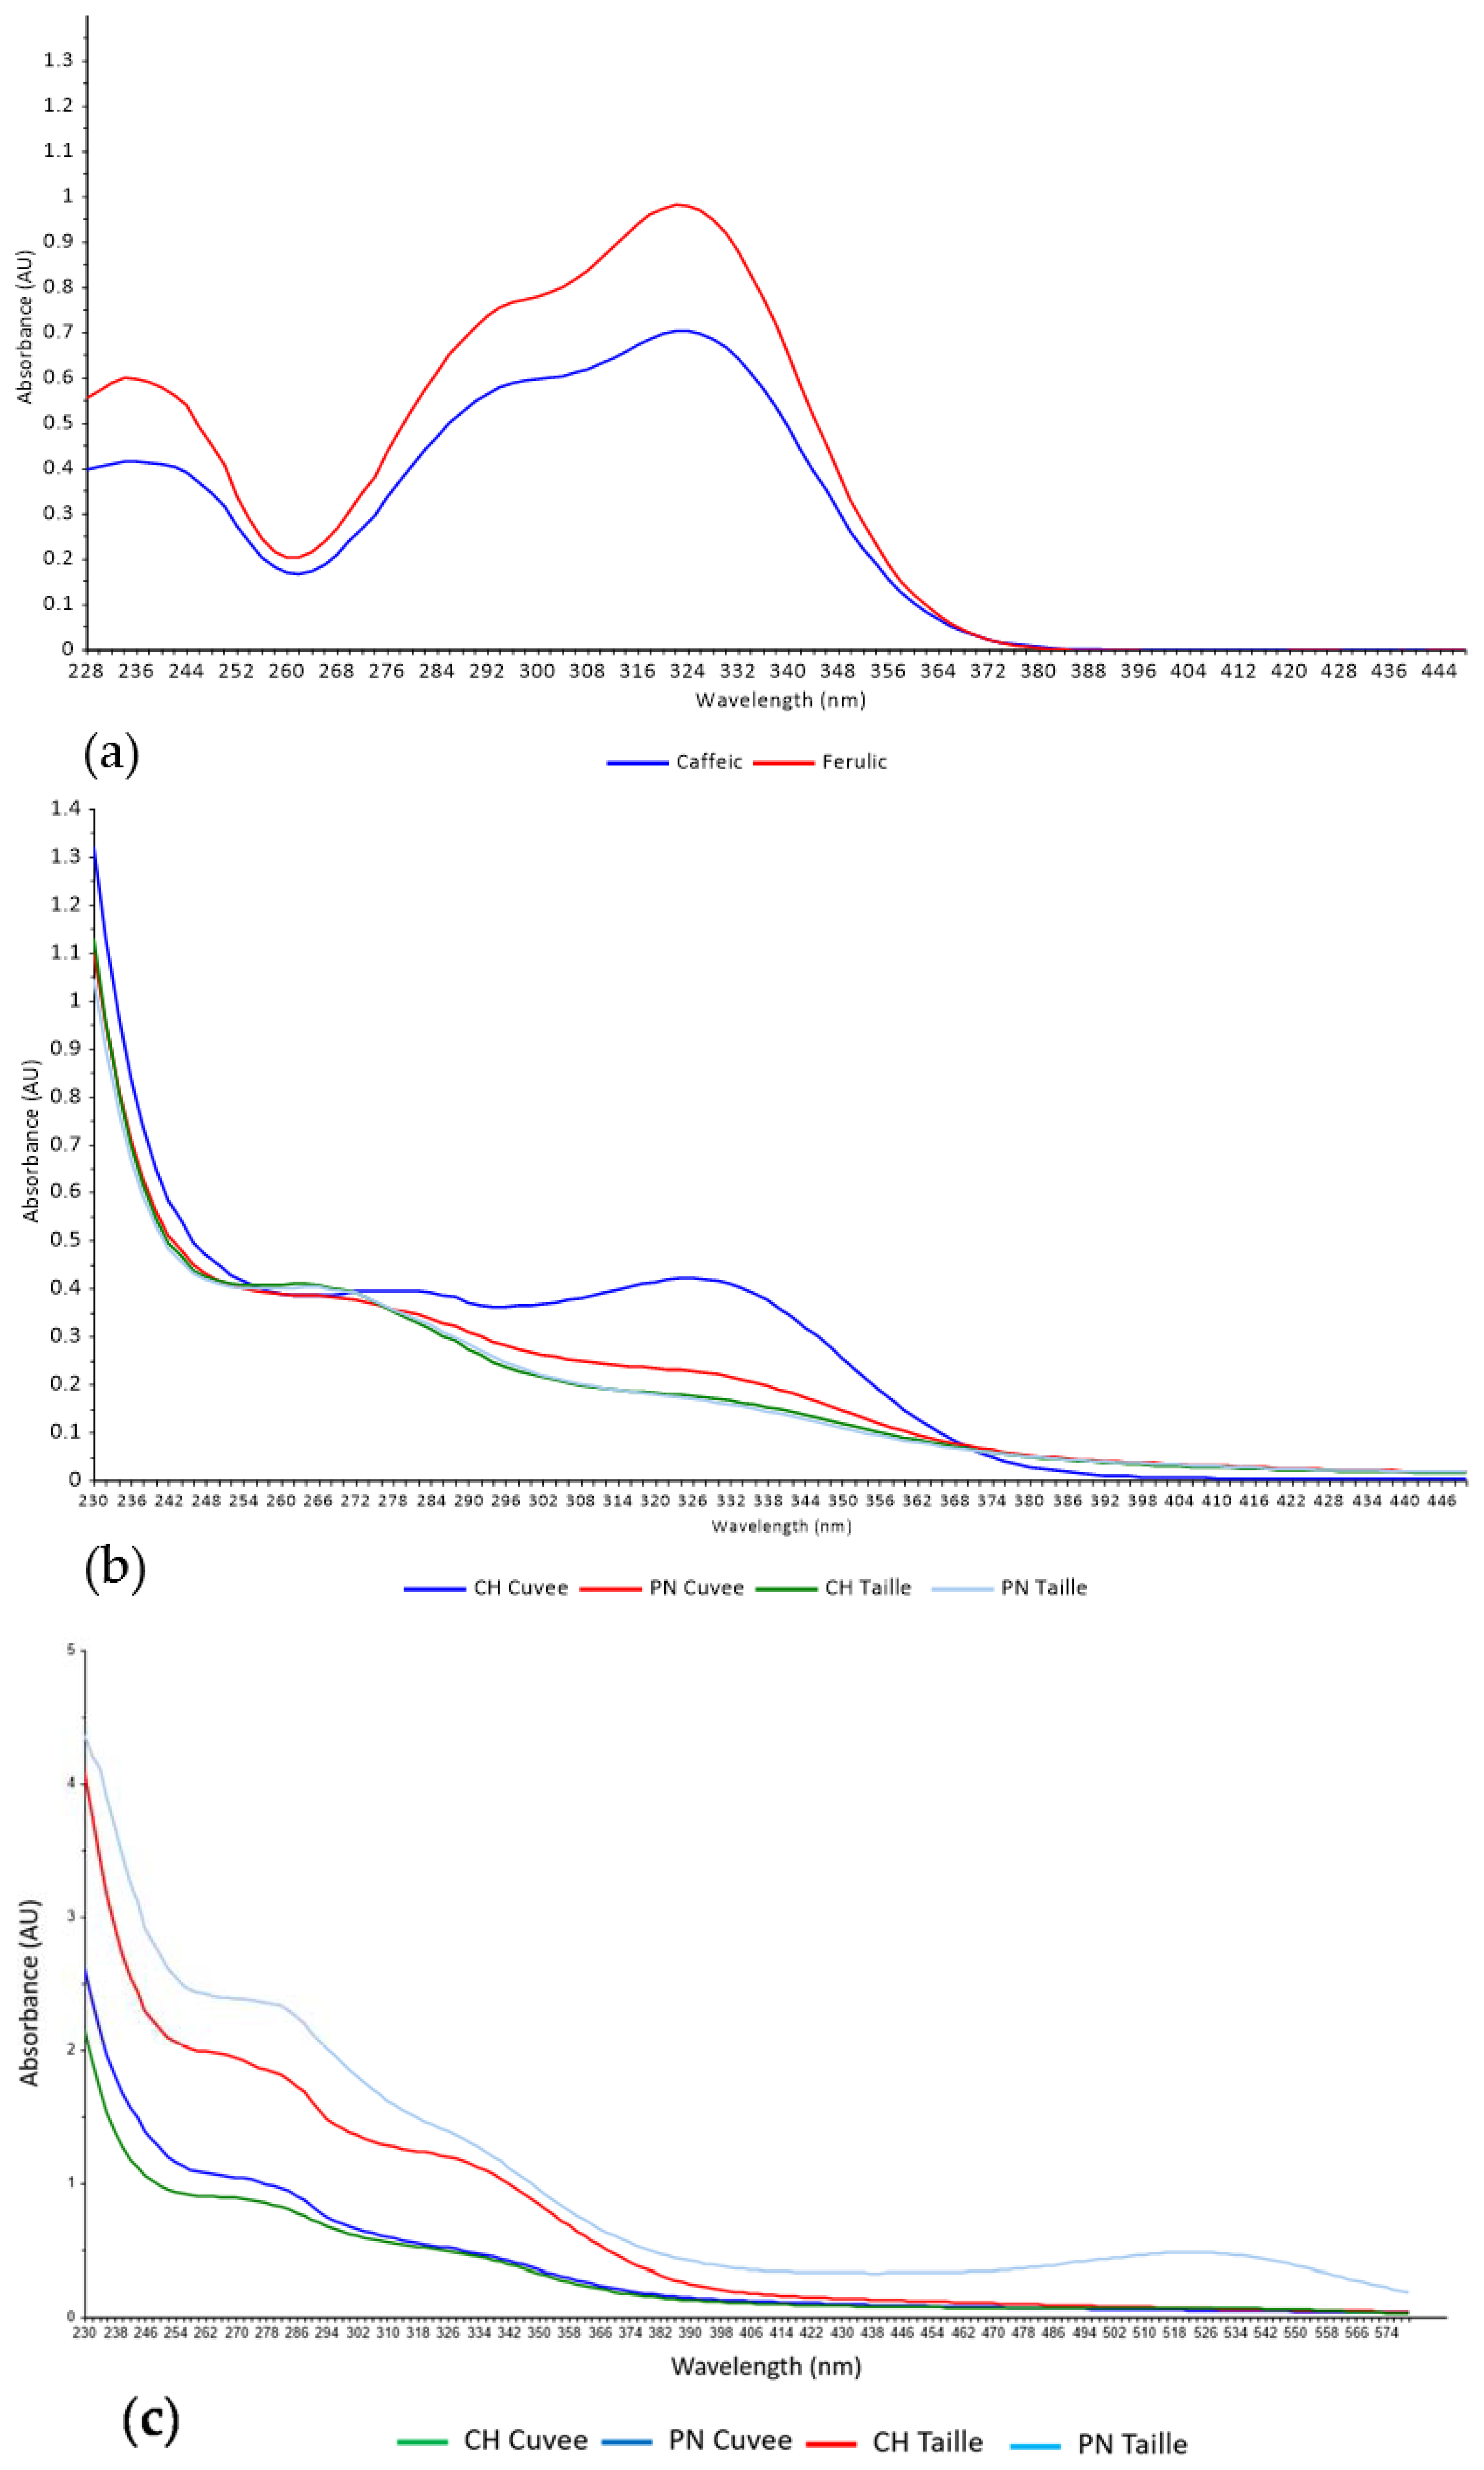
Figure 1. (a) Raw UV-Vis spectra of hydroxycinnamate ethanolic solutions, diluted in 1 M HCl; of (b) laboratory scale Chardonnay (CH) and Pinot noir (PN) cuvee and taille trials; and of (c) commercial scale Chardonnay (CH) and Pinot noir (PN) cuvee and taille trials.
Beverages 04 00045 g001
Figure 2. PCA scores and loadings plots of 2011 Chardonnay juice samples from the laboratory scale trial discriminating cuvée from taille. Scores plots (a); PC 1 (b) and PC 2 (c) loadings.
Beverages 04 00045 g002
Figure 3. PCA scores and loadings plots of 2011 Pinot noir juice samples from the laboratory scale trial discriminating cuvée from taille. Scores plots (a); PC 1 (b) and PC 2 (c) loadings.
Beverages 04 00045 g003
Figure 4. PCA scores and loadings plots of 2012 Chardonnay juice samples from the commercial scale trial discriminating cuvée from taille. Scores plots (a); PC 1 (b) and PC 2 (c) loadings.
Beverages 04 00045 g004
Figure 5. PCA scores and loadings plots of 2012 Pinot noir juice samples from the commercial scale trial discriminating cuvée from taille. Scores plots (a); PC 1 (b) and PC 2 (c) loadings.
Beverages 04 00045 g005
Table 1. Pressing operation parameters during the 2011/12 commercial scale trial.
VarietyPress FractionNumber of SamplesPress CyclePressure (Bar)
ChardonnayCuvée (481 L ton−1)21Free runFree run
10.2, 0.4, 0.6, 0.8, 1.1
20.2, 0.4, 0.6, 0.8, 1.1
30.2, 0.4, 0.6, 0.8, 1.1, 1.4
40.4, 0.6, 0.8, 1.1
Taille (228 L ton−1)2141.4
50.6, 0.8, 1.1, 1.4, 1.7
60.6, 0.8, 1.1, 1.4, 1.7
70.6, 0.8, 1.1, 1.4, 1.7
80.6, 0.8, 1.1, 1.4, 1.7
Pinot noirCuvée (502 L ton−1)22Free runFree run
10.2, 0.4, 0.6, 0.8, 1.1
20.2, 0.4, 0.6, 0.8, 1.1
30.4, 0.6, 0.8, 1.1, 1.4
40.4, 0.6, 0.8, 1.1
41.4, 1.7
Taille (200 L ton−1)950.6, 0.8, 1.1, 1.4
60.6, 0.8, 1.1, 1.4, 1.7