Abstract
The development of a lactose-free beverage comes as a new feeding alternative to a product with excellent nutritional and functional characteristics to individuals with food restrictions related to milk. Thus, this study aimed to develop a cashew nut beverage with added mango juice and prebiotic substances by means of evaluating its sensory characteristics and physicochemical optimization. A 22 central composite rotatable design with five repetitions at the central point was applied to evaluate the effect of sugar and juice contents on the analyzed parameters. Data were evaluated by means of the response surface methodology, analysis of variance, and the means comparison test. Formulations with greater combined concentrations of juice and sugar obtained satisfactory acceptance. The means comparison test showed that the formulation that allows for the beverage’s greatest acceptance must contain 40% mango juice and 8% sugar. Soluble solids content was influenced only by the addition of sugar, where the formulations that presented greater solids concentration were the ones which obtained greater sensory acceptance. The beverage’s acidity was influenced only by the juice content, which, besides making formulations significantly more acid, did not affect their acceptance.
1. Introduction
Global demand for products that do not have milk in their composition has been greatly increasing due to health problems related to some of the nutrients that compose them [1]. The most common problem related to this food are lactose intolerance [2] and allergy to the protein in milk, especially cow’s milk, which, despite being less common, can cause food restrictions to consumers [3]. People following a vegan diet or looking for food with low levels of cholesterol, lipids, and calories should also be considered [4]. All these factors assembled make the continuous search for food that substitutes the use of milk in different food products necessary, constituting a potential market.
Among the raw materials that can be used as substitutes for milk in making food products, cashew nut kernel stands out as a good alternative due to its excellent nutritional characteristics. In this kernel, all amino acids essential for adult and children can be found, in addition to a lipid fraction constituted mainly of mono- and polyunsaturated fatty acids [5]. Moreover, there is also a variety of bioactive substances (phenolic compounds, sterols, and tocopherols) with antioxidant capacity and the following minerals: magnesium, calcium, selenium, manganese, and, especially, iron [6]. On the other hand, mango is a fruit much appreciated due to its sensory attributes such as color, aroma, and flavor [7]. It also has excellent nutritional properties and is a source of ascorbic acid, carotenoids, polyphenolic compounds, and other antioxidant substances [8]. Thus, the association of these two raw materials for the formulation of new products with desired sensory and nutritional characteristics is very promising.
The prebiotic substances of the inulin type are part of a group of carbohydrates named fructans that comprehends oligo- and polysaccharides that are naturally found in plants [9]. It is the consensus that these substances have bifidogenic effects in children and adults [10]. Predominance of bifidobacteria in the large intestine is essential for preventing several illnesses and for the maintenance of health [11]. Prebiotics can be added to food based on their technological characteristics or on their nutritional properties, promoting a better sensory quality and a balanced nutritional composition [12,13,14]. Thus, the development of a lactose-free beverage comes as a new feeding alternative to a product with excellent nutritional and functional characteristics to individuals with restrictions to milk. In this way, this study aimed to develop a cashew nut beverage with added mango juice and prebiotic substances through the evaluation of its sensory characteristics and physicochemical optimization.
2. Materials and Methods
2.1. Formulation of Beverages
For the elaboration of the formulations, the following ingredients were used: hydrosoluble extract of cashew nut kernels (HEKs) (3.46 g carbohydrates, 6.22 g lipids, 3.41 g proteins, 0.35 g ashes, 3.6° Brix, 6.56 pH), mango juice, sugar, and a mixture of inulin (polymerization degree ≥ 10, Orafti GR) and oligofructose (2 to 8 monomers, Orafti P95) at a 1:1 ratio. The HEKs were obtained following the methodology described by Rebouças et al. [15], who used broken cashew nuts classified as butts and have a low cost.
The beverages were formulated following a 2-factor rotatable central composite design with five repetitions at the central point, using mango juice and sugar concentrations as independent variables (Table 1) and using their effect over the acceptance of the sensory attributes and physicochemical parameters (dependent variables). Based on the concentrations determined by the experimental design, the formulations contained added HEKs and the prebiotic mixture (w/v), as can be seen in Table 1.

Table 1.
Experimental design and ingredients used for the formulation of beverages.
The ingredients were homogenized at a rotation of 900 rpm for one minute. After obtaining the beverages, they were stored into 200-mL polystyrene bottles and subjected to thermal treatment at 65 °C for 2 min. Then, the samples were cooled and kept under refrigeration (7 °C) until the analyses were carried out.
2.2. Sensory Analysis
In order to evaluate the acceptance of the different formulations concerning the sensory attributes of color, aroma, flavor, sweetness, thickness, and overall impression, a 9-point structured hedonic scale test (9 = “extremely like”; 5 = “neither like nor dislike”; 1 = “extremely dislike”) was used.
The test was conducted in a sensory laboratory using individual booths under artificial daylight illumination. The samples were served in a monadic sequential way in cups codified with three random digits containing 25 mL of the beverage. The serving order followed an incomplete blocks design in which each panelist tasted 4 out of the 13 formulations being tested [16].
The sensory evaluation was conducted with 130 panelists, mostly composed of females (77.69%), aging between 18 and 25 years (78.46%) and undergraduate students (86.15%). The selection criterion adopted was based on the regular consumption of cashew nut kernels and mango juice by the participants.
2.3. Physicochemical Analysis
The methodology used in determining the pH, the total titratable acidity (TTA), and the soluble solids (SS) was the one described by Instituto Adolfo Lutz [17]. The pH of the formulations was measured using a pH meter model 3505 (Jenway, Staffordshire, UK). TTA was determined by the reaction with a NaOH solution and expressed in citric acid percentage and the SS concentration was verified via a refractometer model PAL-1 (Atago, Tokyo, Japan).
2.4. Data Analysis
Mathematical models adjusted to a quadratic equation were used to evaluate the effect of sugar and mango juice concentrations over the acceptance of sensory attributes and physicochemical determinations (Equation (1)).
where Y is the predicted response (sensory acceptance and physicochemical determination), β0 is the constant, X1 and X2 are the independent variables (mango juice and sugar), and β1, β2, β11, β22, and β12 are the coefficients of regression (linear, quadratic, and interaction).
Y = β0 + β1X1 + β2X2 + β11X21 + β22X22 + β12X1X2 + Error,
The models were subjected to ANOVA in order to evaluate the quality of adjustment and the significance of the effects (linear, quadratic, and interaction). Based on the coefficient of determination (R2), the coefficient of determination adjusted (R2adjusted), and the analysis of lack of fit, the quality of the models obtained was evaluated so that the response surface graphs could be generated. The models that presented a lack of significant adjustment were analyzed by the ANOVA and Tukey’s test to compare means (α = 0.05). All analyses were performed using the statistical software Statistica version 7.0.
3. Results
3.1. Sensory Evaluation
The tests of analysis of variance of the obtained models for the sensory evaluated attributes showed a significant lack of fit (p < 0.05), so the response surfaces were not used to analyze the effect of juice and sugar concentrations on the formulations’ acceptability due to the fact that the models were not predictive.
The sensory evaluation results indicate that, in general, the formulations attained satisfactory sensory acceptance, reaching hedonic scores around 6.0 (slightly like) and 7.0 (moderately like) (Table 2). Only Formulation 1 (20% juice; 4% sugar) and 6 (16% juice; 6% sugar) had means correspondent to rejection in some attributes. Analyzing the results through the means comparison test, it is possible to observe that the most accepted beverages in all the evaluated sensory attributes were Formulations 4 (40% mango juice and 8% sugar), 6 (44% mango juice and 6% sugar), and 8 (30% mango juice and 9% sugar). In general, products within the combined range of sugar addition between 6% and 9% and juice between 30% and 44% varied little in the acceptance of all attributes evaluated, while products outside those ranges varied much more, usually producing lower scores for key characteristics.
Table 2.
Average results of sensory evaluation (n = 130 consumers).
3.2. Physicochemical Analysis
The quantity of SS of the formulations varied between 13.7° (Formulation 7) and 17.2° Brix (Formulation 8), the formulations with lowest and highest sugar concentrations, respectively (Table 3).
Table 3.
Physicochemical analysis results for each formulation.
Regarding pH, the values varied between 4.12 (Formulation 6) and 4.89 (Formulation 5)—the beverages with the highest and lowest juice concentrations, respectively. As expected, the same behavior was observed with respect to TTA, which varied between 0.25% (Formulation 5) and 0.46% (Formulation 6). The formulations with higher juice concentrations were the ones that obtained the lowest pH values and highest TTA (Table 3).
Satisfactory mathematical models were obtained regarding pH and SS (p < 0.05) with a non-significant lack of fit (p > 0.05), which means that the model’s error and its replicates were small and that these can be used for prediction. Regarding TTA, due to a significant lack of fit (p < 0.05), the response surfaces were not evaluated.
The formulations’ SS were influenced only by the sugar concentration (Equation (2)). The positive effect of adding this variable can be seen in the response surface (Figure 1), where the gradual increase in the sugar content led to a higher concentration of solids in the beverage.
Soluble Solids = 11.44 + 0.751 Sugar − 0.010 Sugar2
(R2 = 0.94; R2adjus = 0.93; p-value (lack of fit) = 0.62).
(R2 = 0.94; R2adjus = 0.93; p-value (lack of fit) = 0.62).
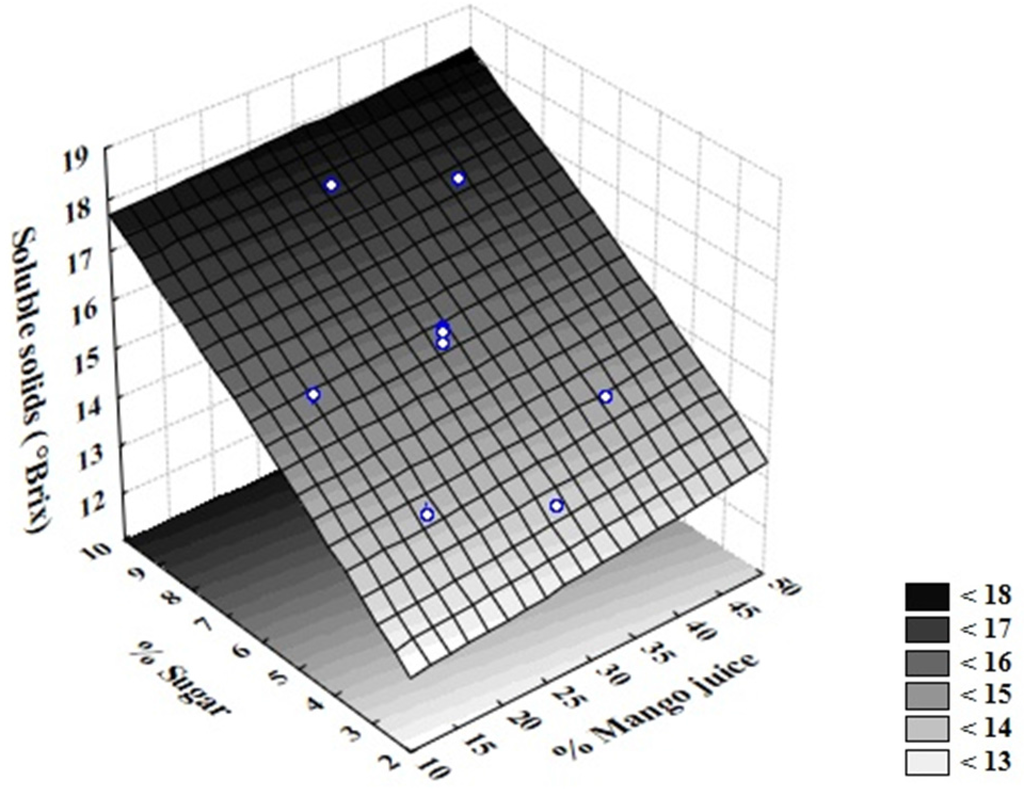
Figure 1.
Effect of the addition of sugar and mango juice on the concentration of soluble solids.
With respect to pH, only the variable juice in its linear effect was significant. In Equation (3), it can be seen that this effect is negative, which means that a decrease in juice content leads to a pH increase and vice versa, according to the response surface obtained (Figure 2).
pH = 5.47 − 0.037 Juice + 0.0001 Juice2
(R2 = 0.98; R2adjus = 0.98; p-value (lack of fit) = 0.12).
(R2 = 0.98; R2adjus = 0.98; p-value (lack of fit) = 0.12).
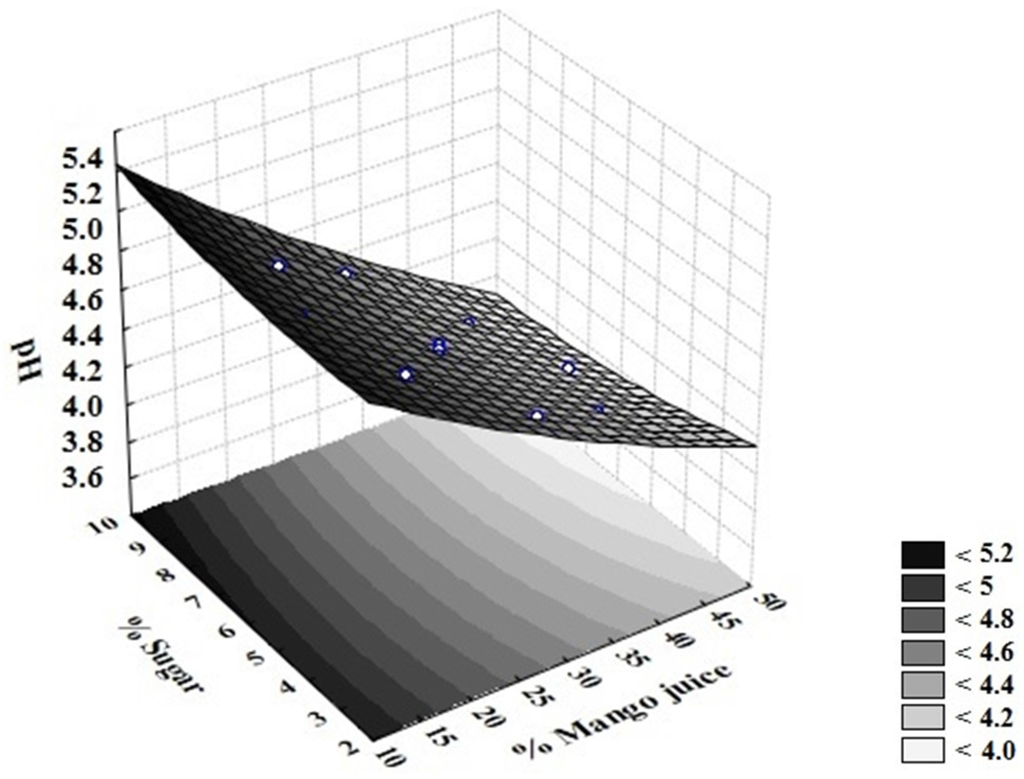
Figure 2.
Effect of the addition of sugar and mango juice on the concentration of pH.
4. Discussion
It was not possible to adequate a mathematical model that would explain the effect of the studied independent variables over the acceptance of the sensory attributes. According to Villegas et al. [18], when one works with response surface methodology for the acceptance optimization of a product, it is necessary to take into account that there is not always a cause–effect link between the controlled independent variables (ingredients) and the dependent variable (acceptance). According to these authors, generally, it is very hard to make predictions about possible perceptible differences between products that are different in composition as a result of changes in their formulation, even more so to predict consumers’ degree of acceptance. These authors describe two questions to be considered in studies on food acceptability: how consumers perceive the sensory characteristics of products and how the variation perceived in the sensory characteristics influences consumers’ responses.
In the means comparison test, the formulations that had more elevated combined concentrations of juice and sugar obtained a higher amount of acceptance compared with all of the studied sensory attributes. Studies carried out with vegetal hydrosoluble extract-based products with added fruit juices have also obtained higher amounts of acceptance as to overall impression when higher concentrations of juice were added [1,4,15,19,20,21].
Soluble solid contents in fruit juices correspond greatly to the concentrations of sugar, organic acids, and minerals [22]. Nonetheless, because the evaluated beverage is a mixture of fruit juice and cashew nut kernel hydrosoluble extract, these contents will also correspond to other solids in solution such as proteins and the added prebiotic substances. Due to these factors, it was expected that the higher the addition of sugar and juice, the higher the solid content in the beverage, as was observed. The solid content can influence foods’ texture, sweetness [21], and flavor [22]. Regarding the last attribute, changes of just one degree Brix can affect the perception of a beverage’s flavor [22]. Relating the solid content to the acceptance of flavor and sweetness, it is possible to see that, in beverages with fewer degrees Brix, the acceptance of these attributes was low; on the other hand, when the concentration of solids is higher, the acceptance of these attributes also increases.
Even though a mathematical model that would explain the effect of the independent variables concentration on the TTA was not obtained, it was possible to observe via the means comparison test that only the juice content influenced the formulations’ acidity. As regards pH, a higher addition of juice led to the acidification of samples. The influence of juice concentration on the product’s final pH was also reported by Granato et al. [1] in soya-based desserts with added guava juice. The mango juice used in the formulations contains considerable quantities of organic acids (pH 3.32 and 1.12% acidity of citric acid), which contributes to their low pH and elevated acidity. Consequently, the gradual increase in juice concentration will lead to an acidification of the formulated beverage. Because acidity did not cause a sensory rejection of the formulations, this characteristic becomes a positive point, for more acidic foods are less favorable to the growth of bacteria, which is desired by the food industry.
5. Conclusions
The use of response surface methodology in the sensory data interpretation was not possible; however, the formulations with higher combined concentrations of juice and sugar added obtained satisfactory acceptability. The content of soluble solids was influenced only by the addition of sugar, where the formulations that presented higher concentrations of solids were the ones that obtained the highest sensory acceptance. The beverage acidity was influenced only by the juice content, which, in spite of making the formulations significantly more acidic, did not affect their acceptability. It should be noted that the raw materials used in this study, despite a low cost in Brazil, have a high cost worldwide, which limits the production of this kind of product in other countries.
Acknowledgments
The authors wish to acknowledge Coordenação de Aperfeiçoamento de Pessoal de Nível Superior (CAPES) for its scholarship and Beneo-Orafit for their support.
Author Contributions
All authors contributed equally to this paper.
Conflicts of Interest
The authors declare no conflict of interest.
References
- Granato, D.; Ribeiro, J.C.B.; Castro, I.A.; Masson, M.L. Sensory evaluation and physicochemical optimisation of soy-based desserts using response surface methodology. Food Chem. 2010, 121, 899–906. [Google Scholar] [CrossRef]
- Matthews, S.B.; Waud, J.P.; Roberts, A.G.; Campbell, A.K. Systemic lactose intolerance: A new perspective on an old problem. Postgrad. Med. J. 2005, 81, 167–173. [Google Scholar] [CrossRef] [PubMed]
- Pereira, P.C. Milk nutritional composition and its role in human health. Nutrition 2014, 30, 619–627. [Google Scholar] [CrossRef] [PubMed]
- Granato, D.; Masson, M.L.; Ribeiro, J.C.B. Sensory acceptability and physical stability evaluation of a prebiotic soy-based dessert developed with passion fruit juice. Cienc. Tecnol. Aliment. 2012, 32, 119–126. [Google Scholar] [CrossRef]
- Venkatachalam, M.; Sathe, S.K. Chemical composition of selected edible nut seeds. J. Agric. Food Chem. 2006, 54, 4705–4714. [Google Scholar] [CrossRef] [PubMed]
- Alasalvar, C.; Shahidi, F. Natural antioxidants in tree nuts. Eur. J. Lipid Sci. Technol. 2009, 111, 1056–1062. [Google Scholar] [CrossRef]
- Sivakumar, D.; Jiang, Y.; Yahia, E.M. Maintaining mango (Mangifera indica L.) fruit quality during the export chain. Food Res. Int. 2011, 44, 1254–1263. [Google Scholar] [CrossRef]
- Varakumar, S.; Kumar, Y.S.; Reddy, O.V.S. Carotenoid composition of mango (Mangifera indica L.) wine and its antioxidant activity. J. Food Biochem. 2011, 35, 1538–1547. [Google Scholar] [CrossRef]
- Kelly, G. Inulin-type prebiotics—A review: Part 1. Alternat. Med. Rev. 2008, 13, 315–329. [Google Scholar]
- Fooks, L.J.; Fuller, R.; Gibson, G.R. Prebiotics, probiotics and human gut microbiology. Int. Dairy J. 1999, 9, 53–61. [Google Scholar] [CrossRef]
- Kaur, N.; Gupta, A.K. Applications of inulin and oligofructose in health and nutrition. J. Biosci. 2002, 27, 703–714. [Google Scholar] [CrossRef] [PubMed]
- Chow, J.M. Probiotics and prebiotics: A brief overview. J. Renal Nutr. 2002, 12, 76–86. [Google Scholar] [CrossRef]
- Franck, A. Technological functionality of inulin and oligofructose. Br. J. Nutr. 2002, 87, 287–291. [Google Scholar] [CrossRef] [PubMed]
- Huebner, J.; Wehling, R.L.; Hutkins, R.W. Functional activity of commercial prebiotics. Int. Dairy J. 2007, 17, 770–775. [Google Scholar] [CrossRef]
- Rebouças, M.C.; Rodrigues, M.C.P.; Afonso, M.R.A. Optimization of the acceptance of prebiotic beverage made from cashew nut kernels. J. Food Sci. 2014, 79, 1393–1398. [Google Scholar] [CrossRef] [PubMed]
- Cochran, W.G.; Cox, G.M. Experimental Designs, 2nd ed.; Wiley: New York, NY, USA, 1992. [Google Scholar]
- Instituto Adolf Lutz. Métodos Físico-Químicos Para Análise de Alimentos, 4th ed.; Instituto Adolfo Lutz: São Paulo, Brazil, 2008. [Google Scholar]
- Villegas, B.; Tárrega, A.; Carbonell, I.; Costell, E. Optimising acceptability of new prebiotic low-fat milk beverages. Food Qual. Prefer. 2010, 21, 234–242. [Google Scholar] [CrossRef]
- Kale, R.V.; Pandhare, G.R.; Satwase, A.N.; Goswami, D. Effect of Different Concentration of Orange Juice on Quality Characteristics of Soya Milk Blended Beverage. J. Food Process. Technol. 2012, 3, 1–5. [Google Scholar]
- Granato, D.; Castro, I.A.; Ellendersen, L.S.N.; Masson, M.L. Physical stability assessment and sensory optimization of a dairy-free emulsion using response surface methodology. J. Food Sci. 2010, 75, 149–155. [Google Scholar] [CrossRef] [PubMed]
- Andrés, V.; Tenorio, M.D.; Villanueva, M.J. Sensory profile, soluble sugars, organic acids, and mineral content in milk- and soy-juice based beverages. Food Chem. 2015, 173, 1100–1106. [Google Scholar] [CrossRef] [PubMed]
- King, B.M.; Arents, P.; Bouter, N.; Duineveld, C.A.A.; Meyners, M.; Schroff, S.I.; Soekhai, S.T. Sweetener/sweetness-induced changes in flavor perception and flavorrelease of fruity and green character in beverages. J. Agric. Food Chem. 2006, 54, 2671–2677. [Google Scholar] [CrossRef] [PubMed]
© 2016 by the authors; licensee MDPI, Basel, Switzerland. This article is an open access article distributed under the terms and conditions of the Creative Commons Attribution (CC-BY) license (http://creativecommons.org/licenses/by/4.0/).