Article

Exploring Retro-Nasal Aroma’s Influence on Mouthfeel Perception of Chardonnay Wines

Department of Food Science & Technology, Oregon State University, Corvallis, OR 97331, USA
*
Author to whom correspondence should be addressed.
These authors contributed equally to this work.
Beverages 2016, 2(1), 7; https://doi.org/10.3390/beverages2010007
Submission received: 31 December 2015 / Revised: 2 March 2016 / Accepted: 14 March 2016 / Published: 18 March 2016
(This article belongs to the Special Issue Alcohol Perception and Consumption)

Abstract

:
There are many interactions that occur between taste and aroma that may impact perception. The main objective of this study was to ascertain whether the aroma fraction of wine should be considered when investigating relationships between chemical composition and sensory perception of mouthfeel. Chardonnay wines with different mouthfeels were produced by altering the fermentation temperature (15 °C and 21 °C) of the alcoholic and malolactic fermentations (MLF) as well as the timing of MLF and the presence of a non-Saccharomyces yeast during alcoholic fermentation. Napping® and Ultra-flash-profiling were conducted using a panel of white winemakers. Each procedure was conducted twice: once with retro-nasal aroma (+R) and once without retronasal aroma (−R). Napping® results showed that retronasal aroma impacted mouthfeel perception. Ultra-flash profiling of +R and −R displayed similar descriptive terms used. Several terms appear to be related to retronasal aroma as they were used in +R and not in −R. It is unclear if these terms are due to interactions or due to associated learning. These results suggest that for some mouthfeel terms the volatile fraction plays a role and, to establish relationships between chemical composition and mouthfeel perception, it is important to consider both the volatile and nonvolatile wine fractions.

1. Introduction

The assessment of white wine involves the appreciation of the appearance, ortho-nasal and retro-nasal aroma, flavor, and texture or mouthfeel of that wine [1]. Mouthfeel is one of the least understood areas in the assessment of wine due to the number of factors involved, direct and indirect, as well as the difficulty in agreed upon descriptions or analogous terms [2]. Traditionally, mouthfeel is thought to be caused by nonvolatile compounds, including polysaccharides, mannoproteins, sugar, ethanol, glycerol, pH, tartaric acid, and phenolics [3]. To change the mouthfeel of wines, winemakers attempt to alter these compositional elements. However when tasting a glass of wine there are more than just mouthfeel components present. Both volatile and non-volatile contents are perceived together. Therefore, mouthfeel perception may be the result of interactions between nonvolatile and volatile compounds perceived through retronasal olfaction. This study proposes evidence that the aromatic fraction of the wine plays a role in the final perception of the mouthfeel of Chardonnay wines.

1.1. Mouthfeel of White Wine

The components thought to influence mouthfeel are difficult to quantify and qualify due to the number of components involved, poor understanding of the interactions between them, and the use of descriptors based on tactile sensations [2,4]. Researchers interested in the mouthfeel of white wines generally use the in-mouth sensations of acidity, astringency, prickling, temperature, body, and burning to qualify the differences in mouthfeel between wines [5]. Terms used to describe wines are generally fabrics, such as velvet, suede, or silk, and not terms directly based on the sensory experience [2].
Another complication to mouthfeel perception is that many individuals have difficulty in distinguishing between flavor sensations and chemesthesis sensations. Specifically, it is common for wine consumers to mistake the bitterness on the tongue (taste) for astringency (touch, or chemesthesis) [6,7]. Astringency is caused by the polymerization of phenolics with salivary proteins and not by interactions with taste buds located on the tongue [7]. Further complicating the perception of astringency is the reported differences between individuals in saliva quantity per volume of wine, varying protein concentration of individual’s saliva, as well as variation in the sip-size each person imbibes [6]. All these factors have been found to impact the perception of astringency.

1.2. Napping®

Napping® is a recently developed sensory procedure where untrained panelists are asked to separate samples spatially, on a table cloth or Nappe, based on how similar or different the samples are [8,9]. It is a sub-form of projective mapping that dates back to the mid 1990s [10]. This procedure has proven comparable to analysis by trained panelists using descriptive analysis [11]. Pairing the Napping® procedure with Ultra-flash-profiling (UFP) has been utilized to interpret wine groupings by the Napping® procedure [9,11,12].
The Napping® procedure has been successful in the grouping of food products by specific attributes [13], as well as to separate in mouth textural responses in food science studies [14], but as of yet, no research has utilized this procedure for wine mouthfeel assessment. It has been postulated that assessment of food products is a cultural phenomenon with regional variations, and as such, the Napping® procedure has been demonstrated to be precise only when utilizing panelists of similar regional and cultural locals [15]. Therefore, in this study, the panelists were recruited and selected from a selection of winemakers in Oregon’s Willamette Valley wine region.

1.3. Mouthfeel Linked to Winemaking Processes

The concentration of non-volatile chemical constituents of wine such as phenolics can be influenced by a number of factors including timing of picking [16], grape pressing and maceration, and time on skins. Juice settling time and filtration can also influence the grape solids and polysaccharide content of must and wine [17]. Fermentation parameters such as non-Saccharomyces yeast species can be used to increase mannoprotein content, which has been correlated with a general increase in mouthfeel [18]. Aging conditions can drastically effect a finished wine due to oxidative processes [19]. A producer’s desired style influences the decision of harvest dates between cultivar, and region; time of harvest correlates with differences in acid degradation, sugar accumulation, and phenolic advancement [16] The effects of these chemicals are discussed further in the following section.

1.4. Chemicals Involved in Mouthfeel Perception

Studies have shown that altering the composition of a wine can influence mouthfeel sensations [17,20]. Wines with a lower pH are generally perceived as more astringent, irrespective of their phenolic content. pH has also been demonstrated to effect the perception of viscosity, however a clear relationship has not been displayed [17]. Viscosity of wine, a major determinant of wine body, is influenced by sugar, polysaccharide composition, and, to a lesser extent, ethanol and glycerol [21,22]. Studies are conflicting regarding the impact on mouthfeel perception from glycerol and polysaccharides, with a purport that phenolic compounds may have a greater influence on the perception of viscosity [17]. This has led some researchers to conclude that the concentrations of phenolic compounds are the key to understanding mouthfeel in white wine. However, research in this area has failed to demonstrate that quantity and concentration of phenolic compounds have a direct relationship with perceived viscosity [23].
Phenolic compounds are known to elicit two separate sensory experiences: bitterness and astringency. Bitterness is a taste, perceived by taste buds in the tongue. In wine, it is generally caused by flavan-3-ols, some flavonols, hydroxycinnamates, and benzoic acid derivatives [6]. Astringency is a more complicated sensation perceived via chemesthesis. It is described as a prickling sensations on the mouth and tongue, and a drying of the mouth [6,24]. Low molecular weight polyphenols and polymeric tannins bind with salivary proteins to elicit a drying, and puckering response. However, astringency in wine is described by specific textures, often related to tactile memory of fabric [2]. Schobel and others suggest that there may be specialized neuronal connections in the mouth which bind with low molecular weight polyphenols and polymeric tannins, and aid in the creation of distinct astringent sensation: which they describe as either “puckering” astringency, or “velvety” [7]. There are astringent phenolic compounds that are also perceived as bitter via taste buds, causing some individuals to assimilate the two sensations into one experience; such misinformation causes confused assessments of food products since many compounds elicit a bitter taste without astringency, or an astringent sensation without bitterness [24]. The sensations involved in the mouthfeel of a wine generally involve multiple chemical groups, some with known influence, and others with a more indirect influence. Many of these compounds may interact with each other, or, potentially, with the volatile fraction of the wine matrix to elicit the full experience of white wine mouthfeel.

1.5. Indirect Sensory Attributes, and Interactions

While phenolic compounds have shown a direct impact to mouthfeel perception they are also involved in some indirect effects on sensory perception. Ethanol and phenolics have been found to have a synergistic effect- causing an increase in the perception of astringency, and burning [25]. Another indirect effect of compounds important to mouthfeel perception is the interaction of sugar and acid, which alter sweetness and sourness perception [26], and ethanol and glycerol which effect the perception of sweetness. An increase in either compound results in a reported increase of sweetness [27].
Interactions between ortho-nasal, and retro-nasal aroma on the perception of the texture in food systems have been investigated [28]. Olfactory influence on the perception of texture has been observed in other complex food systems, such as yogurt and milk products [29,30]. An investigation into the effect of the nonvolatile fraction of wine on the intensity of the volatile fraction has shown a positive influence [31], and some work has been done linking wine volatiles to the perception of mouthfeel sensations, however this study was limited to the specific parameter of “astringency” [32]. In this study, we begin to investigate how the volatile fraction of white wine can influence the perception of all mouthfeel parameters.

2. Results

2.1. Napping®

Agglomerative Hierarchical clustering was used to show consistency of panelists with the replicate wines (Figure S1). All wines but one were consistently grouped using napping® for both +R and −R. However, the wines that were not consistently grouped were different between the two analyses. For +R analysis, Treatment 8 was grouped with both Treatment 2 and with Treatment 4 wines. For −R analysis Treatment 1 wine was grouped with both Treatment 3 and 4 wines. This inconsistency was due to results from one panelist that did not group replicates together. This individual’s data were excluded from further analysis.
Multiple factor analysis from Napping® showed that retronasal aroma impacted sorting of wines based on mouthfeel (Figure 1). Some wines were found to have a large influence of retronasal aroma as they are located quite far apart while other wines had less impact of retronasal aroma, as they are located closer together. Treatment 1, 2, and 4 wines, both +R and −R, are located near each other although there are some small differences. All other wines were not located spatially close together. For example, treatment 5 wine (+R) is found in the positive F1 direction and negative F2 direction and treatment 5 wine (−R) is found in the positive F1 and F2 direction. Treatment 6 wine (+R) is the only wine that is not spatially located near another wine, found in the positive F1 direction.

2.2. Ultra-Flash Profiling

2.2.1. With Retronasal Aroma (+R)

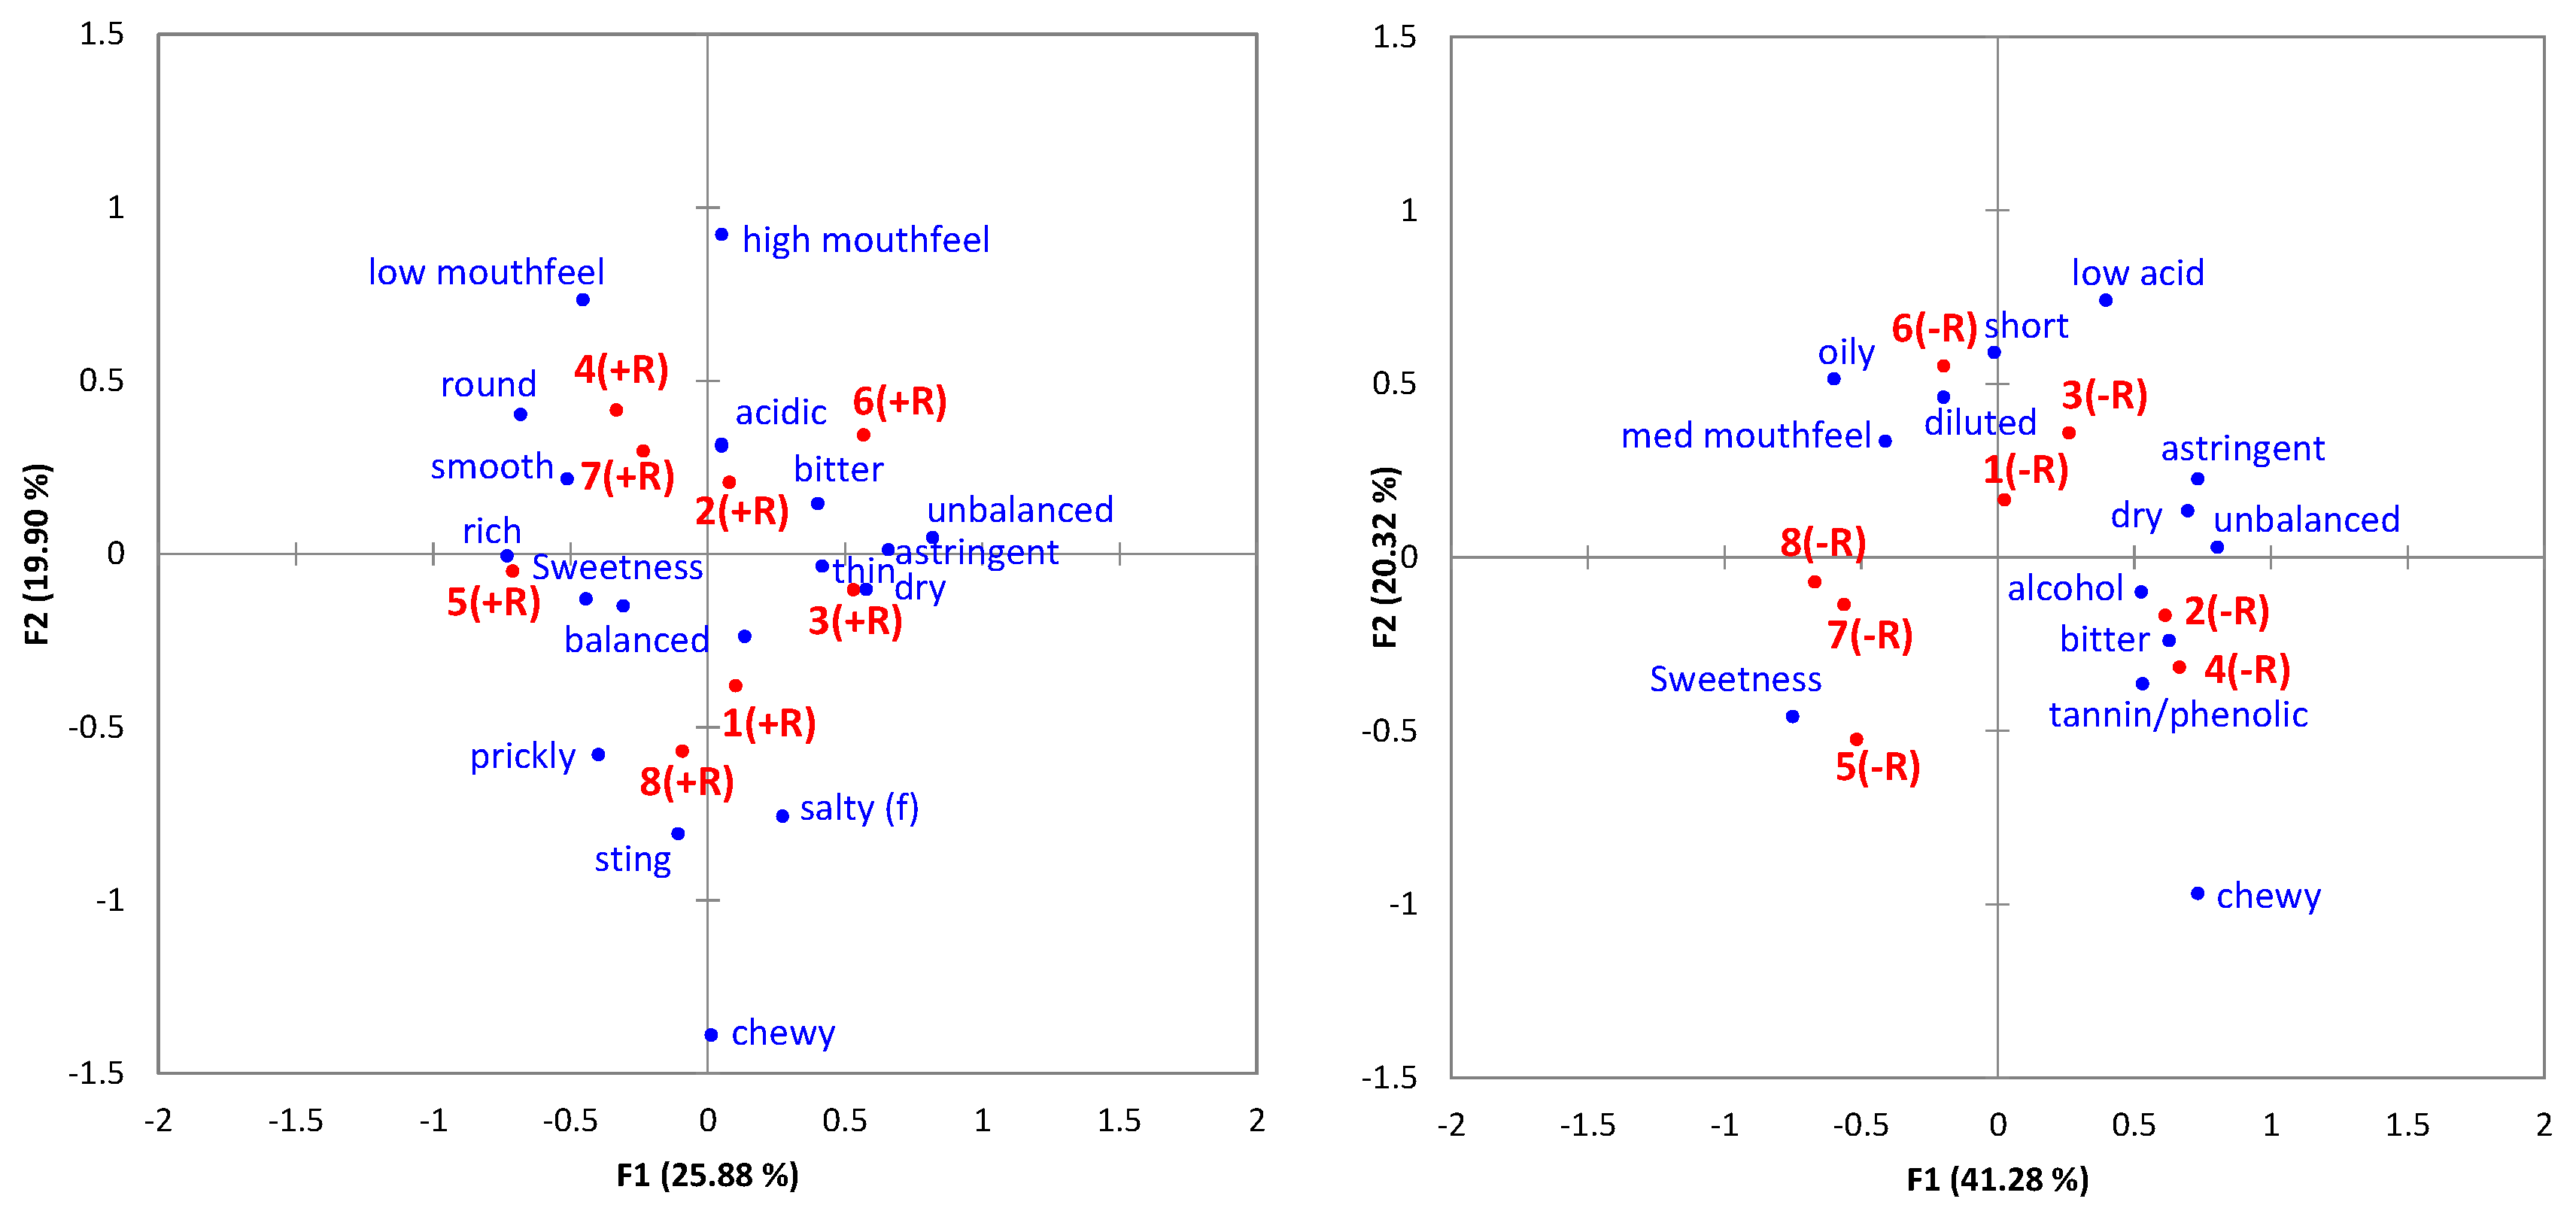
Descriptors included in Correspondence Analysis (CA) had a quotient factor greater than 3 and a total of 27 descriptors were used (Table 1). The first two factors are responsible for 46% of the total inertia, 26% and 20%, respectively; with clear separation both in the F1 and F2 directions. Of the 27 descriptors used, only 17 contributed highly to the formation of axes, based on their squared correlations provided in analysis output (data not shown). The F1 axis is mainly comprised of sweetness, dry, round, astringent and unbalanced. The F2 axis is primarily composed of chewy, high mouthfeel and acidic. The placements of wine group centroids with the attribute points display those mouthfeel descriptors that are associated with each wine (Figure 2).

2.2.2. Without Retronasal Aroma (−R)

As with +R analysis, those descriptors that were used more than three times were included in the Correspondence analysis. In total, 19 terms were incorporated in the analysis (Table 1), although only 12 highly contributed to the formation of the axis based on the squared correlations. The first two factors account for 61% of the variance (F1 41% and F2 20%). As with +R results, sweetness was the term that contributed the most both for the F1 and F2 axis. Other terms important for F1 axis include bitter, alcohol and astringent. Terms that are important to the F2 axis include chewy, low acid, and short. Terms that appear to be related to retronasal aroma, terms used in +R but not −R, include flabby, fresh, smooth, soft, prickly, high mouthfeel, sting and salty.

3. Discussion

3.1. Napping®

MFA results (Figure 1) show that retronasal aroma is playing a role with mouthfeel perception, especially since the majority of reapplications were sorted together (Figure S1). The wines that were sequentially inoculated were found spatially closer together than those that were co-inoculated (Figure 1). Specifically, teatment 1, 2 and 4 wines were perceived to be very similar and the +R and −R for each of these wines were located near each other. The +R and R for treatment 5, 6, 7 and 8 wines were not located near each other and were therefore perceived differently when retronasal aroma was removed. Treatment 3 wine is in between, as it is fairly close along F1 but is separated by F2. This would suggest that the aromas produced during co-inoculation have a greater impact on perception of mouthfeel, while the aromatics of the sequentially inoculated wines were more similar, although it should be noted the aromas of the wines were not analyzed in this study. But since the only difference in the analysis of wines was the presence of retronasal aroma, the results show that there is some influence of retronasal aroma to mouthfeel perception. This is supported by previous research where aroma was found to influence wine texture [29]. The application of this research in other food systems has demonstrated similar results [30,33], however these interactions have yet to be demonstrated in a wine matrix.

3.2. Ultra-Flash-Profiling (UFP)

Many terms used were spatially located in a similar area for both the +R and −R analysis. This suggests that while slightly different terms may be used, the panelists were describing a similar mouthfeel parameter. For instance, in −R, both bitter and tannin/phenolic were spatially located together and these two terms are known to be associated with phenolic compounds in wine [34]. Other terms were not as consistent, for example, low and high mouthfeel, in the +R group (Figure 2). In the −R group, astringent, dry and unbalanced were located quite close together (Figure 2). This may be due to the individual’s difference in mouthfeel intensity, but it also suggests that panelists are using different language for a similar sensation. Interestingly the term medium mouthfeel was found to be important for −R and yet only low and high mouthfeel were found in the +R analysis (Figure 2). This again supports the possibility that perception of mouthfeel is linked to retronasal qualities and it is perhaps the aromatic extremes or unbalances more than compositional differences that are important within a similar wine style. Clearly, there is much work needed to develop consistent terms for specific mouthfeel parameters.
The separation of specific taste and mouthfeel descriptors known to be related, and those known to be opposites, are important to note. Specifically, sweetness and dry are located in opposite directions along the F1 axis in +R (Figure 2). These two attributes are related to residual sugar content with sweet wines having more residual sugar and dry wines less residual sugar. Sweetness and rich are also both found on the positive direction of F1. These two descriptors have been found to be related although sweetness is not the only factor attributed to richness, as fats, proteins and polysaccharides have been found to play a role in “rich mouthfeel” of other foods [35]. We can see that terms that have a known relationship to chemical composition are being perceived in an expected manner. Although the small difference between low and high mouthfeel for +R suggests that there is either difficulty in determining what low and high mouthfeel is or that several interactions occur for lower mouthfeel wines that are not directly related to the same compositional elements.
Differences in the usage of terms between +R and −R analysis are most likely due to the influence of retronasal aroma to mouthfeel. Specifically it would appear that retronasal aroma is in fact very important for several mouthfeel associated descriptors. Terms found in +R and not −R include flabby, fresh, smooth, soft, prickly, high mouthfeel, sting and salty (Table 1). Several of these terms are known to be in some way related to aroma or taste. For instance, salty is considered to be a taste caused by ions in the wine that are then perceived in the taste bud [36]. However, salty is also thought to be a component of the aroma term minerality [37,38] and the perception of saltiness has been found to be linked to aromas in other foods and model solutions [39,40]. It appears that while salty is considered a taste, the panelists were relating it to a retronasal aroma. Fresh is another term that appears to be related to retronasal aroma, as it was incorporated in the +R analysis but not in the −R. The term “fresh” is typically related to fresh fruits or clean aromas and while aromatic information was not collected it would seem that the usage of this term may be due directly to aroma since it was not used in −R analysis.
A number of terms used in the +R analysis are not known to be linked to retronasal aroma. These include flabby, smooth, soft, prickly, high mouthfeel and sting (Table 1). These terms are clearly related to tactile sensations. One possible explanation for their usage in +R and not in −R is that there is little consensus on the use of these terms. However flabby, flesh, smooth and soft were used between five and eight times, while the others were used less. The usage of terms with retronasal aroma suggests that an aroma is eliciting a response to these tactile sensations and that while there is no actual perception of smooth, the aroma is reminding the taster of something that can be described as “smooth”. These types of interpretations around associative learning are well known in sensory science [41,42]. A further investigation into these terms and the role of retronasal aroma would be of great interest as these results clearly show the impact that retronasal aroma is having to mouthfeel. Determining which mouthfeel terms are due to a combination of retronasal aroma and mouthfeel would be extremely valuable when trying to establish chemical relationships to mouthfeel terms.
Another interesting point in the UFP analysis is that the use of terms associated with taste descriptors are used most frequently (Table 1). This may be due to the fact that it is possible to train individuals to recognize sweetness, acidic, alcohol and bitter by the use of chemical standards [43], making it easier for the taster to use and perceive these tastes. Familiarity with taste perception may also explain the usage of these terms, as taste is a part of all food and beverages, while mouthfeel will vary depending on the product. Additionally, panelists used two terms that are not actual sensory perceptions but chemicals, tannin/phenolic and alcohol. The tannin/phenolic terms would appear to be related to the tannin and/or phenolic content of the wine, as these compounds are known to impact mouthfeel perception [3,44]. However, it is interesting to discuss the “alcohol” term. This could be referring to a sensory perception of heat, as higher alcohol content is known to producer warmer or hot wines [45]. However, the term alcohol could also related to the smell of alcohol which is many times referred to as solvent or lifted. There are many alcohols present in wine beyond ethanol and the usage of this term and not the term “heat” warrants further investigation. It is most likely that these terms were used as they are common in most winemakers’ professional vocabulary and would not necessarily be used if panelists were wine consumers.

4. Materials and Methods

4.1. Wine Production

Chardonnay grapes from Oregon State University’s Woodhall vineyard (Monroe, Oregon) were de-stemmed, pressed and the juice was settled for 12 h at 8 °C. After racking, the juice (pH 3.31, TA 7.2 g/L, Brix 24.4) was divided into one-gallon glass carboys, three liters per carboy, and secured with airlocks. Fermentation treatments varied based on timing of yeast and bacteria inoculations as well as fermentation temperatures (Table S1). Yeast strains used include Prelude™ (Torulaspora delbrueckii) (Chr. Hansen, Hørsholm, Denmark) and Saccharomyces cerevisiae (S. cerevisiae) strain D47 (Lallemand). Malolactic bacteria used was Oenococcus oeni (O. oeni) strain Beta (Lallemand, Montreal, Canada). All treatments were performed in triplicate. Each treatment was performed at two different temperatures, 15 and 21 °C, by placing carboys in temperature controlled rooms. S. cerevisiae strain D47 and O. oeni strain Beta were inoculated at approx. 1 × 10⁶ cfu/mL. Prelude™ was inoculated at approx. 1 × 10⁵ cfu/mL. At completion of alcoholic (reducing sugars <0.5 g/L) and malolactic fermentation (malic acid <50 mg/L), an addition of 50 mg/L SO2 was made and wines were placed at 4 °C to settle. After settling, wines were racked and sterile filtered with a 0.45 µm PES cartridge filter (Millipore, MA, USA), and bottled in 375 mL Stelvin (Amcor, Australia) closed bottles. Wines were stored at 13 °C until required for analysis. Glucose/fructose, malic acid, glycerol and acetic acid of each sample were measured using enzymatic assays (r-Biopharm, Darmstadt, Germany). Ethanol concentration was determined using an Anton Paar Alcolyzer (Santner Foundation, Graz, Austria).

4.2. Sensory Analysis Using Napping and Ultra-Flash-Profiling

Sensory analysis of the wines was conducted five months after bottling. After screening for specific anosmia, oral legions, and cigarette use, 17 white winemakers from the Willamette Valley wine region were selected for a sensory study on Chardonnay mouthfeel using Napping® followed by Ultra-flash-profiling (UFP). The age range of the panelists was 25–66 and each winemaker had a minimum of 5 years’ experience with Chardonnay wines. Panelists were split between tasting A, held on 27 May 2015, and tasting B, on 28 May 2015. The tastings were held from 2:30 to 4:30 p.m., at the Oregon State University Yamhill County Extension Office (McMinnville, Oregon, USA). The room was lit with fluorescent lighting and kept at approximately 68° F for the duration of both sessions. Two air purifiers were used to eliminate any background aroma. Each panelist participated in 2 tasting sessions separated by a 15 min break. During each session panelists were presented with 10 wines; the 8 wines previously described and 2 replicate samples. Replicates were included randomly and all wines were presented in random order determined using an incomplete block design. All wines were assigned randomly generated three digit identifiers. Panelists were randomly selected to begin either with, or without, nose clips (A-M systems, Sequim, WA, USA). When using nose clips panelists were instructed that nose clips were to remain on for the entirety of the flight.
Napping® procedure was used according to Pages et al. [9,11]. Sketch paper (50 lb., 45.7 × 61 cm) was placed in front of the panelist in addition to a ballpoint pen (for UFP). Panelists were asked to refrain from smelling the wine samples, as mouthfeel analysis was the main objective of the sensory tests. A practice wine was given to each taster to acclimate themselves to assessment of the wines while wearing the nose clips. Tasters grouped the wines based on similarity of mouthfeel. Once the 10 wines were placed on the paper panelists were asked to enrich each wine/group with descriptors, related to mouthfeel, written near the wine/group using ultra flash profiling as described by Perrin et al. [11]. Tasters were instructed only to include flavor descriptors if they were important to mouthfeel. UFP descriptors were assessed for synonyms and erroneous descriptors to simplify the data analysis.

4.3. Data Analyses

Data analysis conducted using XLSTAT (Addingsoft, New York, NY, USA), and FactonMineR package of R version 3.2.1 [46,47]. Hierarchical clustering analysis (HCA) was used to determine consistency of replicates. A dissimilarity matrix using Euclidean distance and Napping® data was assessed using multiple factor analysis (MFA) of the X and Y co-ordinates (unstandardized variables) of each wine on the paper placemat. These coordinates were obtained using a tape measure in millimeters from the left edge (X), and bottom edge (Y), relative to the original paper orientation for each panelist. The data set for Napping contained 18 variables corresponding to the 18 winemakers participating in the study. UFP resulted in two contingency tables, one for +R and 1 for −R. The variable names in the contingency table correspond to the sample attribute and the value of that attribute corresponds to the frequency of the attribute for all samples and all assessors. UFP contingency tables were analyzed using correspondence analysis.

5. Conclusions

The differences in sorting, and in the use of descriptive terms to describe the mouthfeel of each wine, between +R and −R emphasizes the importance of the volatile fraction of a wine in the appreciation of mouthfeel. It is unclear if the influence of the volatile fraction is due to interactions between chemical groups, by indirect effects of the volatile fraction, or by associative learning. The contradictions between UFP groupings in the −R procedure imply that something pivotal is missing from each wine that would allow more consistent descriptive terms to be assigned by wine professionals. Since the volatile fraction remains in the wine, the difference appears to be inimitable to the panelists, and as such could infer an interaction between processing modality of olfactory and chemesthesis, or possibly, in the absence of retronasal aroma, the associations made by wine professionals could be rendered inaccessible. More research is needed to investigate these findings, but this work provides a first step in examining the intricacies and interactions at work for mouthfeel perception.

Supplementary Materials

The following are available online at https://www.mdpi.com/2306-5710/2/1/7/s1, Table S1: Summary treatment used to create Chardonnay wines with different mouthfeel qualities; Figure S1: Dissimilarity dendograms from hierarchical agglomerative clustering analysis based on mouthfeel characteristics that show wine replicates; A (+R), B (−R).

Acknowledgments

Funding for this project was not linked to a specific grant but was through PI’s research programs.

Author Contributions

E.T. and J.O. conceived and designed the experiments; A.S. performed the experiments; A.S. and E.T. analyzed the data; and A.S. and E.T. wrote the paper, with J.O. providing editing support.

Conflicts of Interest

The authors declare no conflict of interest.

Abbreviations

The following abbreviations are used in this manuscript:
TLAThree letter acronym
LDlinear dichroism
UFPultra-flash-profiling
+Rwith retronasal aroma
−Rwithout retronasal aroma

References

  1. Peynaud, E.; Blouin, J. The Taste of Wine: The Art Science of Wine Appreciation; John Wiley & Sons: Hoboken, NJ, USA, 1996. [Google Scholar]
  2. Pickering, G.J.; Demiglio, P. The White Wine Mouthfeel Wheel: A Lexicon for Describing the Oral Sensations Elicited by White Wine. J. Wine Res. 2008, 19, 51–67. [Google Scholar] [CrossRef]
  3. Vidal, S.; Courcoux, P.; Francis, L.; Kwaitkowski, M.; Gawel, R.; Williams, P.; Waters, E.; Cheynier, V. Use of an experimental design approach for evaluation of key wine components on mouth-feel perception. Food Qual. Preference 2004, 15, 209–217. [Google Scholar] [CrossRef]
  4. Gawel, R.; Oberholster, I.; Leigh Francis, I. A “Mouth-feel Wheel”: Terminology for communicating the mouth-feel characteristics of red wine. Aust. J. Grape Wine Res. 2000, 6, 203–207. [Google Scholar] [CrossRef]
  5. Jackson, R.S. Wine Science: Principles and Applications; Academic Press: Cambridge, MA, USA, 2008. [Google Scholar]
  6. Ma, W.; Guo, A.; Zhang, Y.; Wang, H.; Liu, Y.; Li, H. A review on astringency and bitterness perception of tannins in wine. Trends Food Sci. Technol. 2014, 40, 6–19. [Google Scholar] [CrossRef]
  7. Schöbel, N.; Radtke, D.; Kyereme, J.; Wollmann, N.; Cichy, A.; Obst, K.; Kallweit, K.; Kletke, O.; Minovi, A.; Dazert, S.; et al. Astringency Is a Trigeminal Sensation That Involves the Activation of G Protein–Coupled Signaling by Phenolic Compounds. Chem. Senses 2014, 39, 471–487. [Google Scholar] [CrossRef] [PubMed]
  8. Pagès, J. Recueil direct de distances sensorielles: Application à l’évaluation de dix vins blancs du Val-de-Loire. Sci. Aliment. 2003, 23, 679–688. [Google Scholar] [CrossRef]
  9. Pagès, J. Collection and analysis of perceived product inter-distances using multiple factor analysis: Application to the study of 10 white wines from the Loire Valley. Food Qual. Preference 2005, 16, 642–649. [Google Scholar] [CrossRef]
  10. Risvik, E.; McEwan, J.A.; Colwill, J.S.; Rodgers, R.; Lyon, D.H. Projective mapping: A tool for sensory analysis and consumer research. Food Qual. Preference 1994, 5, 263–269. [Google Scholar] [CrossRef]
  11. Perrin, L.; Symoneaux, R.; Maître, I.; Asselin, C.; Jourjon, F.; Pagès, J. Comparison of three sensory methods for use with the Napping® procedure: Case of ten wines from Loire valley. Food Qual. Preference 2008, 19, 1–11. [Google Scholar] [CrossRef]
  12. Perrin, L.; Pages, J. Construction of a product Space from the Ultra-Flash Profiling method: Application to 10 Red Wines from the Loire Valley. J. Sens. Stud. 2009, 24, 372–395. [Google Scholar] [CrossRef]
  13. Dehlholm, C.; Brockhoff, P.B.; Meinert, L.; Aaslyng, M.D.; Bredie, W.L.P. Rapid descriptive sensory methods—Comparison of Free Multiple Sorting, Partial Napping, Napping, Flash Profiling and conventional profiling. Food Qual. Preference 2012, 26, 267–277. [Google Scholar] [CrossRef]
  14. Grygorczyk, A.; Lesschaeve, I.; Corredig, M.; Duizer, L. Impact of Structure Modification on Texture of a Soymilk and Cow’s Milk Gel Assessed Using the Napping Procedure. J. Texture Stud. 2013, 44, 238–246. [Google Scholar] [CrossRef]
  15. Kim, Y.-K.; Jombart, L.; Valentin, D.; Kim, K.-O. A cross-cultural study using Napping®: Do Korean and French consumers perceive various green tea products differently? Food Res. Int. 2013, 53, 534–542. [Google Scholar] [CrossRef]
  16. Pirie, A.J.G.; Mullins, M.G. Concentration of Phenolics in the Skin of Grape Berries during Fruit Development and Ripening. Am. J. Enol. Vitic. 1980, 31, 34–36. [Google Scholar]
  17. Gawel, R.; Day, M.; Van Sluyter, S.C.; Holt, H.; Waters, E.J.; Smith, P.A. White Wine Taste and Mouthfeel as Affected by Juice Extraction and Processing. J. Agric. Food Chem. 2014, 62, 10008–10014. [Google Scholar] [CrossRef] [PubMed]
  18. Domizio, P.; Liu, Y.; Bisson, L.F.; Barile, D. Use of non-Saccharomyces wine yeasts as novel sources of mannoproteins in wine. Food Microbiol. 2014, 43, 5–15. [Google Scholar] [CrossRef] [PubMed]
  19. Kennedy, J.A. Grape and wine phenolics: Observations and recent findings. Cienc. E Investig. Agrar. 2008, 35, 107–120. [Google Scholar] [CrossRef]
  20. Runnebaum, R.C.; Boulton, R.B.; Powell, R.L.; Heymann, H. Key Constituents Affecting Wine Body—An Exploratory Study. J. Sens. Stud. 2011, 26, 62–70. [Google Scholar] [CrossRef]
  21. Walker, S.; Prescott, J. The Influence of Solution Viscosity and Different Viscosifying Agents on Apple Juice Flavor. J. Sens. Stud. 2000, 15, 285–307. [Google Scholar] [CrossRef]
  22. Vidal, S.; Francis, L.; Williams, P.; Kwiatkowski, M.; Gawel, R.; Cheynier, V.; Waters, E. The mouth-feel properties of polysaccharides and anthocyanins in a wine like medium. Food Chem. 2004, 85, 519–525. [Google Scholar] [CrossRef]
  23. Oberholster, A.; Francis, I.L.; Iland, P.G.; Waters, E.J. Mouthfeel of white wines made with and without pomace contact and added anthocyanins. Aust. J. Grape Wine Res. 2009, 15, 59–69. [Google Scholar] [CrossRef]
  24. Breslin, P.A.S.; Gilmore, M.M.; Beauchamp, G.K.; Green, B.G. Psychophysical evidence that oral astringency is a tactile sensation. Chem. Senses 1993, 18, 405–417. [Google Scholar] [CrossRef]
  25. Pickering, G.J.; Heatherbell, D.A.; Vanhanen, L.P.; Barnes, M.F. The Effect of Ethanol Concentration on the Temporal Perception of Viscosity and Density in White Wine. Am. J. Enol. Vitic. 1998, 49, 306–318. [Google Scholar]
  26. Nurgel, C.; Pickering, G. Contribution of Glycerol, Ethanol and Sugar to the Perception of Viscosity and Density Elicited by Model White Wines. J. Texture Stud. 2005, 36, 303–323. [Google Scholar] [CrossRef]
  27. Gawel, R.; Sluyter, S.V.; Waters, E.J. The effects of ethanol and glycerol on the body and other sensory characteristics of Riesling wines. Aust. J. Grape Wine Res. 2007, 13, 38–45. [Google Scholar] [CrossRef]
  28. Byrnes, N.K.; Nestrud, M.A.; Hayes, J.E. Perceptual Mapping of Chemesthetic Stimuli in Naive Assessors. Chemosens. Percept. 2015, 8, 19–32. [Google Scholar] [CrossRef] [PubMed]
  29. Demattè, M.L.; Sanabria, D.; Sugarman, R.; Spence, C. Cross-Modal Interactions between Olfaction and Touch. Chem. Senses 2006, 31, 291–300. [Google Scholar] [CrossRef] [PubMed]
  30. Kora, E.P.; Latrille, E.; Souchon, I.; Martin, N. Texture-Flavor Interactions in Low Fat Stirred Yogurt: How Mechanical Treatment, Thickener Concentration and Aroma Concentration Affect Perceived Texture and Flavor. J. Sens. Stud. 2003, 18, 367–390. [Google Scholar] [CrossRef]
  31. Rodríguez-Bencomo, J.J.; Muñoz-González, C.; Andújar-Ortiz, I.; Martín-Álvarez, P.J.; Moreno-Arribas, M.V.; Pozo-Bayón, M.Á. Assessment of the effect of the non-volatile wine matrix on the volatility of typical wine aroma compounds by headspace solid phase microextraction/gas chromatography analysis. J. Sci. Food Agric. 2011, 91, 2484–2494. [Google Scholar] [CrossRef] [PubMed] [Green Version]
  32. Saenz-Navajas, M.-P.; Campo, E.; Fernandez-Zurbano, P.; Valentin, D.; Ferreira, V. An assessment of the effects of wine volatiles on the perception of taste and astringency in wine. Food Chem. 2010, 121, 1139–1149. [Google Scholar] [CrossRef]
  33. Labbe, D.; Gilbert, F.; Martin, N. Impact of Olfaction on Taste, Trigeminal, and Texture Perceptions. Chemosens. Percept. 2008, 1, 217–226. [Google Scholar] [CrossRef]
  34. Ferrer-Gallego, R.; Hernández-Hierro, J.M.; Rivas-Gonzalo, J.C.; Escribano-Bailón, M.T. Sensory evaluation of bitterness and astringency sub-qualities of wine phenolic compounds: Synergistic effect and modulation by aromas. Food Res. Int. 2014, 62, 1100–1107. [Google Scholar] [CrossRef]
  35. Dwyer, E.; Gallagher, E. Functional Ingredients as Fat Replacers in Cakes and Pastries; Teagasc: Dublin, Ireland, 2001. [Google Scholar]
  36. Busch, J.L.H.C.; Tournier, C.; Knoop, J.E.; Kooyman, G.; Smit, G. Temporal Contrast of Salt Delivery in Mouth Increases Salt Perception. Chem. Senses 2009, 34, 341–348. [Google Scholar] [CrossRef] [PubMed]
  37. Vignon, X.; Pillet, O.; Kessler, G.; Lhotellier, N.; Le Bras, G. Salinité et Minéralité. Le chaînon manquant. Rev. Oenol. 2012, 143, 49–53. [Google Scholar]
  38. Ballester, J.; Mihnea, M.; Peyron, D.; Valentin, D. Exploring minerality of Burgundy Chardonnay wines: A sensory approach with wine experts and trained panellists: Exploring minerality in wine. Aust. J. Grape Wine Res. 2013, 19, 140–152. [Google Scholar] [CrossRef]
  39. Nasri, N.; Septier, C.; Beno, N.; Salles, C.; Thomas-Danguin, T. Enhancing salty taste through odour–taste–taste interactions: Influence of odour intensity and salty tastants’ nature. Food Qual. Preference 2013, 28, 134–140. [Google Scholar] [CrossRef]
  40. Nasri, N.; Beno, N.; Septier, C.; Salles, C.; Thomas-Danguin, T. Cross-modal interactions between taste and smell: Odour-induced saltiness enhancement depends on salt level. Food Qual. Preference 2011, 22, 678–682. [Google Scholar] [CrossRef]
  41. Baeyens, F.; Eelen, P.; Van den Bergh, O.; Crombez, G. Flavor-Flavor and Color-Flavor Conditioning in Humans. Learn. Motiv. 1990, 21, 434–455. [Google Scholar] [CrossRef]
  42. Barkat, S.; Poncelet, J.; Landis, B.N.; Rouby, C.; Bensafi, M. Improved smell pleasantness after odor–taste associative learning in humans. Neurosci. Lett. 2008, 434, 108–112. [Google Scholar] [CrossRef] [PubMed]
  43. Ross, C.F. Physiology of Sensory Perception. In The Sensory Evaluation of Dairy Products; Springer US: New York, NY, USA, 2009; pp. 17–42. [Google Scholar]
  44. Stéphane Vidal, L.F. Taste and mouth-feel properties of different types of tannin-like polyphenolic compounds and anthocyanins in wine. Anal Chim Acta. Anal. Chim. Acta 2004, 513, 57–65. [Google Scholar] [CrossRef]
  45. Jones, P.R.; Gawel, R.; Francis, I.L.; Waters, E.J. The influence of interactions between major white wine components on the aroma, flavour and texture of model white wine. Food Qual. Preference 2008, 19, 596–607. [Google Scholar] [CrossRef]
  46. R Core Team. R: A Language and Environment for Statistical Computing; R Foundation for Statistical Computing: Vienna, Austria, 2015. [Google Scholar]
  47. Lê, S.; Josse, J.; Husson, F. About the FactoMineR package. J. Stat. Softw. 2008, 25, 1–18. [Google Scholar]
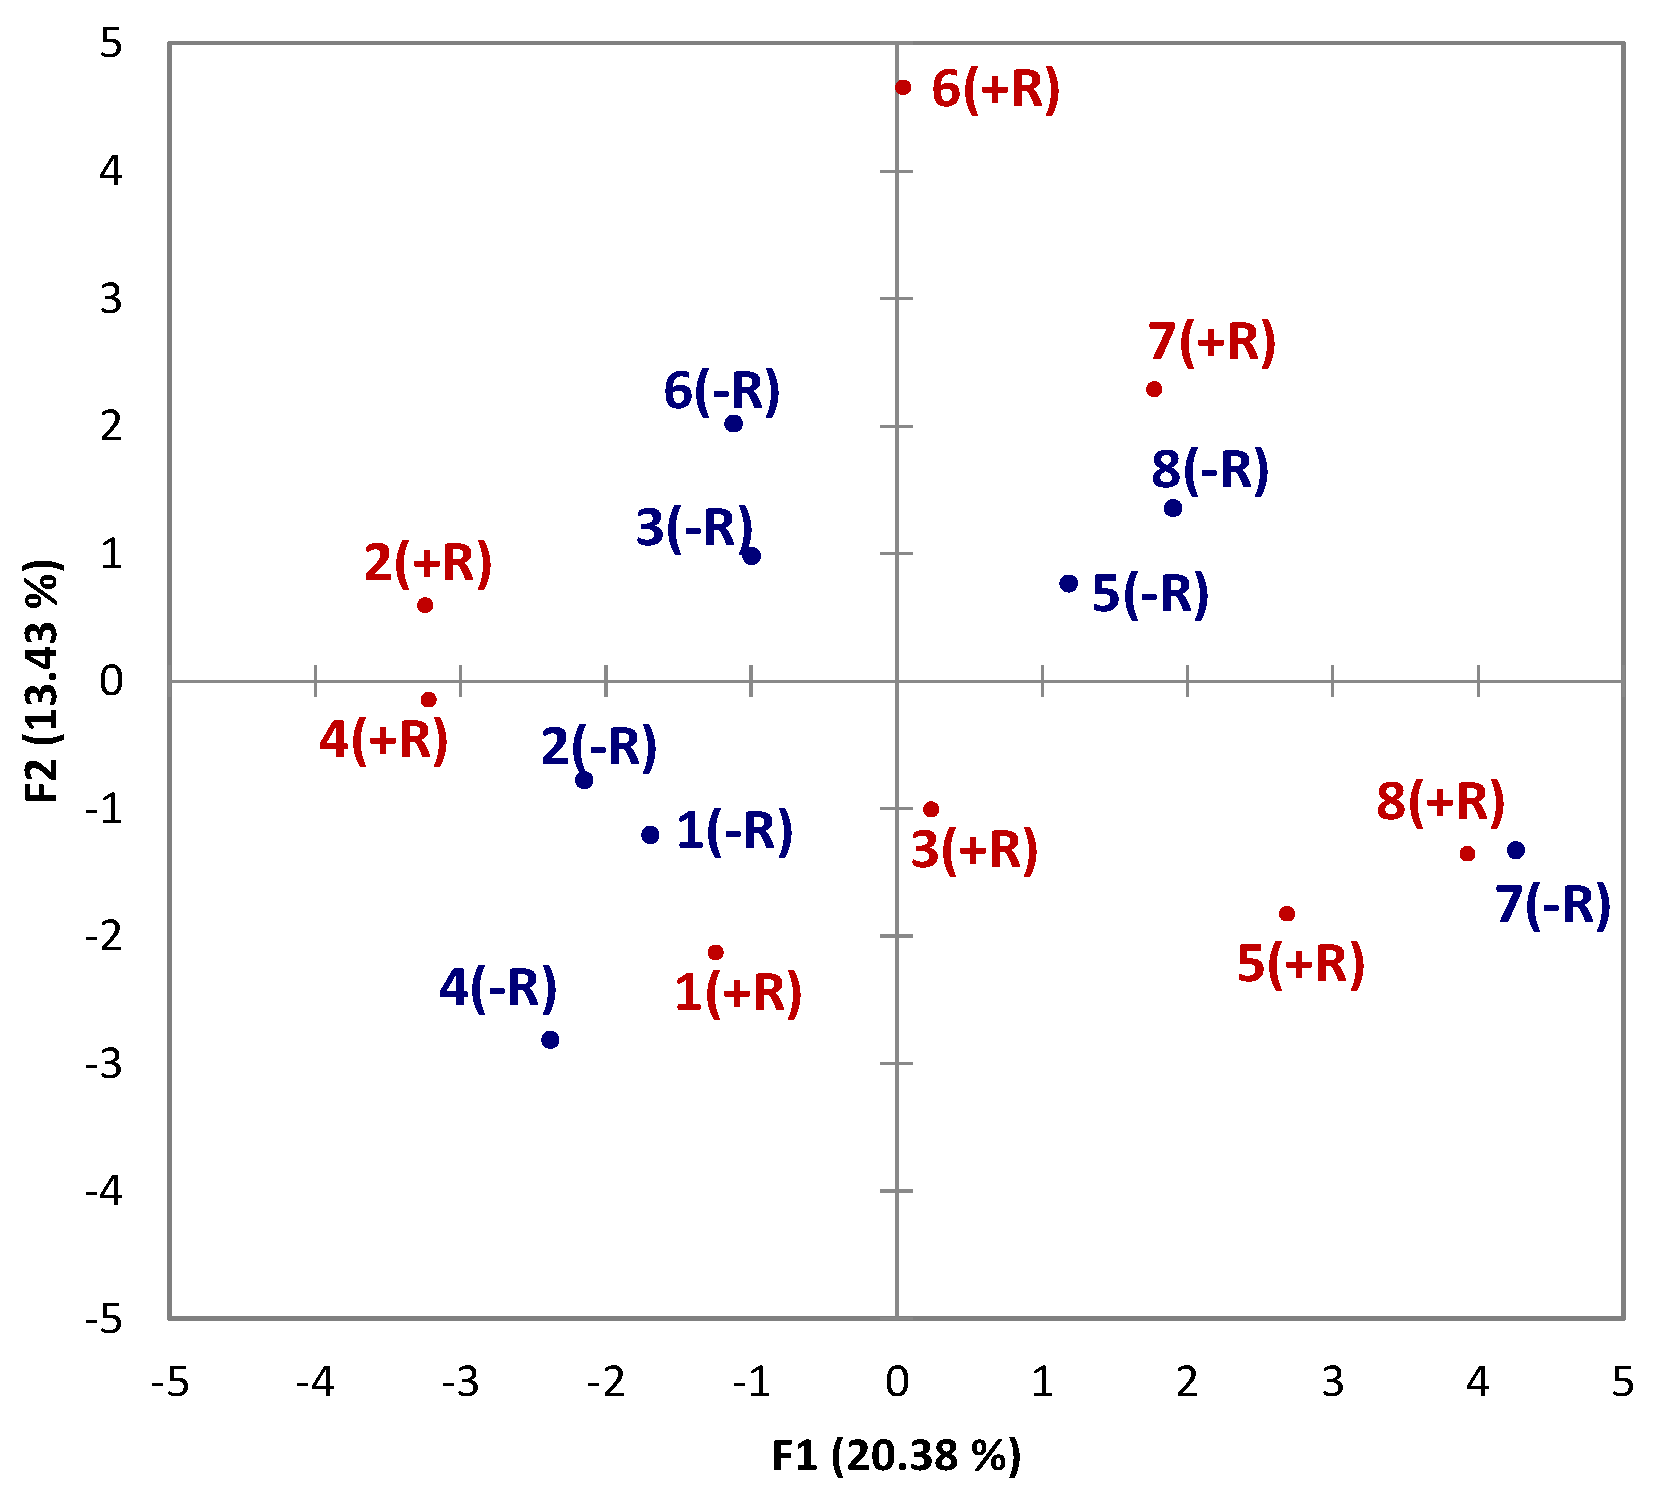
Figure 1. Multiple factor analysis of Napping® results of Chardonnay wines analyzed +R (red) and −R (blue).
Beverages 02 00007 g001
Figure 2. Correspondence analysis of terms used for Ultra Flash Profiling (UFP) analysis (A = +R, B = −R).
Beverages 02 00007 g002
Table 1. Frequency of mouthfeel descriptors used for UFP with retronasal aroma (+R) and without retronasal aroma (−R).
Term+R−R
Sweetness3131
Acidic2833
Alcohol1617
Balanced1513
Dry126
Bitter1213
Length/Persistence116
Round118
Short115
Tannin/phenolic109
Thin1013
Astringent88
Flabby8
Medium mouthfeel810
Diluted77
Rich78
Fresh6
Smooth5
Soft5
Bright44
Chewy44
Prickly4
Low mouthfeel411
High mouthfeel4
Unbalanced44
Sting4
Salty4