Article

Sensory Drivers and Emotional Determinants of Low- and Non-Alcoholic Beer Acceptance Among Young Romanian Consumers

by
Anca Farcaș
1,
Liana Claudia Salanță
2,* and
Alina Uifălean
3
1
Department of Mathematics and Computer Science, Faculty of Pharmacy, “Iuliu Hațieganu” University of Medicine and Pharmacy, Louis Pasteur Street 6, 400349 Cluj-Napoca, Romania
2
Department of Food Science, Faculty of Food Science and Technology, University of Agricultural Sciences and Veterinary Medicine Cluj-Napoca, 400372 Cluj-Napoca, Romania
3
Department of Pharmaceutical Analysis, Faculty of Pharmacy, “Iuliu Hațieganu” University of Medicine and Pharmacy, Louis Pasteur Street 6, 400349 Cluj-Napoca, Romania
*
Author to whom correspondence should be addressed.
Beverages 2026, 12(8), 96; https://doi.org/10.3390/beverages12080096
Submission received: 7 July 2026 / Revised: 10 August 2026 / Accepted: 13 August 2026 / Published: 17 August 2026

Highlights

What are the main findings?
  • Flavored low-alcohol beers, particularly the grapefruit-flavored sample, showed greater consumer acceptance than the unflavored alcohol-free beer.
  • Consumer preference was linked to fruity and aromatic characteristics, supported by visual cues such as clarity and beer foam, while LNAB consumption was predominantly associated with positive emotions and social contexts.
What are the implications of the main findings?
  • Product development should prioritize fruity and aromatic profiles while retaining appealing visual characteristics to improve the sensory acceptance of low- and non-alcoholic beers.
  • Marketing strategies can emphasize sensory enjoyment and positive social experiences, rather than focusing primarily on alcohol reduction, to support the positioning of LNABs among young consumers.

Abstract
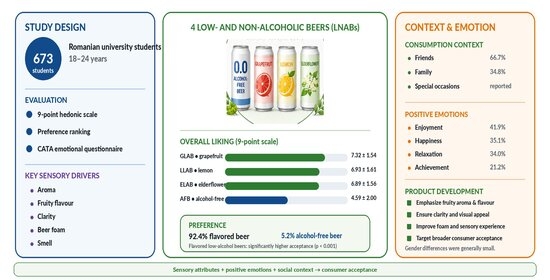
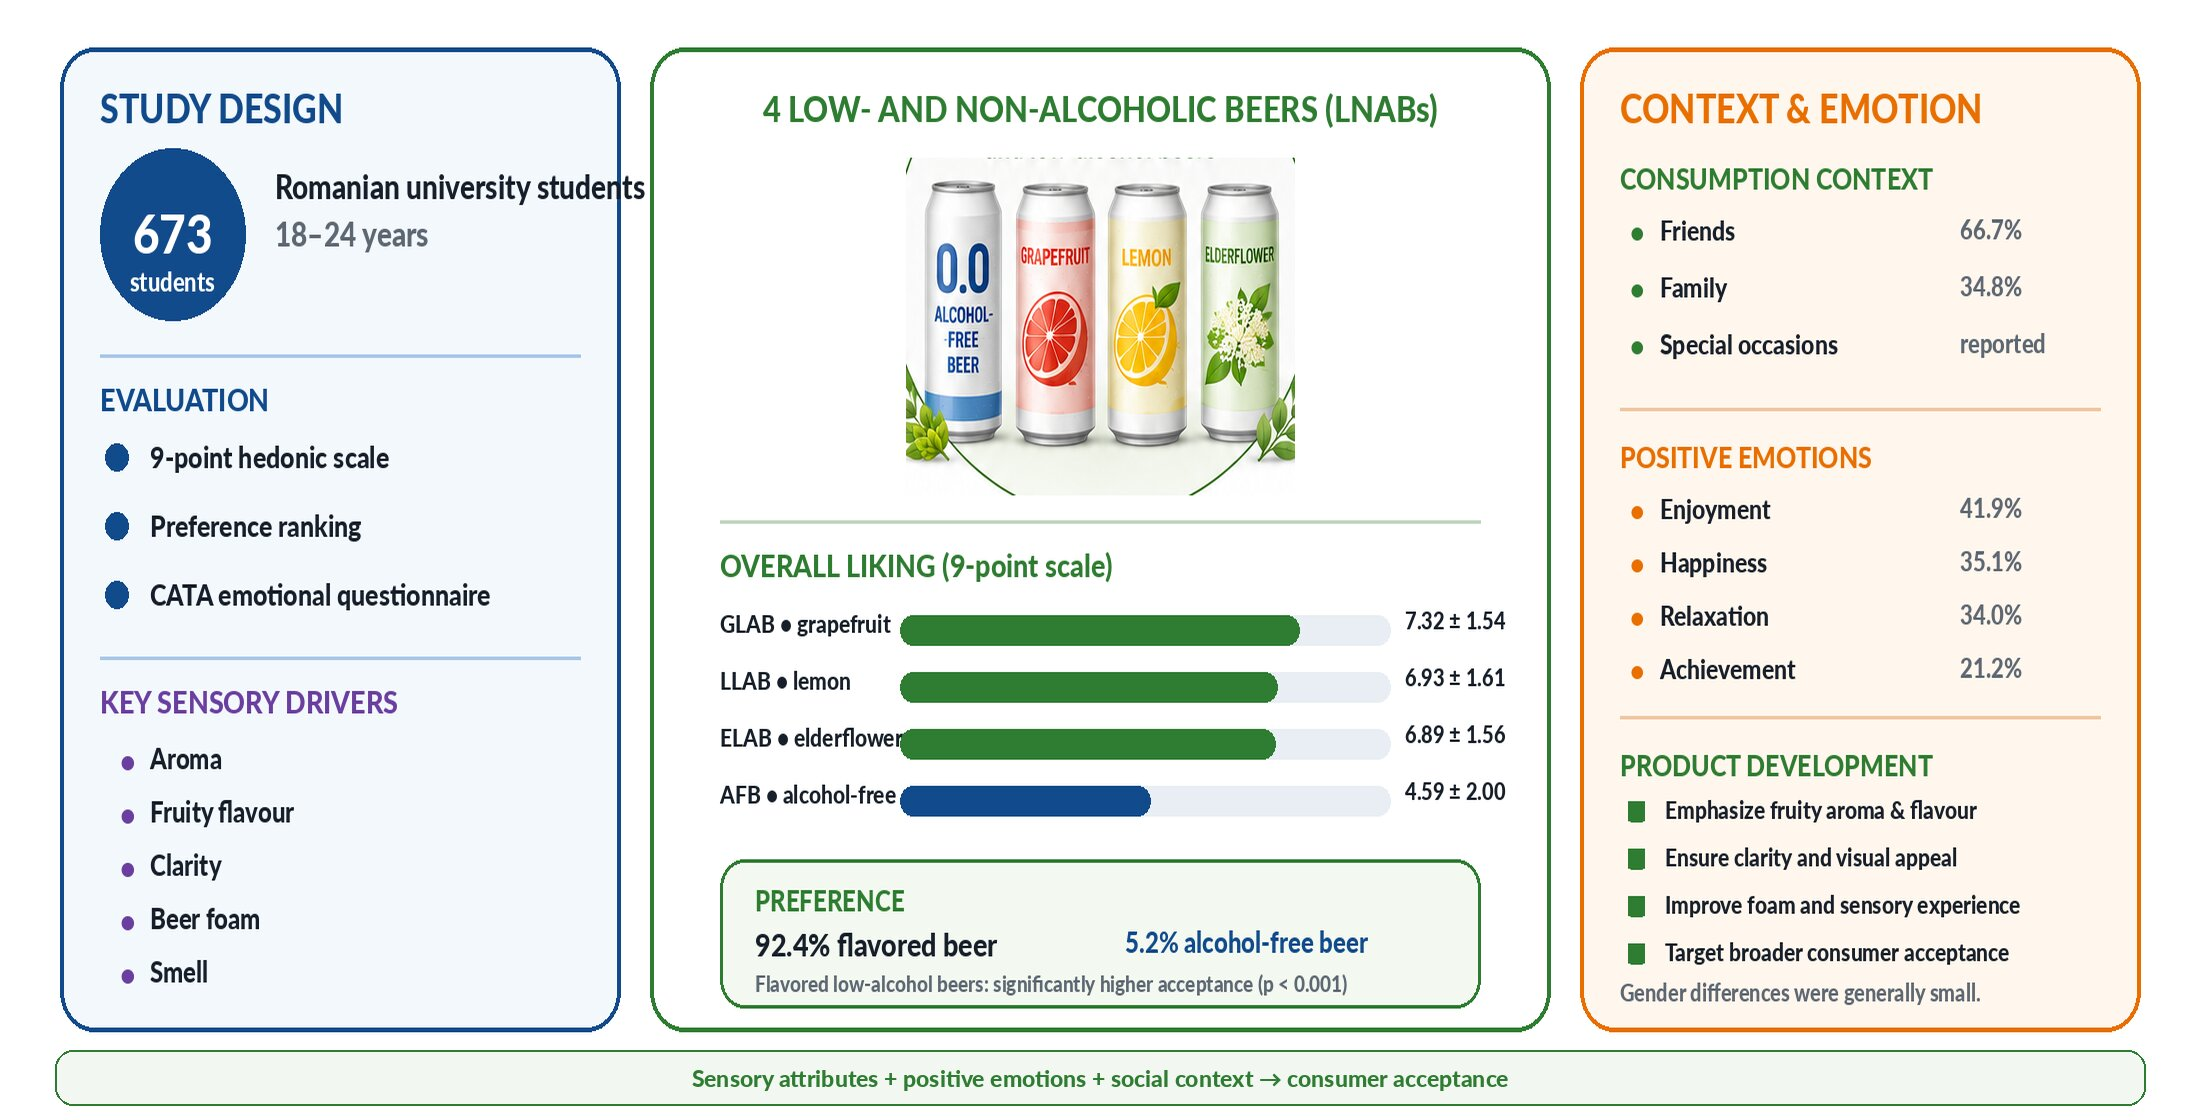
Reducing alcohol consumption remains a global public health priority, with young adults representing an important target population for preventive strategies. This has increased interest in low- and non-alcoholic beers (LNABs) as alternatives to alcoholic beverages. However, relatively little is known about how sensory characteristics, emotional responses and consumption context jointly influence the acceptance of non-alcoholic beers among young consumers. This study investigated the sensory acceptance, consumption context, and emotional responses associated with LNABs among Romanian university students. A total of 673 participants (18–24 years) evaluated four commercially available LNAB products: one alcohol-free beer (0.0% ABV) and three flavored low-alcohol beers (1.9% ABV; grapefruit, lemon, and elderflower), using a 9-point hedonic scale, preference ranking, and a check-all-that-apply (CATA) emotional questionnaire. Flavored beers received significantly higher overall appreciation than the alcohol-free sample, with mean overall liking scores of 7.32 ± 1.54 for GLAB, 6.93 ± 1.61 for LLAB, and 6.89 ± 1.56 for ELAB, compared with 4.59 ± 2.00 for AFB (all p < 0.001). Aroma, fruity flavor, clarity, beer foam, and smell emerged as the principal drivers of consumer acceptance, whereas refreshing perception showed limited influence. Gender-related differences were generally small, although female participants assigned slightly higher ratings to sweetness, fruity flavor, clarity, and foam. Importantly, both genders expressed comparable acceptance of alcohol-free beer. Consumption was predominantly associated with social settings involving friends (66.7%) and family (34.8%). Emotional profiling revealed a predominance of positive emotions, particularly enjoyment (41.9%), happiness (35.1%), relaxation (34.0%), and achievement (21.2%). Preference data showed that 92.4% of respondents selected one of the flavored beers as their preferred sample, whereas only 5.2% preferred the alcohol-free beer. This study provides one of the first integrated evaluations combining sensory drivers, emotional profiling and consumption context to explain non-alcoholic beer acceptance among Romanian young adults.

Graphical Abstract

1. Introduction

According to a recent study, youth alcohol consumption (AC) has declined across most developed countries in the last two decades [1]. However, despite this downward trend, the prevalence of AC remains concerning due to its severe consequences on young people, including impaired academic performance, increased aggression, engagement in risky behaviors, and deterioration of social relationships with family, peers, and teachers [2]. These effects highlight the ongoing need for public health interventions. The COVID-19 pandemic significantly impacted youth mental health, indirectly influencing their drinking behavior. While the initial year of the pandemic saw a decline in both alcohol consumption and binge drinking among teenagers, studies indicate a rebound effect in the second year, with rates approaching or even surpassing pre-pandemic levels [3]. Additionally, alcohol-related deaths increased by 25.5% in the first year of the pandemic, following a steady annual rise of 2.2% over the prior two decades. These findings indicate that the COVID-19 pandemic was one of several factors influencing alcohol consumption patterns among young adults, alongside broader societal, behavioral, and public health changes observed in recent years [4].
Romania follows this global trend, with alcohol abuse among university students emerging as a pressing public health issue. A 2021 study by Năsui et al. reported that both male and female students in Romania exhibit high alcohol consumption rates (84.8% vs. 79.8%), emphasizing the need for effective prevention strategies [5]. Excessive alcohol consumption among young adults is associated with an increased risk of developing alcohol use disorder (AUD), as well as numerous adverse physical, psychological, and social consequences. These include impaired cognitive performance, liver disease, mental health disorders, interpersonal violence, risky behaviors, and long-term health complications, highlighting the importance of preventive interventions aimed at reducing alcohol intake. Global efforts, such as the WHO’s alcohol strategy, advocate for reducing alcohol content in beverages to mitigate the risks associated with excessive drinking [6]. Although excessive alcohol consumption is associated with well-documented adverse health effects, several studies have reported that moderate beer consumption may be associated with potential health benefits, including antioxidants and anti-inflammatory effects, improved bone health, and a reduced risk of coronary heart disease. These effects have been attributed largely to the bioactive compounds naturally present in beer, particularly polyphenols derived from malt and hops [7,8]. Beer contains a wide range of biologically active compounds that contribute to its nutritional and functional value, including polyphenols, phenolic acids, flavonoids, melanoidins, vitamins (particularly B-group vitamins), minerals, and soluble dietary fiber. Among these, polyphenols derived primarily from malt and hops are considered the principal contributors to beer’s antioxidant capacity and have been associated with anti-inflammatory and cardioprotective effects [6,8,9]. In this context, enhancing the sensory attributes of non-alcoholic beverages is essential to increase consumer acceptance. Low- and non-alcoholic beer has therefore emerged as a promising alternative that seeks to preserve the desirable sensory characteristics and naturally occurring bioactive compounds of beer while minimizing alcohol-related health risks [7]. In the present study, the term low- and non-alcoholic beers (LNABs) is used as an umbrella term encompassing low-alcohol beers (LABs) and alcohol-free beers (AFBs). Since the legal definitions of these categories vary among European countries, the present study adopts the classification proposed by Salanță et al. [7], according to which LAB contains < 2.5% (v/v) alcohol and AFB ≤ 1% (v/v). Thus, the term “non-alcoholic beer” is not used here to imply that all products are alcohol-free, but rather to refer to the broader category of beers with reduced or absent alcohol content. Recent years have witnessed a remarkable increase in the consumption of low- and non-alcoholic beers across Europe and worldwide. According to The Brewers of Europe, non-alcoholic beer has become the fastest-growing segment of the European beer market, with sales increasing by approximately 25% over the last five years and currently accounting for about 7.5% of total beer consumption in Europe. Furthermore, recent Eurostat data indicate that European Union countries produced approximately 2.0 billion liters of low- and non-alcoholic beer in 2024, representing an 11.1% increase compared with the previous year. These figures reflect a substantial shift in consumer preferences toward lower-alcohol alternatives, driven by increasing health awareness, moderation-oriented lifestyles, and growing demand for products that preserve the sensory characteristics of conventional beer while reducing alcohol intake. The rapid expansion of this category is also reflected in its growing economic importance. Consumer interest in LNABs is driven by their perceived health benefits, sensory complexity, and refreshing properties [8,9,10]. However, despite these attributes, LNABs remain a relatively niche product category, partly because they do not evoke the same emotional responses as conventional alcoholic beverages [11]. Silva et al. [12] demonstrated that beer and wine are conceptualized through rich emotional and social associations, including enjoyment, conviviality, and social bonding, whereas non-alcoholic beer is perceived predominantly in functional terms and is more frequently associated with rational and conscious consumption. These findings suggest that emotional responses represent an important determinant of beverage preference and consumer acceptance. Furthermore, consumer perceptions of beverage healthfulness are influenced by factors beyond alcohol content [13]. Research indicates that alcoholic beverages, particularly wine and beer, are often perceived as healthier than soda or diet soda [14,15], suggesting that alcohol content alone does not dictate health-related perceptions. Labeling nutritional information on alcoholic beverages has been shown to significantly shape consumer opinions about their health implications, demonstrating the need for strategic marketing and formulation of LNAB products [16]. Compared to wine and regular beer, the emotional and hedonic attributes associated with the consumption of LNABs remain underexplored [12]. Given that drinking preferences are primary determinants of beverage selection [15], elucidating the factors that drive LNAB acceptance among young consumers is crucial for optimizing product development. Addressing these knowledge gaps can inform industry efforts to enhance LNAB formulations, sensory profiles, and marketing strategies, ultimately fostering broader consumer adoption. Although several studies have investigated the sensory characteristics or consumer perception of non-alcoholic beers [17,18,19], few have simultaneously examined sensory evaluation, emotional responses, and consumption context within the same population. To our knowledge, evidence regarding young Eastern European consumers remains limited. Young adults represent one of the most relevant target populations for research on non-alcoholic beer because this life stage is characterized by the establishment of long-term drinking habits and beverage preferences. At the same time, young consumers are generally more receptive to product innovation and healthier alternatives than older age groups. Understanding the sensory and emotional factors that influence LNAB acceptance among this population may therefore contribute both to the development of products that better meet consumer expectations and to public health strategies aimed at reducing alcohol consumption. In the present study, the term young consumers refers to university students aged 18–24 years, an age at which drinking habits and beverage preferences are actively formed and consolidated. This population therefore represents an important target group for both alcohol prevention strategies and research on the acceptance of low- and non-alcoholic beers. Based on the existing literature, we hypothesized that sensory characteristics, emotional responses, and consumption context jointly contribute to the acceptance of low- and non-alcoholic beers among young consumers. The present study examines the hedonic perception, consumption behaviors, and emotional responses to low- and non-alcoholic beers (LNABs) among university students in Romania. Using data from a 30-item questionnaire completed by over 650 students, the study had four complementary objectives: (1) to identify the sensory factors associated with the acceptance of LNABs, (2) to evaluate gender-related differences in sensory perception and consumer preferences, (3) to characterize the context and habits of LNAB consumption, and (4) to assess the emotional responses associated with LNAB consumption. The findings provided within the paper are oriented to the Romanian population. They offer valuable insights regarding the sensory and emotional factors influencing LNAB acceptance which can inform product innovation and targeted marketing strategies within the Romanian market. Rather than providing only descriptive evaluation, the study identifies the combination of sensory, contextual, and emotional factors associated with consumers’ acceptance of LNABs, thereby offering practical guidance for product development and supporting public health strategies aimed at promoting lower-alcohol alternatives. Moreover, these insights may serve as a reference for broader research on LNAB consumption trends across Europe, contributing to a better understanding of consumer preferences in different cultural contexts.

2. Materials and Methods

2.1. Recruitment Subject

The present study was conducted during the 2019/2020 academic year, with data collection carried out during the first semester and the beginning of the second semester, and completed by the end of February 2020, before the implementation of COVID-19-related restrictions in Romania. All participants were undergraduate university students (18–24 years old) from the University of Agricultural Sciences and Veterinary Medicine Cluj-Napoca (UASVMCN), Romania. The selection of university students (18–24 years old) as participants in this study was driven by several key factors. First, this age group is particularly suitable for sensory evaluation research, as students are often open to trying new experiences and are at an age where they typically consume alcohol, including beer. Additionally, university students provide a convenient and accessible sample, as the study was conducted at the UASVMCN, which made recruitment logistically feasible. In addition, selecting participants from a single university ensured a relatively homogeneous study population in terms of educational background, age and socio-cultural environment, reducing external variability and allowing a more controlled investigation of the relationships between sensory perception, emotional response and product preference.
Participants were initially screened using a previous online selection survey (a 30-item questionnaire) [15]. Volunteers (n = 17) who did not complete every item of the questionnaire or did not follow the questionnaire completion instructions were excluded from the analysis. By completing the web-based questionnaire, participants provided voluntary informed consent to participate in the research. Based on this online survey, only volunteers who expressed a preference for beer consumption and an interest in tasting new beer aromas were further selected. Students receiving medical treatment were also excluded from the study.
The final analytical sample (n = 673) consisted of 220 males and 453 females. The number of females versus males in the study was higher, since in the respective academic year more females than males were enrolled at the faculty. The selection process was rigorous, focusing on individuals with a clear preference for beer and an interest in experiencing new beer aromas, as indicated by a prior online survey. The relatively large sample size (n = 673), combined with the predefined inclusion criteria, increased the precision of the estimated sensory preferences while reducing sampling variability. Although the study population was intentionally restricted to university students with an interest in beer consumption, this approach provided a relatively homogeneous sample that strengthened the reliability of statistical comparisons and allowed a more controlled evaluation of sensory perception, consumer preferences, and emotional responses. Therefore, the selected sample was considered appropriate for addressing the objectives of the present study. Ethical approval for this study was obtained from the Ethical Committee of the University of Agricultural Sciences and Veterinary Medicine Cluj-Napoca, Romania, on 16 December 2015, for the ERAB-funded research project “A study on young drinking behavior—evaluation the relationship between taste reactivity and special beer consumption” (ERAB Grant Ref. EA 15 45). All participants provided informed consent before participating in the study. All participants provided informed consent before completing the questionnaire. Students were informed that participation was voluntary and anonymous, and no information about their personal identification was collected. No financial or material incentive was provided for participation in the study.

2.2. Study Design

All participants were invited to taste four low- and non-alcoholic beer samples available on the market, one at a time, and then were requested to fill in a questionnaire designed to evaluate their hedonic perception and preference as well as their emotional response to the consumed beverage. In the beginning, the participants were informed about the study’s aim and received proper information related to filling out the questionnaire. Also, ethical issues were communicated.
The volunteers were asked not to eat, drink, or smoke 2 h before the tasting session. Next, they were divided into groups of 10–15 subjects and invited to the laboratory for sensory analysis of food from the Department of Food Science, Faculty of Food Science and Technology, UASVMCN.
All students received 30 mL of each beer sample, labeled with a three-digit code and kept at 4 °C, along with filtered water, to rinse the oral cavity between sample tastings.
The questionnaire for data collection (Table 1) contained the hedonic test [17] (with a 9-point hedonic scale where 1 = extremely disliked and 9 = extremely liked), the preference test [18], and a CATA (check-all-that-apply) emotional test [19]. The emotional vocabulary and the sensory descriptors included in the questionnaire were selected following a review of the available literature on beer sensory evaluation and consumer perception and were adapted to the objectives of the present study. The sensory attributes comprised the principal visual, aroma, flavor, and taste characteristics commonly assessed in consumer beer studies, whereas the emotional terms were selected to encompass a broad spectrum of positive, negative, and neutral emotional responses potentially associated with beer consumption. For this purpose, a table of 60 emotional terms/feelings was listed in alphabetical order, and students were asked to select the ones that were evocative to them when consuming LNABs. A complete tasting session and questionnaire filling lasted approximately 45 min. Emotional responses were collected and stored at the participant level and subsequently summarized as frequencies and percentages of respondents selecting each attribute. Emotional frequencies were calculated for the sensory sample (n = 673) and used to identify the predominant emotional responses associated with the evaluated beers.

2.3. Beer Samples

The four pilsner samples included in this research were purchased from a local distributor and were used within four months after production. All samples belonged to the same Romanian manufacturer and were produced using the same basic brewing raw materials (water, barley malt, corn, hops, and yeast), although their formulations differed in terms of alcohol content and flavoring. They were deliberately selected from the same producer to minimize variability associated with differences in brewing technology, raw materials, and production practices. The selected products represent the commercially available low- and non-alcoholic beer portfolio of this manufacturer and included differences in alcohol content and the presence of natural flavorings (lemon, grapefruit, and elderflower), as declared by the manufacturer on the product labels. Because the products differed simultaneously in alcohol content and flavoring, the study was not designed to isolate the independent effects of these factors. Rather, the objective was to characterize consumer responses to the commercially available products within the manufacturer’s low- and non-alcoholic beer portfolio. The evaluated product portfolio consisted of one unflavored alcohol-free beer (0.0% ABV), which served as the reference sample, and three flavored low-alcohol beers (1.9% ABV) containing natural lemon, grapefruit, and elderflower flavorings, respectively. No flavored alcohol-free beer or unflavored low-alcohol beer was available within the manufacturer’s product portfolio at the time of the study. The samples also differed in their nutritional values, and the brewer’s website and product labels describe them as having distinct sensory characteristics (Table 2).

2.4. Statistical Analysis

Data analysis was performed using R 3.5.1 statistical software and Python 3.13.3 (pandas, matplotlib) for data preprocessing and graphical representation. Before analysis, data preprocessing included validation and consistency checks across all four beer assessments. Participants with missing demographic data (age or gender) or inconsistent responses across samples were excluded, resulting in a final sample of 673 subjects. Given the substantial proportion of missing values observed in several sensory variables (e.g., sweetness, spiciness, and sourness), variables exhibiting excessive missingness (>40%) were excluded from statistical comparisons to avoid bias. For the global appreciation scores and key sensory attributes, only complete cases were retained for inferential analysis. Categorical variables were represented as absolute values (percent).
For the CATA (Check-All-That-Apply) questionnaire, each emotional descriptor was treated as a binary variable (selected/not selected). The frequency and percentage of participants selecting each emotion were calculated for each beer sample. Differences in the distribution of emotional responses among the evaluated beer samples were assessed using Fisher’s exact test, while pairwise comparisons between samples were performed using McNemar’s test, as appropriate.
Associations between other categorical variables were also assessed using Fisher’s exact test and McNemar’s test, where appropriate. Emotional responses obtained through the CATA questionnaire were analyzed as frequency data.
Normality was assessed using graphical methods (histograms and Q–Q plots) and the Shapiro–Wilk test. As most variables deviated from normality, non-parametric methods were applied. Consequently, the comparison between independent groups (e.g., gender comparisons) was evaluated using the Mann–Whitney U test, while the paired comparisons between beer samples were assessed using the Wilcoxon signed-rank test. A post hoc power analysis indicated that the sample size (n = 673) provided statistical power greater than 0.80 for detecting moderate effects (Cohen’s d ≥ 0.5) at α = 0.05. The primary paired comparisons exhibited power > 0.99 due to the large observed effect sizes.

3. Results and Discussions

3.1. Comparison of LNAB Preferences Across Sensory Attributes

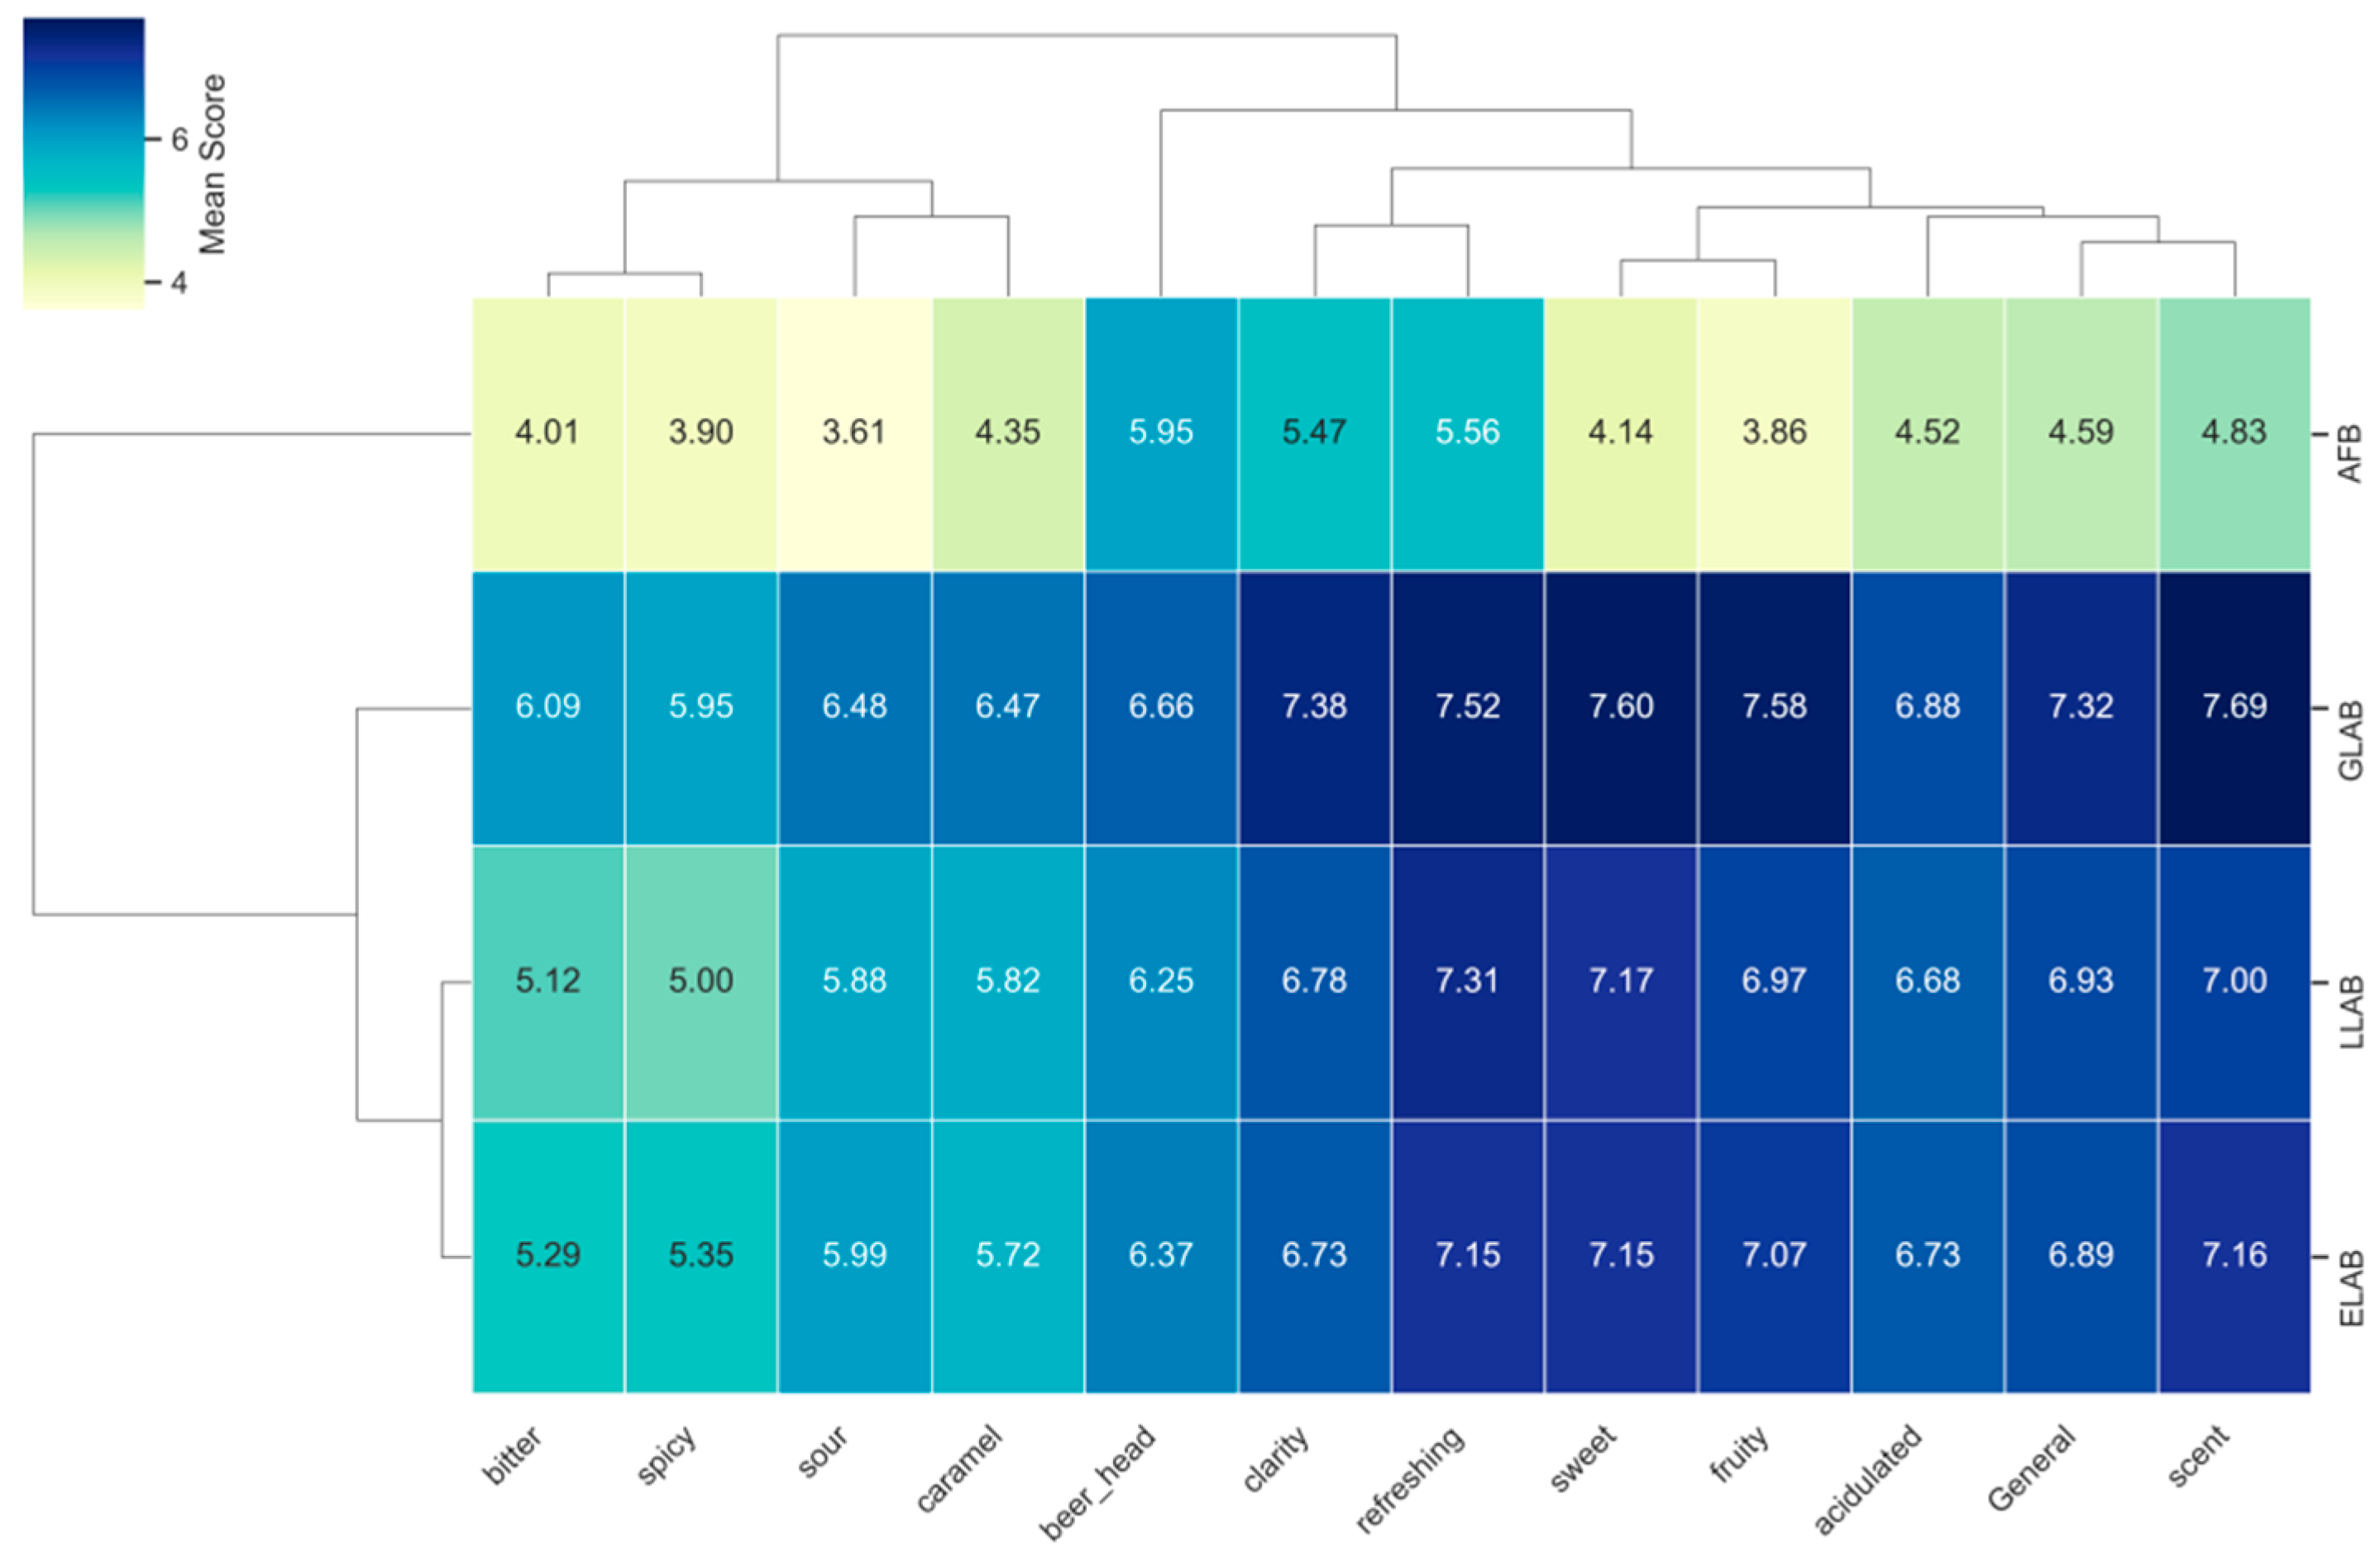
Participants evaluated the beer samples using a 9-point hedonic scale covering visual attributes (clarity, color, and foam), aroma, taste, flavor, and overall appreciation. The aggregated results are presented in Figure 1, which summarizes the sensory evaluation across all samples.
Overall, the flavored low-alcohol beers (LLAB, GLAB, and ELAB) received higher appreciation scores compared to the alcohol-free blank sample (AFB). Among these, the grapefruit-flavored beer (GLAB) consistently achieved the highest ratings across most sensory attributes and overall liking. The difference in overall appreciation between GLAB and AFB was statistically significant (Wilcoxon signed-rank test, p = 1.11 × 10⁻¹¹), indicating a strong preference for the flavored variant. The higher acceptance of the flavored beers may be explained by the interaction between the added fruit aromas and the characteristic flavor profile of beer. Fruit flavorings introduce pleasant citrus and floral notes while partially masking the less intense malt- and hop-derived aromas that are frequently perceived in alcohol-free and low-alcohol beers. At the same time, they complement the natural flavor contributed by malt and hops, resulting in a more balanced sensory profile while preserving the characteristic identity of beer. Similar effects have been reported in beers enriched with fruits, where the addition of fruit ingredients enhanced fruity and floral sensory attributes, increased aroma complexity, and improved overall consumer acceptance [7,9,11]. The positive influence of fruit-derived sensory attributes observed in the present study is consistent with findings reported for other functional non-alcoholic beverages. Belović et al. demonstrated that the combination of Spirulina with fruit juice resulted in significantly higher consumer acceptance than vegetable-based formulations, highlighting the importance of the product matrix and complementary flavor profile for improving sensory acceptability of functional beverages [20]. These findings further support the role of fruit ingredients in enhancing consumer acceptance of innovative non-alcoholic products.
This observation is particularly relevant because the sensory profile of non-alcoholic beers differs inherently from that of conventional alcoholic beers. The production technologies used to obtain non-alcoholic beers, including restricted fermentation or alcohol removal, alter the formation and retention of fermentation-derived volatile compounds, resulting in a less complex aroma profile and a lower intensity of characteristic malt- and hop-derived flavors. Consequently, the addition of fruit aromas may compensate for these sensory differences by increasing aroma complexity and flavor intensity while preserving the characteristic identity of beer, thereby improving consumer acceptance of non-alcoholic beers [7,21].
When examining individual sensory attributes, attributes related to appearance and aroma, particularly clarity, foam, and smell, received the highest ratings across samples. Pairwise comparisons between each flavored beer and the blank sample revealed statistically significant differences for these key attributes. Specifically, GLAB showed highly significant improvements compared to AFB (p = 7.51 × 10⁻¹⁴), while ELAB (p = 0.0008) and LLAB (p = 0.018) also demonstrated significant but comparatively smaller effects.
These findings suggest that flavor addition enhances both sensory perception and overall acceptance, with aroma and visual characteristics acting as major contributors to consumer preference. The consistently higher scores observed for GLAB indicate that grapefruit flavoring may be particularly effective in improving the sensory appeal of low- or non-alcoholic beers. One possible explanation is that citrus aromas provide stronger cross-modal sensory stimulation than the malt profile of conventional alcohol-free beer. The combination of fruity aroma, sweetness and visual appearance may create a more complex multisensory experience, thereby increasing hedonic appreciation.
Recent research showed that volatiles in seven fruit beers differed greatly and, based on the distinctive compound profiles (including esters, alcohols, aldehydes, acids, and ketones), a clear discrimination and classification can be achieved [22]. Therefore, if the volatile compound composition is characteristic of a beer type, the perceived smell will also be unique. For example, the grapefruit aroma is composed of a large number of volatile sulfur compounds such as 1-p-menthene-8-thiol, 4-mercapto-4-methylpentan-2-one (4MMP), 3-mercaptohexan-1-ol (3MH), or 3-mercapto hexyl acetate (3MHA), which have a great impact on odor and might explain the preference of participants for this beer type [22]. It is well known that alcohol perception can be associated with positive or negative memories, expectations, and cognitive and physiological responses, which, in turn, affect consumption behavior and preferences [23].
The lower perception of the characteristic citrus aroma of lemon and grapefruit may be related, among other factors, to the relatively high carbohydrate content, including 6 g of sugars (according to the label information, Table 2).
Across all beer types, beer foam received relatively high visual-attribute ratings, with marginally higher scores observed for GLAB. These findings suggest that foam appearance may be a relevant visual characteristic for consumer perception of the evaluated beer. Previous literature suggests that a moderate level of foam can positively influence consumers’ expectations and may contribute to purchase intention [24]. However, the present study did not experimentally isolate the contribution of foam to overall sensory acceptance.
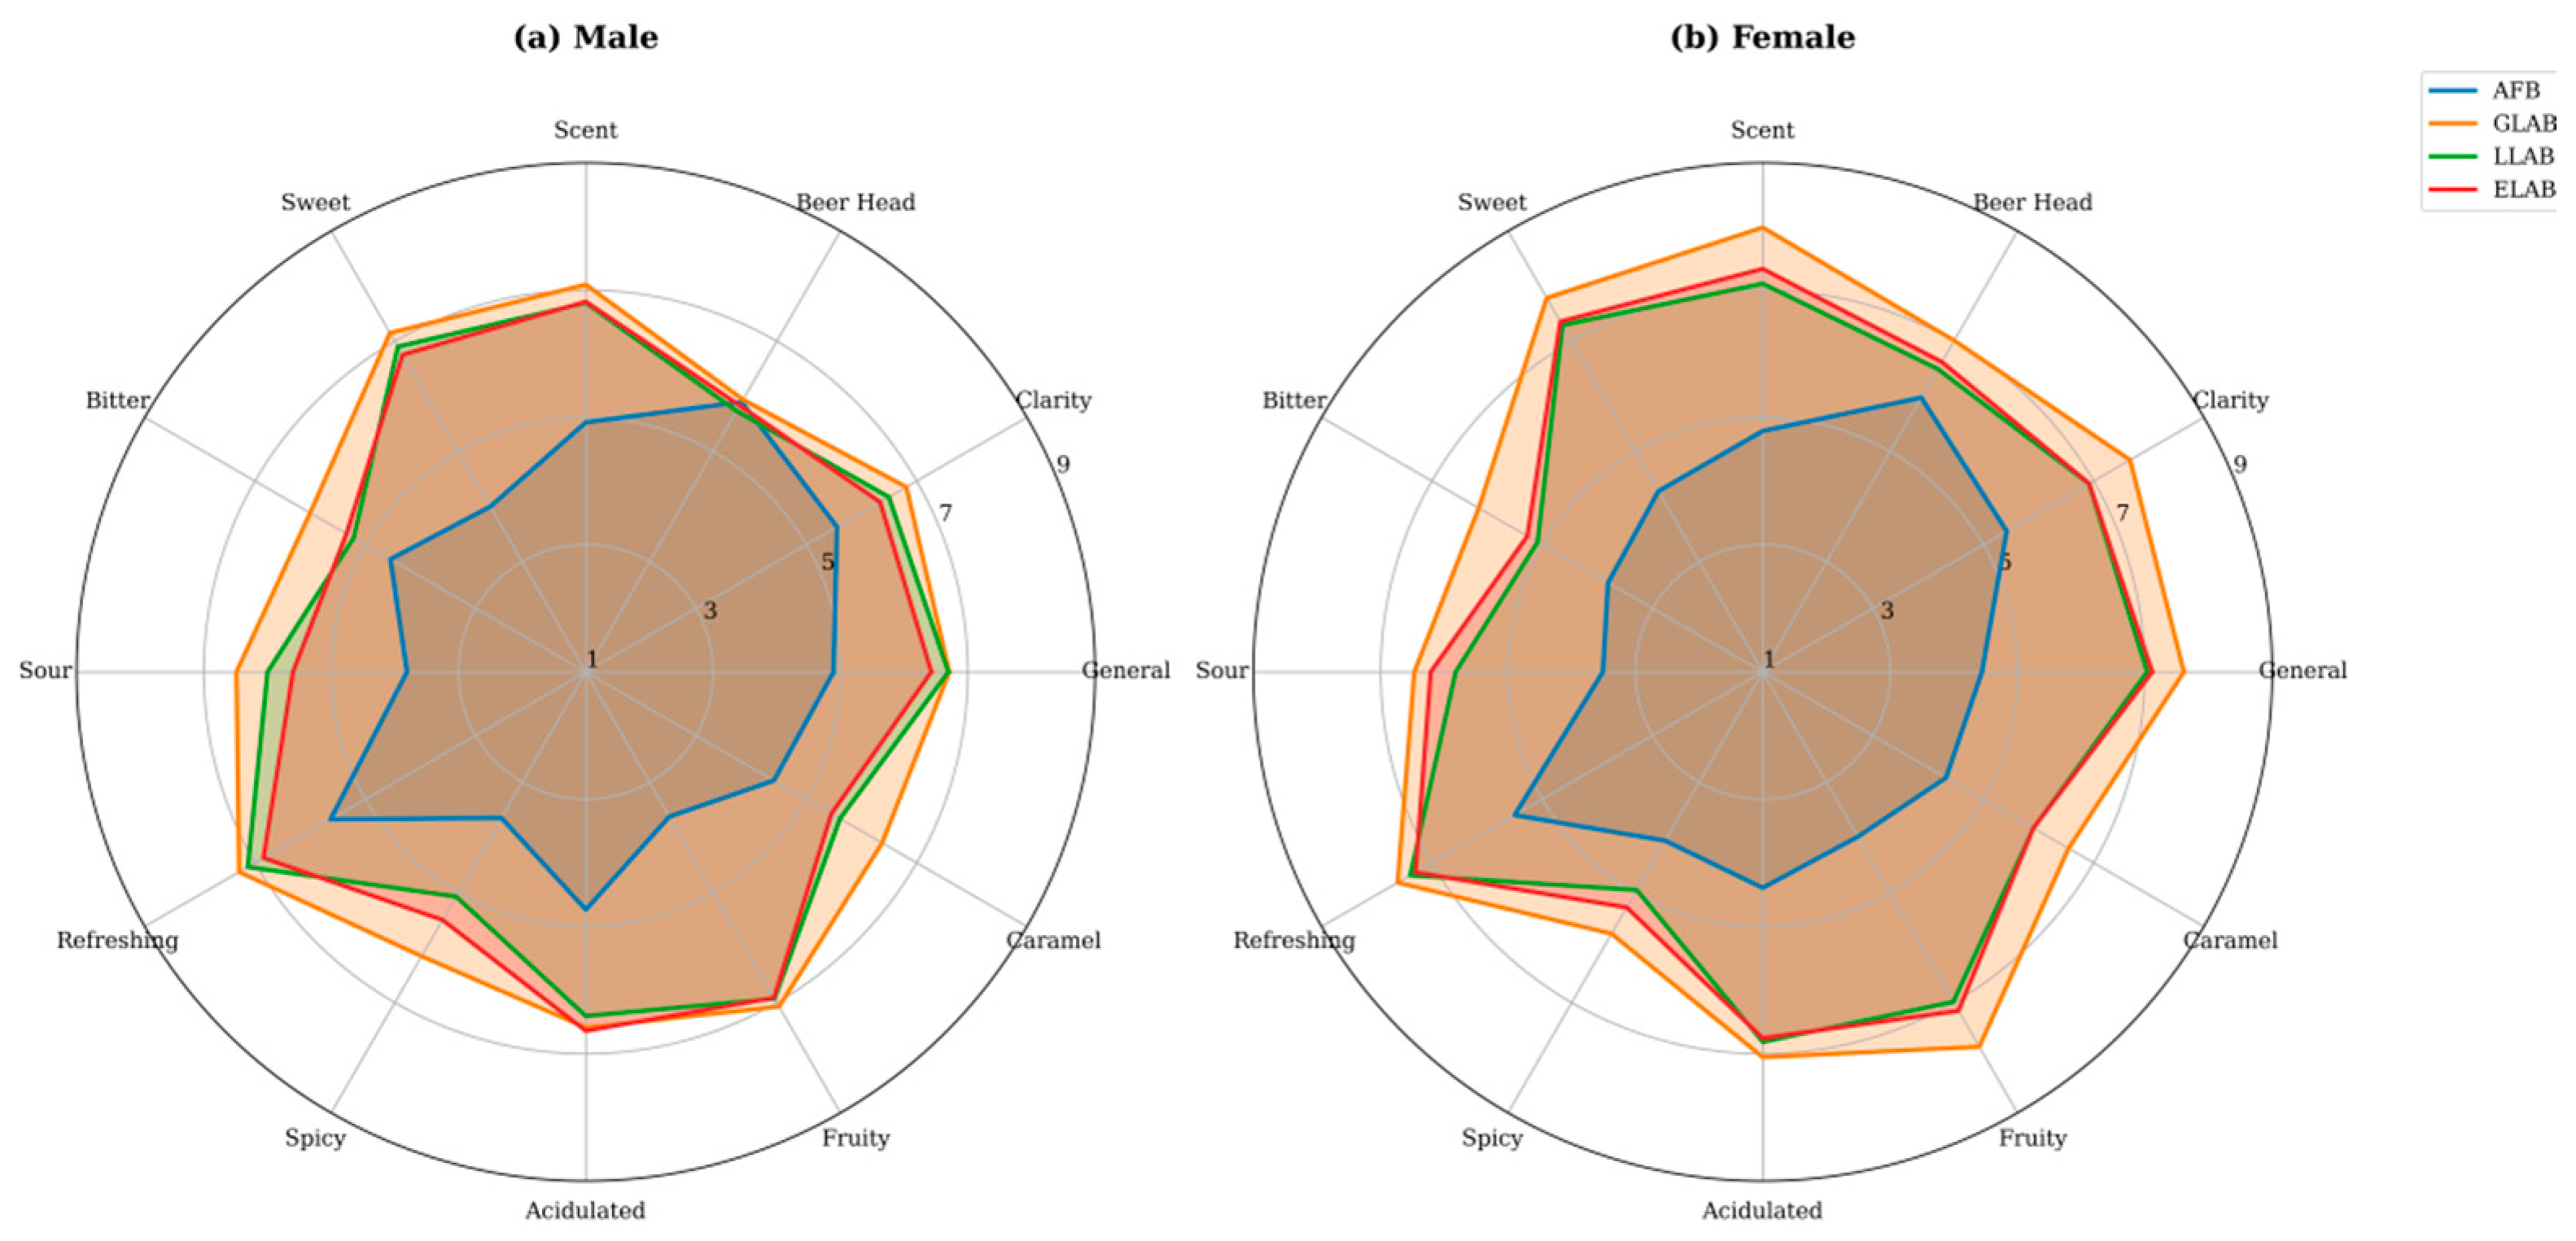
Next, we investigated how exactly these sensory attributes and appealing characteristics of beers are distributed among female and male students (Figure 2).
As seen in Figure 2, the fruity taste of beer samples was appreciated by both genders, reaching the highest scores among aromas. Differences between male and female participants were observed, although these should be interpreted cautiously due to sample imbalance (higher female participation). Female participants tended to assign higher scores to sweetness-related attributes, fruity flavor, and visual characteristics (clarity and foam). Men students appreciated the AFB more for its smell. However, the magnitude of these differences was generally small to moderate (effect size r < 0.3), indicating that gender has limited impact on overall preference structure. Apparently, the visual appearance cues (such as color, foam, and clarity) play a very important role in setting people’s expectations associated with beer before tasting, and their perception of multisensory tasting [24]. Previous studies have shown that females associate color with flavor intensity when evaluating beers. Generally, dark-colored beers are associated with high flavor intensities, particularly bitterness [25].
Interestingly, both genders offered low, comparable scores for the refreshing attribute. It would be expected that flavored beers, especially LLAB and GLAB due to their limonene content, would offer a sensation of freshness and cooling. The results indicate a similar perception of them with the AFB, without flavors. Therefore, brewers should not emphasize the refreshing attribute of these LNAB products in their advertisements to promote them, since participants did not value this attribute. Our results are in line with previous studies, which showed that the refreshing intensity of beers was negatively correlated with the intensity of “sweetness”, “overall flavor, or “overall aroma”. Interestingly, the refreshing intensity was positively correlated with attributes like “drinkable”, “carbonation”, or “bubble density” [26].
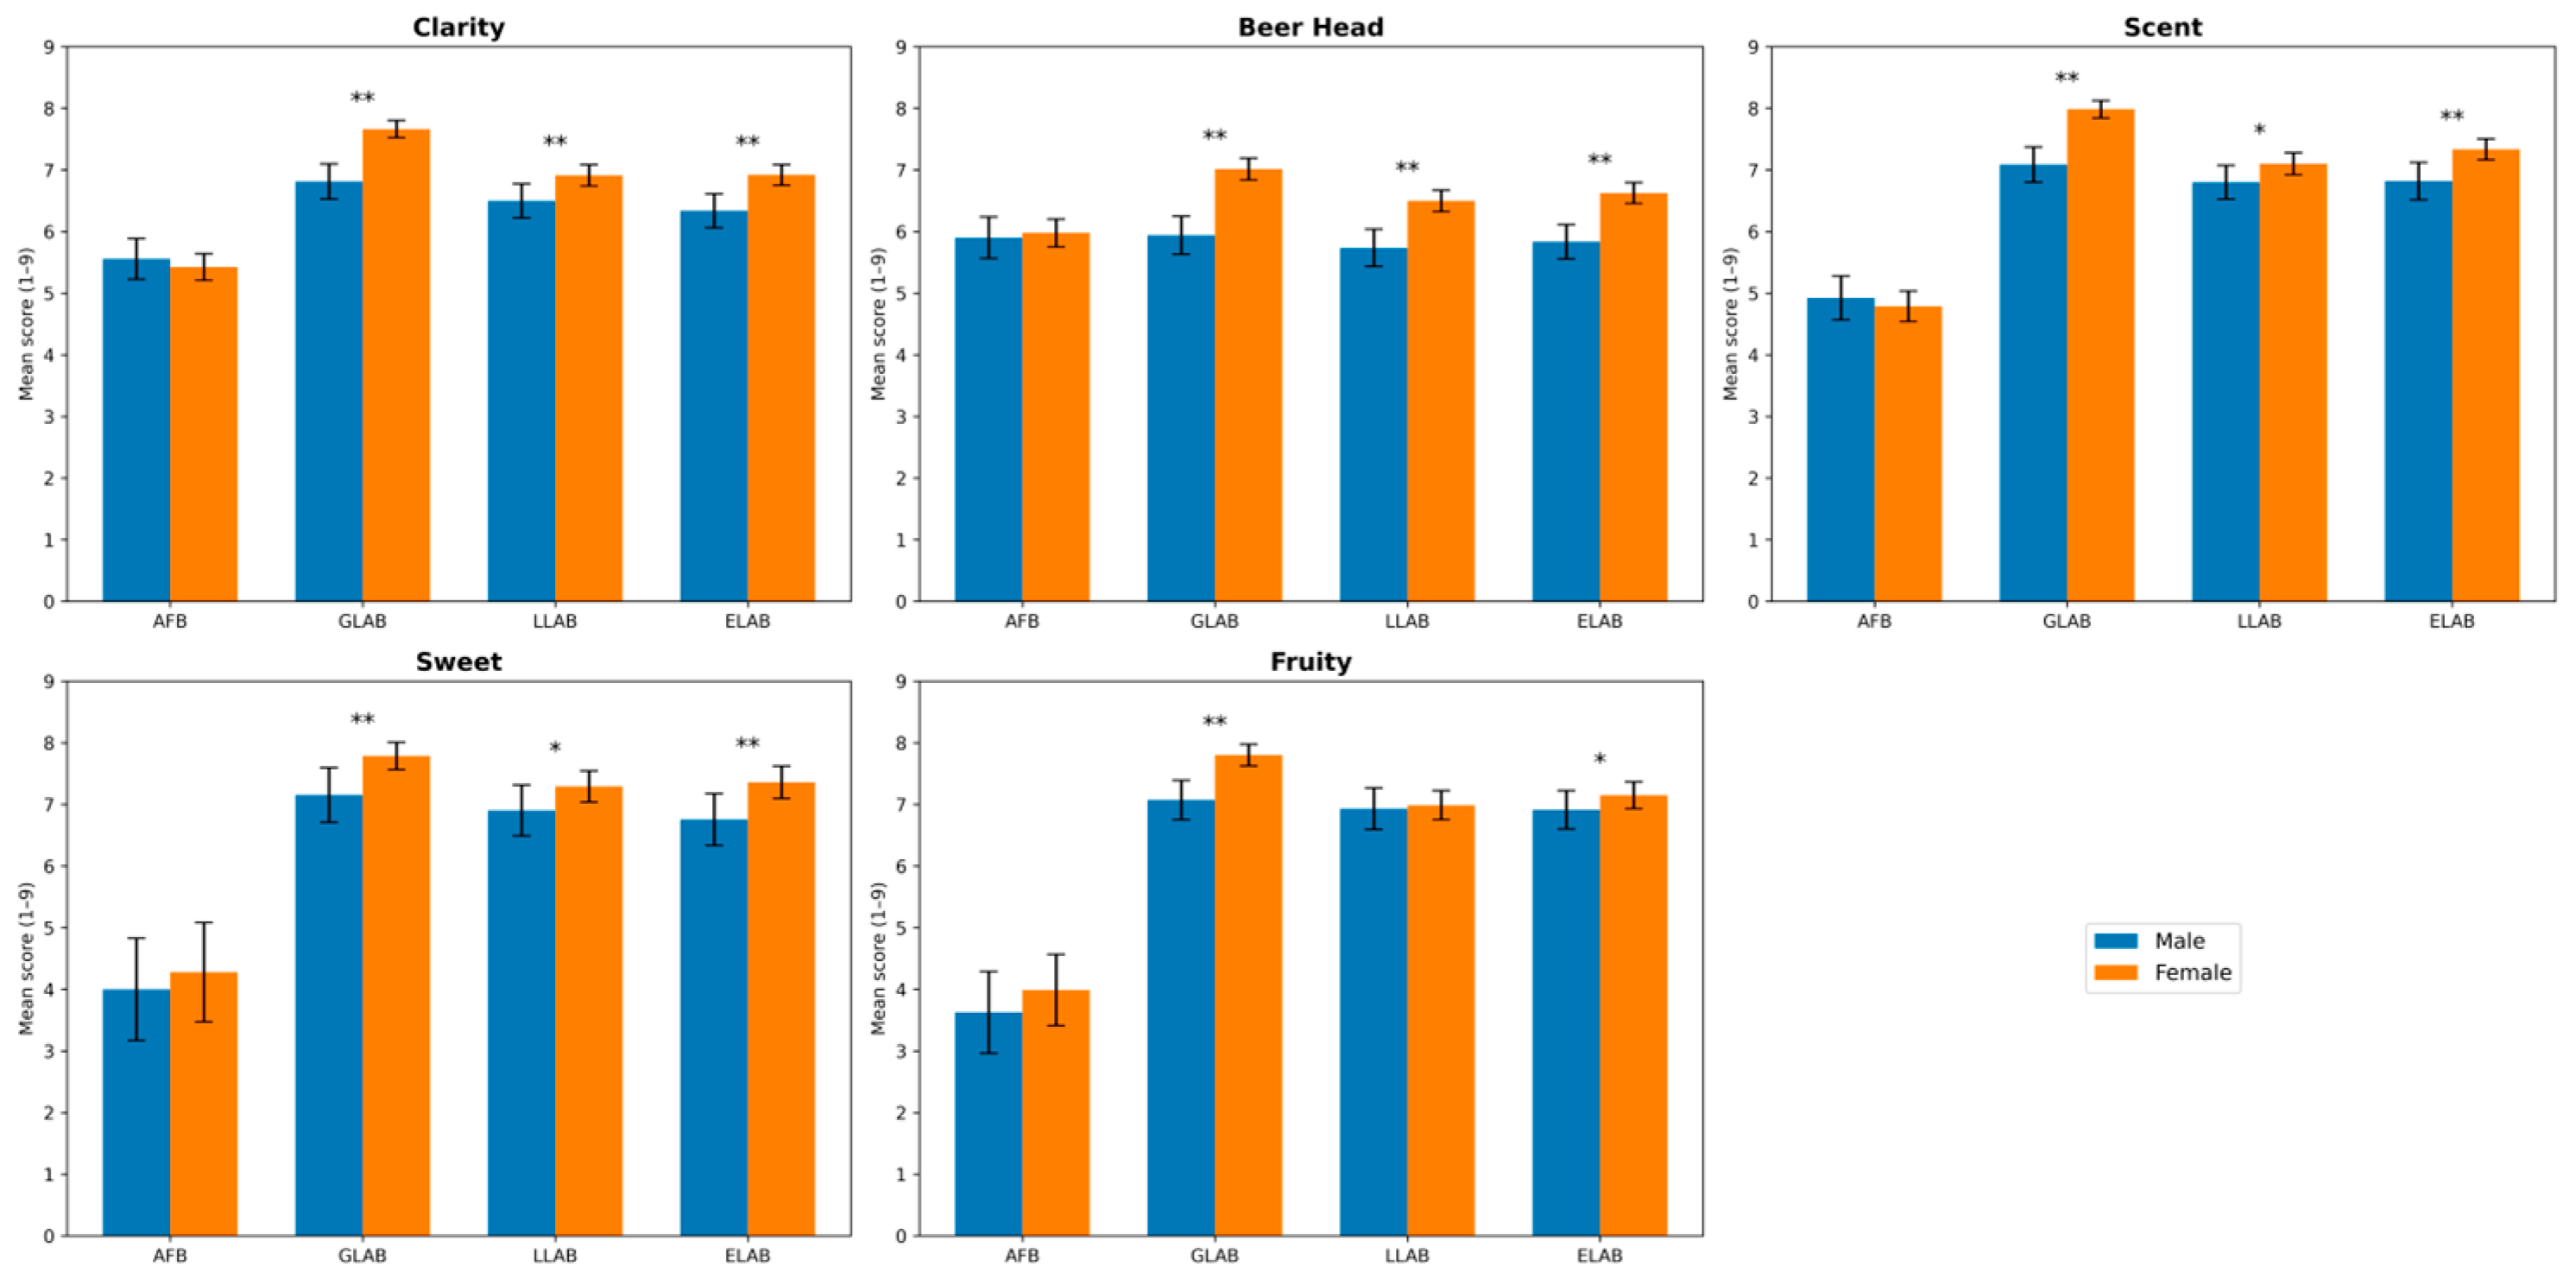
As most respondents associated their preferences for LNABs primarily with five sensory attributes (fruity, clarity, beer head, smell, and sweet), we further analyzed the fine differences among female and male students.
As seen in Figure 3, the most significant differences (p < 0.01, Mann–Whitney U test) concern GLAB, which is mostly preferred by females for its fruity taste, clarity, beer foam, sweetness, and smell.
The results showed that, generally, females offered higher scores to all sensory properties. Significant differences between genders exist especially for the GLAB type, for which the female participants clearly appreciated the fruity and sweet taste, the clarity, the beer foam, and its smell. The ELAB and LLAB types had similar profiles, being slightly preferred by females for their beer foam and smell. These results show that the main drivers of female liking and disliking of beer compared to males are the taste (sweet/fruity), the aspect (clarity and beer foam) and the beer smell. Our results partially overlap with a previous study [25], which investigated females’ attitude and preference for beer and concluded that beer’s sweetness has a positive effect on liking, while bitterness has a strong negative effect. The AFB obtained the lowest scores for all five sensory capabilities, indicating that neither female nor male students appreciate the AFB for its attributes.
The fact that females did not offer significantly lower scores for the non-flavored beer (AFB) is interesting and should be considered. Herewith, females do not reject or disparage beers without flavor more than men. Often, the producers include only men in the advertisements for their beers, especially those without flavors, sending the signal that these products are intended exclusively for them. But the results of our study indicate that both genders are equally interested in this segment of drinks without flavors and without alcohol.

3.2. Consumption Context and Emotional Response to Beer Samples

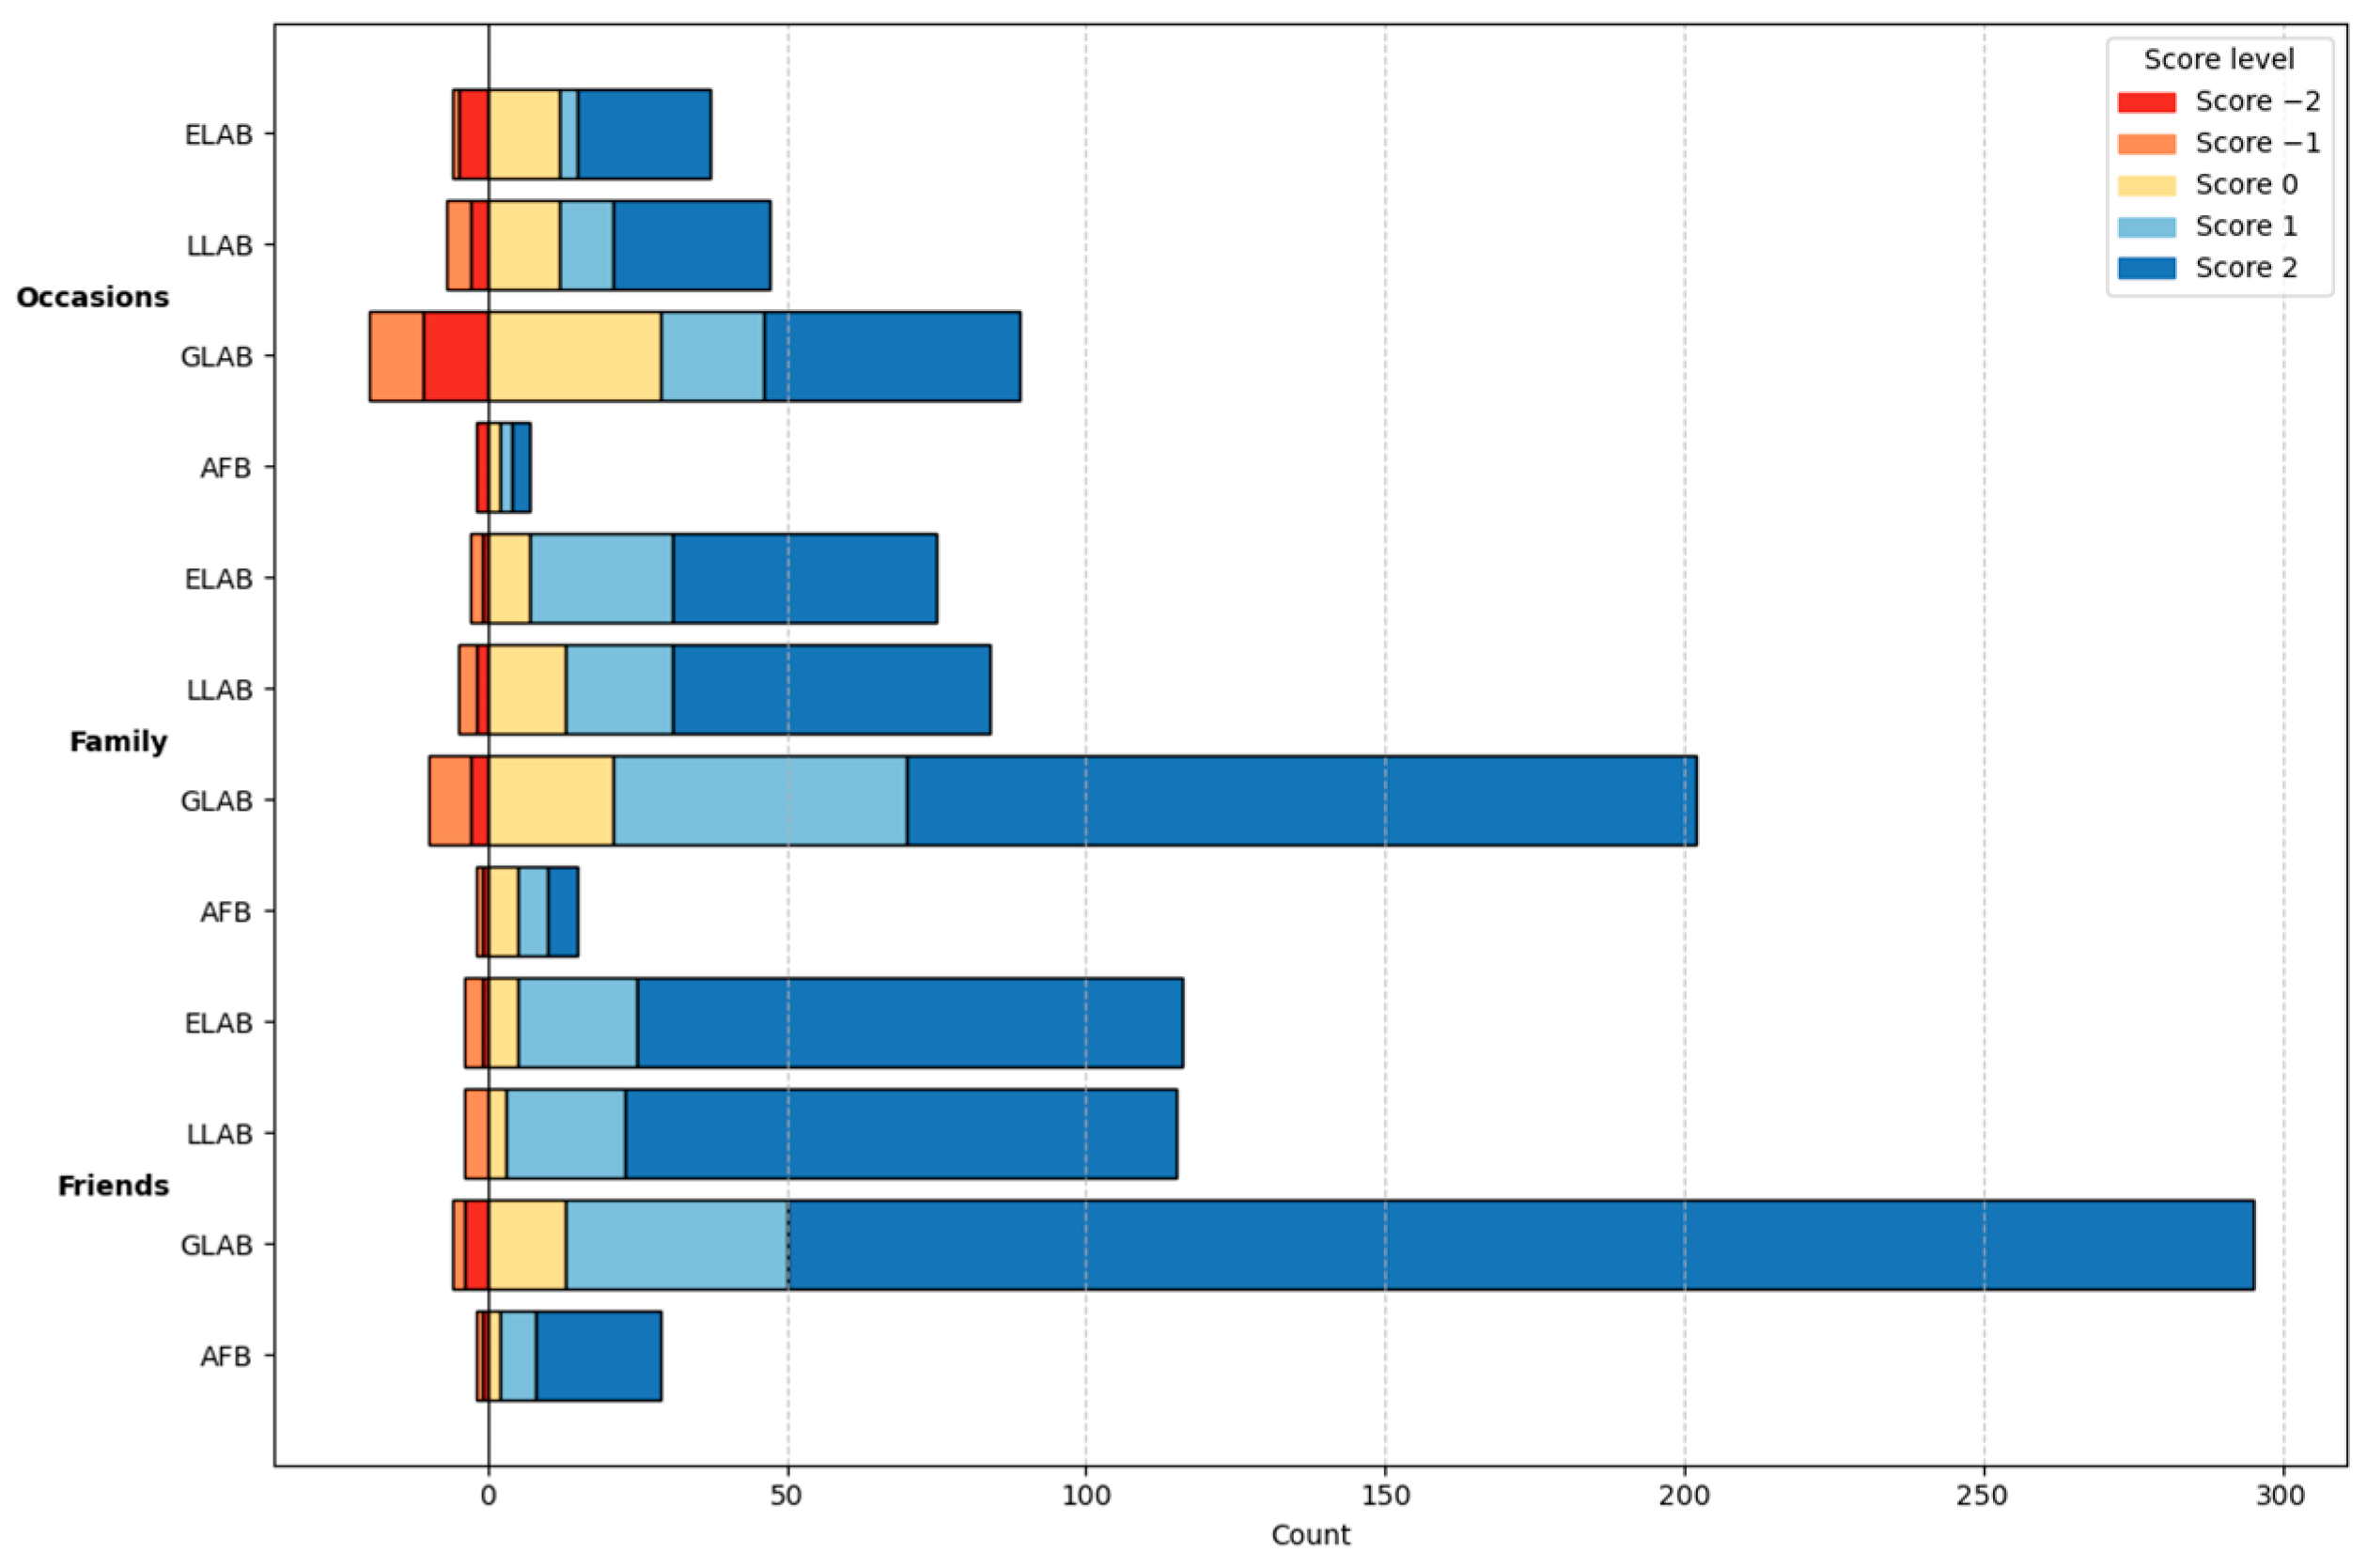
The consumption intention was assessed to determine whether beer selection is influenced by the context of consumption. Figure 4 illustrates the preferred beer types in relation to different consumption contexts.
The distribution of responses shown in Figure 4 indicates that the evaluated beer samples were associated differently with the three consumption contexts (friends, family, and occasions). The flavored low-alcohol beers, particularly GLAB, received substantially more positive responses in these contexts than the unflavored alcohol-free beer (AFB). These findings provide descriptive evidence that consumption context is associated with differences in the perceived suitability of the evaluated beer samples. Previous research has also shown that motivations for beer consumption are closely linked to context, with conventional alcoholic beer typically associated with informal social occasions. In contrast, non-alcoholic beer has been reported as a suitable choice in situations where alcohol consumption is not appropriate [27]. Previous research has indicated that beer purchase preferences among men may be influenced by previous experiences and recommendations from friends [28]. In this regard, repeated exposure to non-alcoholic beer through tasting experiences may represent one possible approach to reducing negative perceptions and improving acceptance of this category. Research on changes in drinking behavior among university students further highlights the importance of consumption context. Although some studies reported an overall increase in alcohol consumption during the pandemic, university students exhibited a different pattern, characterized by a decrease in drinking frequency. This shift has been attributed to reduced social interaction, limited access to on-campus activities, and fewer opportunities to consume alcohol in public venues. At the same time, students spent more time in family environments and adopted more health-conscious habits. A decrease in drinking frequency was observed among college students, but not among non-college peers [29]. Graupensperger et al., 2021 reported decreases in alcohol use among USA students [30]. With several lockdowns, students distanced from campus and peers spent less time in restaurants and became more health-conscious [31]. Jackson et al., 2021, showed in their study that changes in drinking among college student drinkers were attributable to changes in context, particularly a shift away from heavy drinking with peers to lighter drinking with family [32].
These findings from previous research suggest that increasing the availability and visibility of low- and non-alcoholic beers in social and public environments may support changes in drinking habits among young adults.
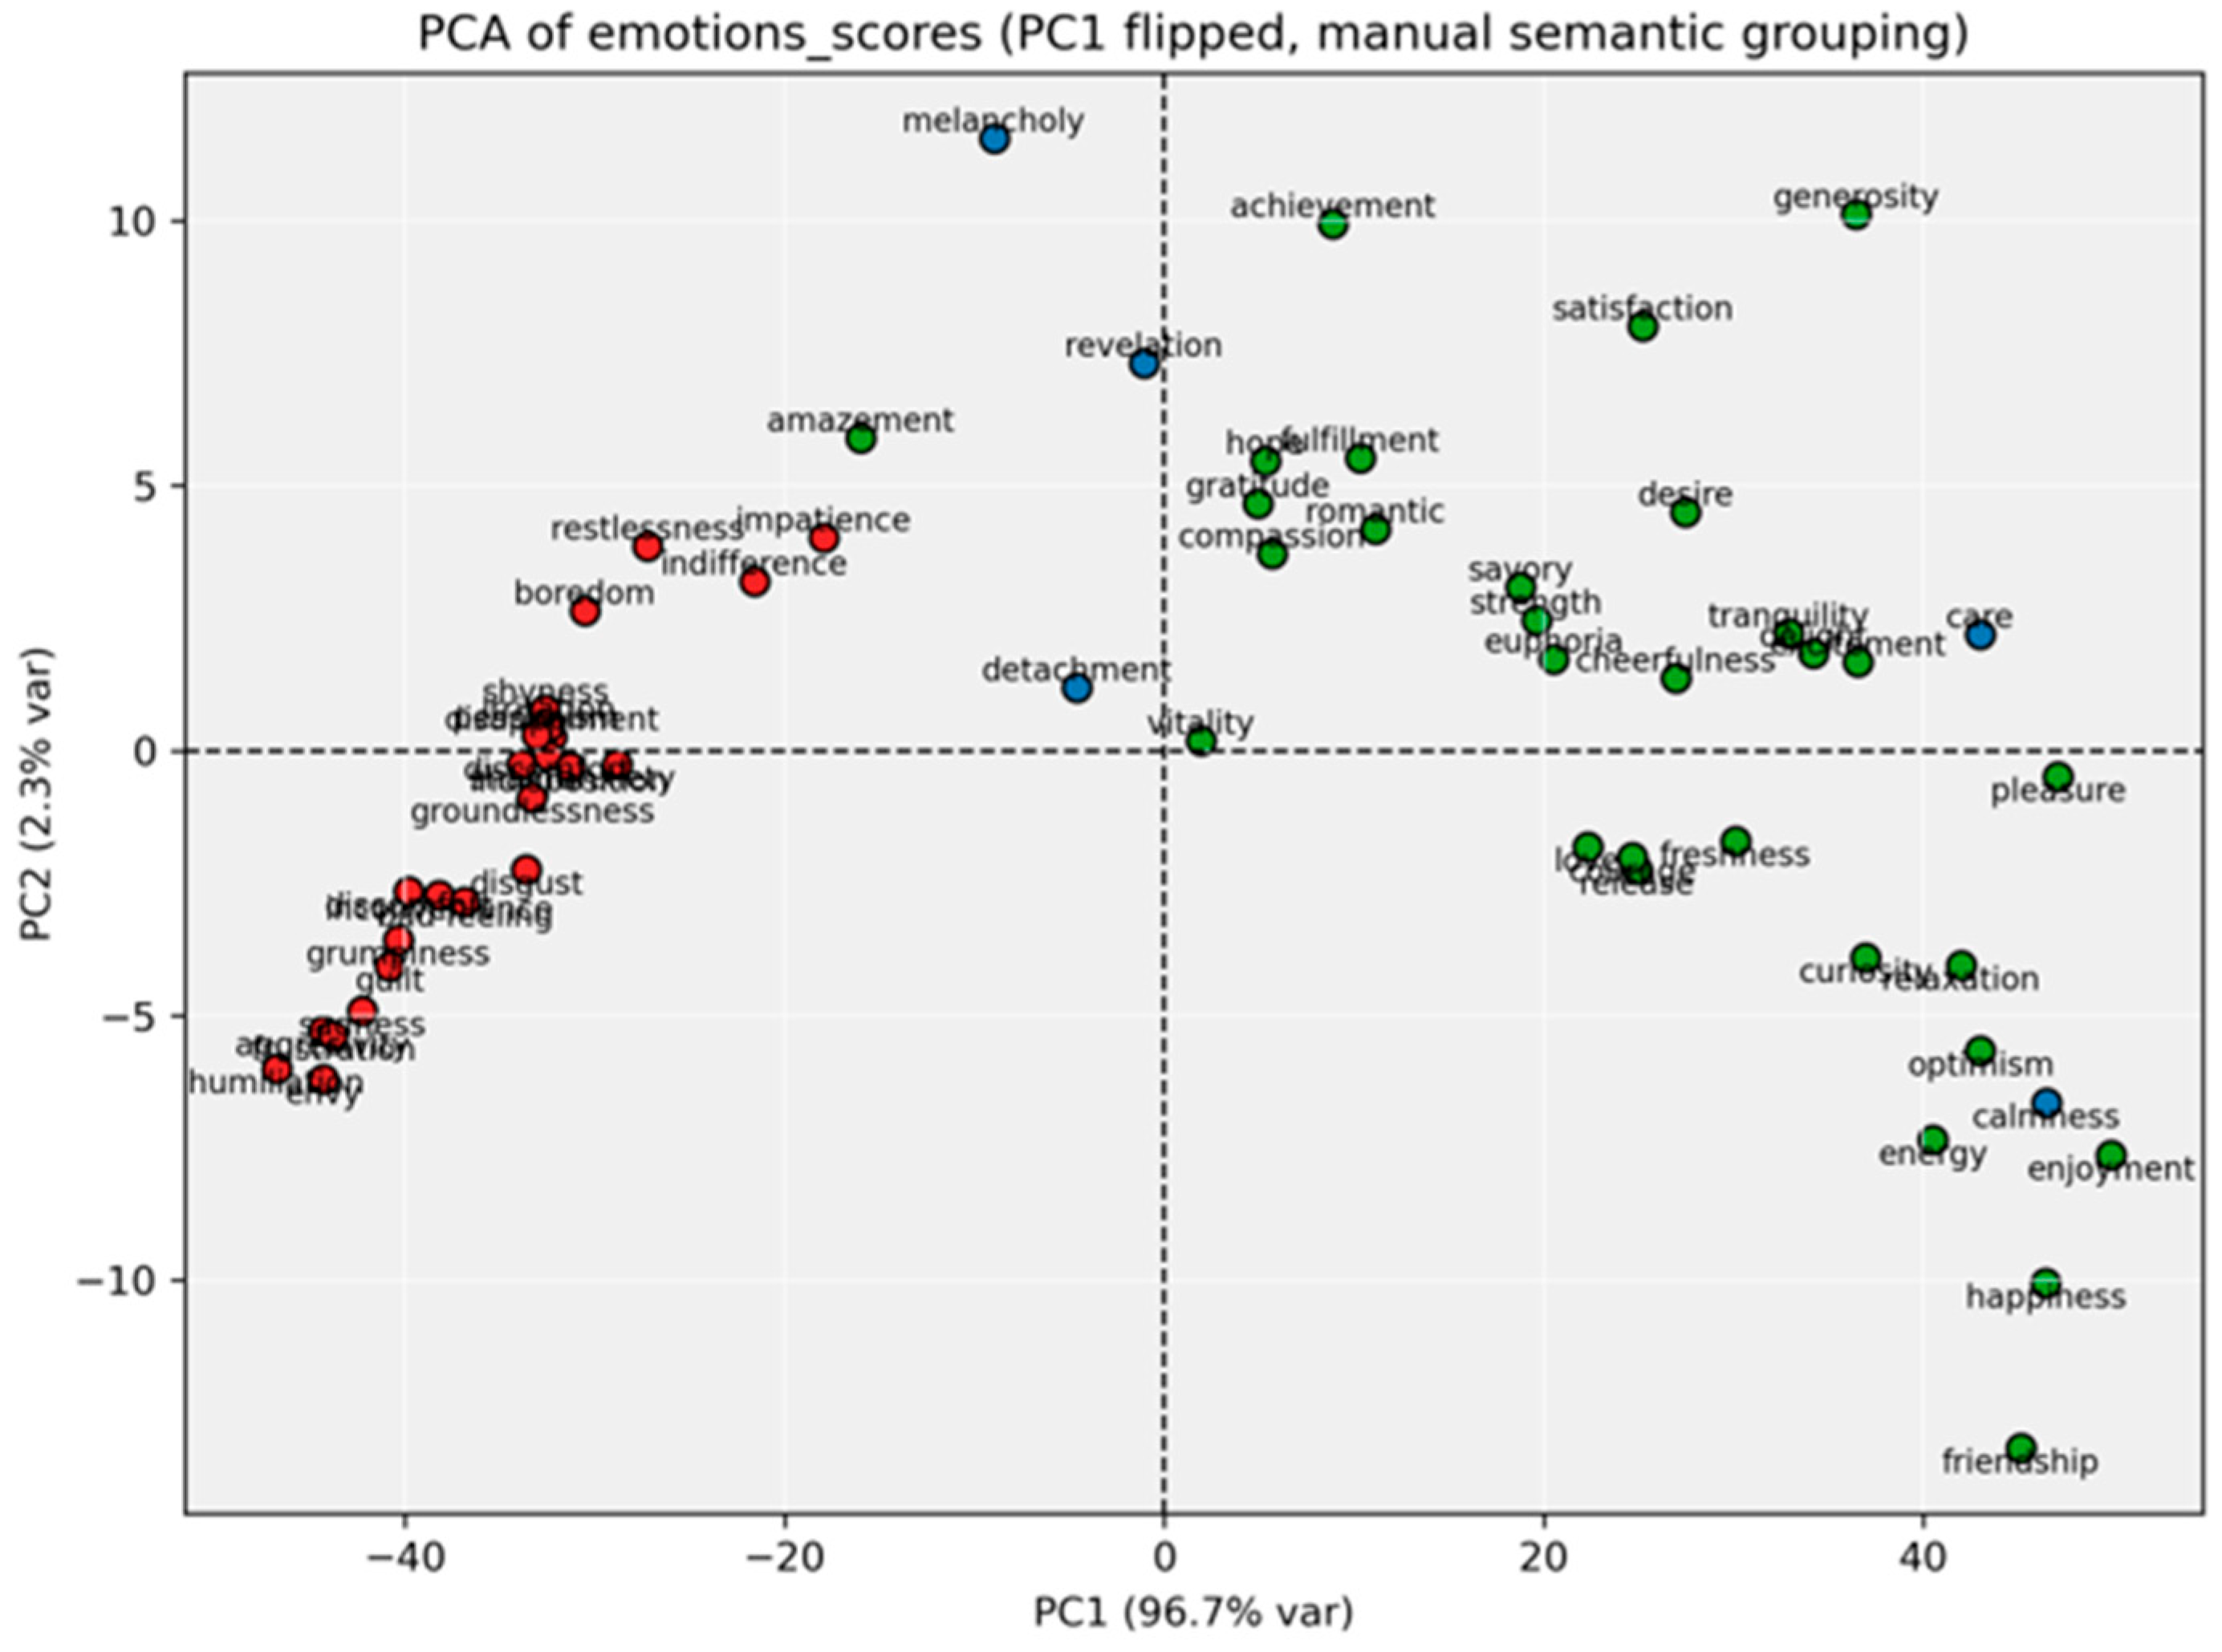
The choice to consume low- and non-alcoholic beer may also be influenced by the desire for alternative sensory experiences, as well as by the social environment [33]. However, due to the technological processes used for alcohol removal described in detail in a previous study [7], the sensory attributes of non-alcoholic beers—especially alcohol-free beers—are often perceived differently compared to their alcoholic counterparts. In the absence of additional flavor-enhancing ingredients, these products are sometimes described as having a weaker, more diluted aroma [34] and a predominantly bitter taste. Nevertheless, contemporary consumers are increasingly seeking novel and complex sensory experiences, which creates opportunities for improving and diversifying the flavor profiles of non-alcoholic beer [35]. Emotional profiling revealed a predominance of positive affective responses. The most frequently selected emotional attributes were cheerfulness, happiness, friendship, calmness, and relaxation.
A secondary dimension is associated with arousal or intensity. Negative emotional responses were considerably less frequent (Figure 5). Attributes such as agitation, boredom, disappointment, irritation, and discomfort were selected substantially less often than positive emotional descriptors.
These findings support the hypothesis that LNAB consumption is primarily associated with positive emotional states, particularly in social contexts. Taken together, the sensory, contextual and emotional findings indicate that consumer acceptance of non-alcoholic beers depends on the combined action of multiple factors rather than on a single sensory characteristic. This integrated perspective may facilitate the development of products that better match young consumers’ expectations.
As a limitation of this specific part of the paper, one states that the archived emotional dataset preserved participant-level emotional responses but did not retain beer-specific emotional contingency counts for all emotional attributes. Therefore, emotional frequencies could be reconstructed and verified, whereas a complete emotion-by-beer correspondence analysis could not be reproduced retrospectively.
Similar evidence has been reported by Staub et al., 2022, who reported that drinking NAB is associated with being health-conscious, rational, disciplined, strong, satisfied, and relaxed [33]. Another study reported that drinking NAB was associated with neutral to negative terms, such as consciousness, disappointment, or responsibility [13]. Recent studies show the stereotype of a person who consumes NAB may be more positive than the perception of NAB in earlier studies. Changes in consumers’ attitudes toward free-alcoholic beers were also reported by Muller et al., 2021 [21]. Consumers like the beer flavor, but not the associated risk of inebriation and losing control. The findings of Smeets and Graaf, 2019, suggest that in regular consumers, beer flavor, rather than the presence of alcohol, is the main driver of the consumption experience [36]. Thus, low- and non-alcoholic beers may act as substitutes, becoming more and more attractive to people.
The emotions evoked by the food and beverages can give an insight into consumers’ liking/disliking reasons [37]. This might be due to the fact that people consume beverages, especially alcoholic drinks, to make certain feelings duller or more intense [38]. Beverages are culture-specific and their study provides insight into the culture’s distinctiveness [39]. The emotions are not static and are highly impacted by mood and environment (or context). Therefore, a consumer’s emotional response needs to be investigated to determine if it is consistent within different contexts [40], and among consumers from different cultural backgrounds [41].
Not only does the drink itself have a high impact on the emotional response. Unlike eating, drinking always involves direct contact of the consumer with the drinking container (mug, cup, bottle, etc.), which can highly impact the drinking perception [42]. Therefore, to enhance the multisensory experience of a drink, researchers are often focusing also on optimizing the sensory and conceptual properties of the drinking vessel. Moreover, previous findings a revealed that a beer bottle pouring sound helped suppress some of the negativity that is commonly associated with the experience of an NAB. Based on their findings, brand marketers could involve beer packaging sounds as part of their virtual shopping environments [43].

3.3. Limitations

Several important limitations must be acknowledged, as they have direct implications for the interpretation and robustness of the findings.
First, the study relies on a relatively homogeneous sample composed exclusively of university students. This narrow demographic scope introduces a limitation in terms of external validity. Emotional responses to non-alcoholic beer are likely to differ across age groups, cultural contexts, and levels of consumption experience, meaning that the present findings cannot be confidently generalized beyond this specific population. Furthermore, university students generally represent a relatively well-educated population that tends to be more health-conscious and more aware of the risks associated with excessive alcohol consumption [44]. Consequently, their attitudes toward non-alcoholic beer may differ from those of the general population, potentially leading to higher acceptance of these products. Second, the unequal gender distribution may affect the robustness of the study. Finally, the study is limited by missing values in several sensory variables, which hinders accurate statistical analysis. Taken together, these limitations suggest that the findings should be interpreted as exploratory rather than confirmatory. Future research should include participants from multiple universities, broader age groups, and different socio-cultural settings. Including individuals with diverse educational backgrounds and health-related attitudes would also improve the external validity of the findings. Longitudinal studies and complementary analytical approaches would further help validate the present results and assess their generalizability across different consumer populations.

3.4. Implications for Industry

The findings have important implications for beverage producers. As observed throughout the paper, flavor enhancement is critical for improving LNAB acceptance. Fruity and aromatic profiles should be prioritized in product development while visual attributes (clarity and foam) remain relevant but secondary. Marketing strategies should emphasize sensory experience rather than alcohol content reduction.
Moreover, the strong association between LNAB consumption and positive emotions suggests that these products can be effectively positioned as healthy yet enjoyable alternatives to traditional alcoholic beverages.

4. Conclusions

This study investigated the sensory acceptance, emotional responses, and consumption context associated with low- and non-alcoholic beers among Romanian university students. Flavored low-alcohol beers, particularly the grapefruit-flavored sample, achieved the highest consumer acceptance, demonstrating that aroma, fruity flavor, clarity, and beer foam are the principal drivers of preference. Gender-related differences were generally small, while LNAB consumption was mainly associated with positive emotions and social drinking occasions. These findings indicate that successful development of non-alcoholic beers should combine sensory optimization with emotional engagement and consideration of the social context of consumption. Such an integrated approach may improve consumer acceptance of lower-alcohol alternatives and contribute to public health strategies aimed at reducing alcohol consumption among young adults. The study was conducted on a relatively homogeneous sample of students from a single university; therefore, future research should include more diverse populations and compare emotional responses toward alcoholic and non-alcoholic beers to further improve the understanding of consumer acceptance.

Author Contributions

Conceptualization, L.C.S. and A.U.; methodology, L.C.S.; software, A.F. and A.U.; investigation, survey instrument, data collection, and validation, L.C.S.; graphic design, A.F. and A.U.; writing—original draft preparation, L.C.S. and A.U.; writing—review and editing, A.F., L.C.S. and A.U.; funding acquisition, L.C.S. and A.U. All authors have read and agreed to the published version of the manuscript.

Funding

This research was funded by the European Foundation for Alcohol Research (ERAB), Belgium, project number Ref EA 15 45.

Institutional Review Board Statement

The study was conducted in accordance with the Declaration of Helsinki and was approved by the Ethical Committee of the University of Agricultural Sciences and Veterinary Medicine Cluj-Napoca, Romania (approval granted on 16 December 2015) for the research project “A study on young drinking behavior—evaluation the relationship between taste reactivity and special beer consumption” (ERAB Grant Ref. EA 15 45).

Informed Consent Statement

Informed consent was obtained from all subjects involved in the study.

Data Availability Statement

The data presented in this study are available from the corresponding author upon reasonable request. The data are not publicly available due to ethical and privacy restrictions related to participant confidentiality.

Acknowledgments

This work was supported by a grant of the Ministry of Research, Innovation and Digitization, CNCS—UEFISCDI, project number PN-III-P1-1.1-PD-2021-0093, within PNCDI III, awarded to Alina Uifălean.

Conflicts of Interest

The authors declare no conflicts of interest.

References

  1. Holmes, J.; Fairbrother, H.; Livingston, M.; Meier, P.S.; Oldham, M.; Pennay, A.; Whitaker, V. Youth Drinking in Decline: What Are the Implications for Public Health, Public Policy and Public Debate? Int. J. Drug Policy 2022, 102, 103606. [Google Scholar] [CrossRef] [Scilit] [PubMed]
  2. Herrero-Montes, M.; Alonso-Blanco, C.; Paz-Zulueta, M.; Pellico-López, A.; Ruiz-Azcona, L.; Sarabia-Cobo, C.; Boixadera-Planas, E.; Parás-Bravo, P. Excessive Alcohol Consumption and Binge Drinking in College Students. PeerJ 2022, 10, e13368. [Google Scholar] [CrossRef] [Scilit] [PubMed]
  3. Gohari, M.R.; Varatharajan, T.; MacKillop, J.; Leatherdale, S.T. Examining the Impact of the COVID-19 Pandemic on Youth Alcohol Consumption: Longitudinal Changes From Pre-to Intra-Pandemic Drinking in the COMPASS Study. J. Adolesc. Health 2022, 71, 665–672. [Google Scholar] [CrossRef] [Scilit] [PubMed]
  4. Acharya, B.; Dhakal, C. Risky Health Behaviors during the COVID-19 Pandemic: Evidence from the Expenditures on Alcohol, Non-Alcoholic Beverages, and Tobacco Products. PLoS ONE 2022, 17, e0268068. [Google Scholar] [CrossRef] [Scilit] [PubMed]
  5. Năsui, B.A.; Ungur, R.A.; Talaba, P.; Varlas, V.N.; Ciuciuc, N.; Silaghi, C.A.; Silaghi, H.; Opre, D.; Pop, A.L. Is Alcohol Consumption Related to Lifestyle Factors in Romanian University Students? Int. J. Environ. Res. Public Health 2021, 18, 1835. [Google Scholar] [CrossRef] [Scilit] [PubMed]
  6. Anderson, P.; Kokole, D.; Llopis, E.J. Production, Consumption, and Potential Public Health Impact of Low-and No-Alcohol Products: Results of a Scoping Review. Nutrients 2021, 13, 3153. [Google Scholar] [CrossRef] [Scilit] [PubMed]
  7. Salanță, L.C.; Coldea, T.E.; Ignat, M.V.; Pop, C.R.; Tofană, M.; Mudura, E.; Borșa, A.; Pasqualone, A.; Zhao, H. Non-Alcoholic and Craft Beer Production and Challenges. Processes 2020, 8, 1382. [Google Scholar] [CrossRef] [Scilit]
  8. Salanță, L.C.; Coldea, T.E.; Ignat, M.V.; Pop, C.R.; Tofană, M.; Mudura, E.; Borșa, A.; Pasqualone, A.; Anjos, O.; Zhao, H. Functionality of Special Beer Processes and Potential Health Benefits. Processes 2020, 8, 1613. [Google Scholar] [CrossRef] [Scilit]
  9. Nardini, M.; Garaguso, I. Characterization of Bioactive Compounds and Antioxidant Activity of Fruit Beers. Food Chem. 2020, 305, 125437. [Google Scholar] [CrossRef] [Scilit] [PubMed]
  10. Ramsey, I.; Yang, Q.; Fisk, I.; Ford, R. Understanding the Sensory and Physicochemical Differences between Commercially Produced Non-Alcoholic Lagers, and Their Influence on Consumer Liking. Food Chem. X 2021, 9, 100114. [Google Scholar] [CrossRef] [Scilit] [PubMed]
  11. Durga Prasad, C.G. Influence of Pichia Myanmarensis in Fermentation to Produce Quinoa Based Non-Alcoholic Beer with Enhanced Antioxidant Activity. J. Cereal Sci. 2022, 103, 103390. [Google Scholar] [CrossRef] [Scilit]
  12. Silva, A.P.; Jager, G.; van Bommel, R.; van Zyl, H.; Voss, H.P.; Hogg, T.; Pintado, M.; de Graaf, C. Functional or Emotional? How Dutch and Portuguese Conceptualise Beer, Wine and Non-Alcoholic Beer Consumption. Food Qual. Prefer 2016, 49, 54–65. [Google Scholar] [CrossRef] [Scilit]
  13. Calvo-Porral, C.; Rivaroli, S.; Orosa-González, J. The Asymmetric Emotional Associations to Beverages: An Approach through the Theory of Positive Asymmetry. Foods 2021, 10, 794. [Google Scholar] [CrossRef] [Scilit] [PubMed]
  14. Wright, C.A.; Bruhn, C.M.; Heymann, H.; Bamforth, C.W. Beer and Wine Consumers’ Perceptions of the Nutritional Value of Alcoholic and Nonalcoholic Beverages. J. Food Sci. 2008, 73, H8–H11. [Google Scholar] [CrossRef] [Scilit] [PubMed]
  15. Jimborean, M.A.; Salanță, L.C.; Trusek, A.; Pop, C.R.; Tofană, M.; Mudura, E.; Coldea, T.E.; Farcaș, A.; Ilieș, M.; Pașca, S.; et al. Drinking Behavior, Taste Preferences and Special Beer Perception among Romanian University Students: A Qualitative Assessment Research. Int. J. Environ.Res. Public Health 2021, 18, 3307. [Google Scholar] [CrossRef] [Scilit] [PubMed]
  16. Crevar, M.; Esterman, A.; Corsi, A.M.; Waye, V.; Ireland, C. Consumers’ Attitudes and Preferences Towards Ingredients List, Nutrition Information and Health Warning Labelling on Alcohol Products: A Scoping Review. Curr. Nutr. Rep. 2026, 15, 62. [Google Scholar] [CrossRef] [Scilit] [PubMed]
  17. Kalva, J.J.; Sims, C.A.; Puentes, L.A.; Snyder, D.J.; Bartoshuk, L.M. Comparison of the Hedonic General Labeled Magnitude Scale with the Hedonic 9-Point Scale. J. Food Sci. 2014, 79, S238–S245. [Google Scholar] [CrossRef] [Scilit] [PubMed]
  18. Wichchukit, S.; O’Mahony, M. The 9-Point Hedonic Scale and Hedonic Ranking in Food Science: Some Reappraisals and Alternatives. J. Sci. Food Agric. 2015, 95, 2167–2178. [Google Scholar] [CrossRef] [Scilit] [PubMed]
  19. Weerawarna N.R.P., M.; Godfrey, A.J.R.; Loudon, M.; Foster, M.; Hort, J. Comparing Traditional Check-All-That-Apply (CATA) and Implicit Response Time Go/No-Go Approaches for Profiling Consumer Emotional Response When Tasting Food. Food Qual. Prefer 2023, 112, 105027. [Google Scholar] [CrossRef] [Scilit]
  20. Belović, M.; Pezo, L.; Radivojević, G.; Penić, M.; Lazarević, J.; Filipčev, B.; Čakar, U.; Vitas, J.; Cvetković, B. Relationship Between Knowledge, Attitudes, and Practices for the Consumption of Spirulina-Enriched Fruit and Vegetable Juices: Structural Equation Modelling and Consumers’ Preference Evaluation Approach. Nutrients 2026, 18, 1309. [Google Scholar] [CrossRef] [Scilit] [PubMed]
  21. Müller, M.; Gastl, M.; Becker, T. Key Constituents, Flavour Profiles and Specific Sensory Evaluation of Wheat Style Non-Alcoholic Beers Depending on Their Production Method. J. Inst. Brew. 2021, 127, 350–370. [Google Scholar] [CrossRef] [Scilit]
  22. Yang, Q.; Tu, J.; Chen, M.; Gong, X. Discrimination of Fruit Beer Based on Fingerprints by Static Headspace-Gas Chromatography-Ion Mobility Spectrometry. J. Am. Soc. Brew. Chem. 2022, 80, 298–304. [Google Scholar] [CrossRef] [Scilit]
  23. Bonnaffoux, H.; Roland, A.; Schneider, R.; Cavelier, F. Spotlight on Release Mechanisms of Volatile Thiols in Beverages. Food Chem. 2021, 339, 127628. [Google Scholar] [CrossRef] [Scilit] [PubMed]
  24. Van Doorn, G.; Timora, J.; Watson, S.; Moore, C.; Spence, C. The Visual Appearance of Beer: A Review Concerning Visually-Determined Expectations and Their Consequences for Perception. Food Res. Int. 2019, 126, 108661. [Google Scholar] [CrossRef] [Scilit] [PubMed]
  25. Muggah, E.M.; McSweeney, M.B. Females’ Attitude and Preference for Beer: A Conjoint Analysis Study. Int. J. Food Sci. Technol. 2017, 52, 808–816. [Google Scholar] [CrossRef] [Scilit]
  26. Labbe, D.; Almiron-Roig, E.; Hudry, J.; Leathwood, P.; Schifferstein, H.N.J.; Martin, N. Sensory Basis of Refreshing Perception: Role of Psychophysiological Factors and Food Experience. Physiol. Behav. 2009, 98, 1–9. [Google Scholar] [CrossRef] [Scilit] [PubMed]
  27. Silva, A.P.; Jager, G.; Van Zyl, H.; Voss, H.P.; Pintado, M.; Hogg, T.; De Graaf, C. Cheers, Proost, Saúde: Cultural, Contextual and Psychological Factors of Wine and Beer Consumption in Portugal and in the Netherlands. Crit. Rev. Food Sci. Nutr. 2017, 57, 1340–1349. [Google Scholar] [CrossRef] [Scilit] [PubMed]
  28. Lazzari, A.; Barbosa, H.D.; Filho, E.R.M.; Dada, A.P.; Saraiva, B.R.; Matumoto-Pintro, P.T. Gender Behavior and Influence in Acceptability of Beers Produced with Rubim and Mastruz. J. Sens. Stud. 2022, 37, e12731. [Google Scholar] [CrossRef] [Scilit]
  29. Vera, B.D.V.; Carmona-Márquez, J.; Lozano-Rojas, Ó.M.; Parrado-González, A.; Vidal-Giné, C.; Pautassi, R.M.; Fernández-Calderón, F. Changes in Alcohol Use during the COVID-19 Pandemic among Young Adults: The Prospective Effect of Anxiety and Depression. J. Clin. Med. 2021, 10, 4468. [Google Scholar] [CrossRef] [Scilit] [PubMed]
  30. Graupensperger, S.; Jaffe, A.E.; Fleming, C.N.B.; Kilmer, J.R.; Lee, C.M.; Larimer, M.E. Changes in College Student Alcohol Use During the COVID-19 Pandemic: Are Perceived Drinking Norms Still Relevant? Emerg. Adulthood 2021, 9, 531–540. [Google Scholar] [CrossRef] [Scilit] [PubMed]
  31. Dragun, R.; Nika Veček, N.; Marendi´cmarendi´c, M.; Pribisali´c, A.P.; Ðivi´c, G.Ð.; Cena, H.; Polašek, O.; Kolči´c, I.K. Have Lifestyle Habits and Psychological Well-Being Changed among Adolescents and Medical Students Due to COVID-19 Lockdown in Croatia? Nutrients 2021, 13, 97. [Google Scholar] [CrossRef] [Scilit] [PubMed]
  32. Jackson, K.M.; Merrill, J.E.; Stevens, A.K.; Hayes, K.L.; White, H.R. Changes in Alcohol Use and Drinking Context Due to the COVID-19 Pandemic: A Multimethod Study of College Student Drinkers. Alcohol Clin. Exp. Res. 2021, 45, 752–764. [Google Scholar] [CrossRef] [Scilit] [PubMed]
  33. Staub, C.; Contiero, R.; Bosshart, N.; Siegrist, M.; Staub, C.; Contiero, R.; Bosshart, N. You Are What You Drink: Stereotypes about Consumers of Alcoholic and Non-Alcoholic Beer Rights / License: Creative Commons Attribution-NonCommercial-NoDerivatives 4.0 International You Are What You Drink: Stereotypes about Consumers of Alcoholic and Non-Alcoholic Beer. Food Qual. Prefer 2022, 101, 104633. [Google Scholar] [CrossRef]
  34. Borșa, A.; Muntean, M.V.; Salanță, L.C.; Tofană, M.; Socaci, S.A.; Mudura, E.; Pop, A.; Pop, C.R. Effects of Botanical Ingredients Addition on the Bioactive Compounds and Quality of Non-Alcoholic and Craft Beer. Plants 2022, 11, 1958. [Google Scholar] [CrossRef] [Scilit] [PubMed]
  35. Jaeger, S.R.; Worch, T.; Phelps, T.; Jin, D.; Cardello, A.V. Preference Segments among Declared Craft Beer Drinkers: Perceptual, Attitudinal and Behavioral Responses Underlying Craft-Style vs. Traditional-Style Flavor Preferences. Food Qual. Prefer 2020, 82, 103884. [Google Scholar] [CrossRef] [Scilit]
  36. Smeets, P.A.M.; De Graaf, C. Brain Responses to Anticipation and Consumption of Beer with and without Alcohol. Chem. Senses 2019, 44, 51–60. [Google Scholar] [CrossRef] [Scilit] [PubMed]
  37. Yang, Q.; Dorado, R.; Chaya, C.; Hort, J. The Impact of PROP and Thermal Taster Status on the Emotional Response to Beer. Food Qual. Prefer 2018, 68, 420–430. [Google Scholar] [CrossRef] [Scilit]
  38. Panagiotou, M.; Gkatzionis, K. Lexicon Development to Measure Emotions Evoked by Foods: A Review. Meas. Food 2022, 7, 100054. [Google Scholar] [CrossRef] [Scilit]
  39. Suter, R.; Miller, C.; Gill, T.; Coveney, J. The Bitter and the Sweet: A Cultural Comparison of Non-Alcoholic Beverage Consumption in Japan and Australia. Food Cult. Soc. 2020, 23, 334–346. [Google Scholar] [CrossRef] [Scilit]
  40. Nijman, M.; Yang, Q.; Hidrio, C.; Ford, R. The Stability of Self-Reported Emotional Response and Liking of Beer in Context. Food Qual. Prefer 2022, 100, 104603. [Google Scholar] [CrossRef] [Scilit]
  41. Viejo, C.G.; Villarreal-Lara, R.; Torrico, D.D.; Rodríguez-Velazco, Y.G.; Escobedo-Avellaneda, Z.; Ramos-Parra, P.A.; Mandal, R.; Singh, A.P.; Hernández-Brenes, C.; Fuentes, S. Beer and Consumer Response Using Biometrics: Associations Assessment of Beer Compounds and Elicited Emotions. Foods 2020, 9, 821. [Google Scholar] [CrossRef] [Scilit] [PubMed]
  42. Spence, C.; Wan, X. Beverage Perception and Consumption: The Influence of the Container on the Perception of the Contents. Food Qual. Prefer 2015, 39, 131–140. [Google Scholar] [CrossRef] [Scilit]
  43. Rodríguez, B.; Arroyo, C.; Reyes, L.H.; Reinoso-Carvalho, F. Promoting Healthier Drinking Habits: Using Sound to Encourage the Choice for Non-Alcoholic Beers in E-Commerce. Foods 2021, 10, 2063. [Google Scholar] [CrossRef] [Scilit] [PubMed]
  44. Salanţă, L.-C.; Tofană, M.; Pop, C.R.; Pop, A.; Coldea, T.; Mihai, M. Risk Factors Associated with Alcohol Consumption Among Romanian University Students-Preliminary Research. Bull. UASVM Food Sci. Technol. 2018, 75, 86–89. [Google Scholar] [CrossRef] [Scilit] [PubMed]
Figure 1. A hierarchical heatmap displaying the associations between beer samples and the sensory attributes that received the highest scores (represented in dark blue) and the ones receiving the lowest scores (represented in light yellow). The lines indicate the hierarchical clustering of the beer samples according to their sensory profiles. AFB = Alcohol-free beer; ELAB = Elderflower low-alcohol beer; GLAB = Grapefruit low-alcohol beer; LLAB = Lemon low-alcohol beer.
Beverages 12 00096 g001
Figure 2. Mean sensory attribute profiles of beer samples by gender. The arabic numerals appearing on the chart represent the collected scores assigned by both men and women to all the beers during the tasting.
Beverages 12 00096 g002
Figure 3. Differences in sensory perception between male and female participants across beer samples. Bars represent mean hedonic scores (9-point scale), with error bars indicating 99% confidence intervals. Asterisks denote statistically significant gender differences within each beer type (* p < 0.05, ** p < 0.001; Mann–Whitney U test)”.
Beverages 12 00096 g003
Figure 4. The preferred beer type and consumption context reported by university students.
Beverages 12 00096 g004
Figure 5. Principal component analysis for the positive, negative, and neutral emotions associated with LNAB consumption. Green = positive emotions, Red = negative emotion, Blue = neutral emotions.
Beverages 12 00096 g005
Table 1. Questionnaire design.
Questionnaire Section Explanatory Variables
Sociodemographic characteristics: age, gender;
Sensory perception
(Hedonic test)
Sensory characteristics: visual (appearance, clarity, color, foam, smell, taste/mouthfeel (sweet, bitter, sour, refreshing, spicy, acidulated), aroma/flavor (fruity, caramel);
Preference test
(Single selection)
Preferred sample;
Consumption context
(Hedonic test)
Frequency and context of consumption: friends, family, special occasions;
Emotional responses (check-all-that-apply)Positive emotions: achievement, amazement, cheerfulness, compassion, courage, curiosity, delight, desire, energy, enjoyment, euphoria, excitement, freshness, friendship, fulfillment, generosity, gratitude, happiness, hope, love, optimism, pleasure, relaxation, release, romantic, satisfaction, savory, strength, tranquility, vitality;
Negative emotions: aggressivity, anxiety, bad feeling, boredom, disappointment, discomfort, disgust, envy, frustration, groundlessness, grumpiness, guilt, humiliation, impatience, inconvenience, indifference, indisposition, irritation, pessimism, restlessness, sadness, shame, shock, shyness;
Neutral emotion: calmness, care, detachment, melancholy, revelation;
Table 2. Description and nutritional characteristics of the beer samples based on the manufacturer’s product labels and official website.
Beer
Samples
Samples CodificationManufacturer-Provided Product DescriptionABV%Nutritional Value
/100 mL
Alcohol-free beerAFBLight texture, bitter hop aroma, malt taste, medium carbonation, white foam0.022 kcal
5.1 g carbohydrates, of which less than 2.81 g sugars, less than 0.3 g protein
Grapefruit low-alcohol beerGLABPink-peach color, grapefruit juice flavor, sweet taste, carbonated, low foam1.929 kcal
6.5 g carbohydrates, of which 6 g sugars, 0.5 g fibers, 0.5 g protein,
less than 0.1 g salt
Lemon low-alcohol beerLLABPale yellow, lemon flavored and a hint of bitterness, fresh drink, lemonade taste, well carbonated, thin white foam
Elderflower low-alcohol beerELABLight yellow liquid, aromas of elderflower and tea, sweet taste, carbonated, white foam
Note: Manufacturer-provided product descriptions were obtained from the respective product labels and the manufacturer’s official website. Nutritional values and alcohol by volume (ABV) were taken directly from the product labels and were not independently calculated or analytically determined in the present study. Declared energy values were reported as provided by the manufacturer and were not recalculated from the listed macronutrients or adjusted for alcohol-derived energy.
Disclaimer/Publisher’s Note: The statements, opinions and data contained in all publications are solely those of the individual author(s) and contributor(s) and not of MDPI and/or the editor(s). MDPI and/or the editor(s) disclaim responsibility for any injury to people or property resulting from any ideas, methods, instructions or products referred to in the content.