Article

Assessment of Florida Blueberry Wine Packaged in Glass Bottles, Cans, and Plastic Bottles Throughout Accelerated Shelf-Life Testing

by
Nicholas A. Wendrick
1,
Sofia Torres
1,
Drew Budner
2,
Boce Zhang
1,
Andrew J. MacIntosh
1 and
Katherine A. Thompson-Witrick
1,*
1
Department of Food Science and Human Nutrition, University of Florida, Gainesville, FL 32611, USA
2
Department of Chemistry, Coastal Carolina University, Conway, SC 29528, USA
*
Author to whom correspondence should be addressed.
Beverages 2026, 12(6), 64; https://doi.org/10.3390/beverages12060064
Submission received: 17 March 2026 / Revised: 12 May 2026 / Accepted: 18 May 2026 / Published: 22 May 2026

Abstract

For thousands of years glass packaging for wine has traditionally been associated with quality and remains used today as an inert and recyclable container. However, alternative containers such as aluminum cans and polyethylene terephthalate (PET) bottles have been gaining traction over the last several years because of their lower cost, increased recyclability, and increasing consumer acceptance. Advancements in can-liner technology further support aluminum cans as a realistic option for wineries; however, data on how different packaging types influence the quality of packaged wine remains sparse. This study evaluated the physiochemical properties of carbonated blueberry wine stored in glass bottles, aluminum cans, and polyethylene terephthalate (PET) bottles under accelerated conditions (35 °C). Across the three packaging types, the wine quality parameters of total acidity, sugar, and pH did not differ significantly. There were, however, measurable statistical differences that emerged in color, anthocyanin content, and volatile organic compound (VOC) profiles. Pearson’s correlation analysis revealed a strong linear relationship between the degradation of color (intensity and hue) and anthocyanin concentration over time for all packaging types, with the loss being dependent upon packaging type. These findings indicate that while certain quality attributes vary with container, the overall chemical changes in blueberry wine are comparable across glass, aluminum, and PET bottles. Consequently, aluminum can packaging stands as a viable, cost-effective alternative packaging for blueberry wine producers.

1. Introduction

Blueberries have a unique flavor profile but a short shelf life, which has complicated their use in food products, resulting in significant post-harvest losses. The short shelf life has increased the popularity of processing for preservation to increase variability in the market; this includes the production of blueberry jams, baked goods, juices, and wine [1,2]. Blueberry wine is a fruit-based alcoholic beverage that is produced by pressing the fruit to extract the juice, then fermenting with the skins and seeds [3]. The inclusion of the skins and seeds is important for introducing anthocyanins, tannins, and phenolic acids. The majority of anthocyanins are present in the skins, while seeds contain most of the tannins and phenolic acids. These compounds are extracted into the wine to contribute color, taste, and aroma [3].
The quality of wine is mainly influenced by fruit variety, yeast strain, aroma, packaging, and production method [1,4]. Carbonation can further affect the sensory qualities of the wine as it has been found to improve the tactual perception, while providing a tangy taste and effervescence to fruit wines [5]. Carbonated wine is a type of wine where carbon dioxide is added either by generation from fermentation or by direct infusion [4]. Because of this, it is important to select the best packaging method for carbonated fruit wines to ensure the conservation of their quality.
The characteristic aroma compounds for blueberry include hexenal, hexenol, linalool, and geraniol [6]. Different blueberry cultivars have demonstrated variations in the compositions and quantities of the volatile compounds present. For example, lowbush blueberries typically produce more esters, while highbush blueberries generate mostly green leaf volatiles and terpene alcohols [6]. Another study that investigated volatile compounds in blueberry wine found that the esters and alcohols increased after fermentation [7]. Bottle-aged blueberry wines have also been found to have higher concentrations of ethyl ester and diethyl succinate when aged for 16 months [8]. Southern highbush blueberries usually ripen earlier than others since they need low chilling, increasing the market value during April and May [6].
Blueberry wine has potential health benefits due to its high content of antioxidants, including anthocyanins [1]. Anthocyanins in blueberries are not only important as a source of color; they can also inhibit the growth of foodborne pathogens [9]. Anthocyanin decomposition can occur due to factors such as light, oxygen, solvents, or enzymes. Decomposition can cause negative impacts on the color and the nutritional value of the wine, reducing product value [9].
The entire packaging system serves to protect the contents with the goal of ensuring a stable and consistent product. Some of the parameters that comprise overall package performance are light absorptivity, closure options, sealing performance, inner liner properties, headspace control, and oxygen permeability. Wine packaging plays a critical role in preserving wine quality by potentially limiting the transfer of gases, such as oxygen, which can deteriorate the wine and affect its sensory characteristics [10]. Glass bottles with cork closures remain the most commonly used wine packaging due to the “premium” appeal. The inert properties of glass protect against oxygen ingress that preserve flavor and stability over time [11]. However, glass bottles with cork closures can pose a risk of cork taint and are more expensive to produce and transport than alternatives. Other packaging methods, such as polyethylene terephthalate (PET) bottles, are also being used for wines since they are relatively inexpensive. PET bottles have higher oxygen permeability, which can lead to increased oxidation and shorter shelf-life stability. Another alternative option for wine packaging is aluminum cans with an interior coating that protects against the aluminum material reacting with the acidic pH and SO2 (sulfur dioxide) present in wine [11]. Aluminum cans are resistant to oxidation, do not produce a cork taint, protect against light, and are cheap to manufacture, which makes them a suitable option for packaging wine [11,12]. Additionally, when using cans, sealing performance and headspace control are important factors to maintain optimal product stability. When cans are packaged, they need internal pressurization (either CO2 or N2) to maintain stability and structural integrity. To assess the suitability of packaging types, accelerated shelf-life testing is often used to compare multiple parameters. Accelerated shelf-life testing is the storage of food, in this case wine, under controlled environments to accelerate the deterioration of the product to evaluate the stability of the product [12].
Beverages are complex mixtures of hundreds of chemical compounds that, when carefully balanced, create an appealing product. However, when that balance is disrupted by distortion and/or the removal of a compound(s), it results in an unbalanced aroma profile [13]. Flavor compounds are known to interact with the packaging material in which they are stored [14]. Flavor scalping is the transfer of flavor compounds from the product into the packaging or by flavor release, in which the package is released into the food product [14]. Flavor scalping is a concern for winemakers, especially when thinking about packaging their wine in something other than glass [11]. Historically, PET and other packaging types have negatively impacted the flavor and aroma of wine through flavor scalping, which is why the use of alternative packaging designs has been limited [10,11]. However, as can liners and other alternative packaging designs have improved, winemakers are becoming more open to alternative packaging types [11]. Fourier-transform infrared spectroscopy, also known as FTIR, is a non-destructive rapid test used to identify organic and inorganic compounds. It is commonly used for quality control, authentication, or the potential adulteration of food products such as edible oils and alcoholic beverages [14]. Researchers have used FTIR to analyze aluminum can liners to determine if changes have occurred to the liner itself, such as flavor scalping [14,15].
The chemical composition of wine can be impacted by the duration, storage temperature, and the type of package used [16]. As blueberry wine is a niche segment of the market, there is limited research on how different packaging materials affect its stability and composition. Previous studies, such as the one performed by Wendrick et al. (2021), found that carbonation enhances the likability and consumer purchase intent of blueberry wines [17]. The objective of this work was to examine the effects of three packaging methods on the chemical characteristics, including aroma compounds of carbonated blueberry wine, under accelerated shelf-life testing.

2. Materials and Methods

To assess the chemical characteristics of wine in glass, aluminum, and plastic containers, a 60-day accelerated shelf-life assessment was conducted with carbonated blueberry wine. At days 0, 30, and 60, the pH, titratable acidity (TA), ethanol, total solids, density, lining composition (FTIR), sulfites (total and free), color, total anthocyanin, and volatile organic compounds (GC-MS) were measured.

2.1. Materials

2.1.1. Glass Bottles

Clear, Champagne-style glass bottles (187 mL) were used in this experiment. Bottle dimensions and specifications are provided in Table 1. Each bottle was sealed with a #8 natural cork (4.45 cm) and a crown cap fitted with an oxygen-absorbing liner. Bottles were sourced from North Mountain Supply (Mildred, PA, USA), corks from LD Carlson (Kent, OH, USA), and crown caps from Newflager sold on Amazon (Seattle, WA, USA).

2.1.2. Cans

Aluminum cans were purchased from Envases (Waco, TX, USA). The cans were coated with an acrylic-based BPANI internal liner and were specified as 211/202 × 411. Dimensions are provided in Table 1. All cans were sealed using a standard double seam to ensure an airtight closure.

2.1.3. Plastic Bottles

Clear 375 mL polyethylene terephthalate (PET) bottles with screw-cap closures were used as a negative control. Bottles were sourced from Pellah Goods on Amazon (Seattle, WA, USA).

2.2. Wine

Approximately 55 L of finished blueberry wine was graciously donated from a local Florida winery. Briefly, frozen southern highbush blueberries from a mix of cultivars from the 2023 season were defrosted and then crushed. The must was adjusted to 19 °Brix and a pH of 3.44. The must was fermented with Lalvin EC1108 (Lallemand Inc., Montreal, QC, Canada) at 21 °C for 2 weeks. The fermentation finished at a specific gravity (SG) of 0.9923 and was then stabilized using sodium metabisulfite (Sigma Aldrich, St. Louis, MO, USA) at a concentration of 30 mg/L. The wine was racked off the lees and then clarified with bentonite. The wine was back-sweetened to an SG of 1.012 and then crossflow-filtered in the Fall of 2023. At the winery, 19 L glass carboys were first flushed with CO2 for 2 min; while CO2 continued flowing, the wine was directly filled until completely full and then sealed. The sealed carboys were transported to the University of Florida and then stored at 4 °C in a refrigerator until used.

2.3. Carbonation and Packaging

The finished wine was transferred to a pressure vessel and carbonated to 5.9 g of CO2 per liter of wine following the methods outlined by Wendrick et al. (2025) [15]. Briefly, cans and both bottle types were counter-pressure packaged by first pressurizing (~21 PSIg) with food-grade CO2 and then filling with wine to 187 mL for glass bottles, 355 mL for aluminum cans, and 380 mL for plastic bottles. After the package was filled, it was depressurized and immediately sealed. Glass bottles were sealed by hand using a cork and crown cap. The cans were sealed using a Dixie can seamer (Dixie Canner Co., Athens, GA, USA). The plastic bottles were sealed with the included screw cap.

2.4. Accelerated Methods

After packaging, each packaging type (glass bottles, aluminum cans, and plastic bottles) was placed in a sealed incubator set to 35 °C (accelerated temperature) to prevent the influence of light from affecting the wine. For the accelerated shelf-life study, the triplicate samples were analyzed at each separate time point (0, 30, and 60 days), producing 27 total packaged samples.

2.5. pH

pH was measured using a Thermo Scientific Orion Star A211 pH meter (Waltham, MA, USA). The pH meter was calibrated prior to use.

2.6. Titratable Acidity (TA)

Titratable acidity (TA) was determined by diluting 5 mL of wine with 125 mL of deionized water, followed by titrating with 0.1 N sodium hydroxide (NaOH) to an endpoint pH of 8.2. The pH meter was calibrated prior to analysis using standard buffer solutions at pH values of 2, 4, 7, and 10. Titratable acidity was calculated according to the equation provided below and expressed as grams of tartaric acid per liter of wine.
TA   ( g / L ) = V × N × e q u i v a l e n t   w e i g h t S a m p l e   V o l u m e × 100
where
  • V = volume NaOH (mL);
  • N = normality of NaOH (eq/L);
  • Equivalent weight for the acid quantified (i.e., 75 for tartaric acid).
  • Sample volume = volume of blueberry wine titrated (mL).

2.7. Assessment of Packaging Integrity

A Shimadzu IRAffinity-1S FTIR (Columbia, MD, USA) equipped with attenuated total reflectance (ATR) was used to analyze can liner materials at the beginning and end of both accelerated and ambient shelf-life studies. Following sample removal, each can and plastic bottle was rinsed three times with deionized water and stored at 4 °C until analysis. For spectral acquisition, a 2.5 cm × 2.5 cm section was excised from the center of each container and scanned over a wavenumber range of 400–4000 cm−1 at a resolution of 1 cm−1. Spectral analysis was conducted following the procedure of Zhang et al. (2011) with slight modifications [18]. Data processing included smoothing, second-derivative transformation, and spectral trimming, with no additional modifications applied [18].

2.8. Sulfites

The Ripper titration method was used for free and total SO2 analysis [19]. The accelerated free and total SO2 analyses were conducted at the Wine Analytical Lab at the FAMU Center for Viticulture and Small Fruit Research, in accordance with the International Standards of Wine Analysis.

2.9. Color

Wine color was assessed using the Glories method (1984), using a spectrophotometer with a 5 mm light path cuvette to determine color intensity (CI) and hue [20]. CI is determined by summing the absorbances at 420, 520, and 620 nm. Wine hue was measured by dividing the absorbance at 420 nm (yellow) by the absorbance at 520 nm (red), which correlates with wine aging.
Wine Hue = A420/A520
Wine Color Intensity = A420 + A520 + A620

2.10. Ethanol, Soluble Solids, and Specific Gravity (SG)

Alcohol by volume (ABV), soluble solids, and specific gravity were measured using an Anton Paar ALEX 500 (Anton Paar, Graz, Austria). Instrument performance for the determination of soluble solids was verified in accordance with the ASBC Beer-5 method [21].

2.11. Anthocyanins

Total anthocyanin content was determined using the pH differential method according to AOAC Official Method 2005.02 [22]. Wine samples were diluted 1:5 in pH 1.0 buffer (0.025 M potassium chloride) and pH 4.5 buffer (0.4 M sodium acetate). Samples were equilibrated in each buffer for 30 min prior to analysis. Absorbance was measured at 520 and 700 nm using a Shimadzu (Shimadzu Scientific Instruments, Inc., Columbia, MD, USA) UV–Vis spectrophotometer with a 1 cm pathlength cuvette. Anthocyanin concentration was expressed as cyanidin-3-glucoside equivalents (mg/L) and calculated using Equation (4) provided below:
A   ×   MW   ×   DF   ×   10 3 ε   ×   1 = T o t a l   A n t h o c y n a n i n s   ( C y a n i d i n 3 g l u c o s i d e   e q u i v a l e n t s m g L )
where A is the absorbance calculated by (A520 nm − A700 nm) at pH 1.0 − (A520 nm − A700 nm) at pH 4.5; Molecular Weight (MW) was 449.2 g/mL for cyanidin-3-glucoside; the Dilution Factor (DF) was 5; a conversion of 103 adjusted g to mg; and the molar extinction coefficient ε = 26,900 in L × mol–1 × cm–1, for cyanidin-3-glucoside, and is multiplied by 1 for the pathlength in cm.

2.12. Extraction of the Volatile and Semi-Volatile Compounds

Volatile and semi-volatile compounds in the wines were extracted and concentrated using solid-phase microextraction (SPME). A 50/30 µm divinylbenzene/Carboxen/polydimethylsiloxane (DVB/Carboxen/PDMS) fiber (Supelco, Inc., Bellefonte, PA, USA) was exposed to the headspace of 10 mL of wine sample spiked with 25 µL of internal standard (20 mg/L). The internal standard solution was prepared by dissolving 50 µL of 2-heptanol in 50 mL of 200-proof ethanol. Samples were prepared in 20 mL headspace vials containing 30% (w/v) sodium chloride and sealed with Teflon-lined silicone septa. Prior to extraction, samples were equilibrated at 40 °C for 5 min, followed by fiber exposure for 30 min at 40 °C with agitation at 250 rpm [23].

2.13. Gas Chromatography–Mass Spectrometry (GC-MS)

Volatile compounds were thermally desorbed for 5 min in the injection port of a Shimadzu GC-2010 Plus coupled to a Shimadzu QP2010 SE (Columbia, MD, USA). The injection port was maintained at 250 °C, and analyses were performed in splitless mode using a narrow-bore deactivated glass liner. Separation was achieved on a ZB-5MS column (30 m × 0.25 mm i.d. × 0.25 µm film thickness) with helium as the carrier gas at a flow rate of 2.0 mL/min (linear velocity 53.8 cm/s). The oven temperature program was as follows: initial temperature of 35 °C held for 5 min, ramped to 225 °C at 6 °C/min, and held at 225 °C for 10 min. The MSD was maintained at 200 °C and operated in scan mode over a mass range of 40–800 m/z. GC–MS analysis was used to identify volatile and semi-volatile compounds present in the wine samples [23].

2.14. Identification and Compound Response

Peaks were identified based on linear retention indices (LRIs), comparison with authentic standards, and mass spectral fragmentation patterns. A minimum library match score of 80% was applied during post-run analysis. Spectral data were compared against the NIST 2014 Mass Spectral Library, as well as terpene/terpenoid and flavor/fragrance reference libraries. Experimentally determined linear retention index (LRI) values were compared with values in the published literature, with an acceptable deviation of ±10 units. Volatile compounds were further confirmed using LRI values obtained on a nonpolar DB-5MS column (30 m × 0.25 mm i.d., 0.25 µm film thickness; J&W, Folsom, CA, USA). A homologous series of aliphatic hydrocarbon standards was analyzed under identical conditions to calculate RI values using Equation (5) provided below:
L R I = 100 ( t R ( u n k n o w n ) t R ( n ) t R N t R ( n ) + n )
where, in regard to the linear retention index (LRI), n is the number of carbon atoms in the n-alkane eluting immediately before the analyte, N is the number of atoms in the n-alkane eluting immediately after the analyte, and t is the retention time [23].

2.15. Compound Response

GC–MS peak areas for each identified compound were normalized to the peak area of the internal standard (2-heptanol) within each chromatogram. The resulting relative response values were compiled for each compound and used for subsequent statistical analysis [23].

2.16. Statistical Analysis

Statistical analyses were performed using JMP18 Pro (Cary, NC, USA). Statistical calculations were carried out using a one-way analysis of variance (ANOVA) paired with Tukey’s HSD test. Statistical significance was determined using a p-value of 0.05 for all tests. Pearson’s correlation coefficient was used to assess linear correlations between storage time (days) and parameter (sulfites (total and free), anthocyanins, and color (hue and intensity)). FTIR data was assessed using Prism version 10.4.0 (La Jolla, CA, USA).

3. Results and Discussion

There were several physiochemical properties (Table 1) that remained relatively stable over the duration of the experiments, including pH, titratable acidity, ethanol, total soluble solids (TSSs), and sugar concentration (soluble solids). Wendrick et al. (2025) observed similar trends for carbonated muscadine wine under both ambient and accelerated conditions [15].

3.1. pH and Titratable Acidity

As shown in Table 2, there was no statistical difference in the pH between the three different packaging types. This indicates that packaging type did not affect the wine’s pH during accelerated storage. It should be noted that blueberry wine should have a pH below 3.3 to be considered optimal as it enhances the flavor and stability of the wine according to winemakers. The blueberry wine used in this study started and remained at a pH below 3.3. Similarly, there was no statistical difference in the TA between the three different packaging types (Table 2), indicating that packaging type did not affect the wine’s TA during accelerated storage.

3.2. Ethanol, Soluble Solids, and Specific Gravity

As shown in Table 2, there was no significant difference in the alcohol (% ABV), soluble solids, or specific gravity (SG) among the wine samples packaged in glass, cans, or plastic during the accelerated storage experiment.

3.3. FTIR

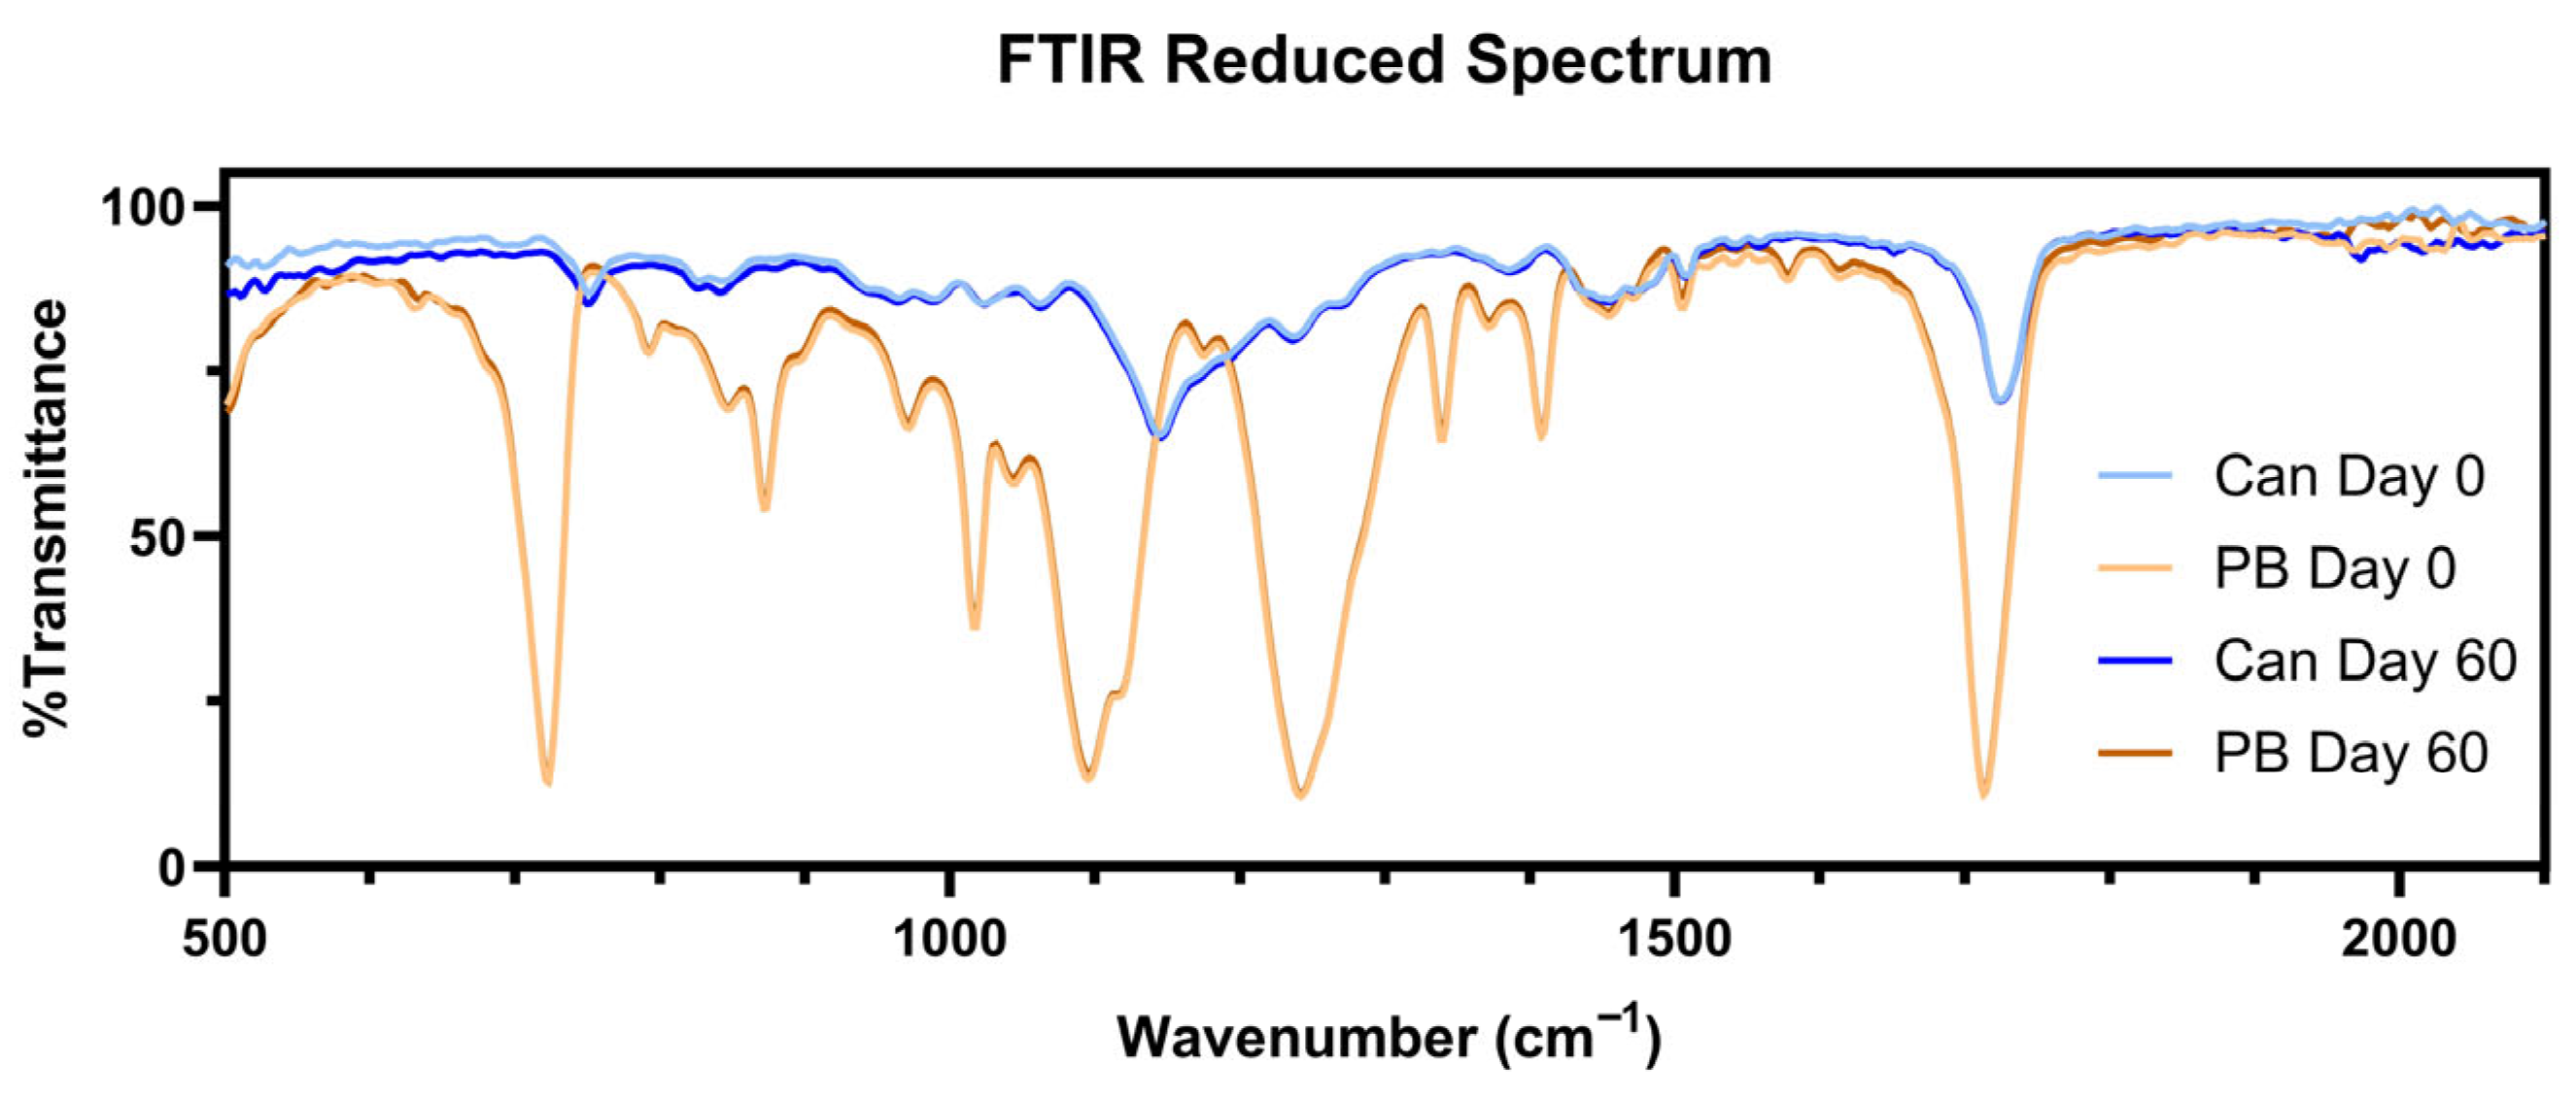
FTIR was used in this study to investigate if significant flavor scalping occurred during accelerated storage. To accomplish this, the can liners and plastic bottles used for this experiment were compared before filling and again after 60 days of accelerated aging. This approach was also used in a previous study, performed by Wendrick et al. (2025) [15], to determine if flavor scalping occurred. The FTIR data showed that no differences were observed in the can liners between day 0 and day 30 (accelerated) and day 180 (ambient) [15]. Similar results were observed in this study as well, with no apparent difference in the FTIR spectrum collected before and after forced aging in either cans or plastic bottles (Figure 1).

3.4. Sulfites

Sulfur dioxide (SO2), commonly referred to as sulfites by enologists, is a preservative used for its antimicrobial and antioxidant properties [15]. When adding sulfur dioxide to wine, a portion will react (bound sulfites) with sugars and other compounds (ketones and aldehydes). The remaining fraction (free sulfites) is the most important fraction as it is chemically available to protect the product against oxidative deterioration [15,24,25]. The total (bound + free) and free sulfur dioxide (SO2) concentrations were measured using the Ripper method [19]. Although the Ripper method is known to overestimate sulfite concentrations in red wine with high residual sugar, it was employed because most local wineries use it for their sulfite analysis. Although this technique allows for direct comparison with similar studies, the data may be inflated by interference within the wine. The total sulfite concentration decreased in all packages over the 60-day accelerated shelf-life study. Statistically significant differences (p < 0.05) were observed between packaging types on days 30 and 60, as shown in Table 3.
A linear relationship was observed between the total sulfite degradation and storage duration, assessed using Pearson’s correlation coefficient. The values for Pearson’s coefficient range from −1 to +1, indicating a negative, absent, or positive linear correlation between the compared variables [26]. Based upon Pearson’s coefficient for each packaging type, glass bottles (−0.92), aluminum cans (−0.94), and plastic bottles (−0.99), a strong (negative) linear relationship exists between total sulfite concentration and storage duration. The slope of the linear relationship represents the rate at which the total sulfite concentration degraded over time. Plastic bottles experienced the greatest rate of decrease in total sulfites over the 60-day storage period.
As with the total sulfite concentration, the free sulfite concentration decreased during the 60-day accelerated shelf-life study. Statistically significant differences (p < 0.05) were observed between packaging types on days 30 and 60. Similarly, the linear regressions yielded negative slopes supporting the observed decrease in free sulfite concentration with time. This linear relationship is also strongly supported by the calculated Pearson’s coefficients (Table 3). A loss in sulfites over time is expected in wine due to oxidation from total packaged oxygen (TPO), oxygen transmission rate, light, and temperature. Also, certain compounds present in wine are known to bind SO2 (e.g., acetaldehyde, anthocyanins, etc.); however, total SO2 loss is significantly more affected by oxygen ingress than by compound binding [8]. The lower sulfite concentrations in PET bottles are likely due to oxygen ingress, whereas in glass bottles, the smaller wine volume likely led to a higher proportion of TPO. These results show that the carbonated blueberry wine used did have a packaging type effect, with the slowest loss observed in aluminum cans.

3.5. Colors

Using Equation (2), the color intensity (CI) and hue of the wine were calculated for each sampling day from the three absorbance values. Table 4 shows CI over the 60-day sampling period. Statistical differences (p < 0.05) were observed between the different packaging types. A strong linear relationship was observed for aluminum cans (p = −0.98) and plastic bottles (p = 0.98), but not for glass bottles (p = 0.46). While the overall change in CI across all packaging types is quite small, the slowest rate of CI decline was observed for glass bottles based on the corresponding slopes (Table 4). Pearson’s coefficient indicates a strong linear relationship for both aluminum cans and plastic bottles, but a weak linear relationship for glass bottles.
The color “hue” or color “shade” is the ratio between 420 nm and 520 nm absorbance (Equation (3)). Table 4 shows the hue over the 60-day sampling period. Changes in hue are an indication of oxidation and degradation in wine, with an increase in hue correlating to increased oxidation of the color compounds [27]. Statistical differences (p < 0.05) were observed between packaging types during the 60-day storage period. By day 60, there was no statistical difference between the glass and plastic bottles. Pearson’s coefficient was used to assess the linearity of the relationship between color hue and storage period across packaging types. A strong linear relationship was observed for all three packaging types.
Color is a vital organoleptic property of wine, and therefore it is critical to retain the desired color in red and blueberry wines or to limit browning in white wines [28,29,30]. Wine is routinely inspected for color and clarity prior to consumption. Consumers often infer a wine’s flavor, mouthfeel, and aromas from its color [31]. Phenolic compounds, specifically anthocyanins, play a particularly important role in the color of blueberry wine [3]. Recognizing this, winemakers take meticulous steps to maintain color stability throughout production [31]. The instability of anthocyanins following the completion of the fermentation process could cause color intensity (CI) loss, which in turn diminishes overall quality [9,20].
The color hue results indicate that cans outperformed glass and plastic bottles during the accelerated shelf-life study, with the smallest change in hue (smallest slope). These findings also highlight how, under accelerated aging, packaging had a significant effect on Florida fruit wine color, as has been previously reported by Kojic, N. and L. Jakobek (2021) for Vitis vinifera [16] and Wendrick et al. (2025) for muscadine wine [15].

3.6. Anthocyanins

Blueberries contain high concentrations of bioactive components such as polyphenolic compounds [32]. Anthocyanins, a subclass of polyphenolic compounds, are the main contributors of color in blueberry wine [33]. It is easy to distinguish foods with high concentrations of anthocyanins based on their deep red or blue-black color [34]. Similar to muscadine grapes, blueberry anthocyanins are found in the skins [34]. When skins are included during fermentation, anthocyanins are extracted into the wine, ultimately influencing its color, mouthfeel, and antioxidant concentration [3]. A reduction in anthocyanins over the fermentation process is expected [35]. During the storage study, total monomeric anthocyanin concentration decreased steadily over the 60-day sampling period for all packaging types (Table 5). Among the three packaging types, aluminum cans maintain higher anthocyanin concentration over time, as indicated by the smaller slope. As anthocyanins affect wine color, some of the observed hue changes are likely related to the anthocyanin concentrations. Similar results were also observed in a study conducted by Wendrick et al. (2025), where red-Noble muscadine wine was analyzed [15].
In this experiment, samples were placed in an incubator with limited, but not complete, light shielding to prevent light from influencing the chemical reactions. There are several variables that can affect the stability of anthocyanins, such as pH, storage temperature, light exposure, solvents, and certain enzymes [9,36,37]. The results of this study suggest that cans may provide better protection against anthocyanin degradation compared to plastic or glass bottles under accelerated conditions. Additional factors that could have influenced changes in anthocyanin concentration in this study include oxygen permeability, headspace volume, headspace gas mixture, inner liner properties, and closure sealing performance. Although light effects were not directly compared, the incubator used to store the samples during shelf testing greatly reduced light exposure; it is plausible that both bottle types could experience greater oxidation under higher light exposure (e.g., retail stores). This highlights the importance of using packaging materials, such as aluminum cans, to block visible light and create a protective barrier [23].

3.7. Volatile Organic Compounds

Wine and beer are complex beverages containing a wide range of volatile compounds from diverse chemical classes [38]. Volatile and semi-volatile compounds were compared across packaging types under accelerated storage conditions. For clarity, compounds were grouped by chemical class, as shown in Table 6. Wine samples were evaluated prior to packaging (day 0) and after 30 and 60 days of accelerated storage. Compound identities were assigned based on mass spectral data and confirmed using spectral libraries (NIST 2014, terpene and terpenoid, and flavor libraries) in conjunction with linear retention index (LRI) values and comparison to the published literature.
Overall, statistical differences were observed between the overall total concentration of volatile compounds in the three different packaging types by day 60. Statistical differences were observed between the can and plastic; however, no differences were observed between the glass and plastic. These similarities were observed throughout the entire experiment for other chemical attributes, such as color and sulfites (free and total). The organic groups that were found to be significantly different (p < 0.05) were alcohols, alkanes, esters, furans, and others, as well as the overall total. The lack of significant differences between some of the volatile groups is likely due to the wide deviation found when assessing trace compounds, indicating that the inherent variability in some groups was greater than the effect of packaging type. This was especially true for the plastic bottles. The aromatic profile of a glass of wine is experienced as a combination of all the different aromatic compounds combined interacting as opposed to being quantified individually within the GC-MS. The observed differences in VOCs, while significant from a statistical comparison, were generally small in concentration and unlikely to be perceived through the senses.
Changes in the concentration of volatile compounds could be associated with oxygen transmission across the different packaging types. Dombre et al. (2015) noticed changes to Rosé wine packaged in PET bottles [39]. They suggested that the decrease in volatile compounds was associated with the amount of oxygen that could have made its way into the package, along with sorption of volatile compounds into the package (cap and bottle) [39]. FTIR [15] showed no significant changes in the container lining. Specific compounds likely related to oxidation include 2,2-Dimethyl-5-[(1E)-1-methyl-1-propenyl]tetrahydrofuran, linalool oxide II, and 2,2,6-Trimethyl-6-vinyltetrahydropyran, which increased across the shelf life and have been found in other studies on oxidative degradation [40]. Additionally, ethyl succinate levels were higher in aging wine on day 60 than on day 0, similar to other studies on aging blueberry wine [41]. Differences in the final VOC concentrations are likely due to the oxygen present in the packaged wine at the time of packaging.
The use of PET bottles is a viable packaging option for wineries when the intended wine is meant to be consumed young (un-aged). Boisset Collection, formerly known as Boisset Family Estate, a premier winery with vineyards in France, Italy, and California, use PET bottles coupled with oxygen scavenging capabilities to package their Beaujolais nouveau and Louis Bernard Bonus Passus Côte du Rhône wine [42]. The choice to do this was due to the desire for lighter packaging, to be more sustainable, and for the wine to be consumed young as intended [42].

4. Limitations

While this research provides valuable insight into the chemical and color changes in carbonated blueberry wine stored in various packaging types, several notable limitations are associated with this study. While all care was taken to reduce O2 contamination, this parameter was not measured and could have influenced the sulfite levels over time; however, levels would be equal across treatments. The sulfite analysis was performed by an analytical wine lab that uses the ripper method as its preferred method for measuring sulfites. Attempts were made to use enclosures that mimic commercial packages; however, this resulted in different sizes for the glass bottles. To minimize differences in headspace volume among packages, a carbonated wine was used so that CO2 would constitute most of the headspace; however, differences in closures (e.g., cork composition, screw caps, crown caps) can significantly affect oxygen transmission rates and, consequently, changes in wine quality. Although closures commonly used in the industry were selected to focus on the effect of packaging type, the findings are therefore limited to the specific closures tested.

5. Conclusions

In this study, the stability and composition of carbonated blueberry wine stored in glass, aluminum, and plastic containers were assessed across a 60-day accelerated (35 °C) shelf-life experiment. No changes were observed in pH, TA, ethanol, total solids, or density, as expected. Changes in these parameters would have indicated contamination and/or incomplete fermentation. FTIR was used to determine package integrity and showed no differences between the initial (day 0) and final (day 60) packages, indicating that no scalping of the beverage occurred. There was a significant reduction in free sulfite concentration in PET bottles compared with glass bottles. Sulfite degradation is correlated with oxidation and long-term spoilage potential, leading to an unstable product and color loss. There were significant color differences among packaging types, with bottles developing yellow color compounds. Total anthocyanin compounds (a hallmark of blueberry wine) were found to degrade under all storage conditions; however, levels remained the highest in the canned samples. Anthocyanin concentrations were significantly lower in glass and plastic bottles compared to cans at day 60, indicating better color stability for blueberry wine in cans. Aroma and flavor compounds from alcohols, alkanes, benzenes, and esters had significantly lower concentrations in plastic bottles compared to cans at day 60, supporting the use of glass or aluminum packaging. Similar to previous studies on alternative packaging for wine, this paper found that wine stored in glass and aluminum containers showed similar changes in stability; however, when stored in PET bottles, there was greater deterioration of volatile compounds, sulfites, and color within the parameters evaluated in this study. However, as significant differences typically occurred only after 30 days, there is an opportunity to package wines expected to be consumed quickly in PET without significant degradation. This approach is currently used by some wineries, and the theory has been confirmed in this study. Future work will focus on assessing carbonated blueberry wine under typical storage conditions to provide insights for blueberry wine producers on potential chemical changes across different packaging types.

Author Contributions

Conceptualization: N.A.W., A.J.M. and K.A.T.-W.; data curation: N.A.W., S.T., B.Z. and K.A.T.-W.; formal analysis: N.A.W. and K.A.T.-W.; funding acquisition: A.J.M. and K.A.T.-W.; investigation and methodology: N.A.W., A.J.M. and K.A.T.-W.; project administration: K.A.T.-W.; writing—original draft: N.A.W., S.T., D.B. and K.A.T.-W.; writing—review and editing: N.A.W., D.B., B.Z., A.J.M. and K.A.T.-W. All authors have read and agreed to the published version of the manuscript.

Funding

We would like to acknowledge the Florida Department of Agricultural and Consumer Services along with the 2023–2024 Florida Wine Grape Growers Association for providing funding that supported this research. (FDAC Contract #30345).

Institutional Review Board Statement

Not applicable.

Informed Consent Statement

Not applicable.

Data Availability Statement

The original contributions presented in this study are included in the article. Further inquiries can be directed to the corresponding author.

Acknowledgments

We would like to acknowledge the generous gift from Alan Grove Wine Company and its winemaker, Chase Marden; without this gift, this project would not have been possible.

Conflicts of Interest

The authors declare no conflicts of interest.

Abbreviations

The following abbreviations are used in this manuscript:
ABVAlcohol percentage
CIColor intensity
CO2Carbon dioxide
GC-MSGas Chromatography–Mass Spectrometry
FTIRFourier Transform Infrared Spectroscopy
LRILinear retention index
NaOHSodium hydroxide
N2Nitrogen
O2Oxygen
PETPolyethylene terephthalate
SGSpecific gravity
SO2Sulfur dioxide
TATitratable acidity
TPOTotal package oxygen
TSSTotal soluble solids
VOCVolatile organic compounds

References

  1. Wang, Y.; Cui, M.-Y.; Zhang, Q.; Zhu, Y.; Yang, Q.; Fu, Y.; Bi, H.-J.; Yang, X.-H. Enhancing blueberry wine aroma: Insights from cultivar selection and berry sorting. Curr. Res. Food Sci. 2023, 7, 100643. [Google Scholar] [CrossRef]
  2. Liu, S.; Laaksonen, O.; Li, P.; Gu, Q.; Yang, B. Use of Non-Saccharomyces Yeasts in Berry Wine Production: Inspiration from Their Applications in Winemaking. J. Agric. Food Chem. 2022, 70, 736–750. [Google Scholar] [CrossRef] [PubMed]
  3. Santos, R.O.; Trindade, S.C.; Maurer, L.H.; Bersch, A.M.; Sautter, C.K.; Penna, N.G. Physicochemical, Antioxidant and Sensory Quality of Brazilian Blueberry Wine. An. Acad. Bras. Cienc. 2016, 88, 1557–1568. [Google Scholar] [CrossRef]
  4. Culbert, J.A.; McRae, J.M.; Condé, B.C.; Schmidtke, L.M.; Nicholson, E.L.; Smith, P.A.; Howell, K.S.; Boss, P.K.; Wilkinson, K.L. Influence of Production Method on the Chemical Composition, Foaming Properties, and Quality of Australian Carbonated and Sparkling White Wines. J. Agric. Food Chem. 2017, 65, 1378–1386. [Google Scholar] [CrossRef] [PubMed]
  5. Martins, F.C.O.L.; Sentanin, M.A.; De Souza, D. Analytical methods in food additives determination: Compounds with functional applications. Food Chem. 2019, 272, 732–750. [Google Scholar] [CrossRef] [PubMed]
  6. Du, X.; Plotto, A.; Song, M.; Olmstead, J.; Rouseff, R. Volatile Composition of Four Southern Highbush Blueberry Cultivars and Effect of Growing Location and Harvest Date. J. Agric. Food Chem. 2011, 59, 8347–8357. [Google Scholar] [CrossRef]
  7. Liu, F.; Li, S.; Gao, J.; Cheng, K.; Yuan, F. Changes of terpenoids and other volatiles during alcoholic fermentation of blueberry wines made from two southern highbush cultivars. LWT 2019, 109, 233–240. [Google Scholar] [CrossRef]
  8. Sacks, G.L.; Howe, P.A.; Standing, M.; Danilewicz, J.C. Free, Bound, and Total Sulfur Dioxide (SO2) during Oxidation of Wines. Am. J. Enol. Vitic. 2020, 71, 266. [Google Scholar] [CrossRef]
  9. Sun, X.; Yan, Z.; zhu, T.; Zhu, J.; Wang, Y.; Li, B.; Meng, X. Effects on the color, taste, and anthocyanins stability of blueberry wine by different contents of mannoprotein. Food Chem. 2019, 279, 63–69. [Google Scholar] [CrossRef]
  10. Ghidossi, R.; Poupot, C.; Thibon, C.; Pons, A.; Darriet, P.; Riquier, L.; De Revel, G.; Mietton Peuchot, M. The influence of packaging on wine conservation. Food Control 2012, 23, 302–311. [Google Scholar] [CrossRef]
  11. Thompson-Witrick, K.A.; Pitts, E.R.; Nemenyi, J.L.; Budner, D. The Impact Packaging Type Has on the Flavor of Wine. Beverages 2021, 7, 36. [Google Scholar] [CrossRef]
  12. de Bouillé, A.G.; Beeren, C.J.M. 7-Sensory Evaluation Methods for Food and Beverage Shelf Life Assessment. In The Stability and Shelf Life of Food, 2nd ed.; Subramaniam, P., Ed.; Woodhead Publishing: Cambridge, UK, 2016; pp. 199–228. [Google Scholar]
  13. Fayoux, S.C.; Seuvre, A.-M.; Voilley, A.J. Aroma transfers in and through plastic packagings: Orange juice and d-limonene. A review. Part I: Orange juice aroma sorption. Packag. Technol. Sci. 1997, 10, 69–82. [Google Scholar] [CrossRef]
  14. You, X.; O’Keefe, S.F. Binding of volatile aroma compounds to can linings with different polymeric characteristics. Food Sci. Nutr. 2018, 6, 54–61. [Google Scholar] [CrossRef] [PubMed]
  15. Wendrick, N.; Kawachika, K.; Wilson, M.; Boz, Z.; Gu, L.; Zhang, B.; MacIntosh, A.J.; Witrick, K. Shelf-Life Stability of Red Noble Muscadine Wine in Cans and Bottles: Chemical and Color Analysis. ACS Food Sci. Technol. 2025, 5, 4446–4457. [Google Scholar] [CrossRef]
  16. Kojic, N.; Jakobek, L. The Impact of Different Packaging and Storage Time on Physicochemical Properties and Color of Red Wine. J. Microbiol. Biotechnol. Food Sci. 2021, 10, e3036. [Google Scholar] [CrossRef]
  17. Wendrick, N.A.; Sims, C.A.; MacIntosh, A.J. The Effect of Carbonation Level on the Acceptability and Purchase Intent of Muscadine and Fruit Wines. Beverages 2021, 7, 66. [Google Scholar] [CrossRef]
  18. Zhang, B.; Luo, Y.; Wang, Q. Effect of acid and base treatments on structural, rheological, and antioxidant properties of α-zein. Food Chem. 2011, 124, 210–220. [Google Scholar] [CrossRef]
  19. Sulfur Dioxide: Ripper Titrametric Method Using Iodine. In Wine Analysis and Production; Zoecklein, B., Fugelsang, K., Gump, B., Nury, F., Eds.; Champman & Hall Inc.: New York, NY, USA, 1997; pp. 493–496. [Google Scholar]
  20. Glories, Y. La couleur des vins rouges. lre partie: Les équilibres des anthocyanes et des tanins. OENO One 1984, 18, 195–217. [Google Scholar] [CrossRef]
  21. ASBC Methods of Analysis; American Society of Brewing Chemists (ASBC): St. Paul, MN, USA, 2011. [CrossRef]
  22. Lee, J.; Durst, R.; Wrolstad, R. AOAC 2005.02: Total Monomeric Anthocyanin Pigment Content of Fruit Juices, Beverages, Natural Colorants, and Wines—pH Differential Method; AOAC: Rockville, MD, USA, 2005; pp. 37–39. [Google Scholar]
  23. Thompson-Witrick, K.A.; Rouseff, R.L.; Cadwallader, K.R.; Duncan, S.E.; Eigel, W.N.; Tanko, J.M.; O’Keefe, S.F. Comparison of Two Extraction Techniques, Solid-Phase Microextraction Versus Continuous Liquid–Liquid Extraction/Solvent-Assisted Flavor Evaporation, for the Analysis of Flavor Compounds in Gueuze Lambic Beer. J. Food Sci. 2015, 80, C571–C576. [Google Scholar] [CrossRef]
  24. Essary, A. Understanding Free Sulfur Dioxide (FSO2) in Wine. Available online: https://extension.okstate.edu/fact-sheets/understanding-free-sulfur-dioxide-fso2-in-wine.html (accessed on 6 February 2026).
  25. Stockley, C.; Paschke-Kratzin, A.; Teissedre, P.-L.; Trejdor, N.G.; Quini, C. SO2 and Wine: A Review, 1st ed.; OIV Publications: Paris, France, 2021. [Google Scholar]
  26. Pearson, K., VII. Mathematical contributions to the theory of evolution.—III. Regression, heredity, and panmixia. Philos. Trans. R. Soc. Lond. Ser. A Contain. Pap. A Math. Phys. Character 1896, 187, 253–318. [Google Scholar] [CrossRef]
  27. Carrasco-Quiroz, M.; Alamo-Sanza, M.D.; Martínez-Gil, A.M.; Sánchez-Gómez, R.; Martínez-Martínez, V.; Nevares, I. Influence of Oxygen Management on Color and Phenolics of Red Wines. Molecules 2023, 28, 459. [Google Scholar] [CrossRef]
  28. Laitila, J.E.; Salminen, J.-P. Relevance of the Concentrations and Sizes of Oligomeric Red Wine Pigments to the Color Intensity of Commercial Red Wines. J. Agric. Food Chem. 2020, 68, 3576–3584. [Google Scholar] [CrossRef]
  29. Zhou, W.; Liu, S.; Yang, H.; Li, E. Effect of selected yeast on physicochemical and oenological properties of blueberry wine fermented with citrate-degrading Pichia fermentans. LWT Food Sci. Technol. 2021, 145, 111261. [Google Scholar] [CrossRef]
  30. Ricci, A.; Parpinello, G.P.; Versari, A. Modelling the evolution of oxidative browning during storage of white wines: Effects of packaging and closures. Int. J. Food Sci. Technol. 2016, 52, 472–479. [Google Scholar] [CrossRef]
  31. Hensel, M.; Di Nonno, S.; Mayer, Y.; Scheiermann, M.; Fahrer, J.; Durner, D.; Ulber, R. Specification and Simplification of Analytical Methods to Determine Wine Color. Processes 2022, 10, 2707. [Google Scholar] [CrossRef]
  32. Eichholz, I.; Huyskens-Keil, S.; Rohn, S. Chapter 21—Blueberry Phenolic Compounds: Fruit Maturation, Ripening and Post-Harvest Effects. In Processing and Impact on Active Components in Food; Preedy, V., Ed.; Academic Press: San Diego, CA, USA, 2015; pp. 173–180. [Google Scholar]
  33. Zhou, J.; Tang, C.; Zou, S.; Lei, L.; Wu, Y.; Yang, W.; Harindintwali, J.D.; Zhang, J.; Zeng, W.; Deng, D.; et al. Enhancement of pyranoanthocyanin formation in blueberry wine with non-Saccharomyces yeasts. Food Chem. 2024, 438, 137956. [Google Scholar] [CrossRef] [PubMed]
  34. Riihinen, K.; Jaakola, L.; Kärenlampi, S.; Hohtola, A. Organ-specific distribution of phenolic compounds in bilberry (Vaccinium myrtillus) and ‘northblue’ blueberry (Vaccinium corymbosum × V. angustifolium). Food Chem. 2008, 110, 156–160. [Google Scholar] [CrossRef]
  35. Nie, Q.; Feng, L.; Hu, J.; Wang, S.; Chen, H.; Huang, X.; Nie, S.; Xiong, T.; Xie, M. Effect of fermentation and sterilization on anthocyanins in blueberry. J. Sci. Food Agric. 2017, 97, 1459–1466. [Google Scholar] [CrossRef] [PubMed]
  36. Cai, D.; Li, X.; Chen, J.; Jiang, X.; Ma, X.; Sun, J.; Tian, L.; Vidyarthi, S.K.; Xu, J.; Pan, Z.; et al. A comprehensive review on innovative and advanced stabilization approaches of anthocyanin by modifying structure and controlling environmental factors. Food Chem. 2022, 366, 130611. [Google Scholar] [CrossRef]
  37. Vidana Gamage, G.C.; Lim, Y.Y.; Choo, W.S. Sources and relative stabilities of acylated and nonacylated anthocyanins in beverage systems. J. Food Sci. Technol. 2022, 59, 831–845. [Google Scholar] [CrossRef]
  38. Witrick, K.; Pitts, E.R.; Sean, F.O.K. Analysis of Lambic Beer Volatiles during Aging Using Gas Chromatography–Mass Spectrometry (GCMS) and Gas Chromatography–Olfactometry (GCO). Beverages 2020, 6, 31. [Google Scholar] [CrossRef]
  39. Dombre, C.; Rigou, P.; Chalier, P. The use of active PET to package rosé wine: Changes of aromatic profile by chemical evolution and by transfers. Food Res. Int. 2015, 74, 63–71. [Google Scholar] [CrossRef]
  40. Silva Ferreira, A.C.; Guedes de Pinho, P.; Rodrigues, P.; Hogg, T. Kinetics of Oxidative Degradation of White Wines and How They Are Affected by Selected Technological Parameters. J. Agric. Food Chem. 2002, 50, 5919–5924. [Google Scholar] [CrossRef]
  41. Mendes-Ferreira, A.; Coelho, E.; Barbosa, C.; Oliveira, J.M.; Mendes-Faia, A. Production of blueberry wine and volatile characterization of young and bottle-aging beverages. Food Sci. Nutr. 2019, 7, 617–627. [Google Scholar] [CrossRef]
  42. Kalkowski, J. Winemaker Chooses PET Bottles for Fine Wines. Available online: https://www.packagingdigest.com/supply-chain-logistics/winemaker-chooses-pet-bottles-for-fine-wines (accessed on 30 January 2026).
Figure 1. The FTIR spectrum of the can liners and plastic bottles before (day 0) and after (day 60) accelerated aging. The can and plastic bottle (PB) spectra are nearly identical on days 0 and 60.
Beverages 12 00064 g001
Table 1. Dimensions and parameters of glass bottles, aluminum cans, and plastic bottles.
Height (mm)Max OD (mm)Top OD (mm)Inner ID (mm)Mass Empty (g)Total Volume (mL)Fill Volume (mL)
Glass19355.426.616.7254197187
Cans12266.152.4N/A15375 355
Plastic21857.024.921.836400379
Table 2. Physical chemical characteristics of carbonated blueberry wine across 60 days in glass bottles, aluminum cans, and plastic bottles.
Time (Days)
Packaging Type060
pH
Glass Bottles3.28 ± 0.01 G3.28 ± 0.01 G
Cans3.28 ± 0.01 G3.29 ± 0.01 G
Plastic Bottles3.28 ± 0.01 G3.27 ± 0.02 G
Titratable Acidity (g of tartaric acid/L)
Glass Bottles6.18 ± 0.17 G6.29 ± 0.10 G
Cans6.18 ± 0.17 G6.23 ± 0.04 G
Plastic Bottles6.18 ± 0.17 G6.14 ± 0.08 G
% ABV
Glass Bottles10.27 ± 0.59 G10.21 ± 0.05 G
Cans10.27 ± 0.59 G10.41 ± 0.05 G
Plastic Bottles10.27 ± 0.59 G10.43 ± 0.49 G
Soluble Solids (g/L)
Glass Bottles68.5 ± 4.30 G67.2 ± 0.46 G
Cans68.5 ± 4.30 G69.5 ± 0.20 G
Plastic Bottles68.5 ± 4.30 G68.9 ± 3.55 G
Sugar Content (SG)
Glass Bottles1.0124 ± 0.0002 G1.0122 ± 0.0002 G
Cans1.0124 ± 0.0002 G1.0128 ± 0.0001 G
Plastic Bottles1.0124 ± 0.0002 G1.0126 ± 0.0008 G
N = 3; mean ± STD; G represents statistical non-significance between measurements. SG: specific gravity.
Table 3. Total and free sulfites of carbonated blueberry wine measured over 60-day storage period with the associated statistical parameters (linear regression slope and Pearson’s coefficient). Each value was reported at the accelerated time point as mg/L of sulfite.
Day 0
(mg/L)
Day 30
(mg/L)
Day 60
(mg/L)
Slope
(mg/L Day)
Pearson’s
Coeff.
Total Sulfites
Glass 140.37 ± 11.94 A89.60 ± 11.73 B82.77 ± 3.91 B−0.96−0.92
Cans140.37 ± 11.94 A119.04 ± 7.79 A114.34 ± 10.66 A−0.43−0.94
Plastic 140.37 ± 11.94 A103.32 ± 7.91 AB76.80 ± 2.56 B−1.04−0.99
Free Sulfites
Glass 46.93 ± 4.18 A17.92 ± 2.56 C16.21 ± 1.48 AB−0.51−0.89
Cans46.93 ± 4.18 A33.28 ± 2.56 A29.09 ± 11.96 A−0.30−0.95
Plastic 46.93 ± 4.18 A26.45 ± 2.96 B11.09 ± 1.48 B−0.60−0.99
N = 3; mean ± STD; one-way ANOVA and Tukey’s HSD were run to determine significant differences. Values bearing different letters are statistically significant (p < 0.05). Pearson’s correlation coefficient was used to assess linear correlations.
Table 4. The color intensity (CI) and color hue (CH) measured using the Glories method over a 60-day sampling period with the associated statistical parameters (linear regression slope and Pearson’s coefficient). Each value was reported at the accelerated time point as the measured absorption units (AU).
Time (d)SlopePearson’s Coeff.
Day 0
(AU)
Day 30
(AU)
Day 60
(AU)
Color Intensity (CI)
Glass 1.78 ± 0.07 A1.91 ± 0.05 A1.84 ± 0.01 B9.67 × 10−40.46
Cans1.78 ± 0.07 A1.74 ± 0.01 B1.66 ± 0.01 C−1.96 × 10⁻³−0.98
Plastic 1.77 ± 0.07 A1.88 ± 0.02 A2.09 ± 0.06 A5.63 × 10−30.98
Color hue
Glass 0.92 ± 0.02 A1.02 ± 0.02 B1.16 ± 0.01 A3.99 × 10−30.99
Cans0.92 ± 0.02 A0.98 ± 0.01 C1.02 ± 0.01 B1.71 × 10−30.99
Plastic 0.92 ± 0.02 A1.07 ± 0.01 A1.16 ± 0.04 A4.13 × 10−30.99
N = 3; mean ± STD; one-way ANOVA and Tukey’s HSD were run to determine significant differences. Values bearing different letters are statistically significant (p < 0.05). Intensity measured through the summation of 420 nm + 520 nm + 620 nm. Pearson’s correlation coefficient was used to assess linear correlations.
Table 5. Total anthocyanin concentration (mg/L) of carbonated blueberry wine over 60-day storage period with the associated statistical parameters (linear regression slope and Pearson’s coefficient).
Time (d)SlopePearson’s
Coeff.
Day 0
mg/L
Day 30
mg/L
Day 60
mg/L
Glass 86.03 ± 13.31 A47.84 ± 3.26 B25.38 ± 1.59 B−1.01−0.99
Cans86.03 ± 13.31A67.21 ± 4.55 A52.32 ± 5.17 A−0.56−0.99
Plastic 86.03 ± 13.31A69.44 ± 9.14 A34.76 ± 6.35 B−0.85−0.98
N = 3; mean ± STD; one-way ANOVA and Tukey’s HSD were run to determine significant differences. Values bearing different letters are statistically significant (p < 0.05). Pearson’s correlation coefficient was used to assess linear correlations.
Table 6. Volatile compounds found in blueberry wine packaged in glass, cans, and plastic stored in accelerated conditions.
CompoundLRIApproximate Concentration (mg/L)
Day 0Day 30Day 60
GlassCanPlasticGlassCanPlasticGlassCanPlastic
Acids
Octanoic acid 11690.54 ± 0.24 0.54 ± 0.24 0.54 ± 0.24 0.21 ± 0.04 0.23 ± 0.07 0.18 ± 0.14 0.45 ± 0.14 0.55 ± 0.07 0.28 ± 0.14
Nonanoic acid 12600.05 ± 0.01 0.05 ± 0.01 0.05 ± 0.01 ------ ------ ------ 0.06 ± 0.01 ------ ------
Decanoic acid 13430.20 ± 0.10 0.20 ± 0.10 0.20 ± 0.10 0.10 ± 0.02 ------ ------ 0.17 ± 0.05 0.07 ± 0.06 0.10 ± 0.03
Subtotal 0.77 ± 0.35 A0.77 ± 0.35 A0.77 ± 0.35 A0.31 ± 0.03 A0.23 ± 0.07 A0.18 ± 0.14 A0.69 ± 0.20 A0.62 ± 0.03 A0.40 ± 0.17 A
Alcohols
Isoamyl alcohol 75731.84 ± 8.25 31.84 ± 8.25 31.84 ± 8.25 20.13 ± 2.64 34.74 ± 7.00 23.95 ± 18.66 32.49 ± 6.44 38.90 ± 2.05 25.53 ± 6.46
6-(1-Hydroxy-1-methylethyl)-3-methyl-2-cyclohexen-1-ol 1065------ ------ ------ 0.17 ± 0.02 ------ 0.18 ± 0.09 0.38 ± 0.04 0.32 ± 0.01 0.25 ± 0.09
1-Octanol 10680.21 ± 0.05 0.21 ± 0.05 0.21 ± 0.05 ------ ------ ------ ------ ------ ------
Phenylethyl Alcohol 11082.38 ± 0.45 2.38 ± 0.45 2.38 ± 0.45 1.74 ± 0.20 2.80 ± 0.68 1.68 ± 0.71 2.70 ± 0.49 3.38 ± 0.13 1.96 ± 0.26
2,6-Dimethyl-5,7-octadien-2-ol (Ocimenol) 1153------ ------ ------ 0.01 ± 0.01 0.01 ± 0.01 ------ 0.10 ± 0.01 0.03 ± 0.01 0.04 ± 0.03
2-Decanol 12040.01 ± 0.01 0.01 ± 0.01 0.01 ± 0.01 0.01 ± 0.01 0.01 ± 0.01 0.01 ± 0.01 0.01 ± 0.00 0.01 ± 0.01 0.01 ± 0.01
2-Undecanol 12920.03 ± 0.01 0.03 ± 0.01 0.03 ± 0.01
Dodecanol 14690.13 ± 0.06 0.13 ± 0.06 0.13 ± 0.06 0.19 ± 0.04 0.18 ± 0.04 0.03 ± 0.01 0.30 ± 0.04 0.20 ± 0.03 0.34 ± 0.03
Subtotal 34.59 ± 8.55 A34.59 ± 8.55 A34.59 ± 8.55 A22.25 ± 2.84 A37.86 ± 7.75 A25.84 ± 19.6 A35.98 ± 6.94 AB42.84 ± 1.93 A28.14 ± 6.85 B
Aldehydes
Nonanal 10990.22 ± 0.21 0.22 ± 0.21 0.22 ± 0.21 ------ ------ ------ ------ 0.02 ± 0.04 ------
Decanal 12060.09 ± 0.07 0.09 ± 0.07 0.09 ± 0.07 0.03 ± 0.01 0.08 ± 0.06 0.04 ± 0.03 0.04 ± 0.02 0.09 ± 0.11 0.02 ± 0.02
Dodecanal 14690.10 ± 0.06 0.10 ± 0.06 0.10 ± 0.06 0.02 ± 0.03 0.07 ± 0.04 0.07 ± 0.11 0.02 ± 0.03 0.07 ± 0.04 0.03 ± 0.01
Subtotal 0.28 ± 0.30 A0.28 ± 0.30 A0.28 ± 0.30 A0.04 ± 0.02 A0.14 ± 0.11 A0.13 ± 0.14 A0.05 ± 0.05 A0.16 ± 0.13 A0.05 ± 0.02 A
Alkane
Tridecane 13000.11 ± 0.02 0.11 ± 0.02 0.11 ± 0.02 0.04 ± 0.01 0.07 ± 0.02 0.04 ± 0.02 0.05 ± 0.01 0.10 ± 0.01 0.04 ± 0.02
5,6-Dipropyldecane 13280.10 ± 0.01 0.10 ± 0.01 0.10 ± 0.01 0.04 ± 0.01 0.08 ± 0.02 0.04 ± 0.02 0.05 ± 0.01 0.10 ± 0.01 0.04 ± 0.02
Tetradecane 14000.10 ± 0.06 0.10 ± 0.06 0.10 ± 0.06 0.03 ± 0.01 0.04 ± 0.01 0.03 ± 0.01 0.04 ± 0.01 0.05 ± 0.01 0.03 ± 0.02
Pentadecane 15000.08 ± 0.05 0.08 ± 0.05 0.08 ± 0.05 0.04 ± 0.01 0.06 ± 0.01 0.04 ± 0.02 0.06 ± 0.01 0.07 ± 0.01 0.05 ± 0.01
Subtotal 0.40 ± 0.17 A0.40 ± 0.17 A0.40 ± 0.17 A0.14 ± 0.02 A0.24 ± 0.08 A0.15 ± 0.06 A0.20 ± 0.04 AB0.32 ± 0.03 A0.15 ± 0.07 B
Benzene
Methyl N-hydroxybenzenecarboximidoate 9210.66 ± 0.71 0.66 ± 0.71 0.66 ± 0.71 0.28 ± 0.14 0.49 ± 0.19 0.41 ± 0.34 ------ 0.34 ± 0.20 0.12 ± 0.04
m-Di-tert-butylbenzene 12420.20 ± 0.07 0.20 ± 0.07 0.20 ± 0.07 0.10 ± 0.01 0.15 ± 0.04 0.11 ± 0.06 0.11 ± 0.02 0.11 ± 0.02 0.07 ± 0.01
Subtotal 0.75 ± 0.67 A0.75 ± 0.67 A0.75 ± 0.67 A0.38 ± 0.14 A0.48 ± 0.33 A0.52 ± 0.35 A0.15 ± 0.06 B0.45 ± 0.22 A0.15 ± 0.06 B
Esters
Ethyl isovalerate 8620.26 ± 0.04 0.26 ± 0.04 0.26 ± 0.04 0.30 ± 0.24 0.24 ± 0.06 0.24 ± 0.09 0.21 ± 0.19 0.32 ± 0.01 0.18 ± 0.05
Isoamyl acetate 8821.07 ± 0.15 1.07 ± 0.15 1.07 ± 0.15 0.36 ± 0.15 0.66 ± 0.09 0.57 ± 0.20 0.51 ± 0.08 0.64 ± 0.06 0.46 ± 0.18
Ethyl hexanoate 10023.66 ± 0.50 3.66 ± 0.50 3.66 ± 0.50 1.80 ± 0.44 2.81 ± 0.48 1.85 ± 0.86 2.23 ± 0.59 3.18 ± 0.29 1.77 ± 0.81
Ethyl furan-2-carboxylate 1040------ ------ ------ 0.02 ± 0.02 ------ ------ 0.06 ± 0.01 0.04 ± 0.01 0.03 ± 0.02
Ethyl 2-hydroxy-4-methylpentanoate 10580.10 ± 0.02 0.10 ± 0.02 0.10 ± 0.02 0.08 ± 0.01 0.12 ± 0.03 0.08 ± 0.04 0.17 ± 0.02 0.15 ± 0.01 0.11 ± 0.03
Ethyl sorbate 10915.78 ± 1.83 5.78 ± 1.83 5.78 ± 1.83 3.69 ± 0.49 6.95 ± 2.32 4.23 ± 2.14 7.50 ± 1.11 8.44 ± 0.40 5.67 ± 1.92
Methyl octanoate 11210.12 ± 0.07 0.12 ± 0.07 0.12 ± 0.07 0.02 ± 0.01 0.06 ± 0.05 0.07 ± 0.05 0.03 ± 0.03 0.07 ± 0.04 0.01 ± 0.01
Ethyl benzoate 11720.21 ± 0.06 0.21 ± 0.06 0.21 ± 0.06 0.10 ± 0.01 0.20 ± 0.08 0.13 ± 0.06 0.17 ± 0.02 0.23 ± 0.02 0.15 ± 0.05
Esters Continue
Ethyl succinate 11790.84 ± 0.24 0.84 ± 0.24 0.84 ± 0.24 0.87 ± 0.12 1.06 ± 0.10 0.72 ± 0.57 2.34 ± 0.33 1.92 ± 0.18 1.46 ± 0.34
Ethyl octanoate 119712.20 ± 6.05 12.20 ± 6.05 12.20 ± 6.05 3.87 ± 0.31 7.28 ± 1.55 4.52 ± 2.06 4.83 ± 1.01 7.77 ± 0.93 3.24 ± 0.92
Ethyl 2-phenylacetate 12390.20 ± 0.01 0.20 ± 0.01 0.20 ± 0.01 0.08 ± 0.01 0.13 ± 0.05 0.10 ± 0.07 0.15 ± 0.03 0.21 ± 0.06 0.10 ± 0.02
Ethyl phenylacetate 12390.15 ± 0.02 0.15 ± 0.02 0.15 ± 0.02 ------ ------ ------ ------ ------ ------
Phenethyl acetate 12490.37 ± 0.15 0.37 ± 0.15 0.37 ± 0.15 0.15 ± 0.01 0.29 ± 0.07 0.16 ± 0.09 0.14 ± 0.03 0.28 ± 0.04 0.11 ± 0.02
Ethyl nonanoate 12800.03 ± 0.02 0.03 ± 0.02 0.03 ± 0.02 ------ ------ ------ 0.01 ± 0.01 ------ ------
Methyl decanoate 13110.05 ± 0.05 0.05 ± 0.05 0.05 ± 0.05 ------ ------ ------ ------ ------ ------
Propyl 2,4-hexadienecarboxylate 13520.36 ± 0.13 0.36 ± 0.13 0.36 ± 0.13 0.10 ± 0.01 0.15 ± 0.06 0.09 ± 0.05 0.10 ± 0.02 0.15 ± 0.06 0.09 ± 0.02
Ethyl 9-decenoate 13730.09 ± 0.07 0.09 ± 0.07 0.09 ± 0.07 0.02 ± 0.01 0.03 ± 0.01 0.01 ± 0.01 0.03 ± 0.01 0.02 ± 0.01 0.01 ± 0.01
Ethyl decanoate 13811.81 ± 0.62 1.81 ± 0.62 1.81 ± 0.62 1.26 ± 0.35 1.22 ± 0.16 1.07 ± 0.41 0.69 ± 0.16 1.07 ± 0.21 0.40 ± 0.07
Ethyl isopentyl
succinate
14170.02 ± 0.01 0.02 ± 0.01 0.02 ± 0.01 ------ 0.01 ± 0.01 ------ 0.03 ± 0.01 0.02 ± 0.01 0.01 ± 0.01
Isoamyl octanoate 14360.12 ± 0.12 0.12 ± 0.12 0.12 ± 0.12 0.06 ± 0.01 ------ 0.04 ± 0.01 ------ ------ ------
Ethyl dodecanoate 15950.28 ± 0.31 0.28 ± 0.31 0.28 ± 0.31 0.10 ± 0.02 0.09 ± 0.02 0.06 ± 0.02 0.11 ± 0.01 0.08 ± 0.01 0.04 ± 0.01
Isopropyl myristate 18230.02 ± 0.02 0.02 ± 0.02 0.02 ± 0.02 0.01 ± 0.01 0.04 ± 0.02 0.01 ± 0.01 0.06 ± 0.01 0.06 ± 0.01 0.05 ± 0.01
Subtotal 26.72 ± 8.78 A26.72 ± 8.78 A26.72 ± 8.78 A12.89 ± 1.43 A21.23 ± 4.77 A13.86 ± 6.62 A19.39 ± 3.50 AB24.64 ± 1.13 A13.91 ± 4.43 B
Furan
2,2-Dimethyl-5-[(1 E)-1-methyl-1-propenyl]tetrahydrofuran ------ ------ ------ 0.08 ± 0.02 A ------ 0.06 ± 0.02 A 0.35 ± 0.06 A 0.12 ± 0.02 B 0.19 ± 0.13 AB
Phenols
p-Ethylguaiacol12720.15 ± 0.06 0.15 ± 0.06 0.15 ± 0.06 0.06 ± 0.01 0.11 ± 0.02 0.07 ± 0.03 0.15 ± 0.01 0.15 ± 0.03 0.10 ± 0.03
2,4-Di-tert-butylphenol 15040.03 ± 0.02 0.03 ± 0.02 0.03 ± 0.02 0.02 ± 0.01 0.02 ± 0.01 0.04 ± 0.01 0.02 ± 0.01 0.01 ± 0.01 0.07 ± 0.01
Subtotal 0.17 ± 0.07 A0.17 ± 0.07 A0.17 ± 0.07 A0.08 ± 0.01 A0.13 ± 0.03 A0.11 ± 0.04 A0.17 ± 0.01 A0.16 ± 0.04 A0.17 ± 0.03 A
Pyrans
2,2,6-Trimethyl-6-vinyltetrahydropyran 0.21 ± 0.07 A0.21 ± 0.07 A0.21 ± 0.07 A0.28 ± 0.06 A0.23 ± 0.13 A0.22 ± 0.11 A0.73 ± 0.15 A0.43 ± 0.04 A0.45 ± 0.33 A
Styrene
2,6-Dimethylstyrene10880.16 ± 0.06 A0.16 ± 0.06 A0.16 ± 0.06 A0.08 ± 0.07 AB0.17 ± 0.04 A0.03 ± 0.03 B0.14 ± 0.03 A0.11 ± 0.10 A0.06 ± 0.05 A
Terpenes
Linalool oxide II 994------------------------------------0.43 ± 0.080.22 ± 0.140.30 ± 0.13
o-Cymene 10270.06 ± 0.010.06 ± 0.010.06 ± 0.01------------------------------------
D-Limonene 10330.24 ± 0.070.24 ± 0.070.24 ± 0.070.07 ± 0.030.20 ± 0.040.11 ± 0.040.11 ± 0.040.18 ± 0.010.07 ± 0.03
Eucalyptol 10350.06 ± 0.010.06 ± 0.010.06 ± 0.010.04 ± 0.010.06 ± 0.030.05 ± 0.020.07 ± 0.010.07 ± 0.010.06 ± 0.03
β.-Ocimene 10480.06 ± 0.030.06 ± 0.030.06 ± 0.03------------------------------------
p-Mentha-2,4(8)-diene (Isoterpinolene) 10830.29 ± 0.080.29 ± 0.080.29 ± 0.080.09 ± 0.01------------------------------
Linalool oxide 10850.30 ± 0.040.30 ± 0.040.30 ± 0.040.12 ± 0.040.30 ± 0.150.23 ± 0.140.26 ± 0.040.35 ± 0.020.17 ± 0.04
Nerol oxide 11520.03 ± 0.010.03 ± 0.010.03 ± 0.010.04 ± 0.01------0.04 ± 0.01------0.08 ± 0.02------
Linalool11670.05 ± 0.020.05 ± 0.020.05 ± 0.02------------------------------------
Terpinen-4-ol1185------------------------0.33 ± 0.09------0.24 ± 0.030.37 ± 0.030.14 ± 0.12
(-)-Borneol11960.08 ± 0.020.08 ± 0.020.08 ± 0.02------------------------------------
Citronellol12280.08 ± 0.010.08 ± 0.010.08 ± 0.01------------------------------------
Subtotal 0.81 ± 0.40 A0.81 ± 0.40 A0.81 ± 0.40 A0.33 ± 0.06 B0.85 ± 0.27 A0.42 ± 0.22 AB1.17 ± 0.20 A1.07 ± 0.24 A0.79 ± 0.24 A
Other
2(1H)-Naphthalenone, 3,4,4a,5,6,7-hexahydro-1,1,4a-trimethyl- ------------------------------------0.63 ± 0.13 AB0.87 ± 0.06 A0.44 ± 0.17 B
Overall Totals 64.47 ± 14.30 A64.47 ± 14.30 A64.47 ± 14.30 A36.81 ± 4.19 A61.41 ± 12.38 A41.36 ± 26.64 A58.86 ± 10.52 AB70.82 ± 2.59 A44.41 ± 11.77 B
Mean ± STD; day 0, n = 6; days 30 and 60, n = 3. ------: not detected. One-way ANOVA and Tukey’s HSD were run to determine significant differences between the organic groups. Subtotals were calculated for groups by totaling the sum of each run. Values bearing different letters are statistically significant (p < 0.05). LRI: linear retention index.
Disclaimer/Publisher’s Note: The statements, opinions and data contained in all publications are solely those of the individual author(s) and contributor(s) and not of MDPI and/or the editor(s). MDPI and/or the editor(s) disclaim responsibility for any injury to people or property resulting from any ideas, methods, instructions or products referred to in the content.