Article

Chemical Composition of Coffea arabica Beans and Grafts at Different Roasting Levels

by
Miriam Cristina Pastelin-Solano
,
Odon Castañeda-Castro
,
Javier Emanuel Bulbarela-Marini
,
María Elizabeth Márquez-López
,
Luis Alberto Solano-Rodríguez
,
José Guadalupe Vian-Pérez
,
Marisol Castillo-Morales
,
Rafael Uzárraga-Salazar
,
Luis Alberto Sánchez-Bazán
,
César Galicia-Beltrán
and
Tania Marín-Garza
*
Facultad de Ciencias Químicas, Universidad Veracruzana, Prolongación de Oriente 6, No. 1009, Orizaba 94340, Veracruz, Mexico
*
Author to whom correspondence should be addressed.
Beverages 2026, 12(4), 40; https://doi.org/10.3390/beverages12040040
Submission received: 13 January 2026 / Revised: 19 March 2026 / Accepted: 25 March 2026 / Published: 31 March 2026

Abstract

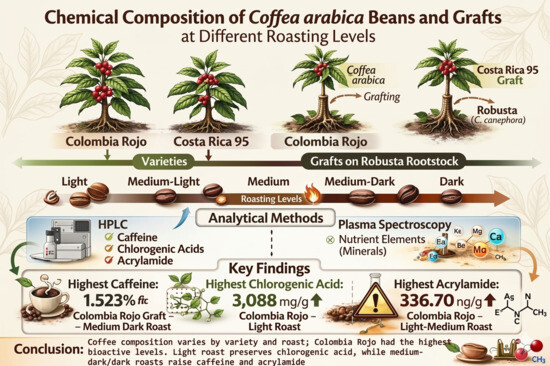
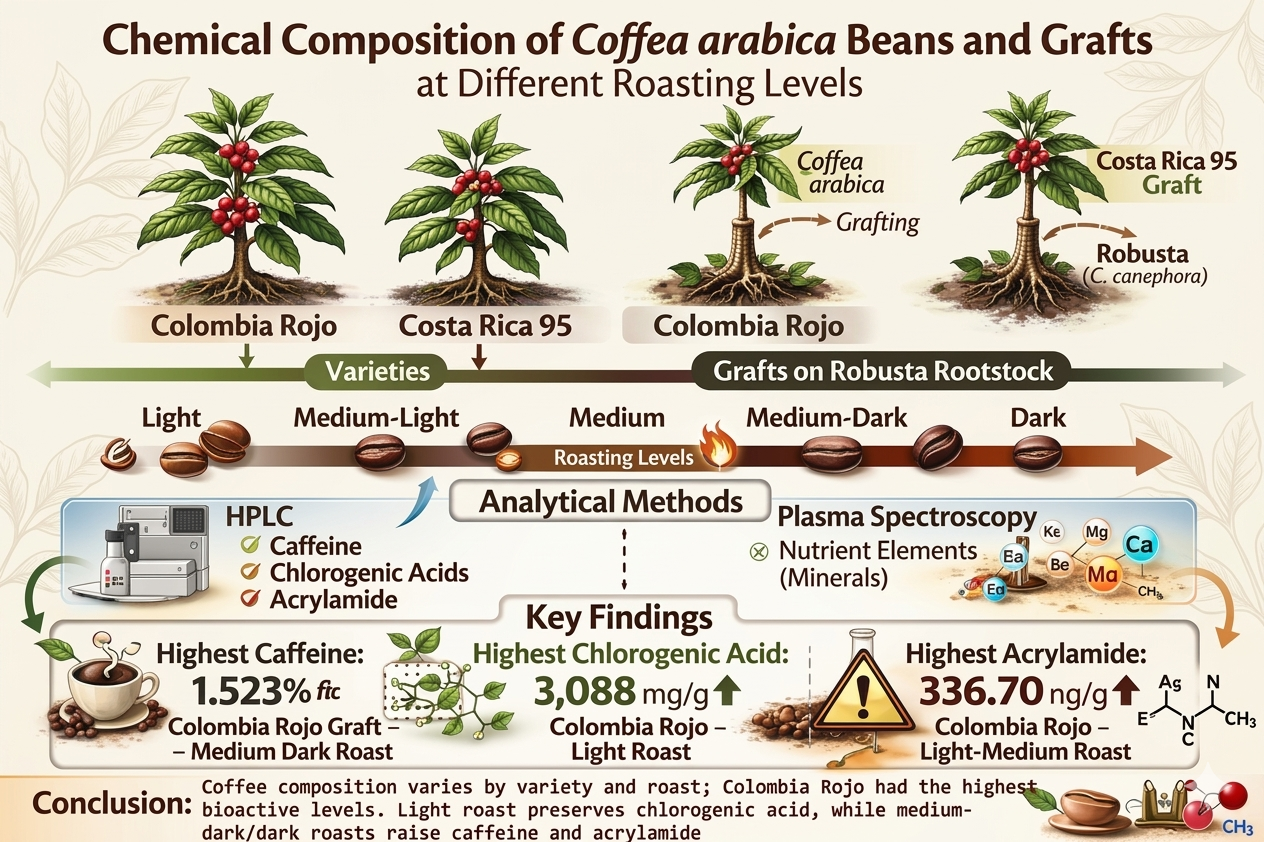
The main commercial species of coffee is Coffea arabica; however, it is highly susceptible to biotic and abiotic factors. For this reason, scions of Coffea arabica species are used on robusta (Coffea canephora) rootstocks since grafting can modify the organoleptic, nutraceutical, and nutritional characteristics of crops. The objective of this study was to evaluate the effects of five roasting degrees (light, medium light, medium, medium dark, and dark) in two varieties of Coffea arabica species (Colombia Rojo and Costa Rica 95) and their respective grafts on C. canephora variety Romex. The concentrations of acrylamide, caffeine, and chlorogenic acids were analyzed using HPLC, and the nutrient content was analyzed using plasma induction atomic emission spectrophotometry. The graft of the Colombia Rojo variety with the medium dark roast had the highest concentration of caffeine (1.523%). The same variety with the light roast had the highest concentration of chlorogenic acid (3.088 mg g−1), while the highest acrylamide content (336.70 ng g−1) was found in the same variety with the medium light roast. The roasting degree, variety, and grafting of coffee influence the organoleptic, nutraceutical, and nutritional contents of coffee infusions.

Graphical Abstract

1. Introduction

Coffee (Coffea arabica) cultivation represents a multi-billion-dollar sector that encompasses a long value chain from the farmer to the consumer. Coffee is the second most consumed beverage worldwide, with an expected production of 10.68 billion kg of green beans from 2023 to 2024 [1].
Coffee flavor is a quality determinant and considered the main attribute of sensory quality. Some non-volatile chemicals are present in green coffee, which are subject to drastic changes during the roasting process and are responsible for the distinctive flavor by while acting as precursors, i.e., free sugars, carbohydrates, chlorogenic acids, trigonelline, proteins, and lipids [2].
It is very important to monitor the identification of contaminants that are generated in the processing of coffee, especially chemical substances that represent a health risk, such as acrylamide. Acrylamide is classified as carcinogenic and is an amide formed through the Maillard reaction when foods rich in carbohydrates are heated to temperatures above 120 °C [3].
Roasted coffee exhibits antioxidant activity as it is rich in melanoidins that are generated during the roasting process [4]. In addition to the antioxidant activity of chlorogenic acids, they have been associated with the prevention of cancer and diabetes [5].
According to the authors of [1], the two most important coffee species are C. arabica (arabica coffee), which represents more than 60% of global production, and C. canephora, better known as robusta coffee.
Of the coffee produced in Mexico, approximately 96% is arabica and 4% is robusta. However, arabica varieties are more susceptible to coffee rust, a pest that has affected the coffee sector in the country since 2012, which has caused a reduction in production of more than 50% [6].
For this reason, in Mexico, the cultivation of the coffee variety Colombia Rojo (C. arabica) has been initiated. This variety exhibits resistance to coffee rust and originates from the C. arabica variety Caturra and the Timor hybrid [7]. Similarly, the Costa Rica 95 coffee variety, which is the result of hybridization between Timor and Caturra, is mainly characterized by resistance to coffee rust, high yields, and an ability to adapt to hot areas and acidic soils [8].
To manage nematodes, grafts of arabica varieties (susceptible) have been used on less susceptible robusta coffee rootstocks, which has proven to be a successful strategy for the control of this pest [9].
This study analyzed the contents of acrylamide, caffeine, chlorogenic acids, and minerals in coffee beans of Colombia Red, Colombia Red Graft, Costa Rica 95, and Costa Rica Graft with five different roasting levels.

2. Materials and Methods

2.1. Plant Material and Experimental Conditions

The present study was carried out with coffee beans from five-year-old plants of the Colombia Rojo and Costa Rica 95 varieties and their grafts (Colombia Rojo graft and Costa Rica 95 graft), planted in the congregation of La Laja, municipality of Tlaltetela, Veracruz, Mexico (19°17′10.8″ N, 96°56′51.9″ W, and altitude of 1250 m). The plants were grown under managed shade with approximately 70% solar radiation using the traditional selective planting method (planting, fertilization, and pruning), with 2000 to 2500 shrubs ha−1 in cambisol soils. For the experiment, 150 trees of each variety were randomly selected from one hectare. Coffee cherries were harvested in the second week of February, and uniform red cherries were selected. Coffee cherry samples (20 kg) from a single harvest of each variety were immediately treated with wet milling until green coffee beans (gold) with 12% moisture content were obtained. The beans were left to rest for seven days, and defective beans were eliminated. Subsequently, manual quartering was carried out to obtain 5 kg samples for roasting.

2.2. Roasting Procedure

The coffee beans were roasted in a MT-1 fluidized bed roaster (Trejo; Zacatlan, Puebla, Mexico), with a capacity of 5 to 7 kg. The roast levels were light, medium light, medium, medium dark, and dark. The variables measured included initial humidity (%), initial and final temperatures (°C), initial weight (g), first and second crack (roasting curve), and temperature increase (5 °C every 30 s). The roasting times were between 8 and 13 min, and the final roasting time was defined by the color of the bean according to each level on the AGTRON/SCAA roasting scale, following the protocol established by the author of [10]. Three replicates were performed, and the roasting process was halted via ventilation once the desired roasting degree was reached (Table 1).

2.3. Quantification of Chlorogenic Acids (5-CQA) and Caffeine Concentrations

Analysis of chlorogenic acids (5-CQA) was performed on an HPLC system (Dionex, ICS 3000; San Jose, CA, USA) equipped with a UV/VIS detector set at a 325 nm wavelength. An isocratic mobile phase consisting of 75% HPLC-grade water and 25% H3PO4-acidified methanol was applied at a flow rate of 1.2 mL min−1, using a 5 mm, 4.6 × 150 mm Acclaim™ 120 C18 reverse phase column (ThermoFisher®, Sunnyvale, CA, USA) and a 5 μm, 10 × 2 mm ZORBAX C18 column (Agilent Technologies, Santa Clara, CA, USA).
The caffeine concentration was determined using a variation in NMX-F-182-SCFI-2011 [11]. Results were expressed as a percentage of dry matter weight (% DMW). Caffeine was extracted using a thermoreactor (Hach, DRB200; Loveland, CO, USA) at 135 °C for 5 min. Quantification was performed on a Dionex ICS 3000 HPLC (San Jose, CA, USA) equipped with a UV/VIS detector at a wavelength of 272 nm. An isocratic mobile phase consisting of 75% HPLC-grade water and 25% H3PO4-acidified methanol was applied at a flow rate of 1.5 mL min−1 on a 120 C18 5 mm 4.6 × 150 mm column (Acclaim™ Model, ThermoFisher, Sunnyvale, CA, USA) with H3PO4. Samples were run in triplicate. The results were expressed as a percentage of dry matter weight (% DMW). Calibration curves for chlorogenic acids and caffeine were prepared using eight concentration points (0, 0.01, 0.008, 0.0065, 0.005, 0.004, 0.002, and 0.0005%) and analyzed in duplicate to verify the linearity of the methods. For these calibration curves, chlorogenic acids 95% CAS 327-97-9 and ≥95% CAS 58-08-2 C1778 (Sigma-Aldrich Saint Louis, Saint Louis, MO, USA) and caffeine ≥ 99% CAS 58-08-2 C1778 (Sigma-Aldrich, Saint Louis, MO, USA) were used.

2.4. Quantification of Acrylamide

Acrylamide extraction was performed by first adding 50 mL of water to a 5 g coffee sample and heating it at 80 °C for 5 min. Then, 1 mL of water was extracted and strained through an SPE cartridge (Thermo Scientific™ HyperSep™ Hypercarb™, Waltham, MA, USA) to separate the acrylamide. Acrylamide quantification was performed using a DAD UV/VIS HPLC (Agilent, 1200, Waldbronn, Karlsruhe, Germany) at a wavelength of 195 nm. An isocratic mobile phase consisting of 85% HPLC-grade water and 15% H3PO4-acidified methanol was applied at a flow rate of 0.4 mL min−1, using an Acclaim™ 120 C18 5 µm 4.6 × 150 mm reverse phase column (ThermoFisher® Sunnyvale, CA, USA) and a ZORBAX C18 5 μm, 10 × 2 mm column protector (Agilent Technologies, Santa Clara, CA, USA). The calibration curve was obtained using acrylamide ≥ 99.9% 79-06-1 (Sigma-Aldrich; Saint Louis, MO, USA) at eight concentration points (0, 0.01, 0.008, 0.0065, 0.005, 0.004, 0.002, and 0.0005 mg mL−1), performed in duplicate to verify the linearity of the methods.

2.5. Nutritional Analysis

The concentrations of the nutrients P, K, Ca, Fe, Cu, Zn, and Mn were determined following the methodology described by the author of [12] with coupled plasma induction atomic emission spectrophotometry (Agilent ICP-AES, model 725-ES; Victoria, Australia). The N content was quantified using the micro-Kjeldahl method. Results were expressed in g kg−1 for macronutrients and mg kg−1 for micronutrients.

2.6. Experimental Design

A completely randomized design with a factorial arrangement was used. The study factors included the genotypes (from four estates) of C. arabica L. var. Colombia Rojo and Costa Rica 95, along with their respective grafts onto C. canephora P. var. Romex, and five roasting levels (light, medium light, medium, medium dark, and dark). This resulted in 20 treatments, each with four replicates (Appendix A and Appendix B).

Statistical Analysis

With the resulting data, ANDEVA with Tukey’s comparison test (p ≤ 0.05) was performed using the SAS statistical package version 11 (SAS Institute, 2011).

3. Results

3.1. Caffeine, Chlorogenic Acid, and Acrylamide Contents in Coffee Beans

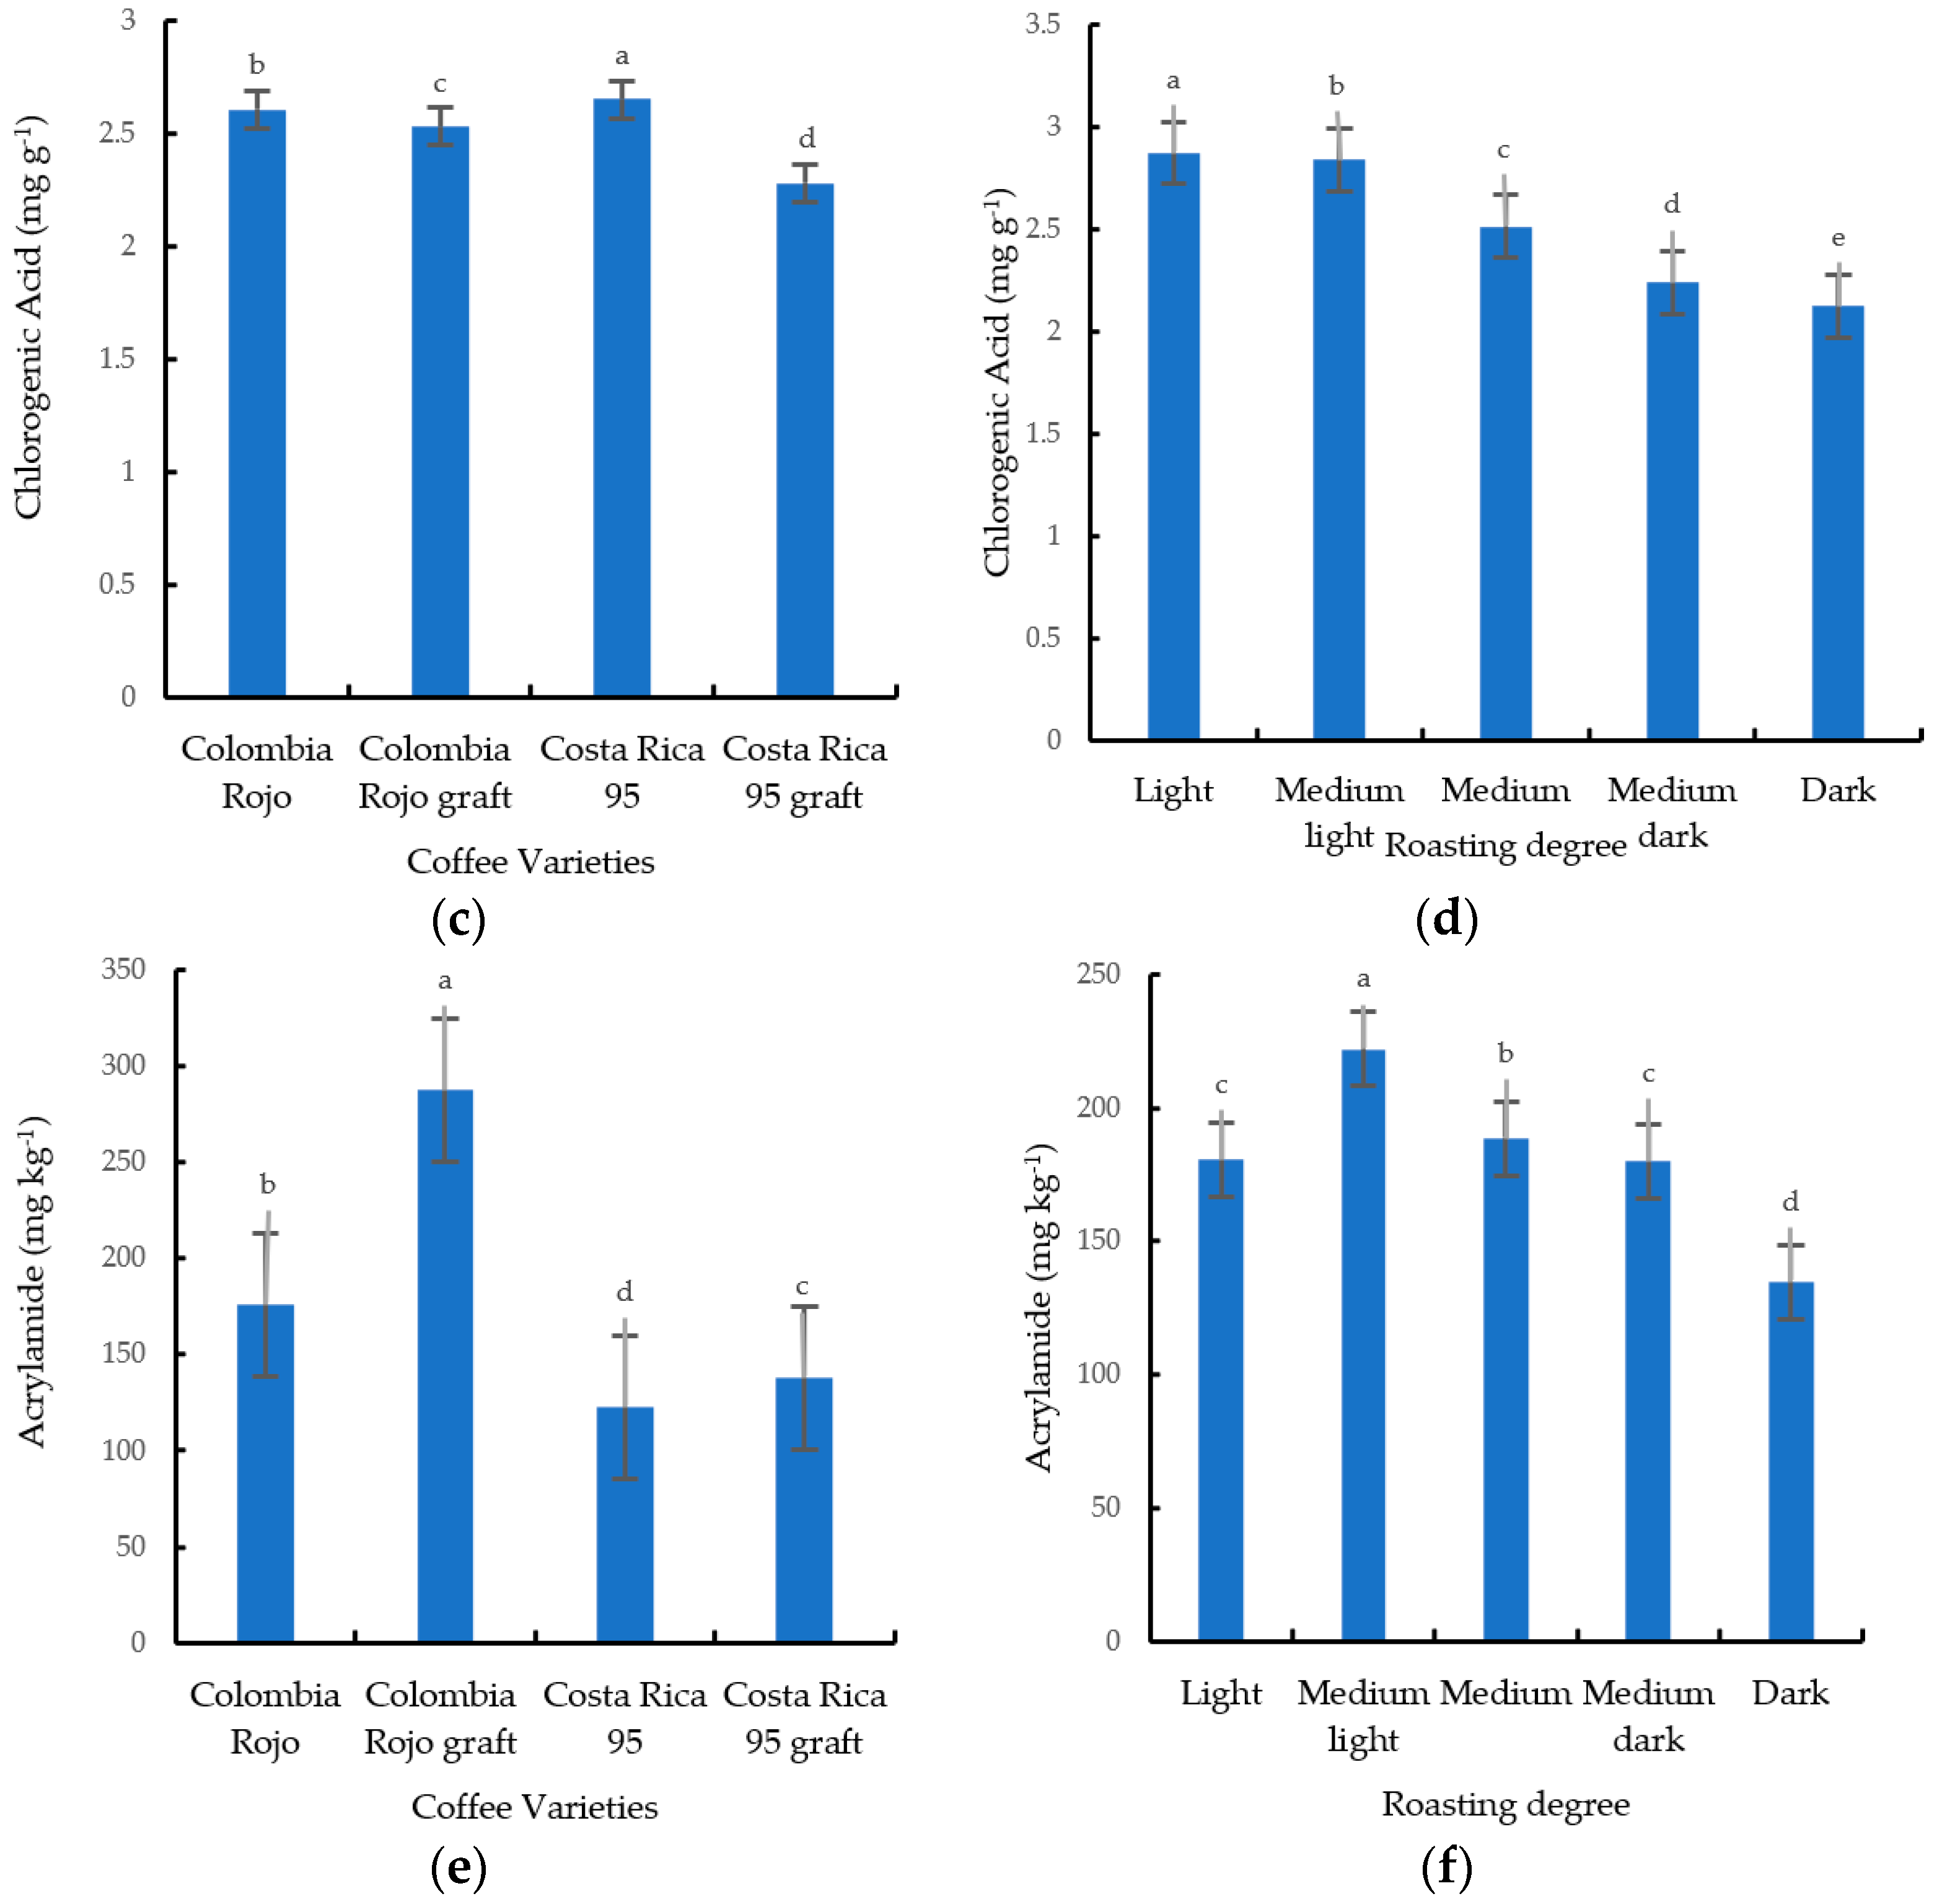
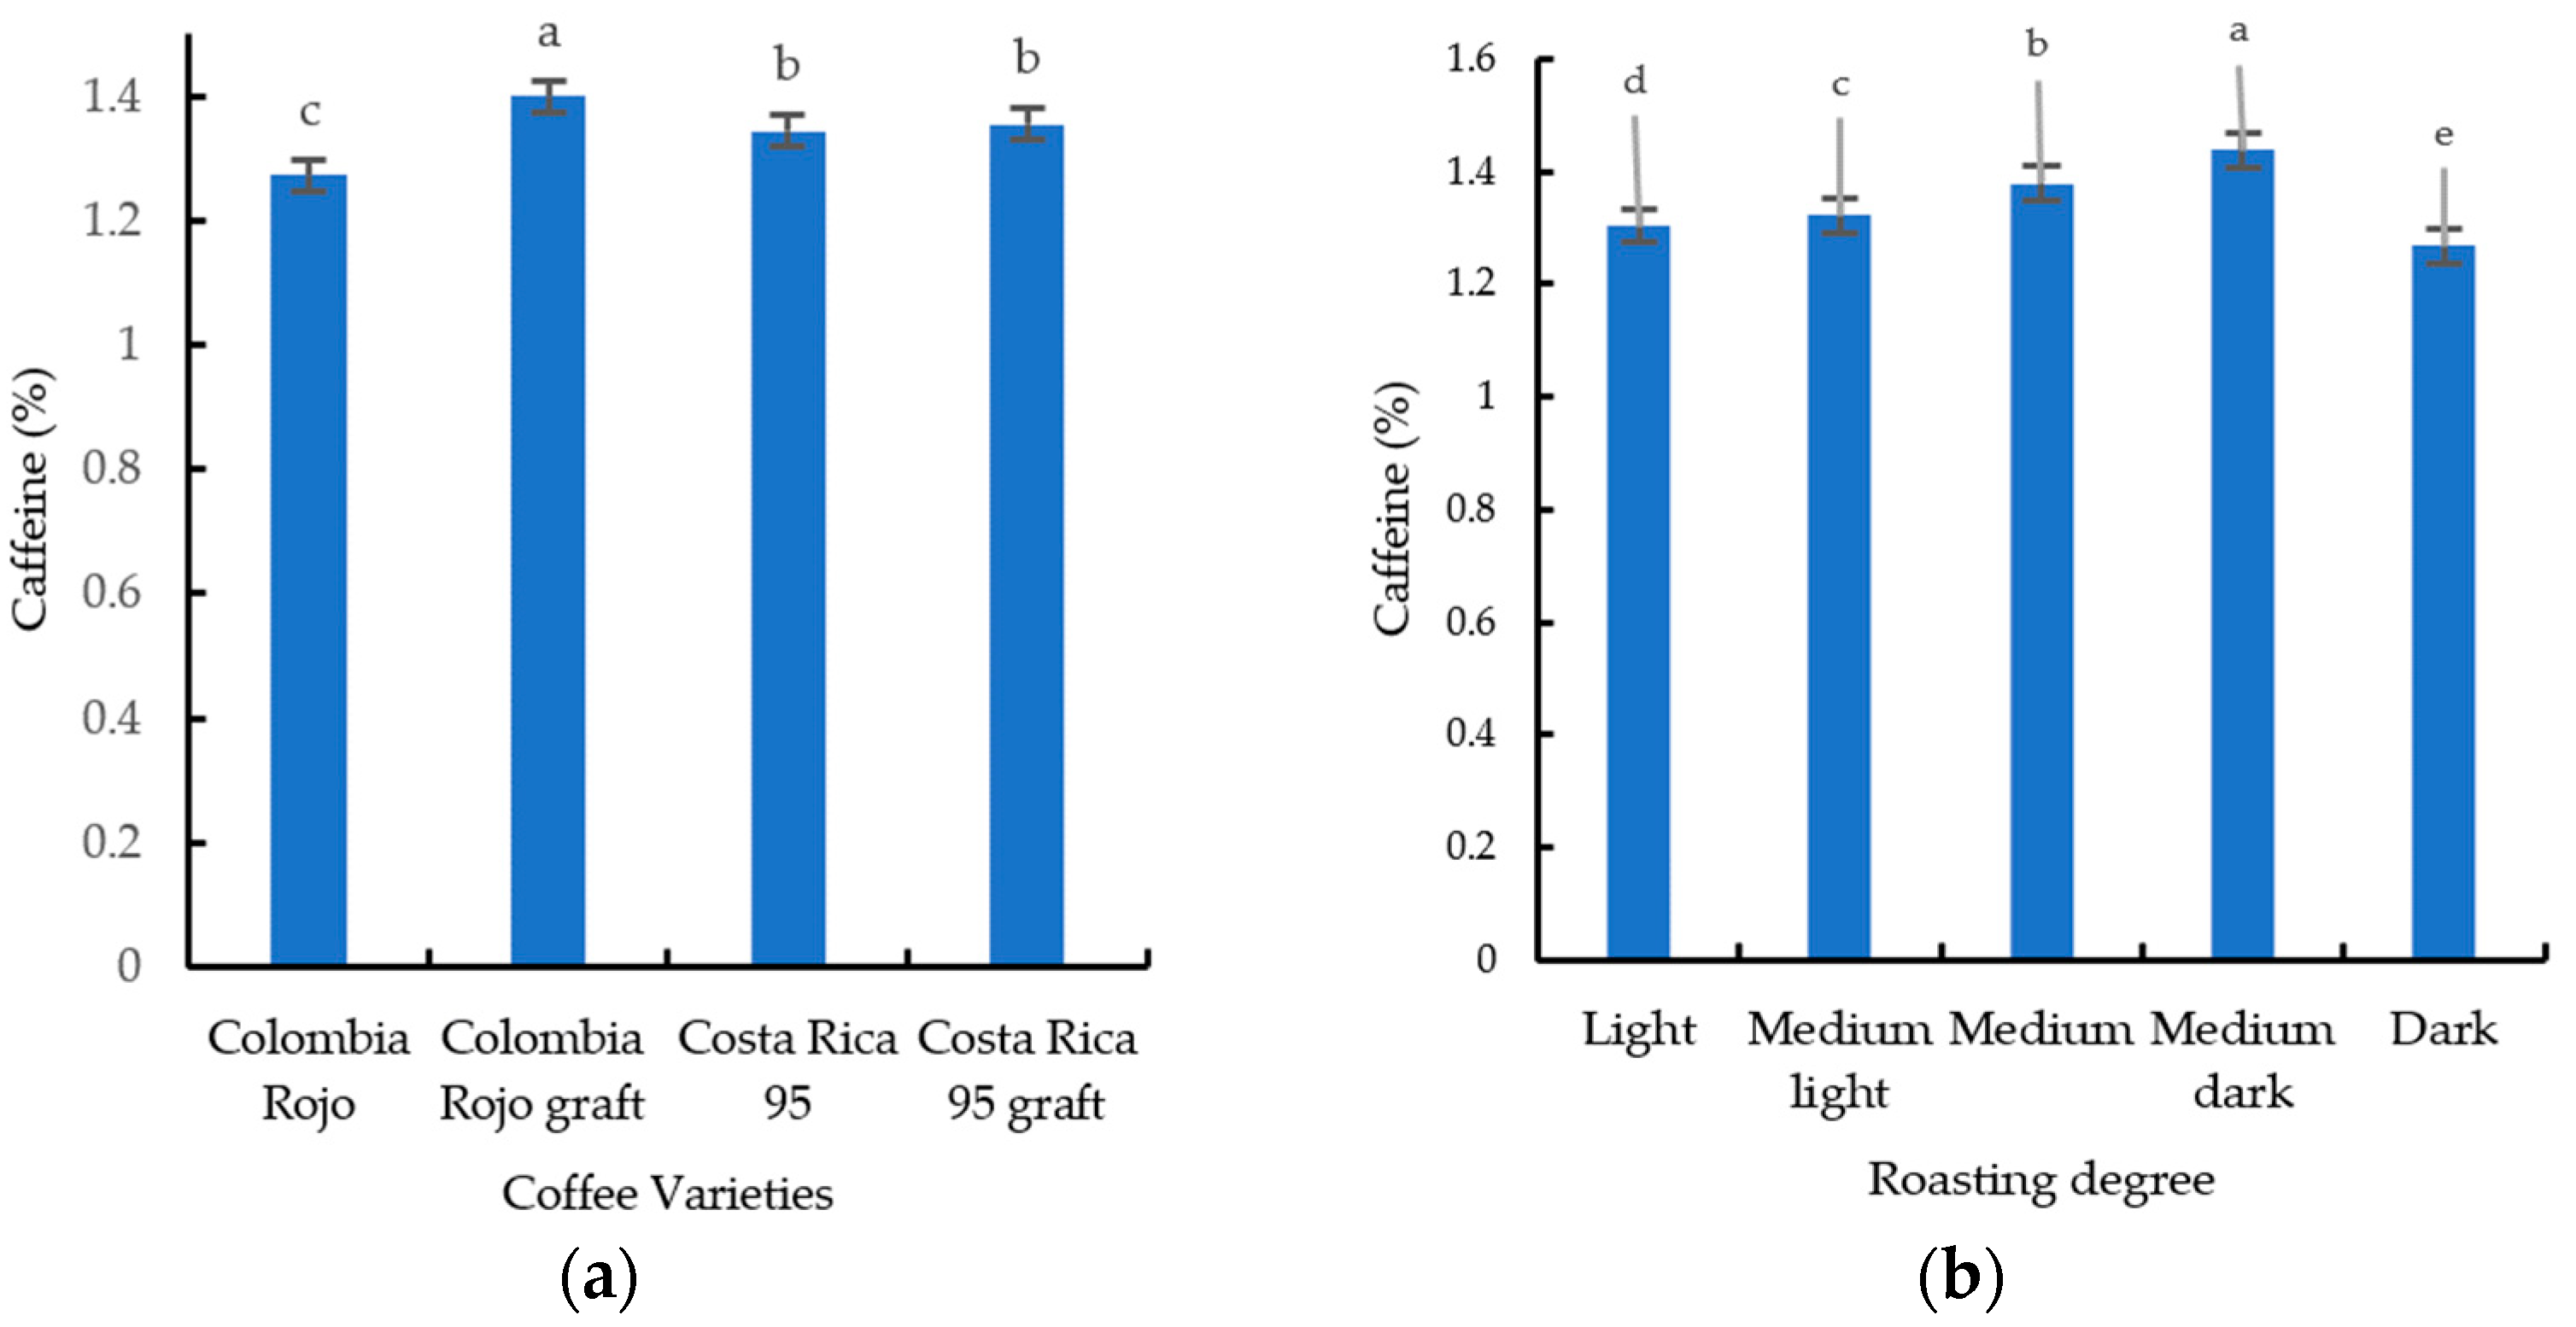
Analysis of the variety factor revealed significant statistical differences between treatments. The highest concentration of caffeine (Figure 1a,b) was found in the beans of the Colombia Rojo graft, along with the highest concentration of acrylamide (Figure 1c,d). Meanwhile, the Costa Rica 95 coffee variety presented the highest content of chlorogenic acid (Figure 1e,f).

3.2. Caffeine, Chlorogenic Acid, and Acrylamide Contents in Coffee Beans at Five Roasting Levels

The highest level of caffeine was found in the medium dark roast. The medium light roast level presented the highest acrylamide content, while the highest concentration of chlorogenic acid (2.87 mg g−1) was found in coffee beans with a light roast (Figure 1).

3.3. Concentrations of Caffeine, Chlorogenic Acid, and Acrylamide Based on the Interaction of the Variety and Its Respective Grafts

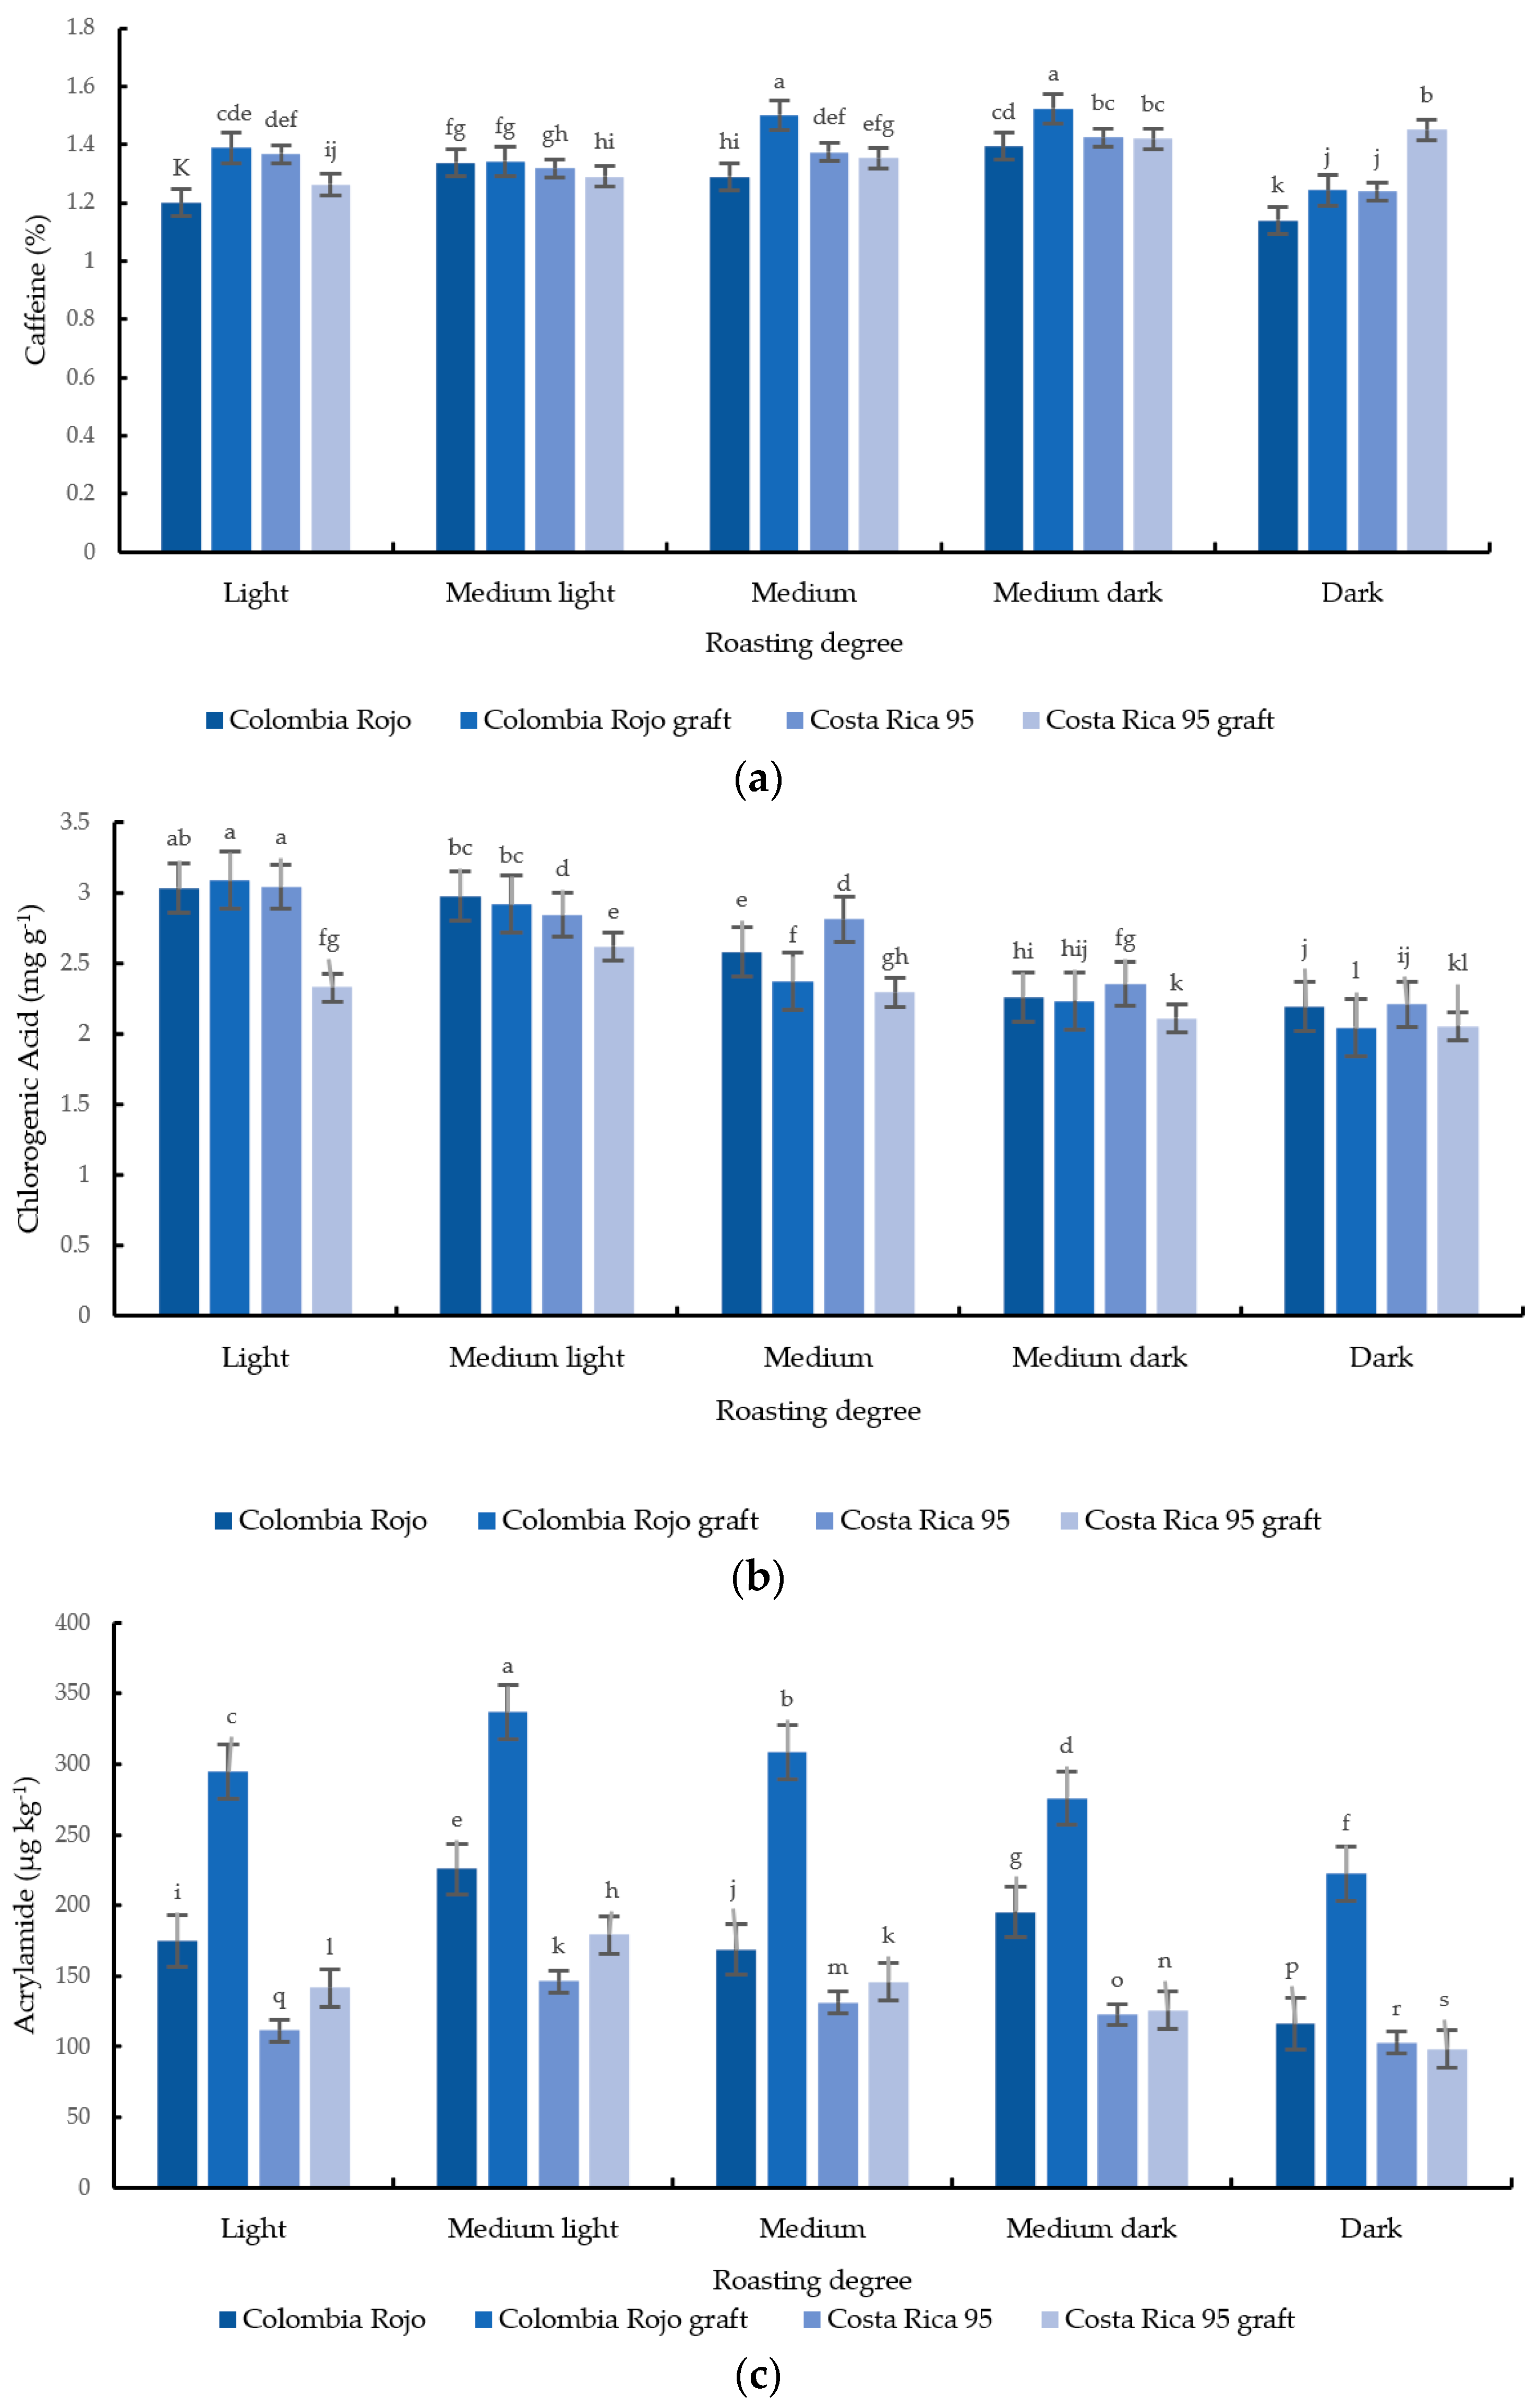
When analyzing the interaction factor between variety and roasting level, the grafted Colombia Rojo beans with a medium roast exhibited the highest concentration of caffeine (Figure 2a). The highest concentration of chlorogenic acid (Figure 2b) occurred in the grafted Colombia Rojo beans with a light roast. The highest amount of acrylamide (Figure 2c) was observed in the grafted Colombia Rojo beans with a medium light roast. When analyzing the effect of roasting on acrylamide content, it was observed that the coffee beans with a medium light roast had the highest acrylamide content, while the lowest contents were found in the beans with a dark roast.

3.4. Macro- and Micronutrient Content in Coffee Beans

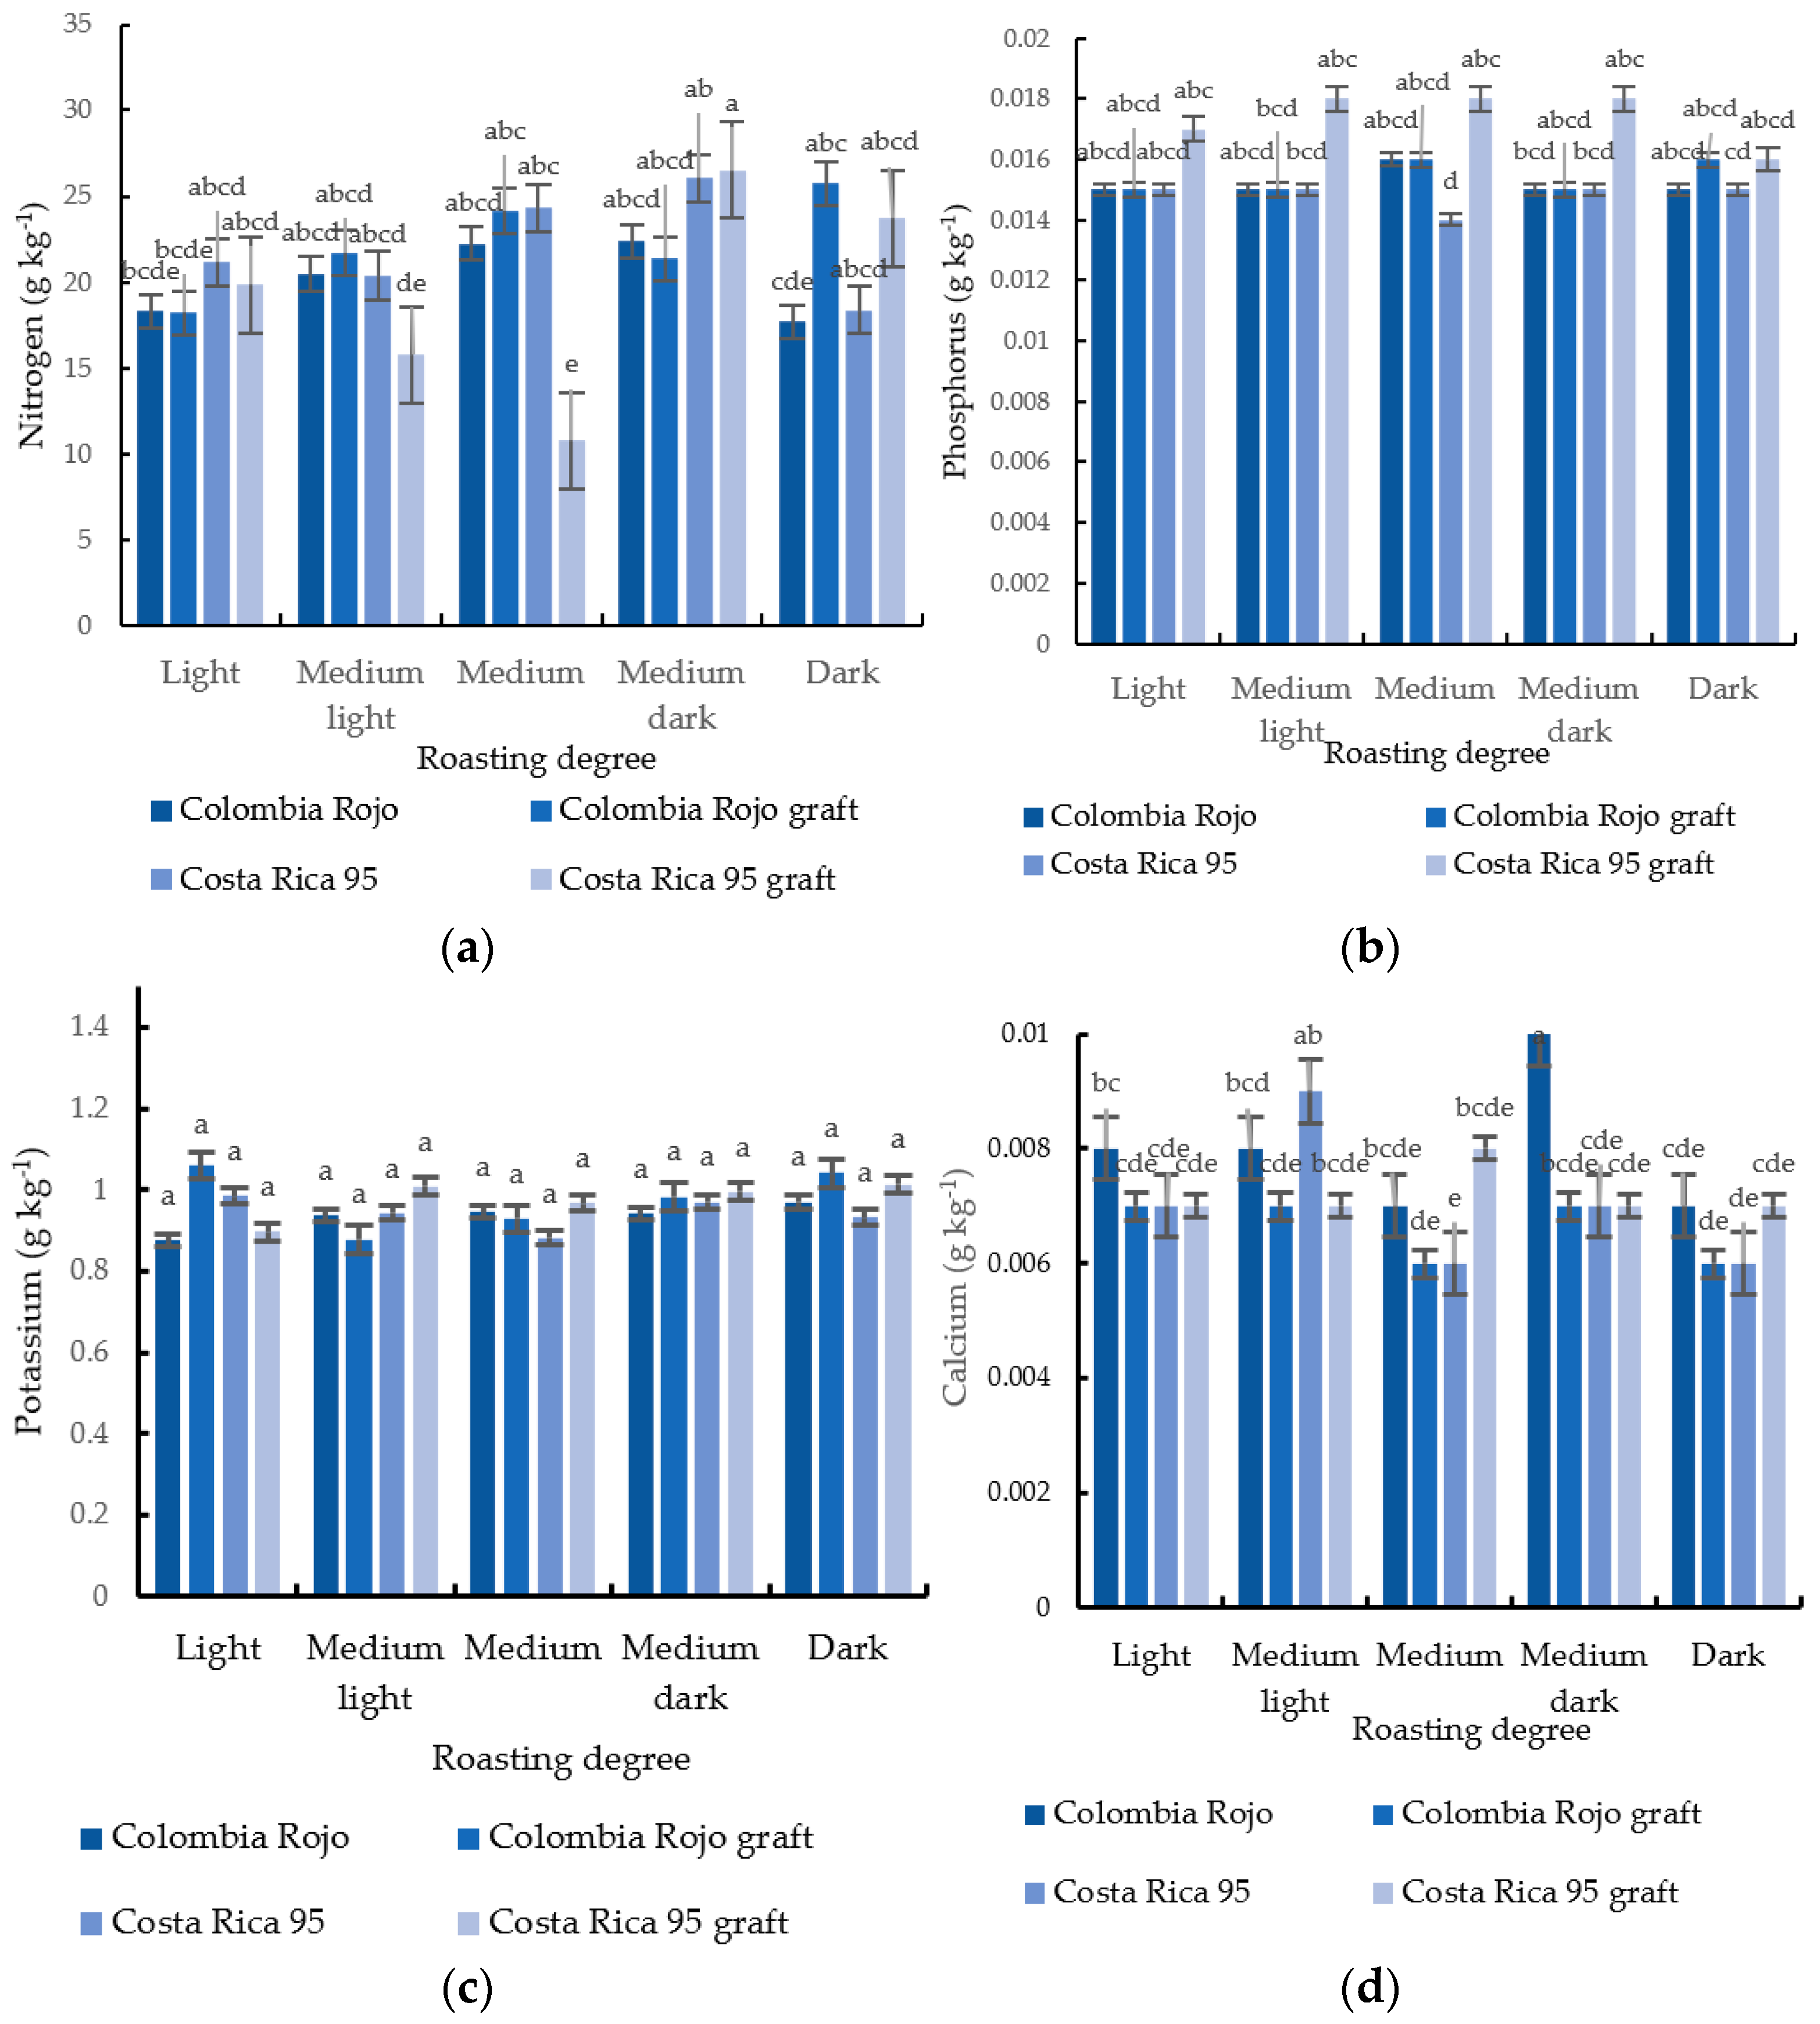
When analyzing the effect of the interaction factor variety by roasting level, no significant statistical differences were found in the nitrogen contents for Colombia Rojo and its graft (Colombia Rojo graft) and Costa Rica 95 at the five roasting levels; however, the Costa Rica 95 graft deviated from this tendency by presenting the highest nitrogen (Figure 3a) contents in the coffee beans with a dark roast level and the lowest with a medium roast. Regarding the contents of phosphorus (Figure 3b), potassium (Figure 3c), and calcium (Figure 3d), statistical differences were found between the treatments in the four varieties at the five roasting levels. Regarding calcium, the highest contents of this nutrient were found in the coffee beans of the Colombia Rojo variety with a medium dark roasting level, and the lowest contents were found in the Colombia Rojo graft and the Costa Rica 95 variety with medium and dark roasting levels, respectively.
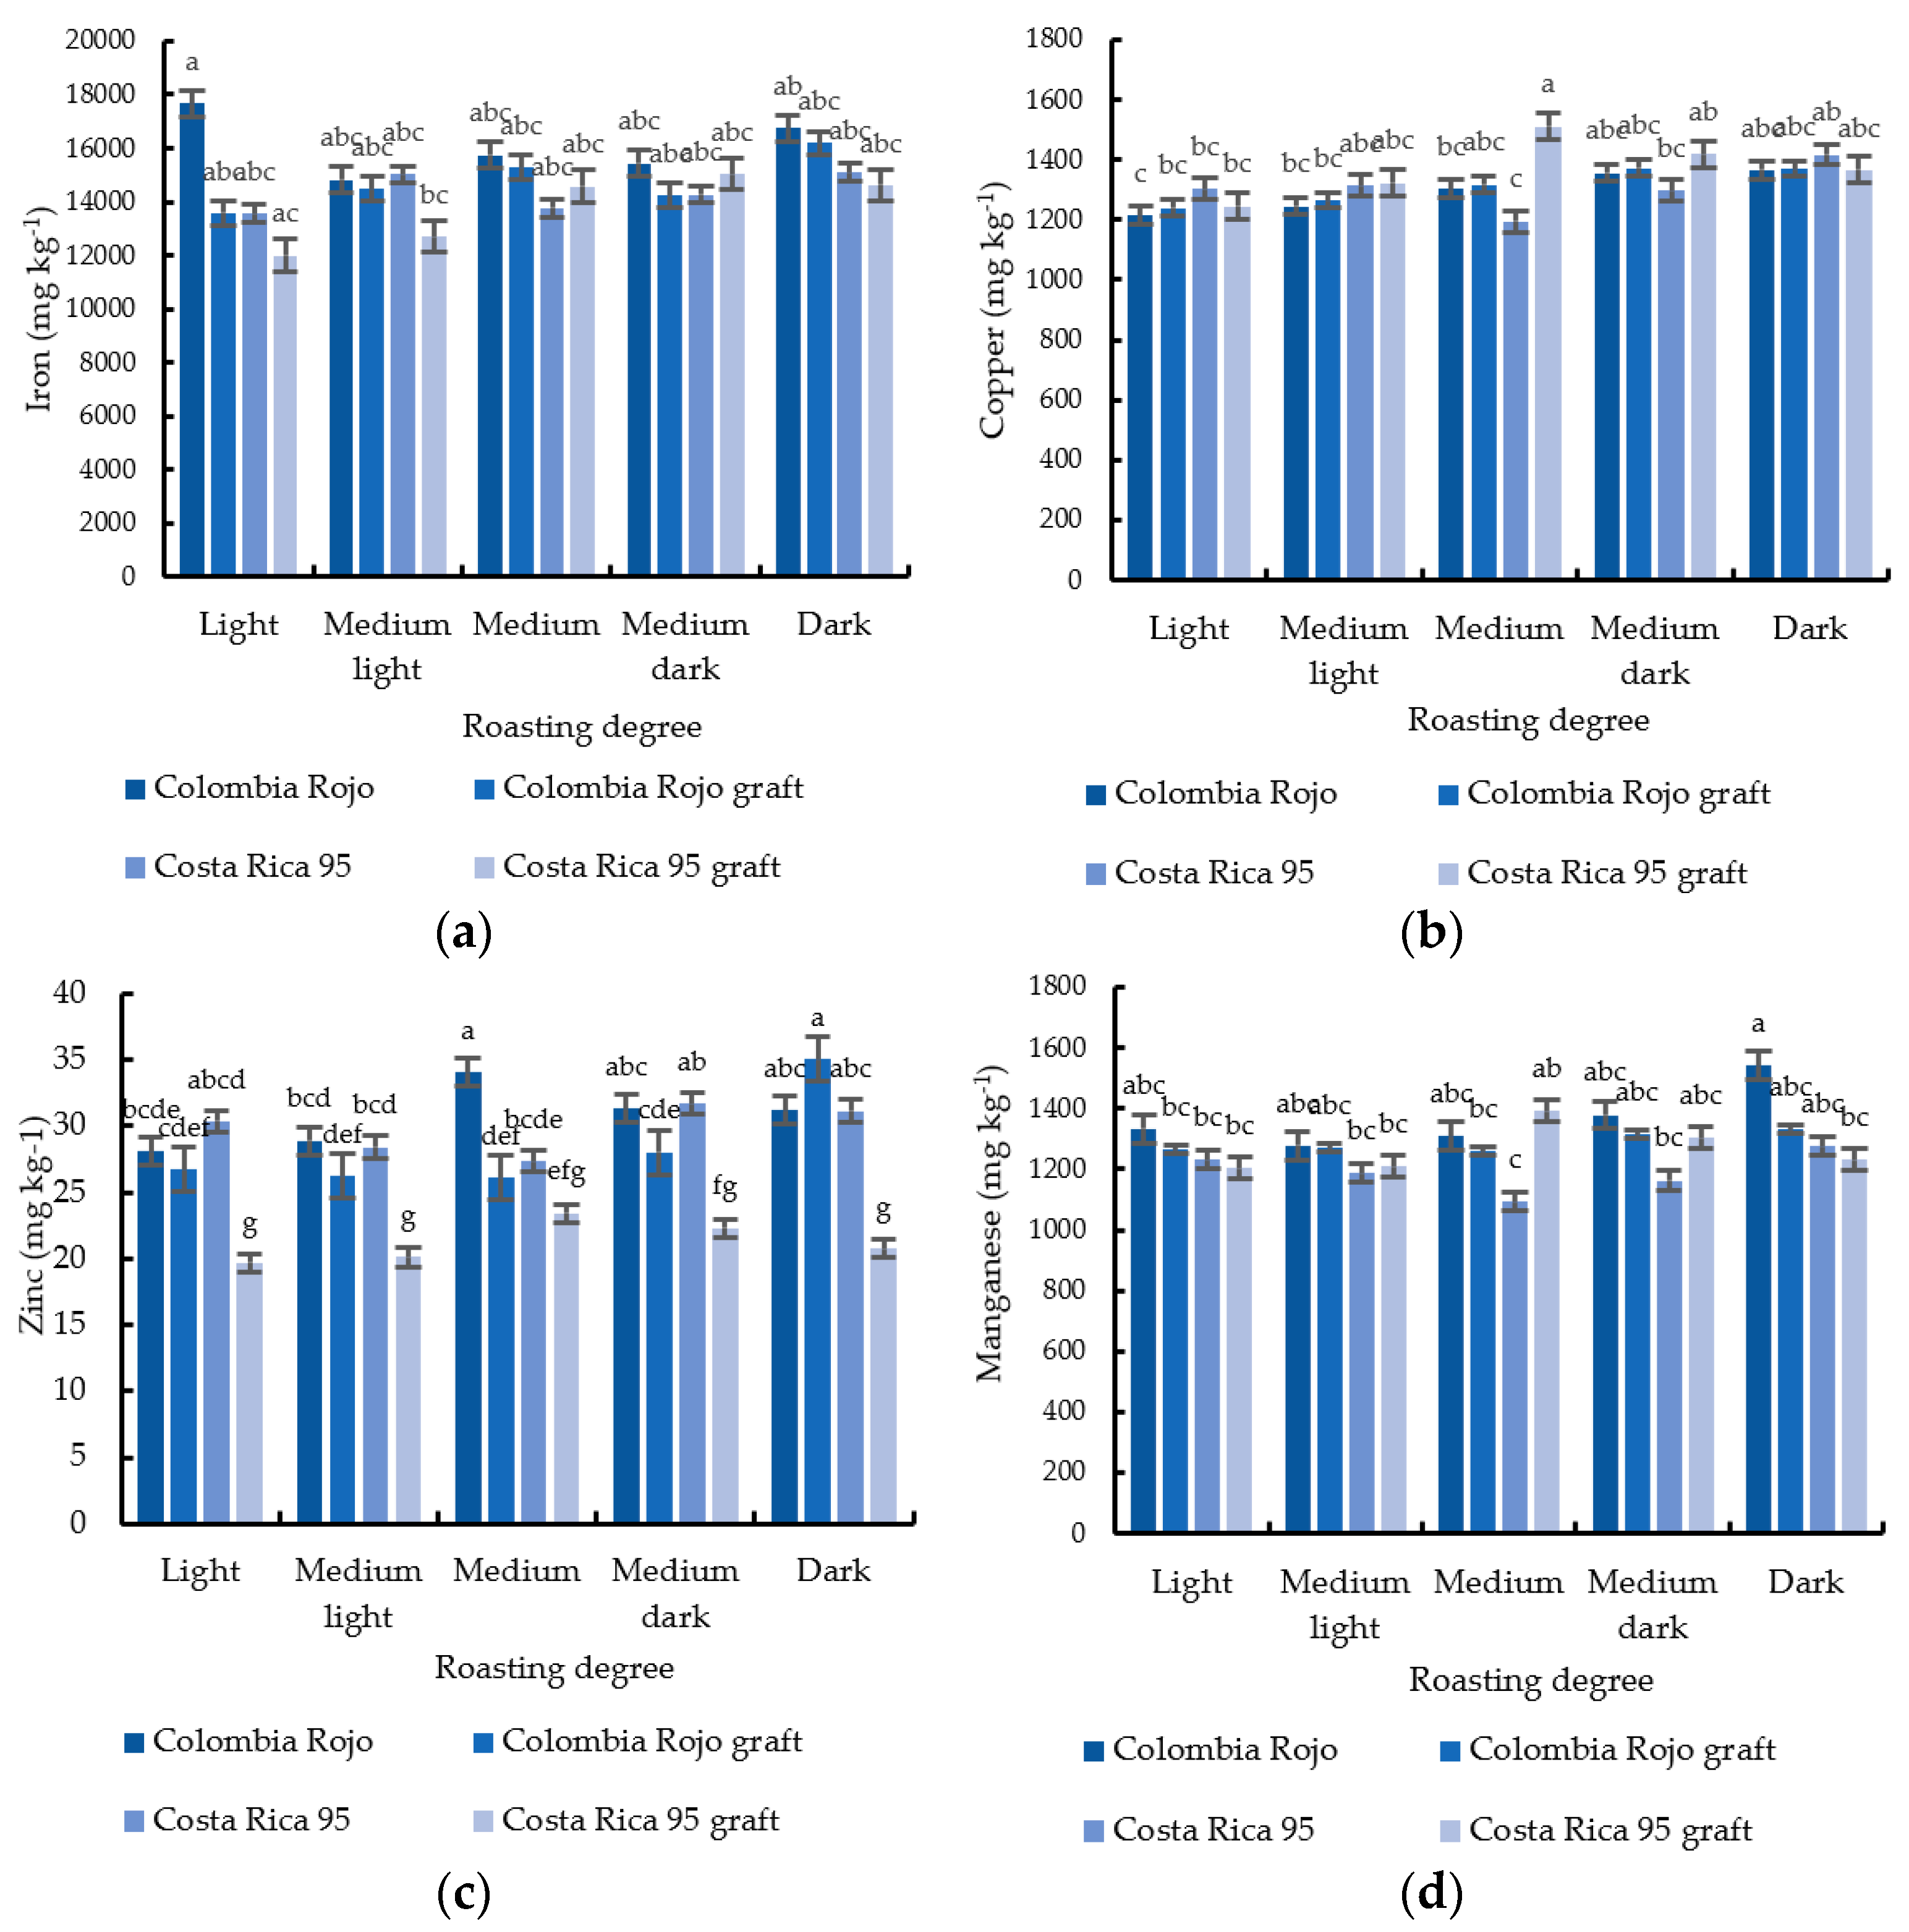
The content of micronutrients, influenced by the interaction factor between coffee variety and roasting level, presented significant statistical differences between treatments. The highest concentrations were observed as follows: Fe (Figure 4a) in the Colombia Rojo variety with the light roasting level; Cu (Figure 4b) in the Costa Rica 95 variety with medium roasting; Zn (Figure 4c) in the Colombia Rojo variety with medium roasting; and Mn (Figure 4d) in the Colombia Rojo variety with dark roasting. Bo did not follow this trend since there were no significant statistical differences between the treatments.

4. Discussion

The differences in the contents of caffeine and chlorogenic acid between the pure varieties and the grafts may be due to the fact that the gene expression of the rootstock influences the gene expression of the scion. The author of [13] observed in orange tree plants that the molecular mechanism underlying dwarfism was mainly reflected in genes responsible for phytohormone metabolism, nitrogen (N) metabolism, carbon (C) metabolism, and photosynthesis in scions and rootstocks. They also observed that grafting affected the difference in the expression of secondary metabolism genes, such as some genes related to phenylpropanoid and flavonoid biosynthesis.
The content of metabolites in the fruit can also be affected by this factor. Mehic et al. [14] studied the influence of rootstock on sweet cherry fruit quality and found that rootstock genotype and cultivar/rootstock interaction influenced the phenolic profile of sweet cherry fruit. They also reported that there were significant differences between rootstocks regarding their individual polyphenol content.
The highest concentration of acrylamide was found in the Colombia Rojo graft variety, according to the author of [15]. The differences in acrylamide concentration observed between arabica and canephora coffee varieties could be because robusta coffee varieties contain higher concentrations of amino acids and sugars, and the decomposition of sucrose in coffee during heating and oxidation of lipids are the main sources of carbonyl compound formation, which is essential for the conversion of asparagine into acrylamide [16]. Although no pure strains of C. canephora were studied, it is important to emphasize that in the observed cases, the differences between pure strains and grafts could be due to plastid genome transfer at the graft junctions. Nucleic acids, such as microRNAs, are known to be systematically propagated through the phloem via plasmodesmata. While these intercellular plastid channels normally only allow the transit of small molecules, plasmodesmata are likely responsible for lateral gene transport in grafts [17].
The increase in caffeine content in darker roast beans could be mainly attributed to their caffeine thermostability and mass loss of thermolabile compounds during the roasting process [18]. Consistent with this work, caffeine levels were higher in the early roasting degrees but decreased significantly from light, medium light, and medium to medium dark roast coffees. As the temperature increased to higher levels (dark roast), the caffeine concentration decreased, which could be a result of caffeine sublimation at higher temperatures during roasting [19].
Among the chlorogenic acids, 5-caffeoylquinic acid (5-CQA) was found in greater proportion in the grafted coffee beans of the Colombia Rojo variety (3.09 mg g−1) and the Costa Rica variety (3.04 mg g−1). During the roasting process of coffee beans, reactions occur between their components. Notable changes include decreases in polysaccharides, proteins, chlorogenic acids, and trigonelline; degradation of sucrose; increase in ash; and the formation of melanoidins [20].
These differences between varieties are probably because some edaphoclimatic growing conditions, such as altitude, modify the characteristics of coffees, such as their composition [21,22]. The degree of roasting modifies the chlorogenic acid content. It has been observed that the higher the degree of roasting, the lower the chlorogenic acid content because these compounds undergo thermal degradation as the roasting temperature increases. This is because high temperatures during the roasting process can lead to the breakdown of carbon–carbon bonds in the structure of chlorogenic acids, leading to thermal degradation and isomerization of the structures of chlorogenic acids [23].
This may occur during the roasting of coffee beans because acrylamide forms rapidly in the early stages of coffee roasting. This coincides with the depletion of free asparagine, causing the concentration of acrylamide to peak before the first crack, potentially exceeding 1000 µg/kg. As roasting continues and asparagine is depleted, the acrylamide concentration starts to decrease rapidly because it contains an electrophilic vinyl group, making it highly reactive [16].
When analyzing the effect of the interaction factor between coffee variety and roasting degree on the micronutrient content, the highest concentrations were observed as follows: Fe in the Colombia Rojo variety with a light roasting degree; Cu in Costa Rica 95 with a medium roast; Zn in the Colombia Rojo variety with a medium roast; and Mn in the Colombia Rojo variety with a dark roast. Fe was the fourth most abundant mineral found in the coffee samples, followed by Mn, Cu, and Zn, as described by other authors [24].
The differences between the pure and grafted varieties could be because, in grafted plants, RNA molecules are highly transmissible between adjacent cells and throughout the plant, transported by the plant plasmodesmata [17]. The author of [25] reported that in grafting, the long-distance movement of mRNA from the rootstock to the shoots of the graft scions (grafted variety) can cause visible changes in the morphology of the leaves of the latter. This indicates that translocated RNAs are functional; not only can they be transported over long distances via phloem binding in the graft, but they also act as signal molecules that regulate growth and development, generating resistance to stress in remote cells or tissues and resulting in changes in plant traits, rootstocks, and scions [26].
It was observed that N and K were the main minerals found in coffee beans, followed by Mg and Ca. According to the author of [27], after nitrogen, potassium (K) is the most accumulated nutrient in the fruits of the coffee plant, because K is related to the enzymatic activation of several metabolic processes, such as photosynthesis, protein and carbohydrate synthesis, and the maintenance of cell turgor. It is also directly related to the transport of sugars from the source to the fruits.
According to the findings of the author of [24], the mineral content found in coffee is not affected by the degree of roasting, which is why the greatest variation occurs in macro- and micronutrients. For example, arabica coffees present high concentrations of K, Na, Ca, Mg, Mn, and Fe [28]; however, the contents of P and Cu in robusta coffee are higher than in arabica coffees [29]. Therefore, the quality of coffee is directly related to the chemical composition of roasted beans, which is influenced by variety, origin, and climate [30].

5. Limitations

The implementation of the method for acrylamide quantification was developed and validated by the authors; however, the method has not yet been published for reproducibility.
The reproducibility of the culture is another limitation, since the edaphoclimatic conditions of the area are difficult to replicate.

6. Conclusions

This study observed a relationship between coffee varieties and roasting degree of coffee beans when macro- and micronutrients, caffeine, and chlorogenic acid levels were assessed. The highest concentrations of these compounds were found in the Colombia Rojo coffee variety. The use of the Colombia Rojo graft coffee variety, along with medium and dark roasted coffee beans, resulted in the highest concentrations of caffeine. Light roasting of coffee beans resulted in the highest chlorogenic acid content, while medium dark roasting resulted in the highest concentrations of caffeine. Medium dark and dark roasting of coffee beans produced the highest concentrations of acrylamide, so this type of roasting is not recommended, confirming the relationship between coffee varieties and the degree of roasting of their beans.

Author Contributions

Conceptualization, M.C.P.-S., T.M.-G. and O.C.-C.; Methodology, M.C.P.-S., T.M.-G. and M.C.-M.; Software, J.G.V.-P. and J.E.B.-M.; Validation, T.M.-G. and L.A.S.-B.; Investigation, M.C.P.-S., L.A.S.-R., M.E.M.-L., R.U.-S. and M.C.P.-S.; Resources, M.C.P.-S., R.U.-S. and T.M.-G.; Data curation, J.G.V.-P. and J.E.B.-M.; Writing—original draft, M.C.P.-S. and T.M.-G.; Writing—review and editing, T.M.-G., O.C.-C., J.G.V.-P., R.U.-S., C.G.-B., L.A.S.-B. and M.C.P.-S.; Visualization, O.C.-C., M.E.M.-L. and M.C.P.-S.; Supervision, T.M.-G., M.C.-M., O.C.-C., J.E.B.-M., M.E.M.-L. and M.C.P.-S.; Funding acquisition, M.C.P.-S. and T.M.-G. All authors have read and agreed to the published version of the manuscript.

Funding

This research received no external funding.

Institutional Review Board Statement

Not applicable.

Informed Consent Statement

Not applicable.

Data Availability Statement

The data presented in this study are available on request from the corresponding author. The data are not publicly available due to privacy and ethical reasons.

Acknowledgments

During the preparation of this manuscript, the authors used ChatGPT, version GPT-5.4 (7 May 2026), for the purposes of generate the graphical summary. The authors have reviewed and edited the output and take full responsibility for the content of this publication.

Conflicts of Interest

The authors declare no conflicts of interest.

Appendix A

Table A1. Summary of ANOVA parameter values (α = 0.05) for the effects of variety and roasting degree on each measured response variable. * Significant; ** Very significant; *** Highly significant.
Response VariableSourceDF *Adj. SS **Adj. MS ***F-Valuep-Value
CaffeineVariety30.16580.0553247.380.000
Roasting40.29320.0733327.980.000
Interaction120.27410.0228102.170.000
Chlorogenic acidsVariety31.65660.55220840.510.000
Roasting47.39531.848832814.130.000
Interaction121.08540.09045137.670.000
AcrylamideVariety3332,402110,801159,342.920.000
Roasting461,88415,47122,248.820.000
Interaction1211,9069921426.850.000
NVariety31.2150.40503.740.016
Roasting42.3500.58755.420.001
Interaction127.5680.63075.820.000
PVariety397.49232.497325.160.000
Roasting41.3400.33490.260.903
Interaction1216.5231.37691.070.404
KVariety331,11610,3721.510.222
Roasting435,75289381.300.281
Interaction12140,27911,6901.700.090
CaVariety321.127.041316.570.000
Roasting415.213.80248.950.000
Interaction1236.253.02097.110.000
FeVariety357,757,86619,252,6225.900.001
Roasting422,125,9985,531,4991.700.163
Interaction1251,498,7224,291,5601.320.234
CuVariety370,69623,5654.100.010
Roasting4179,88744,9727.830.000
Interaction12208,32617,3603.020.002
ZnVariety31108.0369.323106.200.000
Roasting4144.836.19210.410.000
Interaction12266.722.2246.390.000
MnVariety3322,343107,4489.900.000
Roasting4109,08927,2722.510.051
Interaction12258,19921,5171.980.042

Appendix B

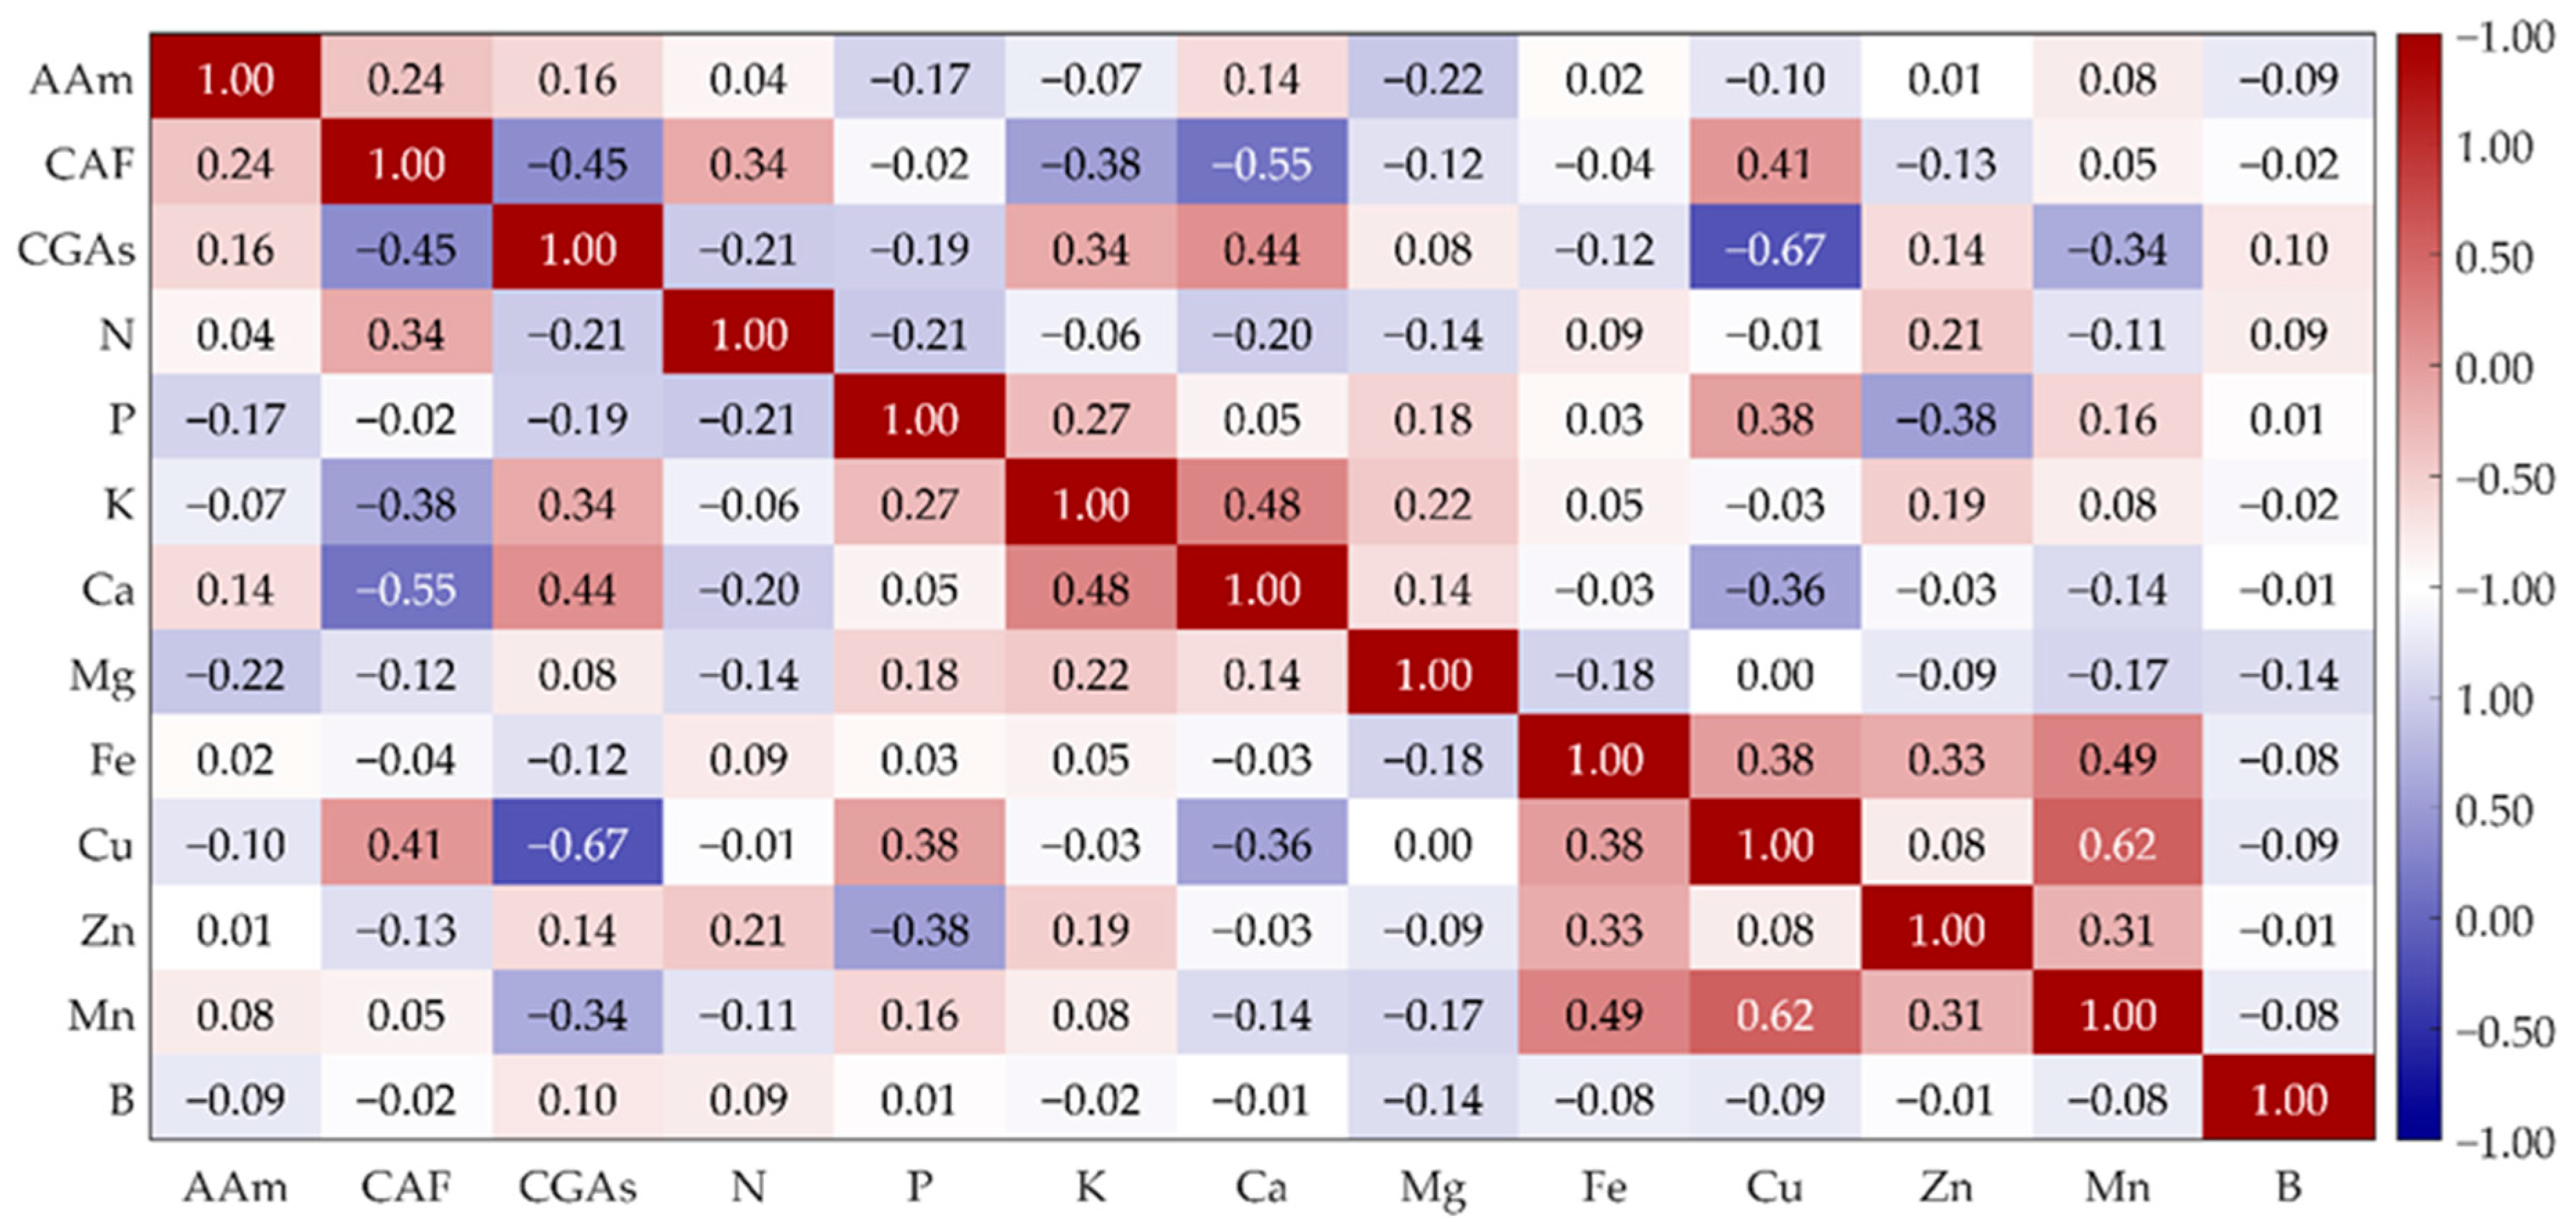
Figure A1. Pearson correlation matrix between the thirteen variables measured in the study.
Beverages 12 00040 g0a1
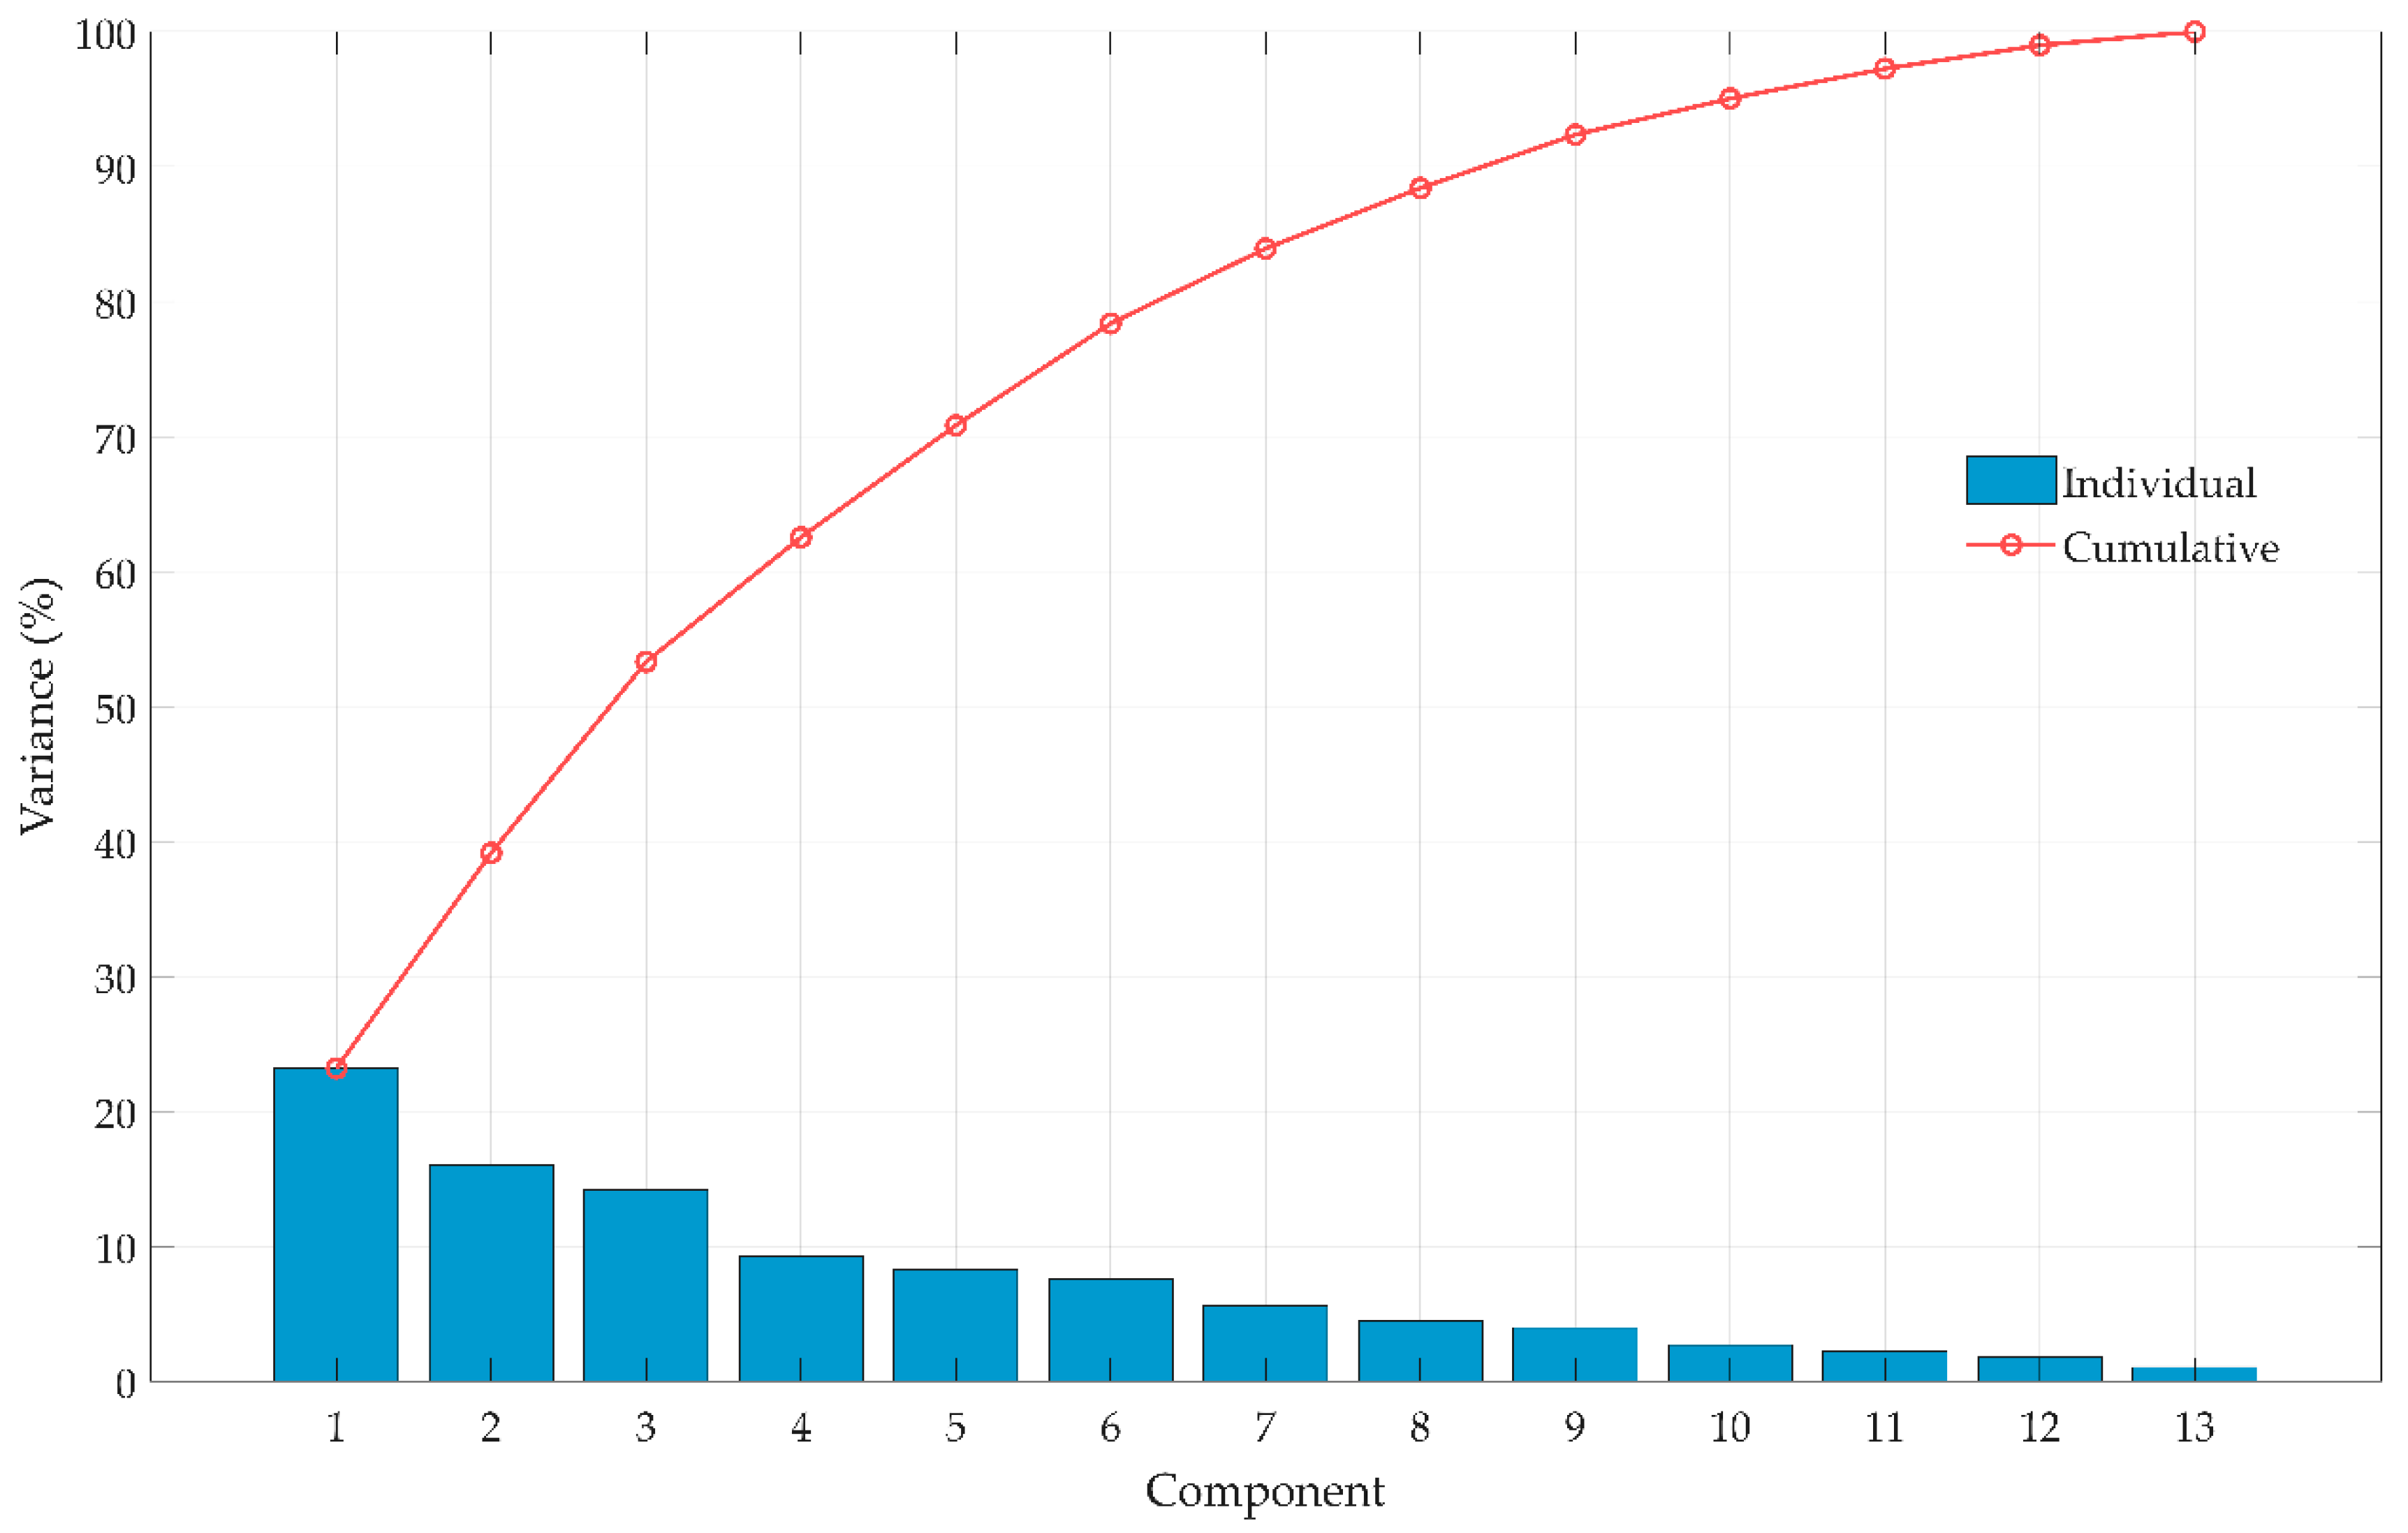
Figure A2. Scree plot of the principal component analysis. The eigenvalues of the first six principal components were 3.0119, 2.0772, 1.8406, 1.1991, 1.0786, and 0.98202, respectively.
Beverages 12 00040 g0a2

References

  1. ICO, International Coffee Organization. Coffee Report and Outlook; International Coffee Organization: London, UK, 2023; Available online: https://icocoffee.org/documents/cy2023-24/Coffee_Report_and_Outlook_December_2023_ICO.pdf (accessed on 18 November 2025).
  2. Yeager, S.E.; Batal, M.E.; Guinar, J.X.; Ristenpar, W.D. Acids in coffee: A review of sensory measurements and meta-analysis of chemical composition. Crit. Rev. Food Sci. Nutr. 2021, 63, 1010–1036. [Google Scholar] [CrossRef]
  3. Govindaraju, I.; Sana, M.; Chakraborty, I.; Rahman, M.H.; Biswas, R.; Mazumder, N. Dietary acrylamide: A detailed review on formation, detection, mitigation, and its health impacts. Foods 2024, 13, 556. [Google Scholar] [CrossRef] [PubMed]
  4. Rocha-da Costa, C.A.; Soares-Pinheiro, F.; Malaquias-da Silva, L.G.; Oliveira-da Silva, F.M.; Uria-Toro, M.J. Evaluation of physicochemical properties, bioactive compounds, and antioxidant activity in traditional and decaffeinated coffee blends from the Cerrado Mineiro Region in Brazil. Food Humanit. 2024, 3, 100388. [Google Scholar] [CrossRef]
  5. Rojas-González, A.; Figueroa-Hernández, C.Y.; González-Rios, O.; Suárez-Quiroz, M.L.; González-Amaro, R.M.; Hernández-Estrada, Z.J.; Rayas-Duarte, P. Coffee Chlorogenic Acids Incorporation for Bioactivity Enhancement of Foods: A Review. Molecules 2022, 27, 3400. [Google Scholar] [CrossRef] [PubMed] [PubMed Central]
  6. Rivera-Rojo, C.R. Competitiveness of the Mexican coffee in international trade: A comparative analysis with Brazil, Colombia, and Peru (2000–2019). Anál. Econ. 2022, 37, 181–199. [Google Scholar] [CrossRef]
  7. Escamilla-Prado, E.; Libert-Amico, A.; Bolaños-González, M.A. Las Variedades de Café en México ante el Desafío de la Roya; Colegio de Postgraduados: Texcoco, Mexico, 2021. [Google Scholar]
  8. WCR, World Coffee Research. Catálogo de Variedades de Café; World Coffee Research: Santa Ana, El Salvador, 2025; Available online: https://varieties.worldcoffeeresearch.org/es (accessed on 19 August 2025).
  9. Sánchez-González, E.; Muñoz, J. Manejo de Meloidogyne incognita mediante injerto de Coffea arabica en Coffea canephora, Oxamilo y Trichoderma atroviride. Cienc. Agropecu. 2022, 34, 3–47. [Google Scholar]
  10. Coffee Association of America (SCAA). Protocols and Best Practices. Available online: https://www.scith.coffee/wp-content/uploads/2021/03/SCA-Protocols-_-Best-Practices.pdf (accessed on 12 January 2024).
  11. NMX-F-182-SCFI-2011; Café—Determinación del Contenido de Cafeína—Método por Cromatografía Líquida de Alta Resolución (Método de Referencia). Diario Oficial de la Federación: Ciudad de Mexico, Mexico, 2011.
  12. Alcántar-González, G.; Sandoval-Villa, M. Manual de Análisis Químico de Tejido Vegetal: Guía de Muestreo, Preparación, Análisis e Interpretación, 1st ed.; Publicación Especial Núm. 10; Sociedad Mexicana de la Ciencia del Suelo: Chapingo, Mexico, 1999; 156p. [Google Scholar]
  13. Li, Q.; Gao, Y.; Wang, K.; Feng, J.; Sun, S.; Lu, X.; Liu, Z.; Zhao, D.; Li, L.; Wang, D. Transcriptome analysis of the effects of grafting interstocks on apple rootstocks and scions. Int. J. Mol. Sci. 2023, 24, 807. [Google Scholar] [CrossRef]
  14. Mehic, E.; Kazazic, M.; Djapo-Lavic, M.; Aliman, J. Influence of rootstock/cultivar combinations on bioactive compounds in sweet cherry fruits. J. Agric. For. 2023, 69, 31–40. [Google Scholar] [CrossRef]
  15. Bertuzzi, T.; Martinelli, A.; Mulazzi, S.; Rastelli, S. Acrylamide determination during an industrial roasting process of coffee and the influence of asparagine and low molecular weight sugars. Food Chem. 2020, 303, 125372. [Google Scholar] [CrossRef]
  16. Kocadağlı, T.; Gökmen, V. Formation of acrylamide in coffee. Curr. Opin. Food Sci. 2022, 45, 100842. [Google Scholar] [CrossRef]
  17. Kragler, F.; Bock, R. The biology of grafting and its applications in studying information exchange between plants. Nat. Plants 2025, 11, 955–966. [Google Scholar] [CrossRef] [PubMed]
  18. Mehaya, F.M.; Mohammad, A.A. Thermostability of bioactive compounds during roasting process of coffee beans. Heliyon 2020, 6, e05508. [Google Scholar] [CrossRef]
  19. Rusinek, R.; Dobrzański, B., Jr.; Oniszczuk, A.; Gawrysiak-Witulska, M.; Siger, A.; Karami, H.; Ptaszyńska, A.A.; Żytek, A.; Kapela, K.; Gancarz, M. How to Identify Roast Defects in Coffee Beans Based on the Volatile Compound Profile. Molecules 2022, 27, 8530. [Google Scholar] [CrossRef] [PubMed]
  20. Tsai, C.F.; Jioe, I.P.J. The analysis of chlorogenic acid and caffeine content and its correlation with coffee bean color under different roasting degree and sources of coffee (Coffea arabica typica). Processes 2021, 9, 2040. [Google Scholar] [CrossRef]
  21. Guyot, B.; Gueule, D.; Manez, J.C.; Perriot, J.J.; Giron, J.; Villain, L. Influence de l’altitude et de l’ombrage sur la qualité des cafés Arabica. Plant. Rech. Dév. 1996, 3, 272–283. [Google Scholar]
  22. Bratz-Simmer, M.M.; Soares-da Silva, M.C.; Louzada-Pereira, L.; Rizzo-Moreira, T.; Carvalho-Guarçoni, R.; Gomes-Reis Veloso, T.; Réboli-da Silva, I.M.; Lorenzoni-Entringer, T.; Megumi-Kasuya, M.C.; Rodrigues-da Luz, J.M.; et al. Edaphoclimatic conditions and the soil and fruit microbiota influence on the chemical and sensory quality of the coffee beverage. Eur. Food Res. Technol. 2022, 248, 2941–2953. [Google Scholar] [CrossRef]
  23. Awwad, S.; Issa, R.; Alnsour, L.; Albals, D.; Al-Momani, I. Quantification of caffeine and chlorogenic acid in green and roasted coffee samples using HPLC-DAD and evaluation of the effect of degree of roasting on their levels. Molecules 2021, 26, 7502. [Google Scholar] [CrossRef]
  24. Kalschne, D.L.; Silva, N.K.; Canan, C.; Benassi, M.T.; Flores, E.L.M.; Leite, O.D. Main minerals and organic compounds in commercial roasted and ground coffee: An exploratory data analysis. Quim. Nova 2021, 44, 70–75. [Google Scholar] [CrossRef]
  25. Saballa, A.; Xanthopoulou, A.; Madesis, P.; Tsaftaris, A.; Nianiou-Obeidat, I. Vegetable grafting from a molecular point of view: The involvement of epigenetics in rootstock-scion interactions. Front. Plant Sci. 2021, 11, 621999. [Google Scholar] [CrossRef]
  26. Li, W.; Chen, S.; Liu, Y.; Wang, L.; Jiang, J.; Zhao, S.; Fang, W.; Chen, F.; Guan, Z. Long-distance transport RNAs between rootstocks and scions and graft hybridization. Planta 2022, 255, 96. [Google Scholar] [CrossRef]
  27. Santos, C.; Ribeiro-Malta, M.; Marcolino-Gonçalves, G.M.; Meira-Borém, F.; Alexandre-Pozza, A.A.; Prieto-Martinez, H.E.; Lima-de Souza, T.; Teixeira-Chagas, W.F.; Araújo-de Melo, M.E.; Pádua-Oliveira, D. Chloride applied via fertilizer affects plant nutrition and coffee quality. Plants 2023, 12, 885. [Google Scholar] [CrossRef] [PubMed]
  28. Amorim-Filho, V.R.; Wagner, L.P.; Gomes-Neto, J.A. Comparative studies of the sample decomposition of green and roasted coffee for determination of nutrients and data exploratory analysis. J. Braz. Chem. Soc. 2007, 18, 47–53. [Google Scholar] [CrossRef]
  29. Martín, M.J.; Pablos, J.F.; González, A.G. Characterization of arabica and robusta roasted coffee varieties and mixture resolution according to their metal content. Food Chem. 1999, 66, 365–370. [Google Scholar] [CrossRef]
  30. Dippong, T.; Dan, M.; Kovacs, M.H.; Kovacs, E.D.; Levei, E.A.; Cadar, O. Analysis of volatile compounds, composition, and thermal behavior of coffee beans according to variety and roasting intensity. Foods 2022, 11, 3146. [Google Scholar] [CrossRef]
Figure 1. Interaction in the variety factor in the concentration of caffeine (a), chlorogenic acid (b) and acrylamide (c), as well as interaction in the roasting factor in the concentration of caffeine (d), chlorogenic acid (e) and acrylamide (f) in coffee beans with five different roasting degrees in two coffee varieties and their respective grafts. Means ± SE with different letters in each bar indicate significant statistical differences (p ≤ 0.05).
Beverages 12 00040 g001aBeverages 12 00040 g001b
Figure 2. Interaction in the factor variety by roasting degree in the concentration of caffeine (a), chlorogenic acid (b) and acrylamide (c) in coffee beans with five different roasting levels in two coffee varieties and their respective grafts. Means ± SE with different letters in each bar indicate significant statistical differences (p ≤ 0.05).
Beverages 12 00040 g002
Figure 3. Interaction in the variety factor by roasting degree in the concentration of nitrogen (a), phosphorus (b), potassium (c) and calcium (d) in coffee beans with five different roasting levels in two coffee varieties and their respective grafts. Means ± SE with different letters in each bar indicate significant statistical differences (p ≤ 0.05).
Beverages 12 00040 g003
Figure 4. Interaction in the variety factor by roasting degree in the concentration of iron (a), copper (b), zinc (c) and manganese (d) in coffee beans with five different roasting levels in two coffee varieties and their respective grafts. Means ± EE with different letters in each bar indicate significant statistical differences (p ≤ 0.05).
Beverages 12 00040 g004
Table 1. Conditions of coffee beans with five roast levels.
ConditionsLightMedium LightMediumMedium DarkDark
Roasting Degree
Initial temperature (°C)150150160190220
Final temperature (°C)174.81180–190190–210200–220230–240
Initial weight (g)1000.001000.001000.001000.001000.00
Agtron color (Å)75–7070–6565–5858–4545–35
Initial humidity (%)1212121212
Final humidity (%)3.32.51.91.51.3
Disclaimer/Publisher’s Note: The statements, opinions and data contained in all publications are solely those of the individual author(s) and contributor(s) and not of MDPI and/or the editor(s). MDPI and/or the editor(s) disclaim responsibility for any injury to people or property resulting from any ideas, methods, instructions or products referred to in the content.