1. Introduction
As one of the three most popular beverages worldwide, tea’s variety, grade, and quality directly influence consumer experience and market order [
1,
2]. Traditional tea analysis relies on sensory evaluation and chemical detection methods. Sensory evaluation is highly susceptible to subjective factors, while chemical detection techniques (e.g., HPLC, GC-MS) suffer from inherent limitations, including complex operation, time consumption, high cost, and destructive sample preparation [
3,
4]. Near-infrared (NIR) spectroscopy enables the rapid acquisition of information on tea’s chemical composition and physical properties by detecting the overtone and combination band absorption signals of functional groups (e.g., O-H, C-H, N-H) in tea samples. This technique thus fulfills the core requirements of “rapidity, non-destructiveness, and high efficiency” for tea analysis [
5,
6]. With the advancement of biotechnology, DNA molecular marker technology has also been gradually applied to tea traceability [
7]. Although this technology offers high accuracy and strong specificity, it is constrained by complex operation procedures and high costs. Leveraging its unique “molecular fingerprint” characteristic, NIR spectroscopy has been successfully employed for the efficient discrimination of multiple tea varieties. For instance, Liu et al. [
8] combined competitive adaptive reweighted sampling-successive wavelet transform (CARS-SWR) variable optimization with a probabilistic neural network (PNN) model to discriminate five tea varieties (e.g., Meitan Cuiya and Duyun Maojian from Guizhou Province), achieving 100% accuracy on both the training and validation sets with only six characteristic wavelengths required for precise classification. Chen et al. [
4] constructed a random forest (RF) model after compressing NIR spectroscopy (NIRS) data via factor analysis, and the model’s performance was significantly superior to that of GC-MS and HPLC methods. Zhang et al. [
9] established a model based on visible-near-infrared (Vis-NIR) spectroscopy combined with chemometric methods, realizing the accurate detection of component contents in fresh tea leaves. Owing to its advantages of rapidity, non-destructiveness, and simultaneous multi-component detection, NIR spectroscopy has been widely applied in various fields, including agriculture and food [
10,
11], medicine [
12,
13], petrochemical engineering [
14,
15], and textiles [
16,
17].
Current research on the NIR spectral characteristics of tea has primarily focused on tea freshness, flavor type, and geographical origin. In contrast, explorations into tea variety traceability remain relatively limited. For example, Sun et al. [
18] achieved the discrimination of tea freshness by analyzing the NIR spectra of tea samples from different years. Li et al. [
19] realized the discrimination of different green tea varieties using NIR spectroscopy combined with chemometrics. Li et al. [
20] established a geographical origin discrimination model based on NIR spectroscopy, realizing the traceability of domestic green tea origins. Notably, systematic research on the identification of common and confusable tea varieties in the market (e.g., Longjing, Biluochun, Maofeng, and Zhuyeqing) remains relatively limited. More importantly, when constructing such discrimination models, the synergistic effects among the selection of spectral preprocessing methods, feature extraction, dimensionality reduction strategies, and classifier performance have not been systematically compared and optimized. Different preprocessing methods (e.g., MSC, SNV, and derivative processing) exhibit varying effects on eliminating scattering and enhancing spectral features; different dimensionality reduction methods (e.g., PCA, LDA, and SPA) also differ in the friendliness of the retained information to classifiers. Existing studies often adopt a single or only a few combinations, lacking a comprehensive framework to evaluate the optimal combination of each link in the “preprocessing–feature extraction–classification” technical chain, which limits the practical application potential of NIR spectroscopy in the rapid, accurate, and stable traceability of tea varieties.
In this study, four common tea varieties were selected as experimental samples, and their NIR spectral data were collected. Feature spectral screening was then performed to construct tea variety discrimination models. Multiple preprocessing techniques were employed, and various recognition models were established; by comparing their discrimination accuracies, the optimal scheme for tea variety traceability was identified. This study not only provides an efficient approach for the rapid and non-destructive identification of specific tea varieties (e.g., Longjing and Biluochun) but also, more importantly, its systematic methodological comparison framework and conclusions can offer valuable insights for NIR spectral classification research in other agricultural products and even broader fields.
2. Materials and Methods
2.1. Samples and Spectral Acquisition
Four commercially available tea varieties, namely Longjing tea, Maofeng tea, Zhuyeqing tea, and Biluochun tea, were employed as experimental samples. The near-infrared (NIR) absorption spectra of the samples were acquired using an MPA Fourier transform near-infrared (FT-NIR) spectrometer (BRUKER Optik GmbH, Ettlingen, Germany) integrated with OPUS 8.7 analysis software, with an optical path length of 5 mm and a spectral range of 830–2500 nm. For each tea variety, seven independent samples were prepared, and three spectral scans were performed per sample, yielding a total of 84 spectral datasets. Class labels were assigned as follows: Longjing, Maofeng, Zhuyeqing, and Biluochun.
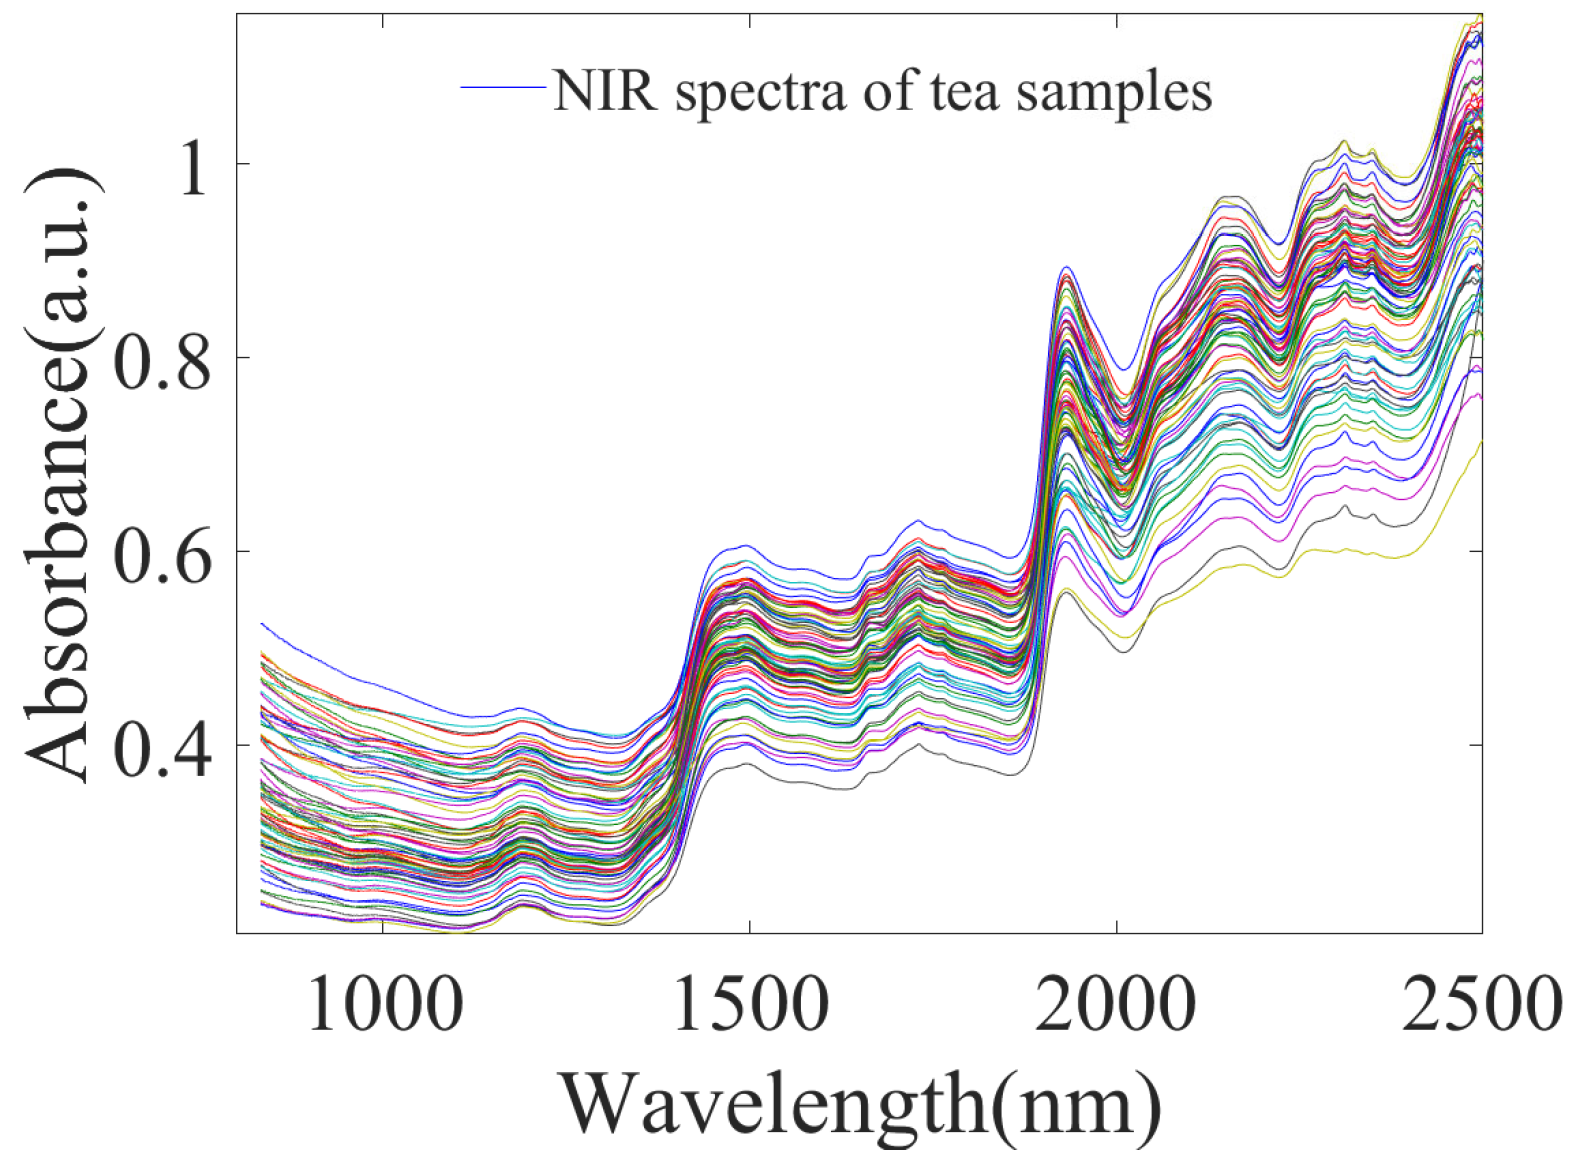
To mitigate class imbalance introduced by data partitioning and ensure equitable model evaluation, stratified sampling was employed to divide the data into training and validation sets. Specifically, samples were stratified according to the four tea varieties (Biluochun, Longjing, Maofeng, and Zhuyeqing). Within each stratum, the samples were randomly shuffled, and approximately 71% were allocated to the training set, with the remaining 29% assigned to the validation set. This resulted in 60 training samples and 24 validation samples in total. A fixed random seed (rng = 42) was used to ensure the reproducibility of the split. Stratified sampling helped maintain consistent class proportions between the training/validation sets and the original dataset, thereby enhancing the training stability of the classification model and the reliability of generalization assessment. The near-infrared absorption spectra of all 84 tea samples are shown in
Figure 1.
2.2. Methodology
2.2.1. Spectral Data Pretreatment
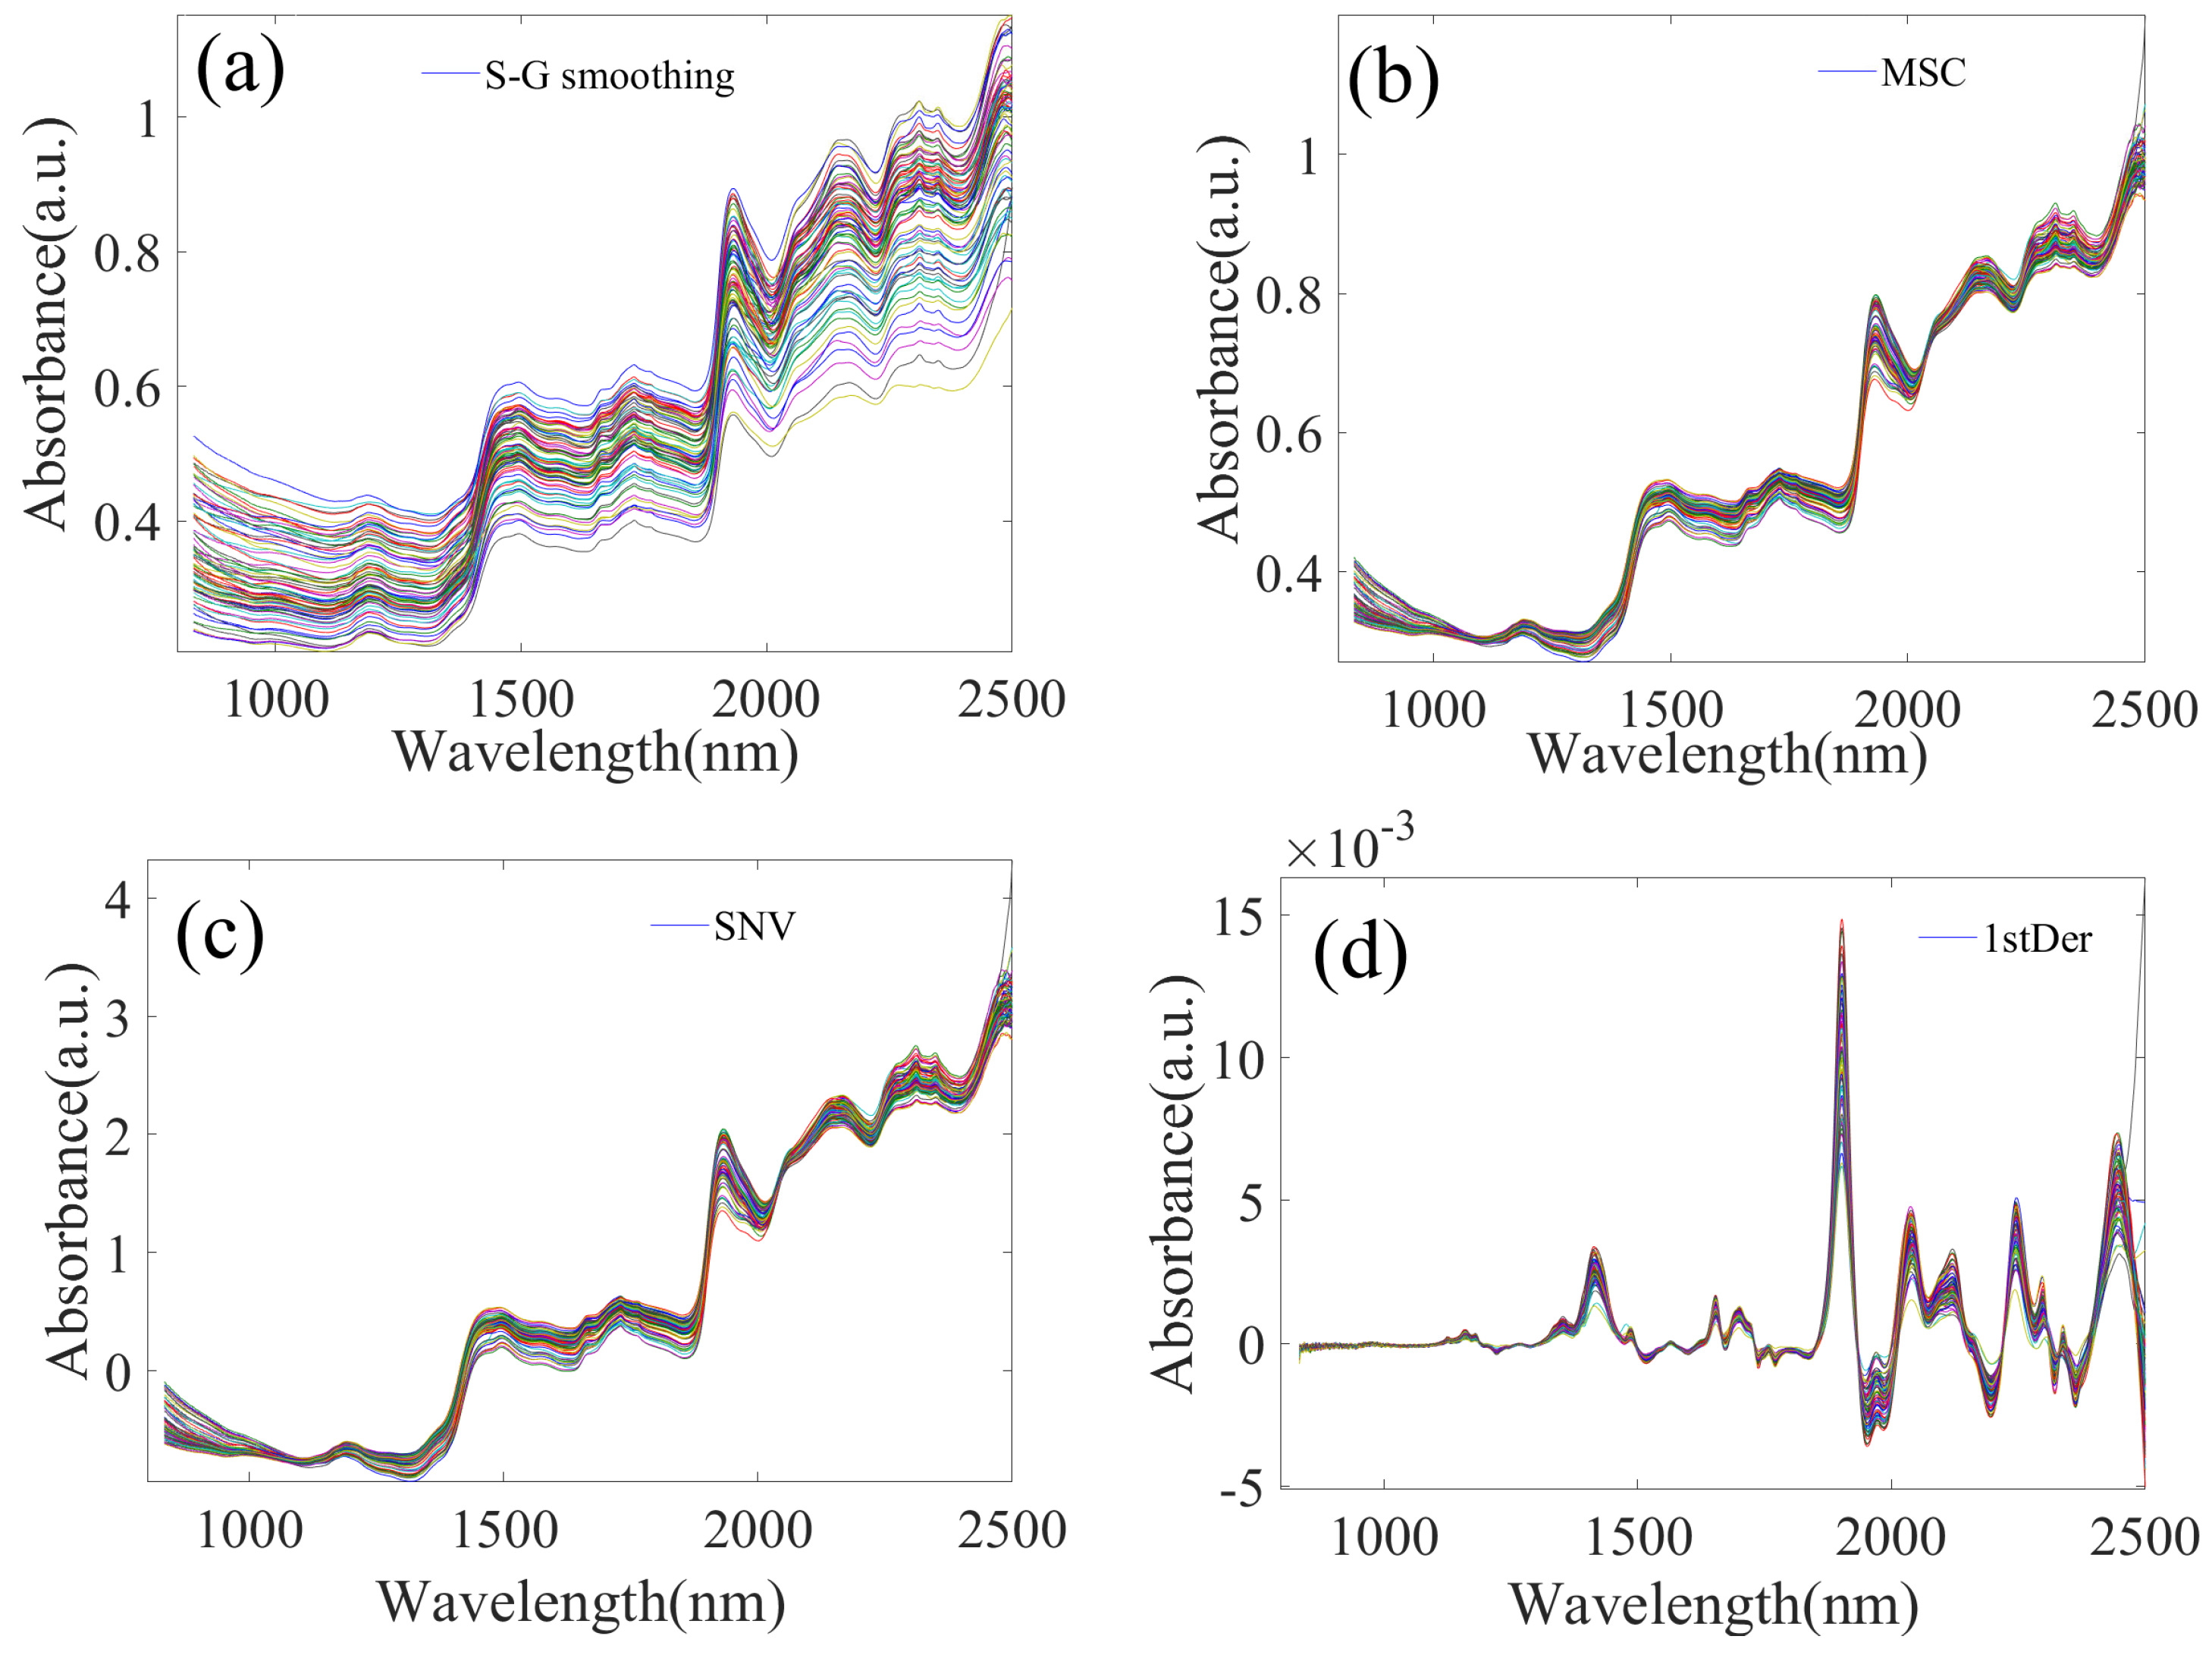
To enhance the quality of spectral data and mitigate interference introduced during spectral acquisition, four preprocessing methods—namely, Savitzky–Golay (S-G) smoothing, multiplicative scatter correction (MSC), standard normal variate (SNV) transformation, and first derivative (1stDer) processing—were applied to the raw spectral data immediately after collection. All preprocessing operations were implemented in MATLAB R2023b (MathWorks, Natick, MA, USA). For S-G smoothing, the window width was set to 11 and the polynomial order to 2. The preprocessed spectra obtained from the raw data are presented in
Figure 2a–d. As illustrated in
Figure 2, application of the preprocessing algorithms effectively corrected spectral artifacts such as baseline drift and scattering, enhanced the stability and repeatability of characteristic signals, reduced the influence of noise and irrelevant information, and enabled the spectral data to more accurately reflect the inherent compositional and structural features of the samples. This, in turn, provided a more reliable data foundation for the subsequent establishment of chemometric models.
2.2.2. Theoretical Background of Characteristic Wavelength Selection
To evaluate the practical utility of different spectral pretreatment methods for tea variety traceability, it was necessary to first build classification models. Given the high dimensionality of the NIR absorption spectral data from the tea samples, failing to reduce dimensions could lead to overfitting in the classification models, negatively impacting the accuracy of tea variety identification. Therefore, before establishing classification models, it was essential to decrease the data dimensionality by filtering out wavelength combinations containing key information from the original high-dimensional spectral data. This paper employed principal component analysis (PCA) and the successive projections algorithm (SPA) for this purpose.
Principal Component Analysis (PCA)
PCA is a classical unsupervised linear dimensionality reduction algorithm. Based on the theory of maximum variance, it orthogonally transforms the original highly correlated variables, generating a new set of mutually uncorrelated variables known as principal components. These components are ranked according to their contribution to variance; the greater the variance, the more original data information they encompass. In practical application, PCA reduces data dimensionality while preserving most of the essential information, removes redundancy and noise, simplifies the data structure, decreases computational load for subsequent analysis, and enhances model robustness and generalizability.
Linear Discriminant Analysis (LDA)
Linear Discriminant Analysis (LDA) is a supervised learning algorithm designed for both dimensionality reduction and classification. Its core principle is to project high-dimensional data onto a lower-dimensional feature space through a linear transformation that maximizes the separability between different classes. Due to this property, LDA is widely applied in fields such as pattern recognition, spectral data analysis, and machine learning. By utilizing class label information to optimize the projection direction, the dimensionality reduction process is directly linked to the classification objective, making LDA particularly suitable for classification tasks. It handles high-dimensional data efficiently with relatively low computational complexity. In spectral analysis, LDA can implicitly highlight feature wavelength information strongly associated with material categories, thereby offering enhanced interpretability.
Mathematically, LDA aims to find a projection vector w that maximizes the ratio of the between-class scatter matrix (
) to the within-class scatter matrix (
). The objective function is defined as
Here, w denotes the projection vector. Maximizing this objective function is equivalent to solving a generalized eigenvalue problem derived from the scatter matrices. Specifically, the eigenvectors corresponding to the k largest eigenvalues form the projection matrix, which maps the high-dimensional data into a k-dimensional subspace (where -1, with C representing the number of classes).
Successive Projections Algorithm (SPA)
SPA seeks variable groups containing minimally redundant information from the spectral data, minimizing collinearity among variables, and significantly reducing the number of variables required for modeling, thereby increasing modeling speed and efficiency. Its core concept lies in vector space projection, calculating the projection length of each spectral vector onto the subspace spanned by previously chosen endpoints. Through iterative calculations, a new variable subset is obtained in each cycle. A linear model is built using this subset, and the root mean square error (RMSE) of the validation set is computed. The variable subset corresponding to the minimum RMSE and its size are considered optimal. RMSE measures the deviation between predicted and true values and is sensitive to 132 outliers in the data. Its calculation formula is as follows:
where
n represents the number of samples,
is the actual value of the
i-th sample (the real tea variety label), and
is the predicted value of the
i-th sample (the output predicted tea variety label from the linear model). A smaller RMSE indicates less deviation between the model’s predictions and the true values, signifying better predictive performance.
2.2.3. Construction of Traceability Models
This study selected two modeling algorithms—MLR and SVMs—to build tea variety traceability models using the extracted characteristic spectral data.
Multiple Linear Regression (MLR)
MLR is a concise, classic statistical analysis method used to establish a linear relationship model between one dependent variable and multiple independent variables. Its fundamental assumption is that the dependent variable
y can be expressed as a linear combination of the independent variables
plus a random error term
:
where
are the regression coefficients to be estimated. In practical application, estimation methods like least squares are used to estimate the regression coefficients based on sample data, minimizing the sum of squared errors between observed and predicted values.
In practical applications, regression coefficients are estimated using sample data via estimation methods such as the least squares (LS) method, aiming to minimize the sum of squared errors between observed sample values and model-predicted values. MLR can be used to predict the values of the dependent variable and analyze the direction and magnitude of the influence of independent variables on the dependent variable. It is widely applied in the field of high-dimensional data analysis, including spectroscopy, biology, and engineering. However, its application requires satisfying several fundamental assumptions, namely linearity, independence, normality, and homoscedasticity.
Support Vector Machines (SVM)
SVMs map original low-dimensional samples to a high-dimensional feature space via kernel functions (e.g., linear, radial basis function (RBF), and polynomial) to find an optimal hyperplane separating different classes. For linearly separable cases, assuming the training dataset is
, where
is the input vector and
is the class label. The corresponding optimization problem is as follows:
where
w is the normal vector of the hyperplane and
b is the intercept. Via the Lagrange multipliers method, this can be transformed into a dual problem for solution:
where
is the Lagrange multiplier. Solving the dual problem gives the optimal solution
, and the optimal hyperplane parameters are calculated as
NIR spectral data are usually characterized by high dimensionality and contain a large amount of wavelength information. SVM is capable of effectively constructing classification or regression models in such high-dimensional spaces, thereby mitigating the curse of dimensionality.
3. Results and Discussion
3.1. Characteristic Wavelength Selection
3.1.1. PCA Dimensionality Reduction Results
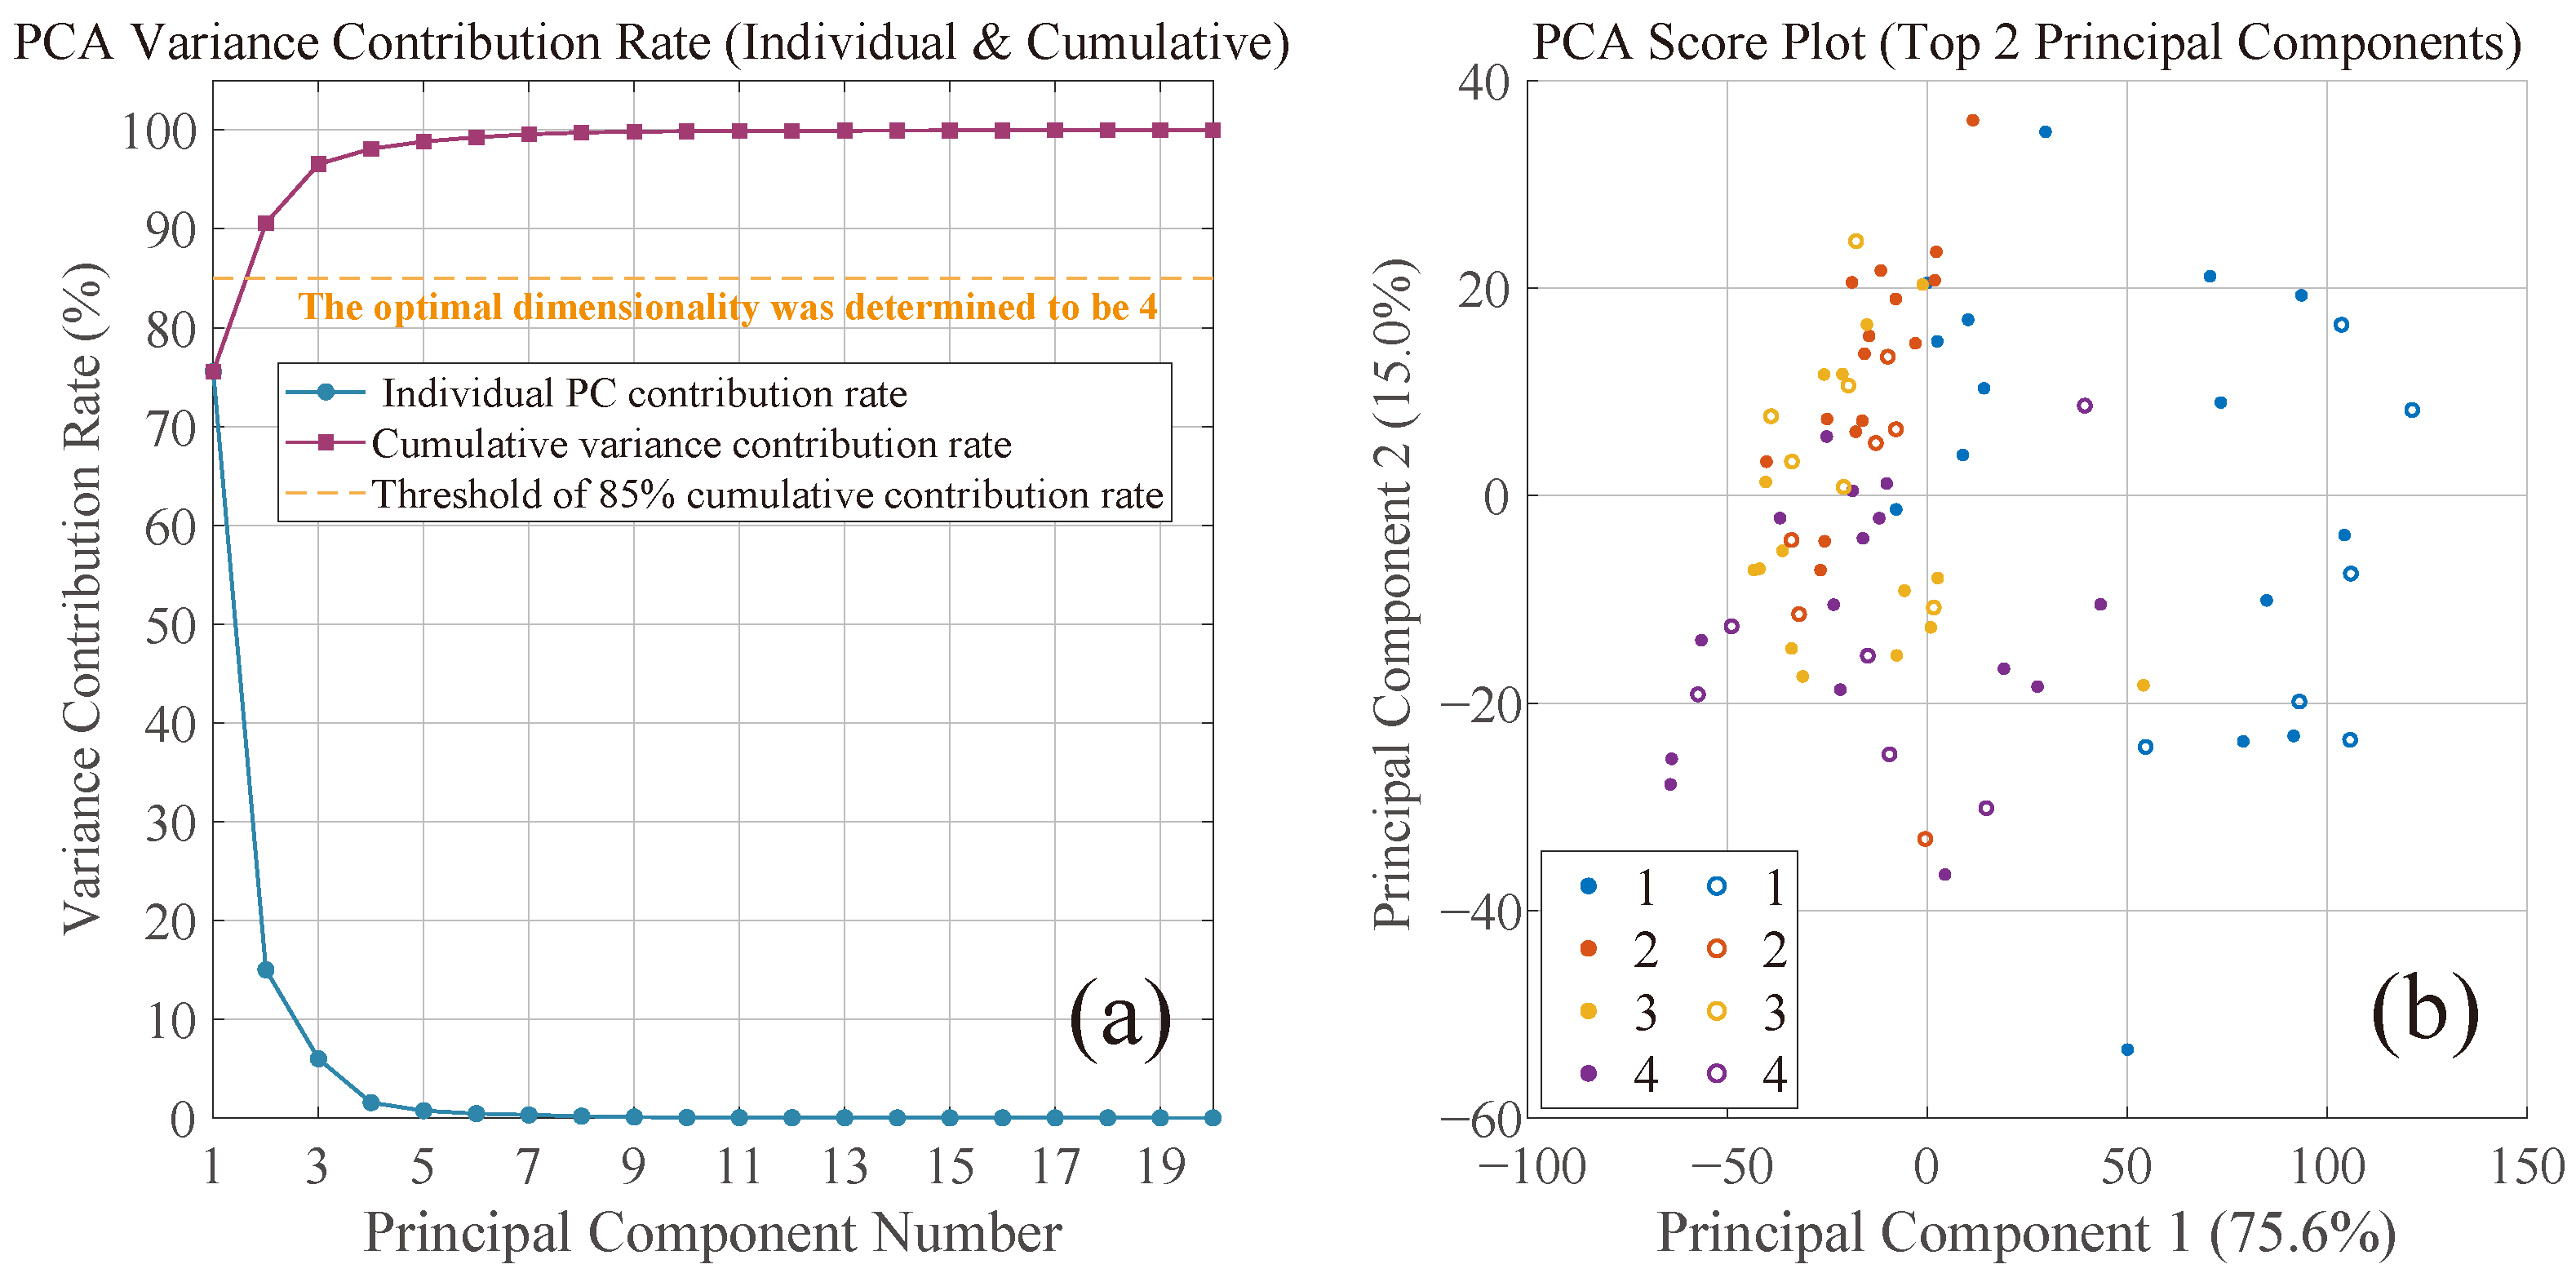
PCA was performed on the spectral data of each category in the training set for feature dimensionality reduction, and the PCA variance contribution rate curve as well as the score plot of the first two principal components (PCs) were generated. Taking the data preprocessed by MSC as an example, its PCA variance contribution rate curve and the score plot of the first two PCs after PCA dimensionality reduction are shown in
Figure 3, where
Figure 3a presents the variation curve of PCA variance contribution rate with the points on the blue curve representing the contribution rate of individual PCs and those on the purple curve representing the cumulative contribution rate, and
Figure 3b shows the scores of the first two PCs of the MSC-preprocessed data after PCA dimensionality reduction. Numbers 1, 2, 3, and 4 in
Figure 3b correspond to the classification labels of four tea varieties, namely Biluochun, Longjing, Maofeng, and Zhuyeqing, respectively. Solid dots represent training set samples, whereas hollow circles stand for test set samples.
As can be seen from
Figure 3a, the contribution rate of individual principal components (blue curve) decreased gradually, while the cumulative contribution rate curve (purple curve) increased with the number of principal components. The first principal component (PC1) exhibited the highest contribution rate (approximately 75%, corresponding to the value of 75.6% for PC1 in
Figure 3b) and thus served as the core contributor; the contribution rate of the second principal component (PC2) dropped sharply (approximately 15%, corresponding to the value of 15.0% for PC2 in
Figure 3b) and functioned as an auxiliary contributor; the contribution rates of the third and fourth principal components were extremely low (approximately 5% and 3%, respectively) and could be regarded as supplementary contributors; the contribution rates of subsequent principal components approached nearly zero (<1%), indicating that these components primarily reflected noise or irrelevant information (e.g., measurement errors, minor individual differences among samples). Therefore, the optimal dimensionality was determined as n = 4, which simultaneously satisfied the requirements for the effectiveness (preservation of key information) and efficiency (dimensionality reduction) of PCA-based dimensionality reduction.
The PCA score plot shown in
Figure 3b reveals a certain clustering tendency among the four tea varieties in the PC1–PC2 space, indicating that the preprocessed spectral data exhibit structural differences in the low-dimensional subspace. However, as an unsupervised dimensionality reduction technique, PCA determines its principal component directions by maximizing the overall variance of the data, which does not necessarily align with the discriminative directions most conducive to class separation. Therefore, the clustering observed in the PCA score plot alone is insufficient to fully demonstrate its effectiveness for classification purposes.
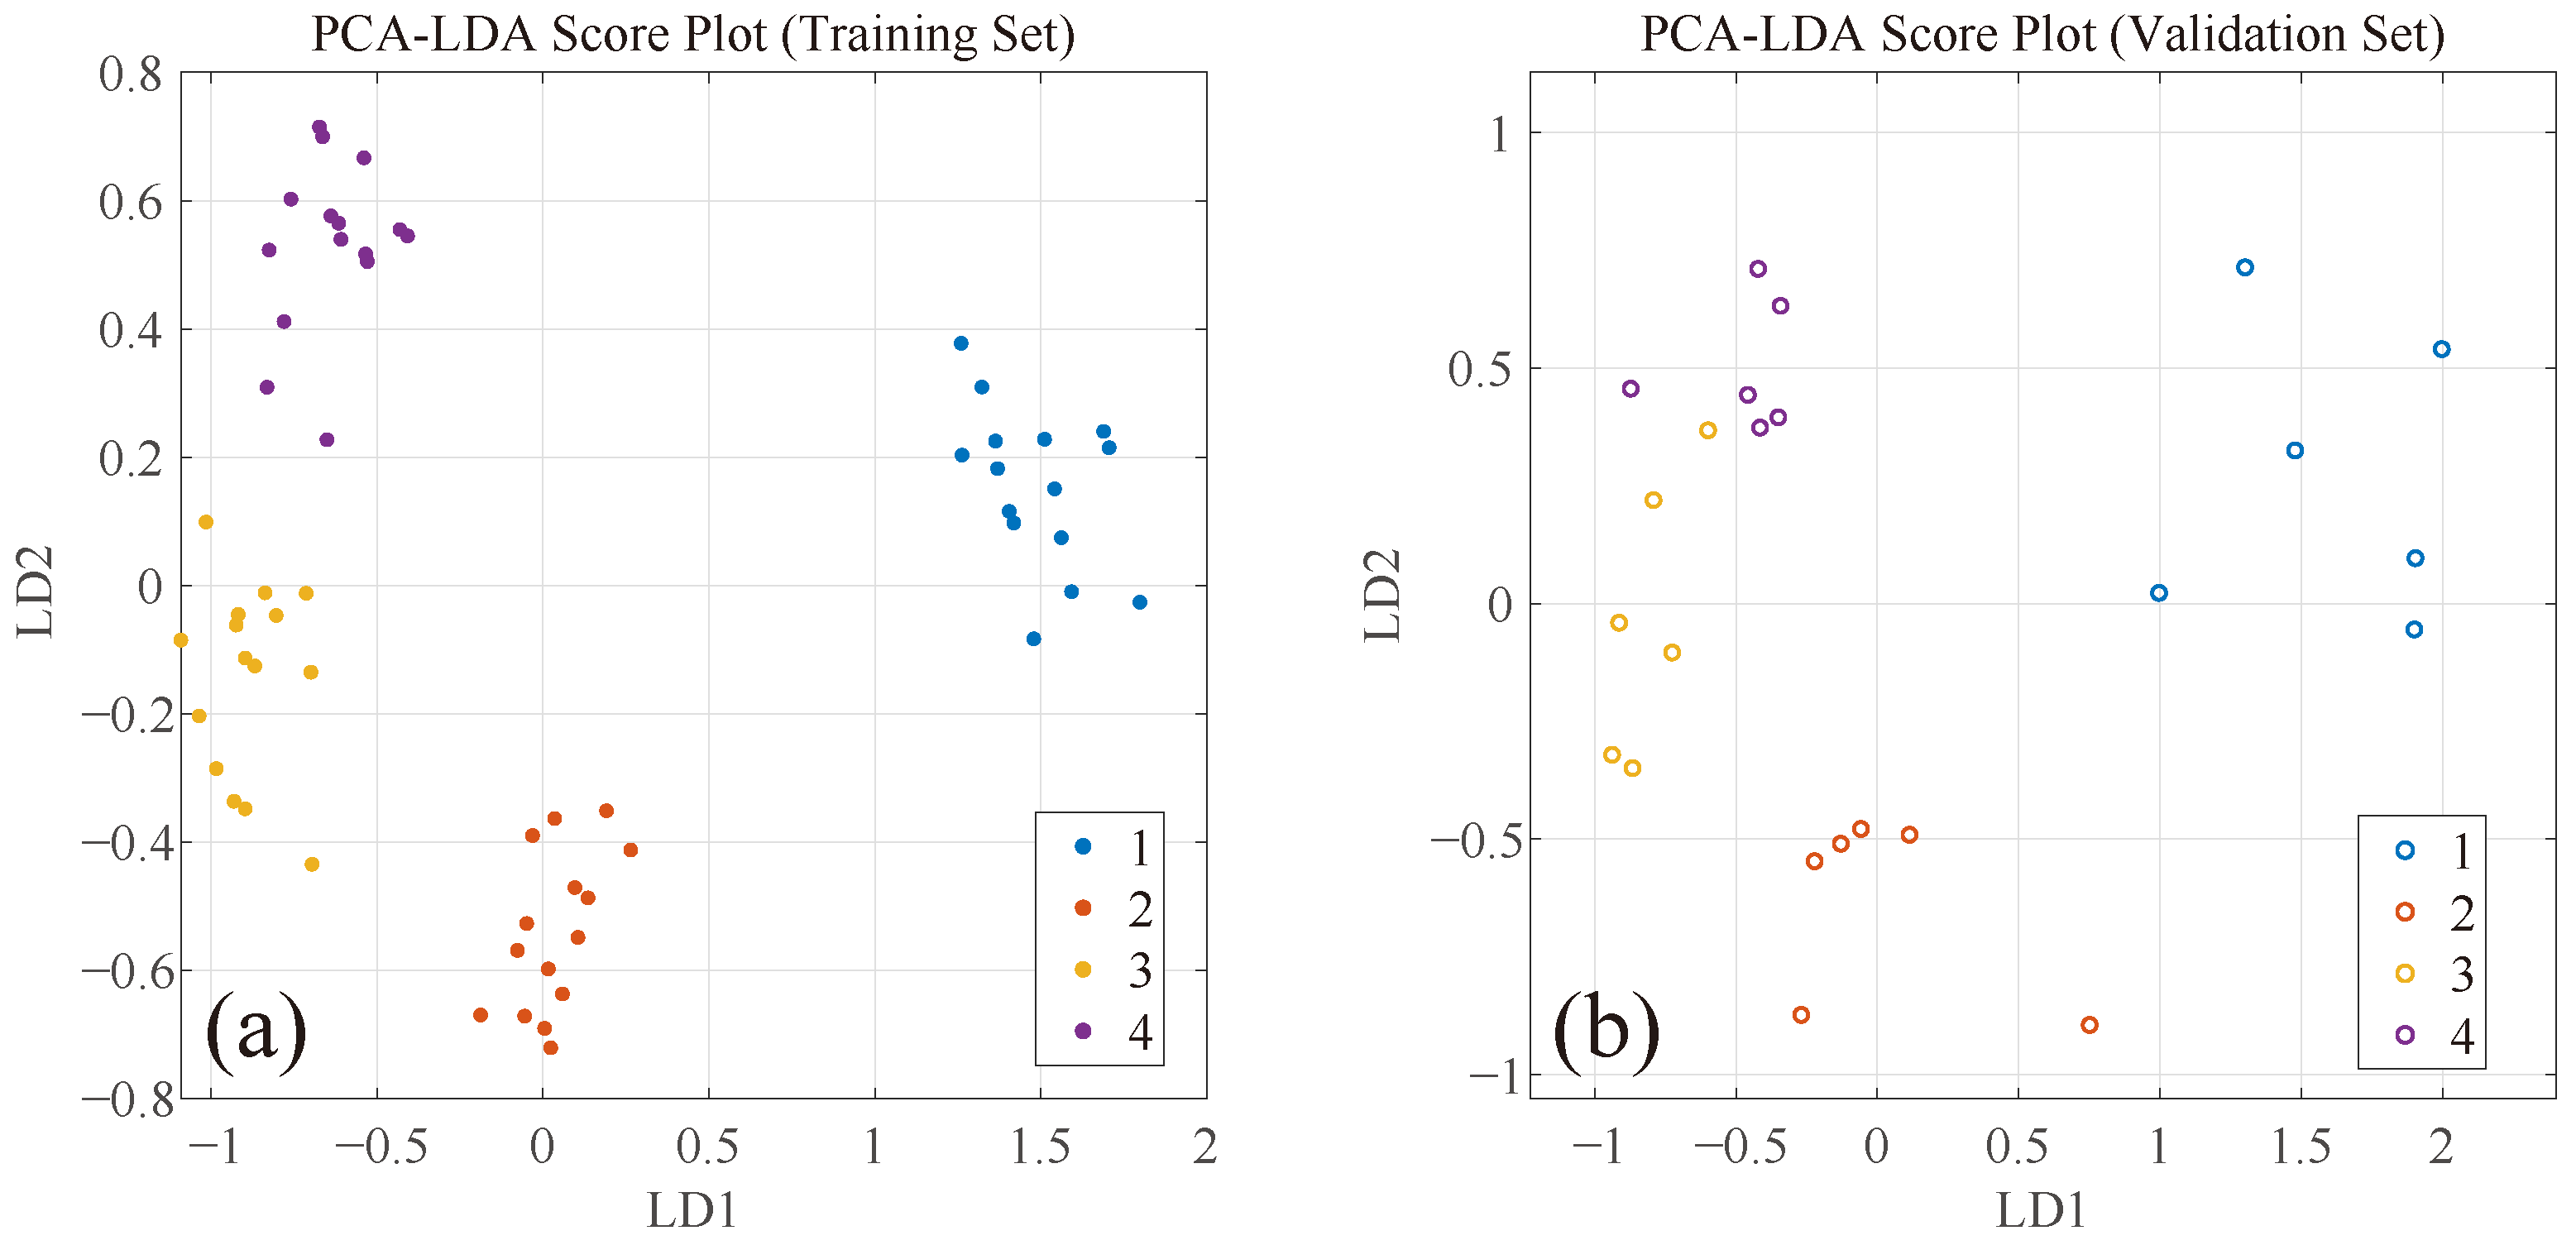
To further validate the discriminant capability of the dimensionality-reduced features and enhance the interpretability of the classification through visualization, supervised dimensionality reduction projection via LDA was performed on the PCA-reduced data, yielding the visualization results of the PCA-LDA approach. As shown in
Figure 4, in the LDA discriminant subspace (LD1 and LD2), the inter-class separation of the four tea varieties was markedly enhanced, and the training and validation set samples exhibited consistent distributions. This indicates that the low-dimensional features extracted by PCA possess favorable separability in the supervised discriminant space, thereby providing a reliable basis for the subsequent development of classification models.
3.1.2. SPA Screening Results
To ensure the reliability of the selected feature variables, the number of iterations in the SPA was set to 50. The algorithm was applied to both the raw spectral data and preprocessed datasets to extract the final feature vectors. By combining SPA with four preprocessing methods, redundant variables were effectively eliminated. The root mean square error (RMSE) values calculated by SPA for each type of data are summarized in
Table 1, where
denotes the RMSE of the calibration set, and
represents the RMSE of the validation set.
As shown in
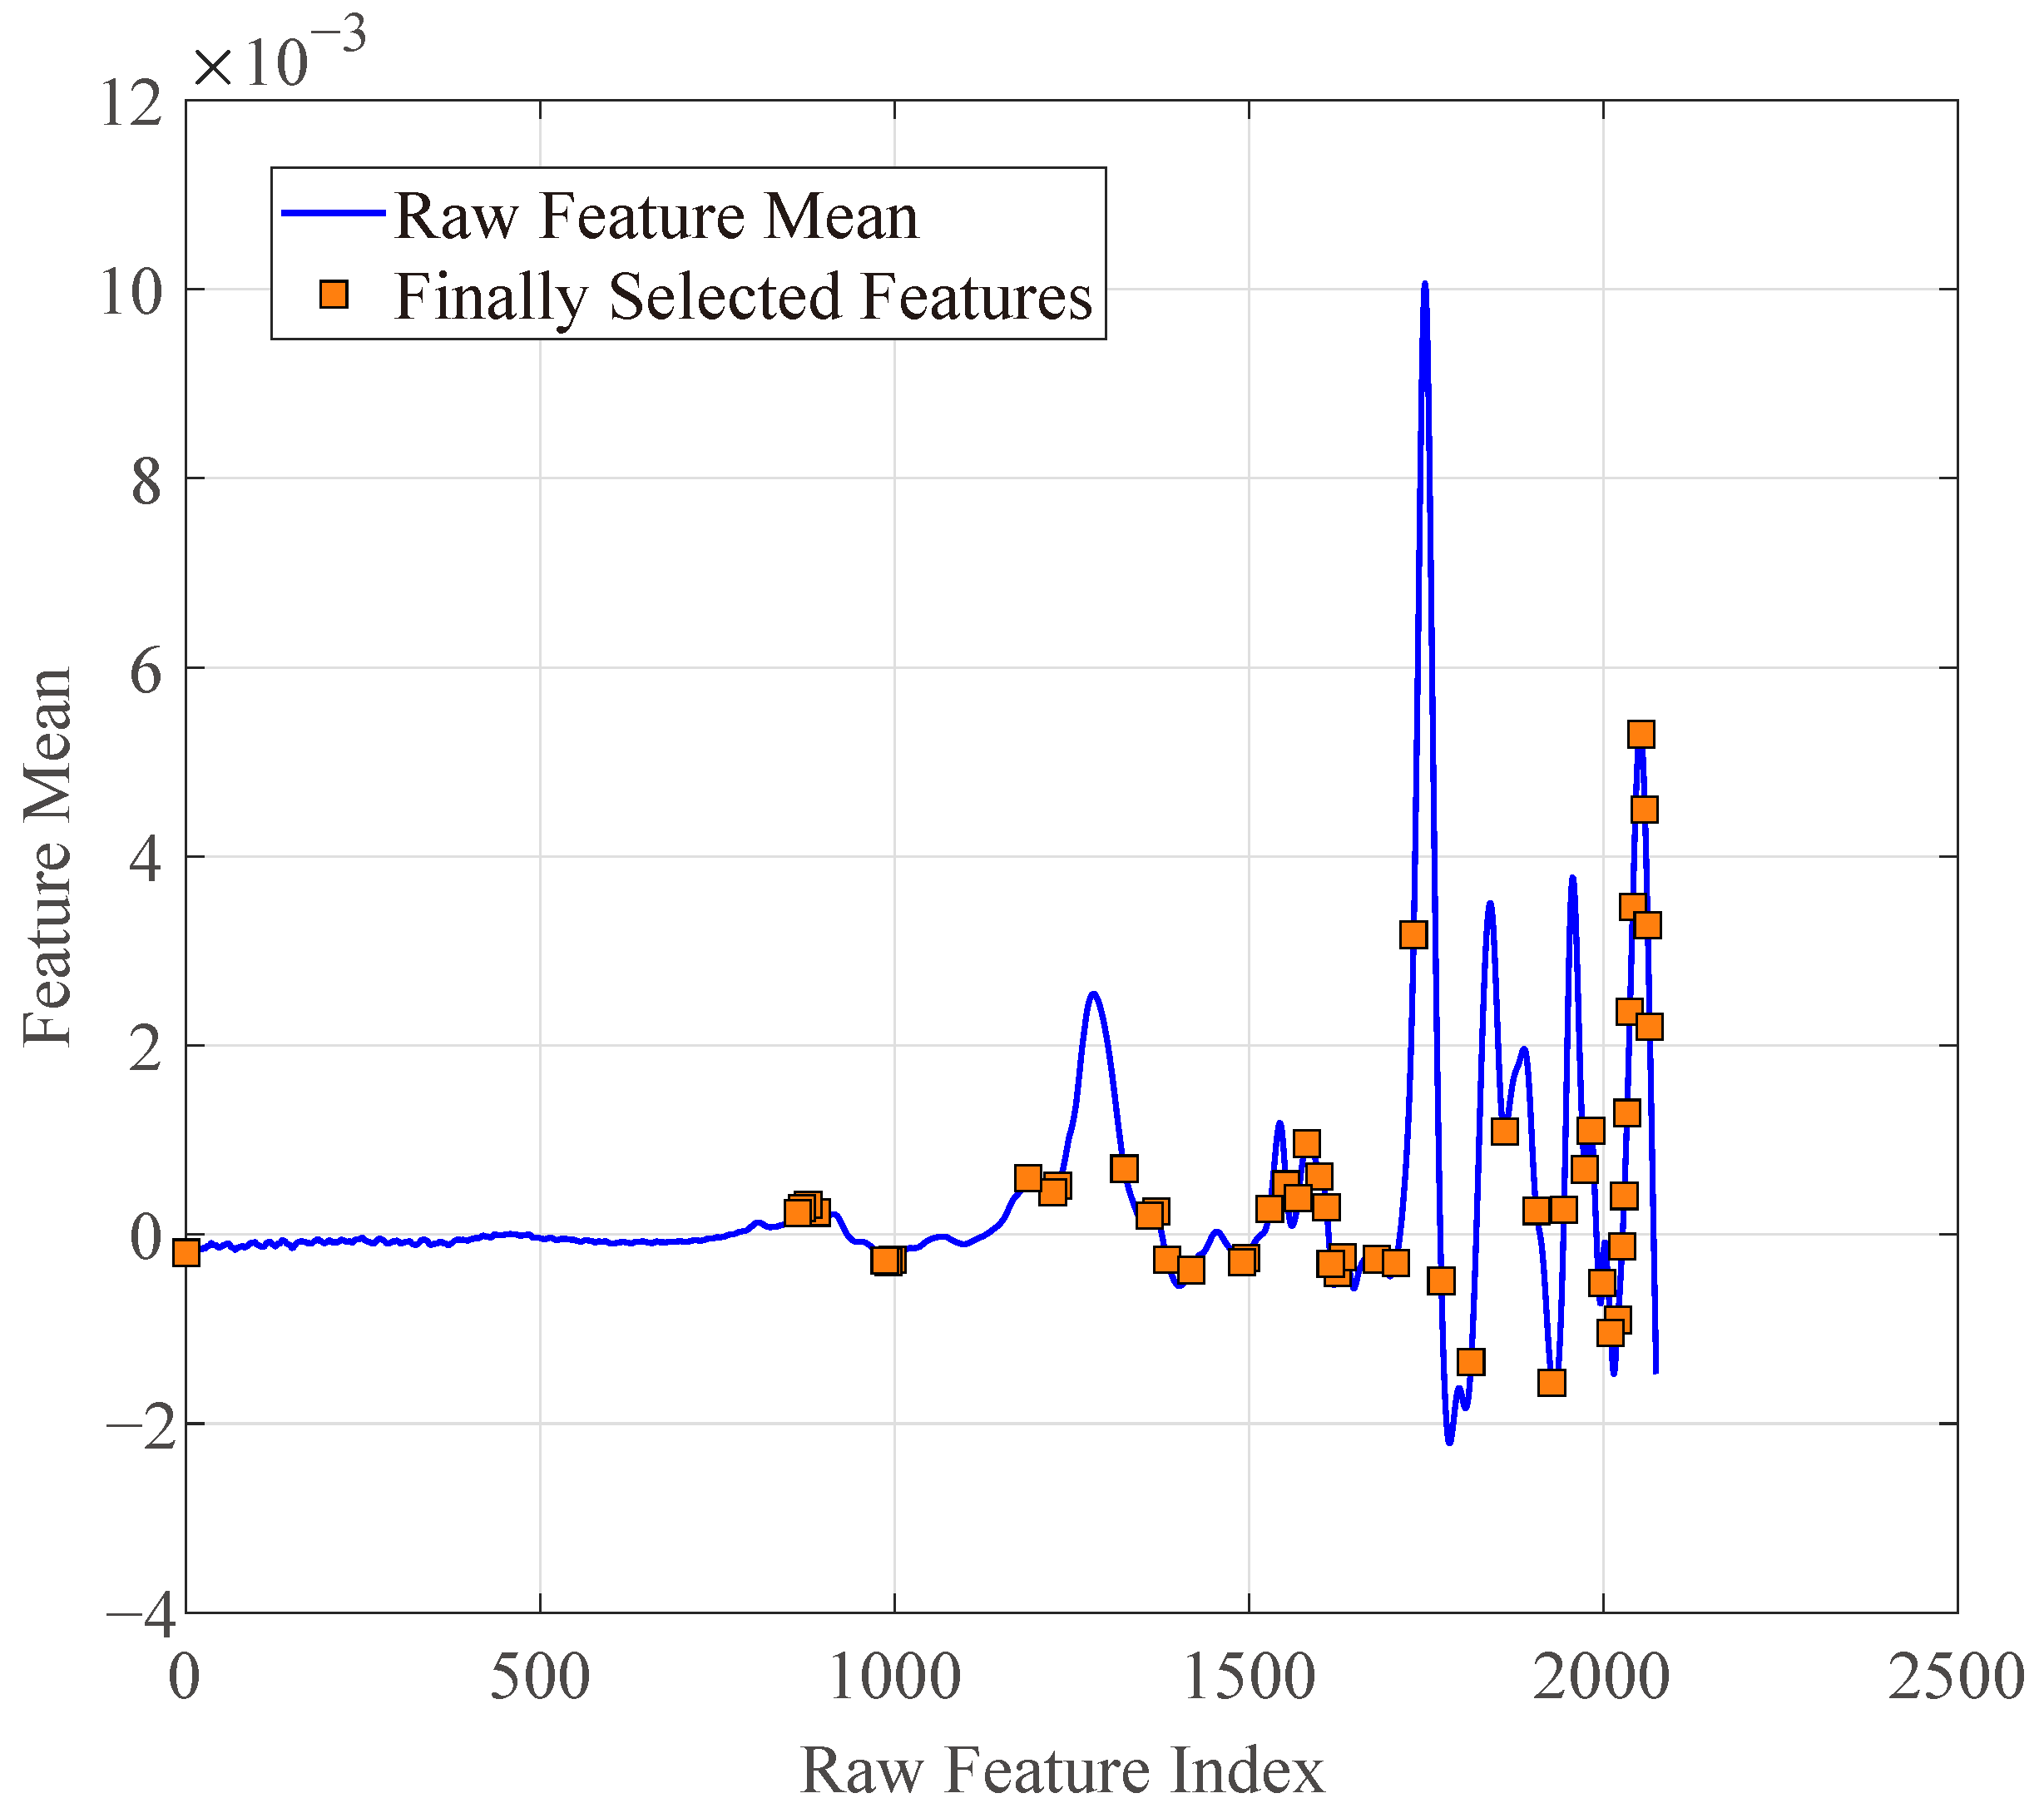
Table 1, the spectral data preprocessed using the 1stDer yielded the lowest RMSE, while the S-G smoothed data resulted in the highest RMSE. This indicates that, compared to the other preprocessing methods evaluated, the characteristic spectral data extracted by SPA from the 1stDer-preprocessed dataset are optimal. The characteristic wavelengths selected by SPA from the 1stDer-preprocessed data are presented in
Figure 5, demonstrating the effectiveness of SPA in screening core feature wavelengths from high-dimensional spectral data.
Figure 5 demonstrates the effectiveness of the SPA in extracting characteristic features from the NIR spectra of tea samples. Additionally, to enhance the chemical interpretability of the SPA selection results, the selected feature bands were compared with typical absorption regions in the near-infrared spectrum. The key variables were primarily distributed in the overtone and combination absorption regions associated with O-H, C-H, and N-H bonds, which correspond to components such as moisture and hydroxyl compounds (e.g., polyphenols), carbohydrates/lipids, and proteins/free amino acids in tea samples. Variations in the raw material grades and processing techniques among different tea varieties lead to differences in the content and structural state of these major components, thereby generating distinguishable absorption differences in the corresponding spectral regions. Specifically, differences in processing methods and leaf tenderness affect the water-binding states, soluble sugar, amino acid, and polyphenol contents, as well as their molecular configurations, which manifest as distinct spectral features in the O-H, C-H, and N-H related near-infrared absorption ranges. This provides a physicochemical basis for the model’s ability to discriminate between different tea varieties.
3.2. Tea Variety Traceability Modeling
The original data were preprocessed using four methods, followed by feature selection and dimensionality reduction via PCA, LDA, PCA-LDA, and SPA. Subsequently, classification and prediction models were built from the feature spectral data using both MLR and SVM algorithms.
Model performance was evaluated using classification accuracy, while model stability and generalization capability were assessed via five-fold cross-validation. The five-fold cross-validation was selected for the following reasons: with 60 calibration samples, each fold contains 12 samples, providing a moderate subset size that yields more reliable estimates with lower variance. Furthermore, 80% of the data (48 samples) is retained for training in each fold, ensuring that the training set remains representative of the overall data distribution. Additionally, five-fold cross-validation offers a favorable balance between computational efficiency and robust evaluation, facilitating efficient model tuning and comparison.
The cross-validation accuracy is expressed as (
), where Mean (or
) is the core performance metric, indicating the average classification accuracy across multiple cross-validation runs and reflecting the overall predictive capability of the model; SD denotes the standard deviation, representing the model stability metric, which reflects the consistency of the model’s generalization ability. A higher Mean value indicates stronger overall classification performance, while a lower SD value suggests lower sensitivity to different data subsets and more stable generalization. The expressions are as follows:
Here, n denotes the number of data samples, which corresponds to the number of folds in cross-validation or, alternatively, the total number of spectral samples within a given class; represents the i-th data point, such as the accuracy (in %) of the i-th test in cross-validation, or the feature value of the i-th spectral sample in a particular class; and indicates the sum of squared deviations, which prevents positive and negative deviations from canceling each other out and emphasizes the degree of dispersion in the data.
The classification accuracy and cross-validation results of the ultimately established prediction models are summarized in
Table 2,
Table 3,
Table 4 and
Table 5. In these tables, the “Mean” values correspond to the mean classification accuracy.
Regarding classifier performance, the SVM model consistently achieved higher accuracy than the MLR model on both the validation set and in five-fold cross-validation, indicating that the SVM exhibits superior classification and generalization capabilities overall.
In terms of feature dimensionality reduction/screening methods, the combined PCA-LDA approach proved to be the most effective strategy. In contrast, the successive projections algorithm (SPA) showed weaker adaptability; while it performed effectively in combination with SVM, its results with MLR were inconsistent.
Concerning the influence of preprocessing methods, both MSC and SNV transformation positively and significantly enhanced model performance. S-G smoothing, however, yielded limited improvement in either accuracy or stability. 1stDer preprocessing tended to introduce negative interference, notably degrading the performance of models such as PCA-MLR and LDA-MLR.
Cross-validation provides a more robust estimate of model generalization capability. Overall, the PCA-LDA-SVM model combined with either MSC or SNV preprocessing yielded the best performance. In terms of generalization ability (mean cross-validation accuracy), the models preprocessed with MSC or SNV achieved 96.67%, which is notably higher than the 93.33% obtained without preprocessing. This indicates that, across multiple different data partitions, the preprocessed models performed better on average. Regarding model stability (standard deviation, SD), the SD for MSC/SNV (4.56%) was slightly higher than that of the unpreprocessed model (3.73%). However, given the substantial gain of 3.34 percentage points in mean accuracy, this marginal trade-off in stability is generally acceptable in model selection.
Moreover, a single validation set may achieve 100% accuracy by data contingency. Although both the No-preprocessing-PCA-LDA-SVM model (
Table 4) and the 1stDer-SPA-SVM model (
Table 5) showed 100% classification accuracy on their respective validation sets, their mean five-fold cross-validation accuracies (93.33% and 90.00%, respectively) were lower than those of the corresponding models preprocessed with MSC or SNV (96.67%). Therefore, considering both average classification accuracy and model stability, the MSC/SNV-PCA-LDA-SVM model was identified as the optimal and most reliable model for classifying the tea spectral data in this study.
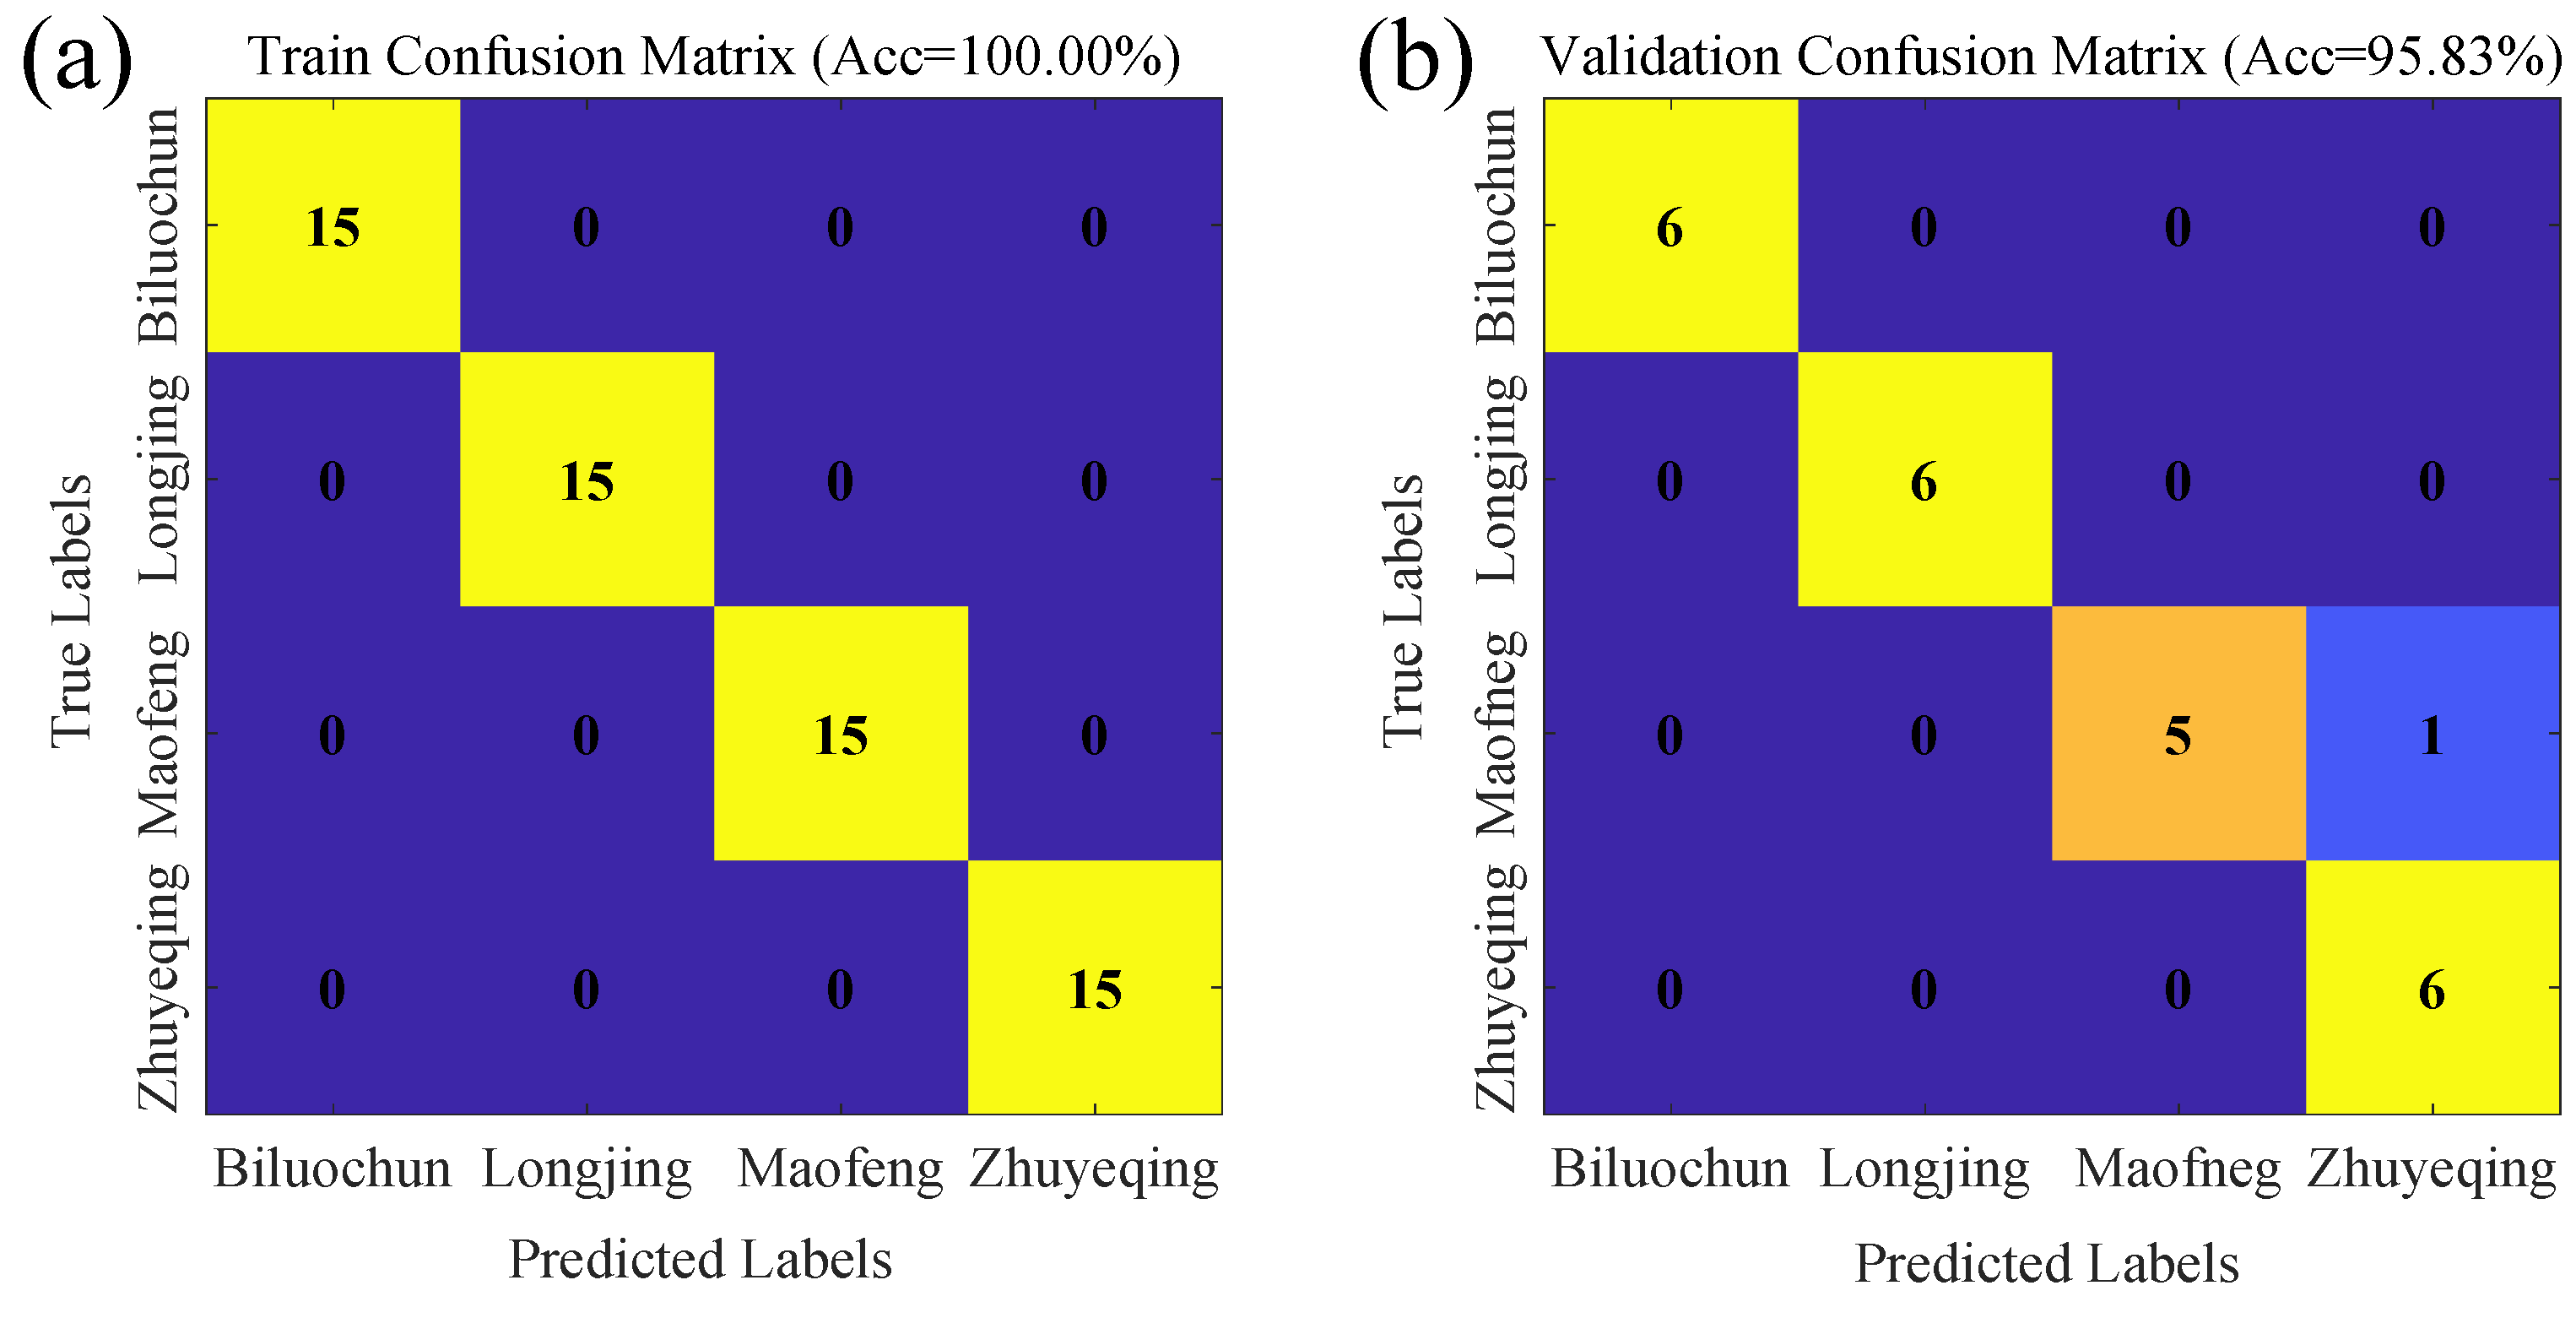
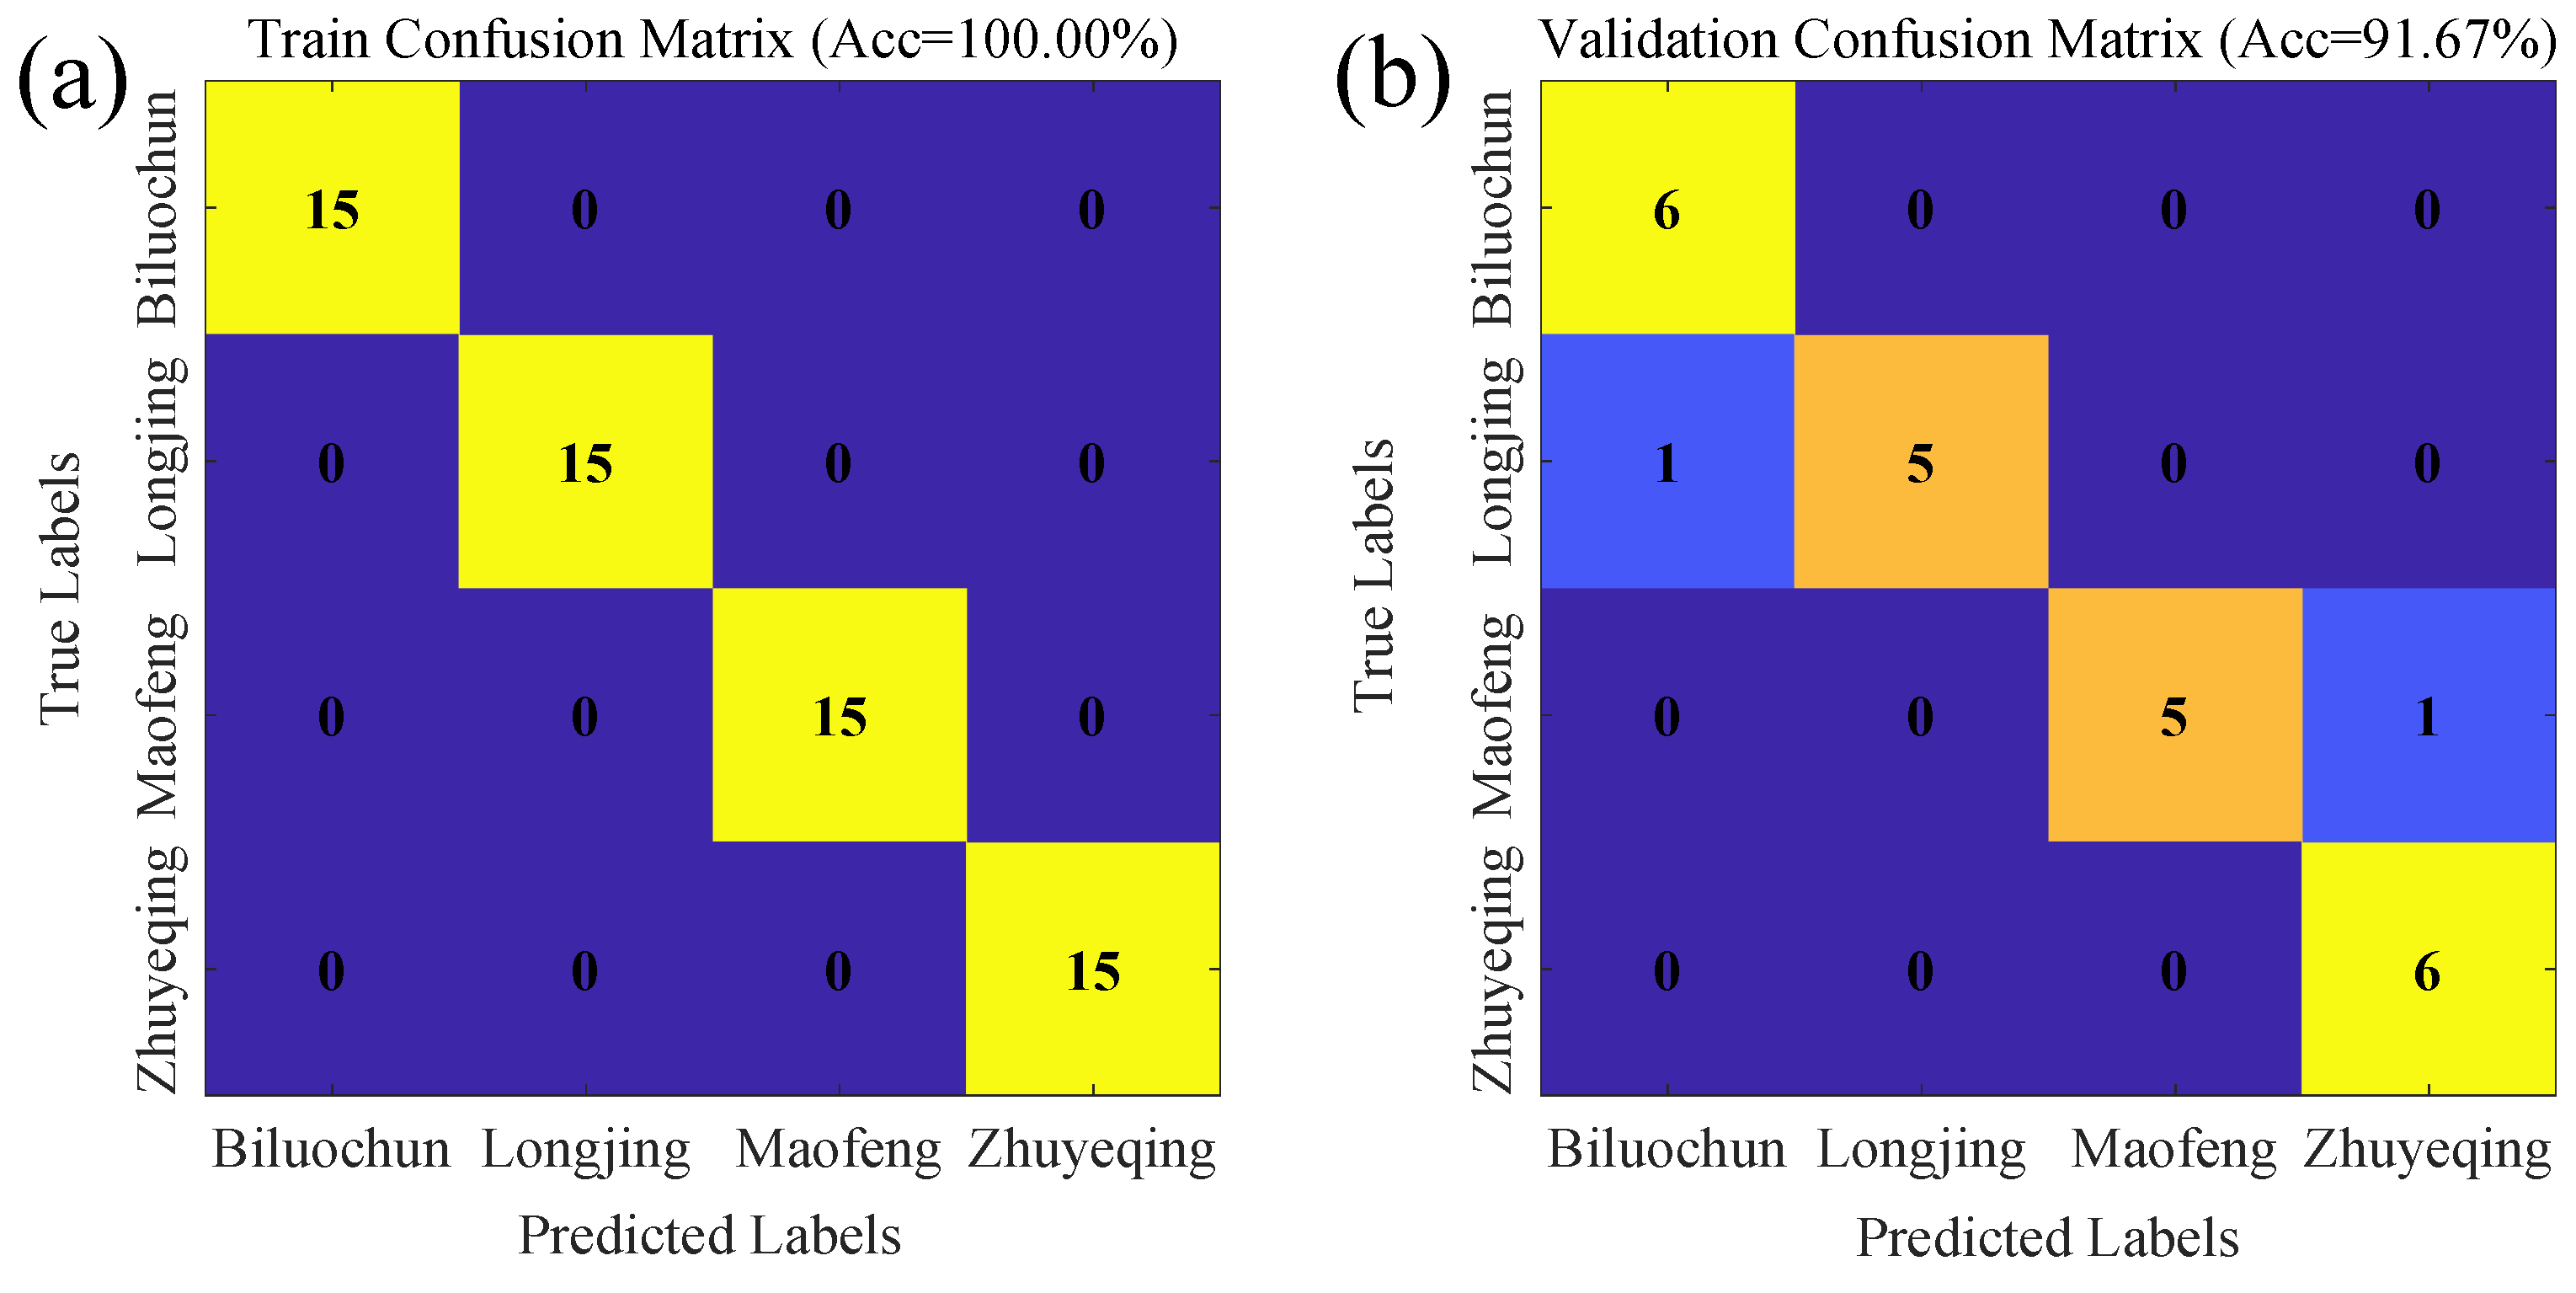
Within the classification model performance evaluation framework, the confusion matrix serves as a fundamental quantitative tool. It visually represents class-level prediction details in a structured matrix format, providing key evidence for performance assessment, error diagnosis, and model optimization. The confusion matrices of the MSC-PCA-LDA-SVM and SNV-PCA-LDA-SVM models are presented in
Figure 6 and
Figure 7, respectively.
The confusion matrices of the models indicate that the primary classification errors occurred between the pairs Maofeng–Zhuyeqing and Longjing–Biluochun. This systematic pattern is not coincidental; instead, it reflects the inherent rationale of spectroscopic classification models, which rely on the integrated chemical and physical characteristics of the samples. Specifically, Maofeng and Zhuyeqing likely share similar spectral scattering backgrounds due to their comparable physical morphology (e.g., bud-bearing, fine and tightly rolled leaves), combined with potential similarities in chemical composition, forming a secondary source of confusion. In contrast, Longjing and Biluochun, both belonging to the pan-fried green tea category, contain highly similar key aromatic and flavor compounds, leading to substantial overlap in their characteristic spectral features and constituting the primary source of misclassification. These errors demonstrate that, although the PCA-LDA-SVM model delivers excellent overall performance, distinguishing between tea sub-varieties with subtle differences in processing or regional traits remains challenging when relying solely on global spectral features.
4. Limitations
This study demonstrates the efficacy of NIR spectroscopy combined with chemometrics for tea variety discrimination; however, several limitations should be acknowledged concerning the study’s scope, methodology, and the generalizability of its findings, which also indicate directions for future research.
(1) Limited Sample Scope and Representativeness: The research was constrained by a limited sample set, covering only four specific green tea varieties (Longjing, Maofeng, Zhuyeqing, and Biluochun) with a total of 84 samples. Consequently, the findings may lack representativeness for other green tea varieties or teas with different processing degrees (e.g., black, oolong, or dark tea). The model’s performance across a broader spectrum of tea types remains unverified.
(2) Constraints of the Data Partitioning Strategy: Although stratified sampling was used to maintain class balance between the calibration and validation sets, a single random split with a fixed seed may not fully capture the inherent variability within each tea category. Potential sub-clusters resulting from factors such as production batches, slight processing variations, or quality grades within the same variety might be unevenly distributed, which could lead to biased performance estimates based on a particular data division.
(3) Model Generalizability and Stability: Although five-fold cross-validation was employed to evaluate model stability, the modest sample size limits the robustness of this assessment. Certain models, notably SPA-MLR, exhibited high variance in cross-validation outcomes, indicating instability. Moreover, while the optimal model (PCA-LDA-SVM with MSC/SNV) was selected based on cross-validation accuracy, its performance on a truly independent external dataset—collected under different instrumental or environmental conditions—remains unknown, which is critical for practical application.
(4) Interpretation of Systematic Classification Errors: The confusion matrix revealed consistent misclassifications between specific tea pairs (Longjing/Biluochun and Maofeng/Zhuyeqing). Although these errors were attributed to chemical and physical similarities, the study did not identify the specific spectral regions or chemical constituents responsible for the confusion. Integrating quantitative compositional data could improve the mechanistic interpretation of the model’s limitations.
(5) Exclusion of External Influential Factors: The study did not account for the effects of variable storage conditions (e.g., duration, temperature, humidity, and packaging) on the spectral profiles of tea samples. In real-world traceability scenarios, variations in storage history may alter chemical composition and corresponding NIR spectra, potentially compromising the robustness of the developed model.
In summary, while the proposed PCA-LDA-SVM framework shows considerable potential for discriminating the four tea varieties under controlled conditions, its applicability to a wider range of tea types and under realistic, variable storage and measurement conditions requires further validation with larger, more diverse datasets and external testing. Addressing these limitations is essential to advance this method from a laboratory proof-of-concept to a reliable tool for industrial tea traceability.
5. Conclusions
Based on near-infrared spectroscopy, this study systematically investigated the effects of different preprocessing methods, feature extraction techniques, and classification algorithms for tracing the origins of four tea varieties: Longjing, Maofeng, Zhuyeqing, and Biluochun. The main conclusions are summarized as follows:
(1) Preprocessing methods significantly influence model performance. MSC and SNV transformation effectively corrected baseline drift and scattering interference, substantially improving validation accuracy and model stability in most models, particularly PCA-MLR and LDA-MLR. S-G smoothing offered limited improvement. 1stDer preprocessing showed a positive effect on SVM models but degraded the performance of MLR-based models.
(2) Feature extraction methods exhibit distinct performance. The supervised dimensionality reduction method LDA, owing to its classification-oriented design, generally outperformed the unsupervised PCA. The combined PCA-LDA strategy integrated the strengths of both approaches, preserving essential spectral information while maximizing inter-class separability, and proved to be the optimal feature reduction scheme. The SPA effectively selected key wavelengths; however, the resulting feature subsets yielded highly unstable performance with MLR, whereas they performed satisfactorily when coupled with SVM.
(3) SVM classifiers significantly outperform MLR. Across all feature extraction and preprocessing combinations, SVM models consistently and markedly achieved higher accuracy than MLR models on both the validation set and in five-fold cross-validation, demonstrating superior nonlinear processing capability and generalization ability.
(4) An optimal traceability model combination was identified. After comprehensively considering mean classification accuracy (five-fold cross-validation mean) and stability (standard deviation), the model constructed using either MSC or SNV preprocessing, combined with PCA-LDA feature extraction and an SVM classifier, was determined to be the best solution for tea variety traceability in this study. This model achieved a mean cross-validation accuracy of 96.67% with robust performance.
In summary, this research establishes a rapid and non-destructive traceability method for tea varieties based on NIR spectroscopy. The optimized PCA-LDA-SVM model delivers high accuracy and favorable stability, providing an effective technical reference for quality control and authenticity verification of tea and similar agricultural products.
Author Contributions
Conceptualization, K.Z. and S.Z.; Methodology, K.Z., S.Z. and D.W.; Software, R.W.; Validation, T.Z. and D.W.; Investigation, D.W.; Resources, R.W.; Data curation, T.Z., S.H. and R.W.; Writing—review and editing, T.Z., D.W. and S.H.; Funding acquisition, K.Z. All authors have read and agreed to the published version of the manuscript.
Funding
This research was funded by the National Natural Science Foundation of China (Grant No. 62463023) and the Natural Science Foundation of Inner Mongolia Autonomous Region (Grant No. 2023LHMS06019).
Institutional Review Board Statement
Ethical review and approval were waived for this study, as it involved only commercially available tea samples (non-human/non-animal subjects) and did not require ethical oversight.
Informed Consent Statement
Not applicable, as this study did not involve human subjects.
Data Availability Statement
The spectral data used to support the findings of this study are available from the corresponding author upon reasonable request.
Conflicts of Interest
The authors declare no conflicts of interest. The funders had no role in the design of the study; in the collection, analyses, or interpretation of data; in the writing of the manuscript; or in the decision to publish the results.
Abbreviations
The following abbreviations are used in this manuscript:
| NIR | Near-Infrared |
| S-G | Savitzky–Golay |
| MSC | Multiplicative Scatter Correction |
| SNV | Standard Normal Variate |
| 1stDer | First Derivative |
| PCA | Principal Component Analysis |
| SPA | Successive Projections Algorithm |
| MLR | Multiple Linear Regression |
| SVM | Support Vector Machine |
| RMSE | Root Mean Square Error |
| Root Mean Square Error of Calibration Set |
| Root Mean Square Error of Validation Set |
| LDA | Linear Discriminant Analysis |
| Mean | Mean Classification Accuracy |
| SD | Standard Deviation |
References
- Liu, L.; Wang, B.; Xu, X.; Xu, J. A tea classification method based on near infrared spectroscopy (NIRS) and transfer learning. Infrared Phys. Technol. 2025, 145, 105713. [Google Scholar] [CrossRef] [Scilit]
- Zhang, Y.; Chen, X.; Chen, D.; Zhu, L.; Wang, G.; Chen, Z. Machine learning-based classification and prediction of typical Chinese green tea taste profiles. Food Res. Int. 2025, 203, 115796. [Google Scholar] [CrossRef] [Scilit] [PubMed]
- Ding, Y.; Yan, Y.; Li, J.; Chen, X.; Jiang, H. Classification of Tea Quality Levels Using Near-Infrared Spectroscopy Based on CLPSO-SVM. Food 2022, 11, 1658. [Google Scholar] [CrossRef] [Scilit] [PubMed]
- Chen, G.; Zhang, X.; Wu, Z.; Su, J.; Cai, G. An efficient tea quality classification algorithm based on near infrared spectroscopy and random Forest. J. Food Process Eng. 2021, 44, e13604. [Google Scholar] [CrossRef] [Scilit]
- Zhou, X.F.; Wu, X.H.; Wu, B. Comparative study of indirect and direct feature extraction algorithms in classifying tea varieties using near-infrared spectroscopy. J. Spectrosc. 2025, 10, 101065. [Google Scholar] [CrossRef] [Scilit] [PubMed]
- Mishra, P.; Nordon, A.; Tschannerl, J.; Lian, G.; Redfern, S.; Marshall, S. Near-infrared hyperspectral imaging for non-destructive classification of commercial tea products. J. Food Eng. 2018, 238, 70–77. [Google Scholar] [CrossRef] [Scilit]
- Wang, P.; Yu, W.T.; Lv, S.Y.; Zhu, Y.; Lan, Z.; Li, Q.; Li, G.; Gui, W.; Ye, N. Genetic Diversity and DNA Fingerprints of Tea Germplasms in Yongtai, Fujian. Fujian J. Agric. Sci. 2024, 39, 66–74. [Google Scholar]
- Liu, Y.; Peng, Q.W.; Yu, J.C.; Tang, Y.L. Identification of tea based on CARS-SWR variable optimization of visible/near-infrared spectrum. J. Sci. Food Agric. 2020, 100, 371–375. [Google Scholar]
- Zhang, H.L.; Zhou, Y.; Luo, W.; Zhan, B.S.; Zhang, J.; Liu, X.M. Research on Detection Method for Constituent Content of Fresh Tea Leaf Based on Residual Attention Convolutional Neural Network. Chin. J. Anal. Chem. 2025, 53, 842–851. [Google Scholar]
- Wang, Z.X.; Shen, Q.; Zhao, Q.Y. Research Progress on the Application of Near Infrared Spectroscopy in Cereal Detection. Food Sci. 2025, 46, 267–273. [Google Scholar]
- Liu, Y.; Chen, J.; Wang, G.; Wang, J.; Xu, S.; Wan, T.; Liu, W. Simulation and sensitivity analysis of light propagation in watermelon tissues for enhanced Vis/NIR spectroscopic quality assessment. Measurement 2025, 253, 117342. [Google Scholar] [CrossRef] [Scilit]
- Li, L.Q.; Pan, X.P.; Feng, Y.C.; Yin, L.-H.; Hu, C.-Q.; Yang, H.-H. Deep Convolution Network Application in Identification of Multi-Variety and Multi-Manufacturer Pharmaceutical. Spectrosc. Spect. Anal. 2019, 39, 3606–3613. [Google Scholar]
- Zhang, S.; Li, G.; Wang, J.; Wang, D.; Han, Y.; Cao, H.; Lin, L. Nondestructive Measurement of Hemoglobin in Blood Bags Based on Multi-Pathlength VIS-NIR Spectroscopy. Sci. Rep. 2018, 8, 2204. [Google Scholar] [CrossRef] [Scilit] [PubMed]
- Qian, P.; Sun, G.Q.; Zhang, C.Z. A Novel Fuzzy Neural Network Method for Diesel Quantitative Analysis with Near Infrared Spectroscopy. Spectrosc. Spect. Anal. 2008, 28, 2851–2854. [Google Scholar]
- Filho, E.B.M.; Serpa, F.S.; da Costa, A.S.P.; Silva, G.M.; Nascimento, J.F.D.; Pereira, L.d.S.; Borges, G.R.; Dariva, C.; Franceschi, E. Monitoring of Calcium and Strontium Carbonate Precipitation in H2O + MEG Mixtures Using an NIR Technique. Ind. Eng. Chem. Res. 2025, 64, 1508–1517. [Google Scholar] [CrossRef] [Scilit]
- Wang, X.T.; Chen, B.; Ni, K.; Jin, S.Z. Application of correlation analysis to determination of the mulberry silk content by NIR spectroscopy. J. Text. Res. 2007, 28, 5–8. [Google Scholar]
- Han, S.C.; Liu, S. A New Model for Quantitative Analysis of Waste Textiles Using Near-Infrared Spectroscopy. Spectrosc. Spect. Anal. 2022, 42, 2477–2481. [Google Scholar]
- Sun, X.R.; Hu, Y.R.; Liu, C.L.; Zhang, S.Z.; Wang, Z.H. Identification of new and old tea and origin traceability based on near infrared spectroscopy. J. Food Saf. Qual. 2023, 14, 53–59. [Google Scholar]
- Li, J.; Li, S.K.; Jiang, L.W.; Liu, X.; Ding, S.H.; Li, P. A Nondestructive Method Identifying Varieties of Green Tea Based on Near Infrared Spectroscopy and Chemometrics. J. Instrum. Anal. 2020, 39, 1344–1350. [Google Scholar]
- Li, M.Y.; Chen, P.; Luo, J.Y.; Sun, S.S.; Wang, H.W.; Dong, Z.; Cao, J. Study on origin traceability of green tea based on near-infrared spectroscopy. J. Food Saf. Qual. 2024, 15, 271–278. [Google Scholar]
| Disclaimer/Publisher’s Note: The statements, opinions and data contained in all publications are solely those of the individual author(s) and contributor(s) and not of MDPI and/or the editor(s). MDPI and/or the editor(s) disclaim responsibility for any injury to people or property resulting from any ideas, methods, instructions or products referred to in the content. |





 ,
,