Article

Effect of Apple Pomace Addition During Fermentation on the Phenolic Content, Chemical Composition, and Sensory Properties of Cider

Food Science and Nutrition Department, California Polytechnic State University, San Luis Obispo, CA 93407, USA
*
Author to whom correspondence should be addressed.
Beverages 2025, 11(4), 95; https://doi.org/10.3390/beverages11040095
Submission received: 14 May 2025 / Revised: 12 June 2025 / Accepted: 25 June 2025 / Published: 1 July 2025

Abstract

The quality of cider is influenced by its phenolic compound content. Apple pomace, an industrial by-product of cider production, is rich in bioactive compounds, including polyphenols. The objective of this study was to determine the potential of apple pomace addition during fermentation to increase the phenolic content in cider. Apple juice from Jonagold apples was divided into a control and three treatment groups. Control cider was fermented with 100% apple juice, while treatments were prepared with different additions of apple pomace to the apple juice. Ciders were fermented for 14 days, followed by chemical and sensory analysis. Ciders with apple pomace addition contained 31–61% higher phenolic compound concentrations than the control. The addition of apple pomace modified the volatile profile of the ciders. Treatment ciders contained higher concentrations of isoamyl alcohol, phenylethyl alcohol, and ethyl acetate, and lower concentrations of acetaldehyde. Ciders with apple pomace addition exhibited lower levels of astringency and sourness, and higher bitterness levels compared to the control. There was no difference in aroma perception and taste acceptance between the ciders. This study demonstrates the potential of apple pomace addition as a cidermaking technique for phenolic compound extraction and sensory profile modification.

Graphical Abstract

1. Introduction

Cider, often referred to as hard cider, is an alcoholic beverage produced by fermentation of apple must using practices similar to winemaking [1]. Historically, cider was widely produced and consumed in the United States; however, during prohibition, many of the orchards that grew apple varieties suited for cider production were abandoned. As a result, apple farmers grew dessert apples, which are ideal for raw consumption but not for producing cider [2]. Dessert apples are typically larger and sweeter, while cider apples tend to be smaller and have a higher content of acids and tannins. As a result, ciders made from dessert apples are sharper and lack the astringency and mouthfeel found in ciders produced with cider apples [3,4].
Dessert apples have lower levels of phenolic compounds than cider apples and therefore contribute fewer phenolics to the cider product. The phenolic content of cider is an indicator of quality, as it influences sensory attributes, including color, aroma, bitterness, and astringency [4,5,6]. In addition to their impact on sensory properties, phenolic compounds are also linked to several health benefits, including antioxidant activity, reduced risk of cardiovascular disease, and diabetes, and are known to possess anti-carcinogenic properties [1,5,7].
As part of cider production, apples are milled and pressed to extract their juice, leaving behind a solid by-product known as apple pomace. The extracted juice from the apples contains around 30% of the phenolic content of the fresh fruit, while the apple pomace retains 42–58% of the phenolic compounds because of hydrophobic interactions and molecular bonds between the pomace and the phenolic compounds [1,8]. Although apple pomace contains large quantities of phenolic compounds, it is commonly underutilized; at present, it is either sent to landfills or used as animal feed, wasting many bioactive compounds [1,9]. Due to its high phenolic content, apple pomace could be used during cider production to enhance the phenolic level of ciders produced from dessert apples and add value to the by-product.
Methods to increase phenolic compounds in cider using apple pomace have previously been explored. Amongst these methods, researchers have studied the addition of extracted phenolic compounds from apple pomace directly into the finished cider product. The extraction is performed with several techniques which include microwave technology, organic solvents, supercritical carbon dioxide, or ultrasound technology. Results from the previous studies have demonstrated that the extraction techniques are efficient, and addition of the extracts to ciders results in a higher phenolic content, antioxidant activity, and the accentuation of sensory characteristics like astringency, bitterness, and color [8,10,11,12]. While these methods provide efficient extraction and positive results in the final cider, they are accompanied by several disadvantages. Extraction with organic solvents generates hazardous waste with potential environmental impacts, while expensive equipment is required for the other techniques, which may limit their applicability for cidermakers.
An alternative to extraction methods for phenolic compound recovery is the direct addition of apple pomace to the fermentation. A study by Bortolini et al. [1] investigated the feasibility of using immobilized apple pomace during fermentation to increase the recovery of phenolic compounds. The presence of apple pomace during fermentation could increase phenolic extraction through dissolution and diffusion, similar to processes observed in winemaking. In the study, apple pomace was collected during processing, dried in an air-circulation oven, sieved, and added to the juice. To immobilize the pomace, it was placed in sachets with glass balls to keep the solids submerged during fermentation. The addition of immobilized apple pomace resulted in a higher concentration of phenolic compounds, reduced sourness, increased bitterness, and produced no significant changes in astringency or odor quality [1].
The use of immobilized apple pomace represents a promising approach for utilization of this by-product for phenolic compound extraction. However, the drying and immobilization processes may pose practical challenges for cidermakers. As an alternative, the direct addition of fresh apple pomace could represent a more feasible approach. To the best of our knowledge, no studies have investigated the effects of directly adding fresh apple pomace during fermentation on phenolic compound recovery, or on the chemical composition and sensory characteristics of cider. Therefore, the aim of this study was to evaluate the application of fresh apple pomace during alcoholic fermentation to increase phenolic compound extraction and to assess its impact on the chemical composition and sensory attributes of the resulting cider.

2. Materials and Methods

2.1. Chemicals and Reagents

Sodium carbonate (≥99.0%), gallic acid (≥97.5%), isoamyl alcohol (≥98.5%), acetaldehyde (≥99.5%), ethyl acetate (≥99.5%), phenylethyl alcohol (≥99%), 1-butanol (≥99.4%), tannic acid (≥95.0%), and Folin–Ciocalteu reagent were purchased from Sigma Aldrich (St. Louis, MO, USA). Sodium Hydroxide 0.1 N was purchased from Acros Organics (Morris Plains, NJ, USA). Malic acid was purchased from LD Carlson Company (Kent, OH, USA), and caffeine was purchased from HerbStoreUSA (Walnut, CA, USA). Kits for CDR BeerLab analysis of malic acid and lactic acid were purchased from Quartz Analytics (Rochester Hills, MI, USA).

2.2. Apple Juice Extraction

Jonagold apples were used for this study. The apples were donated by Swanton Pacific Ranch (Santa Cruz, CA, USA). The apples were harvested in 2021, in alignment with the commercial harvest schedule and removed from the orchards accordingly. Apples were transported to the Food Science and Nutrition pilot plant at California Polytechnic State University (San Luis Obispo, CA, USA) for processing. Apples were stored in food-grade buckets at room temperature until they were processed the next day.
Apples were milled using a Schrute hammermill. The must was collected in 56.78 L food-grade buckets and pressed in a fruit hydro press (20 L Speidel Fruit Press, Braumarkt, Hamburg, Germany) at 25 psi. The juice was collected in 56.78 L buckets. After juice collection, the pomace was transferred from the press into a 56.78 L food-grade bucket.

2.3. Apple Pomace Addition

The experimental design consisted of three pomace addition treatments and a control. The moisture content of the pomace was 75.9 ± 0.3% (wet basis). Fermentations were performed in 3.78 L glass fermenters. Individual fermenters were filled with 2.84 L of apple juice. The fermenters were divided into four groups: Control, Cider 20, Cider 35, and Cider 50. The control group received no apple pomace addition, while Ciders 20, 35, and 50 received fresh, untreated apple pomace at concentrations of 47 g/L, 81 g/L, and 118 g/L, respectively. The quantities of apple pomace correspond to 20%, 35%, and 50% of the pomace yield obtained from processing 1 L of apple juice. The concentrations were based on the fresh weight of the pomace and were not adjusted for moisture content. Each control and treatment were performed in triplicate (3 fermentations per group).
Control and treatment samples were each treated with potassium metabisulfite (LD Carlson Company, Kent, OH, USA) to add 50 mg/L of sulfur dioxide (SO2), thereby increasing microbial stability and preventing oxidation. After 24 h, control and samples were inoculated with Saccharomyces cerevisiae (Lalvin EC-1118, Lallemand, Montreal, QC, Canada) at a rate of 1 × 10⁶ cells/mL. Ciders were fermented for 14 days in an incubator (Percival I-36VLX, Geneva Scientific, Fontana, WI, USA) at 20 ± 1 °C. Punch downs were performed three times a day for 1 min. Once fermentation was complete, the ciders were treated with 50 mg/L SO2 and filtered. For chemical analysis, a portion of each replicate was stored at −8 °C. For sensory analysis, the filtered ciders were bottled and stored at 4 °C.

2.4. Basic Chemical Analysis

2.4.1. Titratable Acidity (TA) and pH

The pH mas measured using a benchtop pH meter (Thermo Scientific Orion Star A211, Waltham, MA, USA). Titratable acidity was measured by titrating a known quantity (5 mL) of juice or cider in a deionized water solution to an endpoint pH of 8.2 with a 0.1 N NaOH solution (Fisher Scientific, Waltham, MA, USA) and expressed as g/L of malic acid.

2.4.2. L-Malic and L-Lactic Acid Analysis

A CDR Beer Lab Analyzer (CDR, Florence, Italy) was utilized to measure the concentration of L-malic and L-lactic acid in the samples. Samples were centrifuged (6000 rpm, 5 min) and the supernatant was used for analysis. The device uses specific reagent kits for each analyte within a pre-calibrated system equipped with an LED photometer. For L-malic acid, the analysis is based on the oxidation of L-malic acid to oxaloacetate, which converts NAD+ to NADH. The L-lactic acid determination is based on the enzymatic conversion of L-lactic acid to pyruvate, which concurrently converts NAD+ into NADH. The NADH concentration is spectrophotometrically measured at 366 nm and correlated to the L-malic and L-lactic acid concentration in the cider samples [13,14].

2.4.3. Phenolic Content

Phenolic content was determined according to a previously reported method [15] with some modifications. The cider samples were centrifuged (6000× g rpm, 5 min) and the supernatant was diluted 1:5 with deionized water. A calibration curve of gallic acid was prepared in a 0–500 mg/L range. A volume of 20 μL of each calibration solution, sample, or blank was placed into a separate microcuvette. To each microcuvette, 1.58 mL of deionized water and 100 μL of Folin–Ciocalteu reagent were added. The mixture was incubated at room temperature for 8 min. After incubation, 300 μL of a 20% sodium carbonate solution was added. The mixtures were incubated at room temperature for 2 h, and absorbance was read at 765 nm with a UV-1900i spectrophotometer (Shimadzu, OR, USA). The results are reported as gallic acid equivalents (GAE) in mg/L.

2.4.4. Antioxidant Activity of Cider

The DPPH method was used to determine antioxidant activity [16]. Analysis was performed with a DPPH Antioxidant Kit (Dojindo Molecular Technologies Inc., Gaithersburg, MD, USA). Cider samples were centrifuged at 6000 rpm for 5 min, and the supernatant was used for analysis. A DPPH working solution and Trolox standards (0, 40, 60, and 80 μg/mL) were prepared according to kit instructions. In a 96-well plate, 20 μL of Trolox standards or sample were added to each well, followed by 80 μL of assay buffer and 100 μL of DPPH solution. The microplate was incubated for 30 min at 25 °C, and absorbance was measured at 517 nm using a microplate reader (xMark Microplate Absorbance Spectrophotometer, BIO RAD, Hercules, CA, USA). Results were expressed as Trolox equivalent antioxidant capacity (TEAC), calculated from the IC50 of Trolox and the sample, defined as the concentration of antioxidant required to scavenge 50% of initial DPPH radicals.

2.4.5. Alcohol Content and Brix Measurements

A Density Meter 4500 M and Alcolyzer (Anton Paar, Graz, Austria) were used to measure alcohol content (%v/v) and degrees Brix (°Bx). Cider samples were centrifuged (6000× g rpm, 5 min) and degassed prior to analysis.

2.5. Volatile Compound Analysis

Volatile compounds were analyzed by gas chromatography flame ionization detection (GC-FID). Volatile compounds of interest were selected based on peer-reviewed literature data [17,18], as well as preliminary qualitative analysis of the volatile profiles of the ciders. Compounds selected for analysis were acetaldehyde, ethyl acetate, isoamyl alcohol, and phenylethyl alcohol. The Beer-48 Method with some modifications was used for volatile analysis [19].

2.5.1. Volatile Solution Preparation

A volatile compound stock solution was prepared to optimize compound separation and calculate response factors. The stock solution was prepared as follows: 100 µL of acetaldehyde, ethyl acetate, and phenylethyl alcohol were placed in a 100 mL volumetric flask, the flask was brought to volume with 5% ethanol. In a separate 100 mL volumetric flask, a volume of 400 µL of isoamyl alcohol was added, and the flask was brought up to volume with 5% ethanol. A working calibration solution was prepared in a 100 mL flask by adding 10 mL of the acetaldehyde, ethyl acetate, and phenylethyl alcohol stock solution and 10 mL of the isoamyl alcohol stock solution. The volumetric flask was diluted to volume with 5% ethanol. A five-point calibration curve was prepared by serial dilution of the working calibration solution. The curve was prepared by diluting volumes of 0, 0.5, 1, 5, 10, and 20 mL of the working calibration solution with a 5% ethanol solution into separate 50 mL volumetric flasks. A stock solution of 1-butanol (internal standard) was also prepared [19]. To prepare the IS solution, 50 µL of 1-butanol was added to a 50 mL volumetric flask, and the flask was brough to volume with 100% ethanol.

2.5.2. Gas Chromatography Flame Ionization Detection (GC-FID)

For GC-FID analysis, a volume of 1 mL of each calibration curve standard was placed in a 2 mL autosampler vial, followed by the addition of 50 µL of the internal standard solution. The same procedure was followed for the cider samples. An Agilent 7890B GC (Agilent Scientific, Santa Clara, CA, USA, CN10847018) equipped with a flame ionization detector and a HP-5 ms (length = 30 m, internal diameter = 0.25 mm, film thickness = 0.25 µm) column was used for the analysis. The carrier gas was helium, with a set flow rate of 3.5 mL/min. The following temperature program was used: 70 °C for 8 min, increased at a rate of 10 °C/min to 90 °C and held for 4 min, increased to 165 °C at a 25 °C/min rate, no hold, increased to 210 °C at a 75 °C/min rate, and held for 10 min. Compounds were identified by retention time comparison with reference standards analyzed previously using the same procedure. Quantification of volatile compounds was performed using the calibration curve method as described by the American Society of Brewing Chemists method: Beer-48 [19].

2.6. Sensory Analysis

A trained panel evaluated the cider samples. The trained panel consisted of 14 panelists (three males, eleven females, age range 21–22 years of age). Ciders were evaluated for bitterness, sourness, astringency, and aroma intensity. A hedonic acceptance test for taste was also carried out. The project received approval by the California Polytechnic State University Institutional Review Board (IRB) (IRB protocol #2021-257) and all participants signed written consent prior to participation. Bottles of commercial dry cider were used as a base cider to prepare the sensory standards for sensory training. Commercial dry ciders were purchased at a local cidery and stored at 4 °C.

2.6.1. Panel Training

Training was performed at the California Polytechnic State University Food Science and Human Nutrition culinary classroom. Panel training was conducted over four sessions, each lasting between forty-five minutes and one hour. Panelists were trained with reference standards to recognize and score the intensity of cider aroma, bitterness, sourness, and astringency. For the training sessions, an unstructured line scale with the terms “low intensity” and “high intensity” as anchor points was used. For attribute recognition training, standards were prepared in water and presented to the panelists during the first training session to allow panelists to familiarize themselves with the sensory descriptors. Standard solutions were prepared in commercial dry ciders for the intensity training. The standard solutions contained 2 g/L of caffeine (Sigma Aldrich, St. Louis, MO, USA) for bitterness, 2.66 g/L of malic acid (LD Carlson Company, Kent, OH, USA) for sourness, and 1.5 g/L tannic acid (Sigma Aldrich, St. Louis, MO, USA) for astringency. Commercial dry cider was used as the low standard for the attributes being evaluated, while the high standard consisted of the standard solutions prepared with dry cider as the solvent. Various solutions of different concentrations prepared with dry cider were presented to the panelists during training to discuss and evaluate. For aroma intensity training, commercial cider was used to represent the high aroma intensity, and water was used to represent the lowest intensity. To avoid color bias, samples were served in black cups.

2.6.2. Formal Evaluations

Formal sensory evaluations were conducted over four sessions in individual sensory booths at the J. Lohr Sensory Laboratory of the Wine & Viticulture department at California Polytechnic State University. During the first three sessions, each treatment (control, Cider 20, Cider 35, Cider 50) was evaluated in triplicate, with panelists assessing twelve ciders per session. To avoid color bias, ciders were presented to panelists monadically under red lights. The sample serving order followed a balanced randomized complete block design. A volume of 20 mL of cider was served to panelists at laboratory temperature (18 °C) in ISO glasses labeled with four-digit random codes and covered with an aluminum foil top. Ciders were evaluated for aroma, sourness, astringency, and bitterness intensity using a 60-point unstructured line scale with the terms “low intensity” and “high intensity” as anchor points. Panelists cleansed their palates with unsalted crackers (Nabisco unsalted tops, premium saltine crackers, East Hanover, NJ, USA) and water (Evian natural spring water, Evian, France) between samples during a required 30 s rest period. Panelists were given a 5 min break after the sixth cider sample to minimize fatigue. During the fourth and final evaluation session, samples were analyzed for likeness of taste using a 9-point hedonic scale from 1 = “dislike extremely” to 9 = “like extremely”. Results were collected with RedJade Sensory Software (version 5.1.0, Tragon Corporation, Palo Alto, CA, USA).

2.7. Statistical Analysis

One-way ANOVA (p < 0.05) was used to analyze chemical and volatile profile data. Two-way ANOVA (p < 0.05) was performed on sensory panel data, with treatment and panelists as the main effects. All ANOVAs were followed by Tukey’s HSD to determine significant differences between means. Pearson ‘s correlation coefficient (r) was used to calculate the correlation between total phenolic content and antioxidant activity data. JMP Statistical Software (version 17.0.0; Cary, NC, USA) was used for analysis.

3. Results and Discussion

3.1. Properties of Apple Juice and Cider Samples

The results of the effect of pomace addition on the chemical composition of cider samples are shown in Table 1. The initial degrees Brix (°Bx) of the apple juice was 14.68 ± 0.77, and all cider samples showed °Bx values between 1.81 and 2.25 after fermentation. Degrees Brix is a measurement of the concentration of dissolved solids in cider, particularly the amount of sugars [20]; therefore, the decrease observed in the ciders compared to the juice was expected as S. cerevisiae consumes sugars during alcoholic fermentation.
The results show a significant (p < 0.05) increase in alcohol by volume (ABV) for ciders fermented with apple pomace (Table 1). The increase in ABV could be due to higher nutrient levels during fermentation provided by the apple pomace. Previous studies have shown that apple pomace contains nutrients such as sugars and nitrogen, and that its incorporation into apple juice can increase the levels of these nutrients [1,9,21]. Therefore, its addition during fermentation may have increased nutrient levels, potentially promoting more vigorous fermentation compared to the control ciders and contributing to the observed increase in ABV. A limitation of this study is that sugar and nitrogen levels were not measured prior to fermentation in either the control or the pomace-treated ciders. While the literature supports the idea that these nutrients were introduced through pomace addition—which is reflected in the ABV results—future studies should include these measurements to provide clearer insight into the role of pomace addition in impacting fermentation parameters.
The pH value of the control cider was slightly lower compared to the apple juice, but no significant difference was observed. This small decrease was expected as organic acids are produced during fermentation, which decrease the pH value. However, the organic acids produced are weak, and as a result, they are only partially dissociated; as pH is a measure of the concentration of free hydrogen, the weak acids will not produce major changes in the pH level at the end of fermentation. The titratable acidity (TA) results show significantly higher (p < 0.05) acidity levels for the control cider compared to the apple juice. The increase in TA observed is the result of organic acid production during the fermentation process [22].
Ciders fermented with apple pomace had higher pH and lower TA values compared to the control, and the differences were statistically significant (p < 0.05). These results are unexpected, as an increase in organic acids during fermentation will typically lead to higher TA levels and lower pH values. A possible explanation for the observed trend in pH and TA levels is the occurrence of malolactic fermentation. Lactic acid bacteria (LAB) are responsible for the process of malolactic fermentation, which has been shown to lower TA and increase pH in ciders [22]. This study utilized fresh apple pomace, which naturally contains indigenous microorganisms, including lactic acid bacteria (LAB) that carry out malolactic fermentation [23]. Treatments such as drying can eliminate native bacteria [24], but since the pomace used in this study was fresh, it is possible that the lactic acid bacteria (LAB) present in the apple pomace survived and initiated malolactic fermentation.
Malolactic fermentation is a biochemical transformation which converts malic acid into lactic acid. Malic acid is a dicarboxylic acid, and it is stronger that lactic acid, which is a monocarboxylic acid. Thus, lactic acid would contribute less than malic acid to TA, resulting in an increase in pH and decrease in TA following malolactic fermentation [25]. Based on the observed results, it is possible that LAB was added to the fermentation through the use of apple pomace, leading to malolactic fermentation and the observed trends in pH and TA values (Table 1).
To confirm malolactic fermentation, the concentrations of lactic and malic acids were determined. The control cider had a significantly higher concentration of malic acid (p < 0.05) compared to the treatment ciders, while the ciders fermented with apple pomace had higher levels of lactic acid. These findings confirm the occurrence malolactic fermentation in the treatment ciders, explaining the variations in pH and TA observed. These results align with previous studies on cider and wine, where similar trends in acid profiles were observed [25,26,27].

3.2. Phenolic Analysis

The total phenolic content (TPC) of the control cider decreased by 44% after fermentation (Table 2). This observation is consistent with previous studies, which also reported lower levels of TPC after cider fermentation compared to the apple juice [1,27]. The reduction in TPC most likely occurred during fermentation and could be the result of the bioconversion of compounds by yeast, oxidative reactions, esterification, hydrolysis, or the polymerization of phenolic compounds [8,27,28].
Cider 35 and Cider 50 contained significantly higher (p < 0.05) levels of phenolic compounds compared to the control. Cider 20 also showed a higher phenolic content than the control, but the increase was not statistically significant. Based on these results, it can be concluded that the presence of apple pomace during fermentation increased the phenolic compound levels in the ciders, resulting in the observed increase in TPC. The addition of apple pomace is comparable to the red winemaking maceration process. During maceration in red wines, grape material remains in contact with the juice during fermentation, allowing phenolic compounds to be extracted through leakage and diffusion [29]. Since both processes are similar, phenolic extraction in this study likely occurred through initial cellular leakage from broken apple skin cells during milling, followed by diffusion during fermentation as the pomace remained in contact with the apple juice. To gain a more complete understanding of the behavior of phenolic compounds during fermentation, future studies should include TPC measurements at multiple time points during the fermentation process. We acknowledge this as a limitation of the current study.
Phenolic compounds are well known for their antioxidant properties. Previous studies have reported a correlation between the phenolic content of apples and their antioxidant activity, with different phenolic compounds exhibiting varying levels of antioxidant capacity [30,31]. In this study, the DPPH method was used to assess the antioxidant activity of the cider samples. This method was selected because it is commonly applied to both cider and wine for evaluating antioxidant properties [32,33,34]. No significant difference (p < 0.05) was observed in antioxidant activity between the control and the ciders with apple pomace addition (Table 2). Additionally, the correlation between total phenolic content (TPC) and antioxidant activity was not statistically significant (r = 0.72, p = 0.28).
The results from the antioxidant analysis were unexpected, as a higher phenolic content would theoretically lead to increased antioxidant activity. However, various factors can influence the determination of antioxidant activity, including the choice of assay and specific analysis conditions. A study by Thaipong et al. (2006) evaluated the DPPH, ABTS, ORAC, and FRAP methods for measuring antioxidant activity and found that the FRAP method demonstrated the highest reproducibility and the strongest correlation with phenolic content [35]. Similarly, Bortolini et al. (2020) assessed the antioxidant activity of ciders using the ABTS, FRAC, CUPRAC, and DPPH methods, reporting that the DPPH method showed the smallest increase in antioxidant activity compared to the other assays [1]. These findings suggest that the DPPH method may have limited sensitivity in detecting changes in antioxidant activity, which could help explain the results observed in the present study.
In addition to the choice of assay, factors such as pH can also influence antioxidant activity measurements. Ferri et al. (2013) found that the DPPH method performs optimally within a pH range of 4 to 8 [36]. Since the pH of the samples in the present study ranged from 3 to 4, the results may not accurately reflect the true antioxidant activity of the different samples. Therefore, the current data does not allow for confirmation of any changes in antioxidant activity. It is likely that both the assay used and the pH conditions were suboptimal, which may have affected the outcome of the analysis. To more accurately assess the impact of apple pomace addition on antioxidant activity, it is strongly recommended that future studies employ multiple antioxidant assays and optimize experimental conditions.

3.3. Effect of Pomace Addition on Volatile Profile

Volatile compounds contribute to the sensory quality of cider. During fermentation, these compounds are produced by yeast, and their production is influenced by processing conditions such as yeast concentration, yeast strain, apple varietal, fermentation temperature, nutrient composition, oxygenation, and other factors. The impact of volatile compounds on the sensory quality of cider is dependent on their presence and concentration [3,37]. The effect of apple pomace addition on the cider volatile profile was analyzed by gas chromatography. For this study, acetaldehyde, isoamyl alcohol, ethyl acetate, and penylethyl alcohol were selected for analysis. These compounds were chosen because they represent different chemical classes—esters, alcohols, and aldehydes—commonly found in ciders. The results are presented in Table 3.
The addition of apple pomace influenced the volatile profile of the ciders. The concentrations of ethyl acetate, isoamyl alcohol, and phenylethyl alcohol were higher in the treatment ciders. The increase in ethyl acetate and isoamyl alcohol was statistically significant (p < 0.05) for all treatment ciders compared to the control, while the increase in phenylethyl alcohol was only significant (p < 0.05) for Cider 35 and Cider 50 samples compared to the Cider 20 and the control.
A significant decrease (p < 0.05) was observed for acetaldehyde concentration in all ciders with pomace addition (Table 3). Acetaldehyde is a volatile aldehyde produced as a by-product of yeast metabolism during fermentation. When present in low concentrations, it imparts apple-like flavor and aroma notes and is considered to make a positive contribution to the sensory profile of cider. However, at high concentrations, the compound imparts solvent-like notes, which are considered a defect [39]. Previous studies on wine have shown that during fermentation, LAB degrades acetaldehyde into acetic acid and ethanol, thereby lowering its concentration [40]. As previously discussed, the treatment ciders underwent malolactic fermentation, strongly suggesting the presence of LAB. Therefore, it is possible that the LAB introduced by the apple pomace reduced the concentration of acetaldehyde during alcoholic fermentation.
The treatment ciders contained higher levels of ethyl acetate than the control. Ethyl acetate is an ester produced from the ethanolysis of acetyl Co-A during fermentation. When present in low concentrations, the compound imparts a fruity flavor characterized as pear-like, while at higher concentrations, it contributes acetic aromas, which are considered negative notes. Ethyl acetate production is affected by many factors, including aeration, fermentation temperature, and yeast types, amongst others [41]. A previous study on wild yeast growth during alcoholic fermentation in wines showed that wild yeast can grow in grape must and impact wine composition; the researchers found that wines contained higher levels of ethyl acetate when wild yeast was present [42]. Both bacteria and wild yeast are known to be present in apple pomace [43]; therefore, it is likely that the observed increase in ethyl acetate levels is due to production by wild yeast present in the apple pomace, in addition to production by the inoculated Saccharomyces cerevisiae.
The concentrations of isoamyl alcohol and phenylethyl alcohol were higher in ciders with apple pomace addition. Isoamyl alcohol is associated with banana and fruity notes, while phenylethyl alcohol contributes rose and flowery notes to alcoholic beverages [44]. Both compounds are produced during fermentation from oxo acids, which originate from amino acid and sugar metabolism [44,45]. Previous studies have reported that higher alcohols are synthesized from corresponding amino acids and sugars [45]. Higher alcohol formation is influenced by the fermentation temperature, oxygenation, as well as the amino acid and sugar compositions in the fermentation medium.
The increase in the levels of higher alcohols in the treatment ciders could be due to production by wild yeast from the apple pomace. Additionally, the apple pomace could have also contributed additional amino acids and sugars to the apple juice, which likely increased the production of higher alcohols by the inoculated yeast. These results align with previous studies, which have observed that the application of maceration in cidermaking and the use of wild yeast in winemaking result in increased levels of higher alcohols in the final products [42,45].

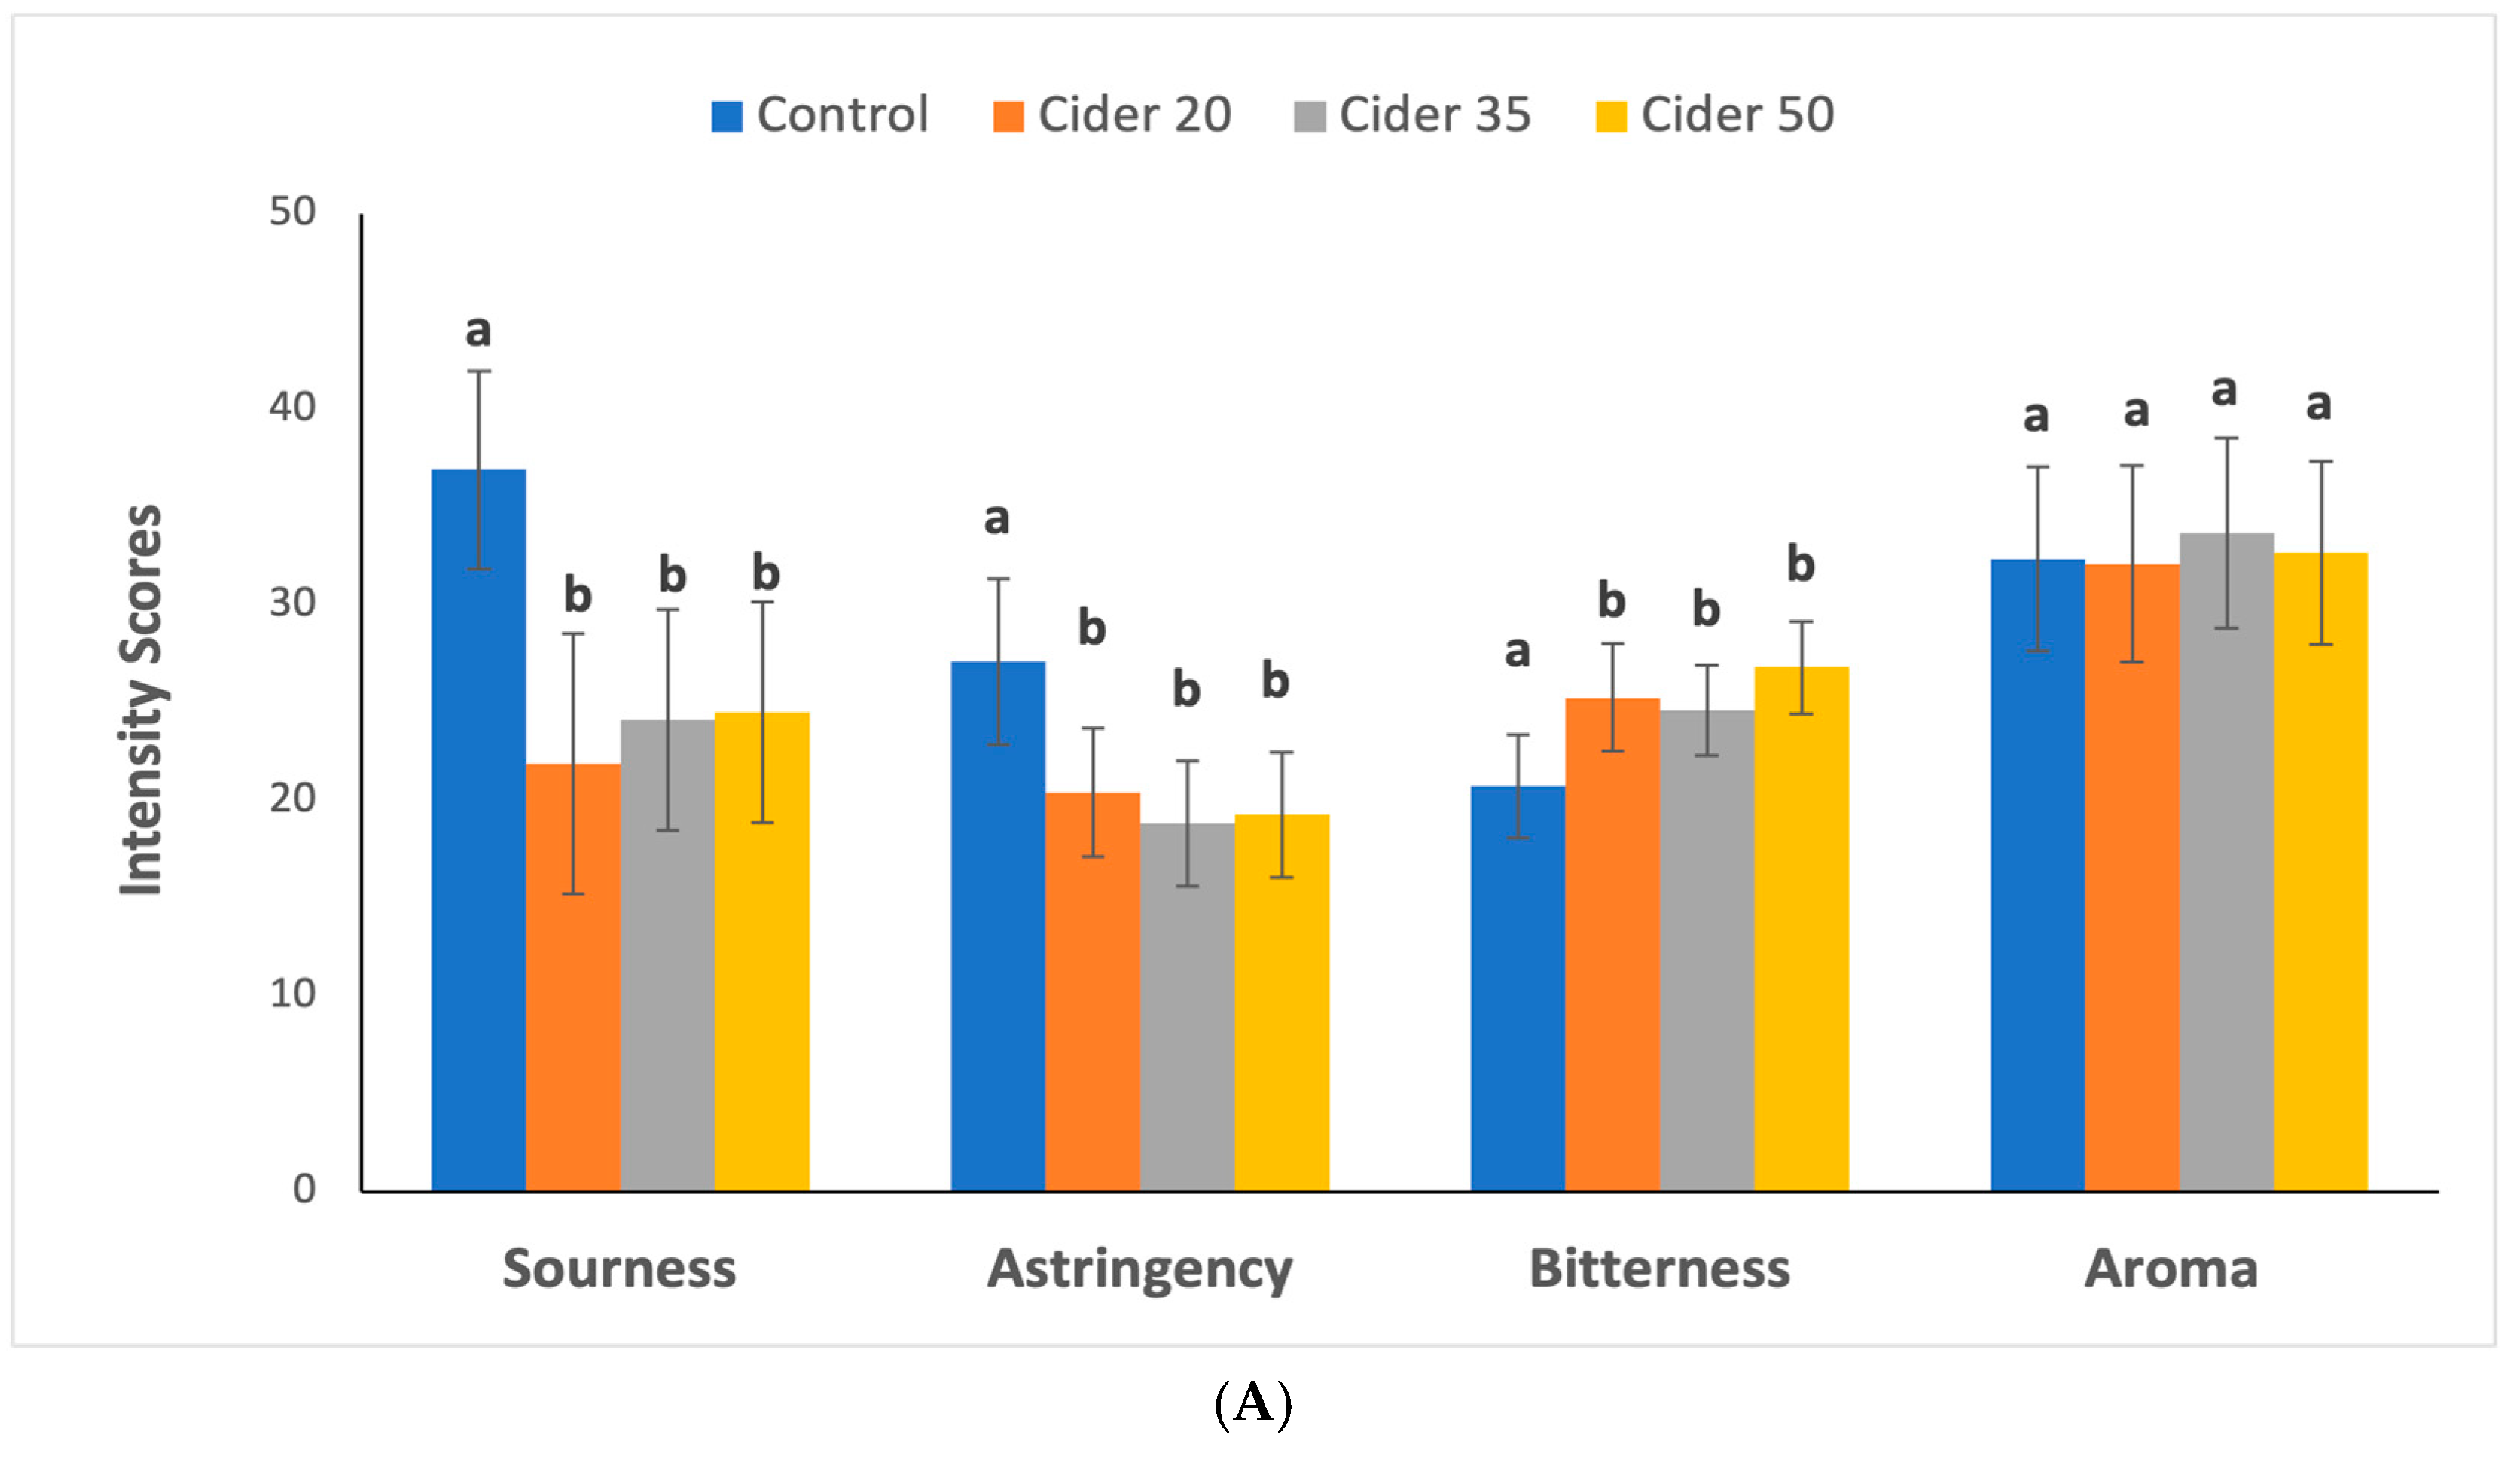
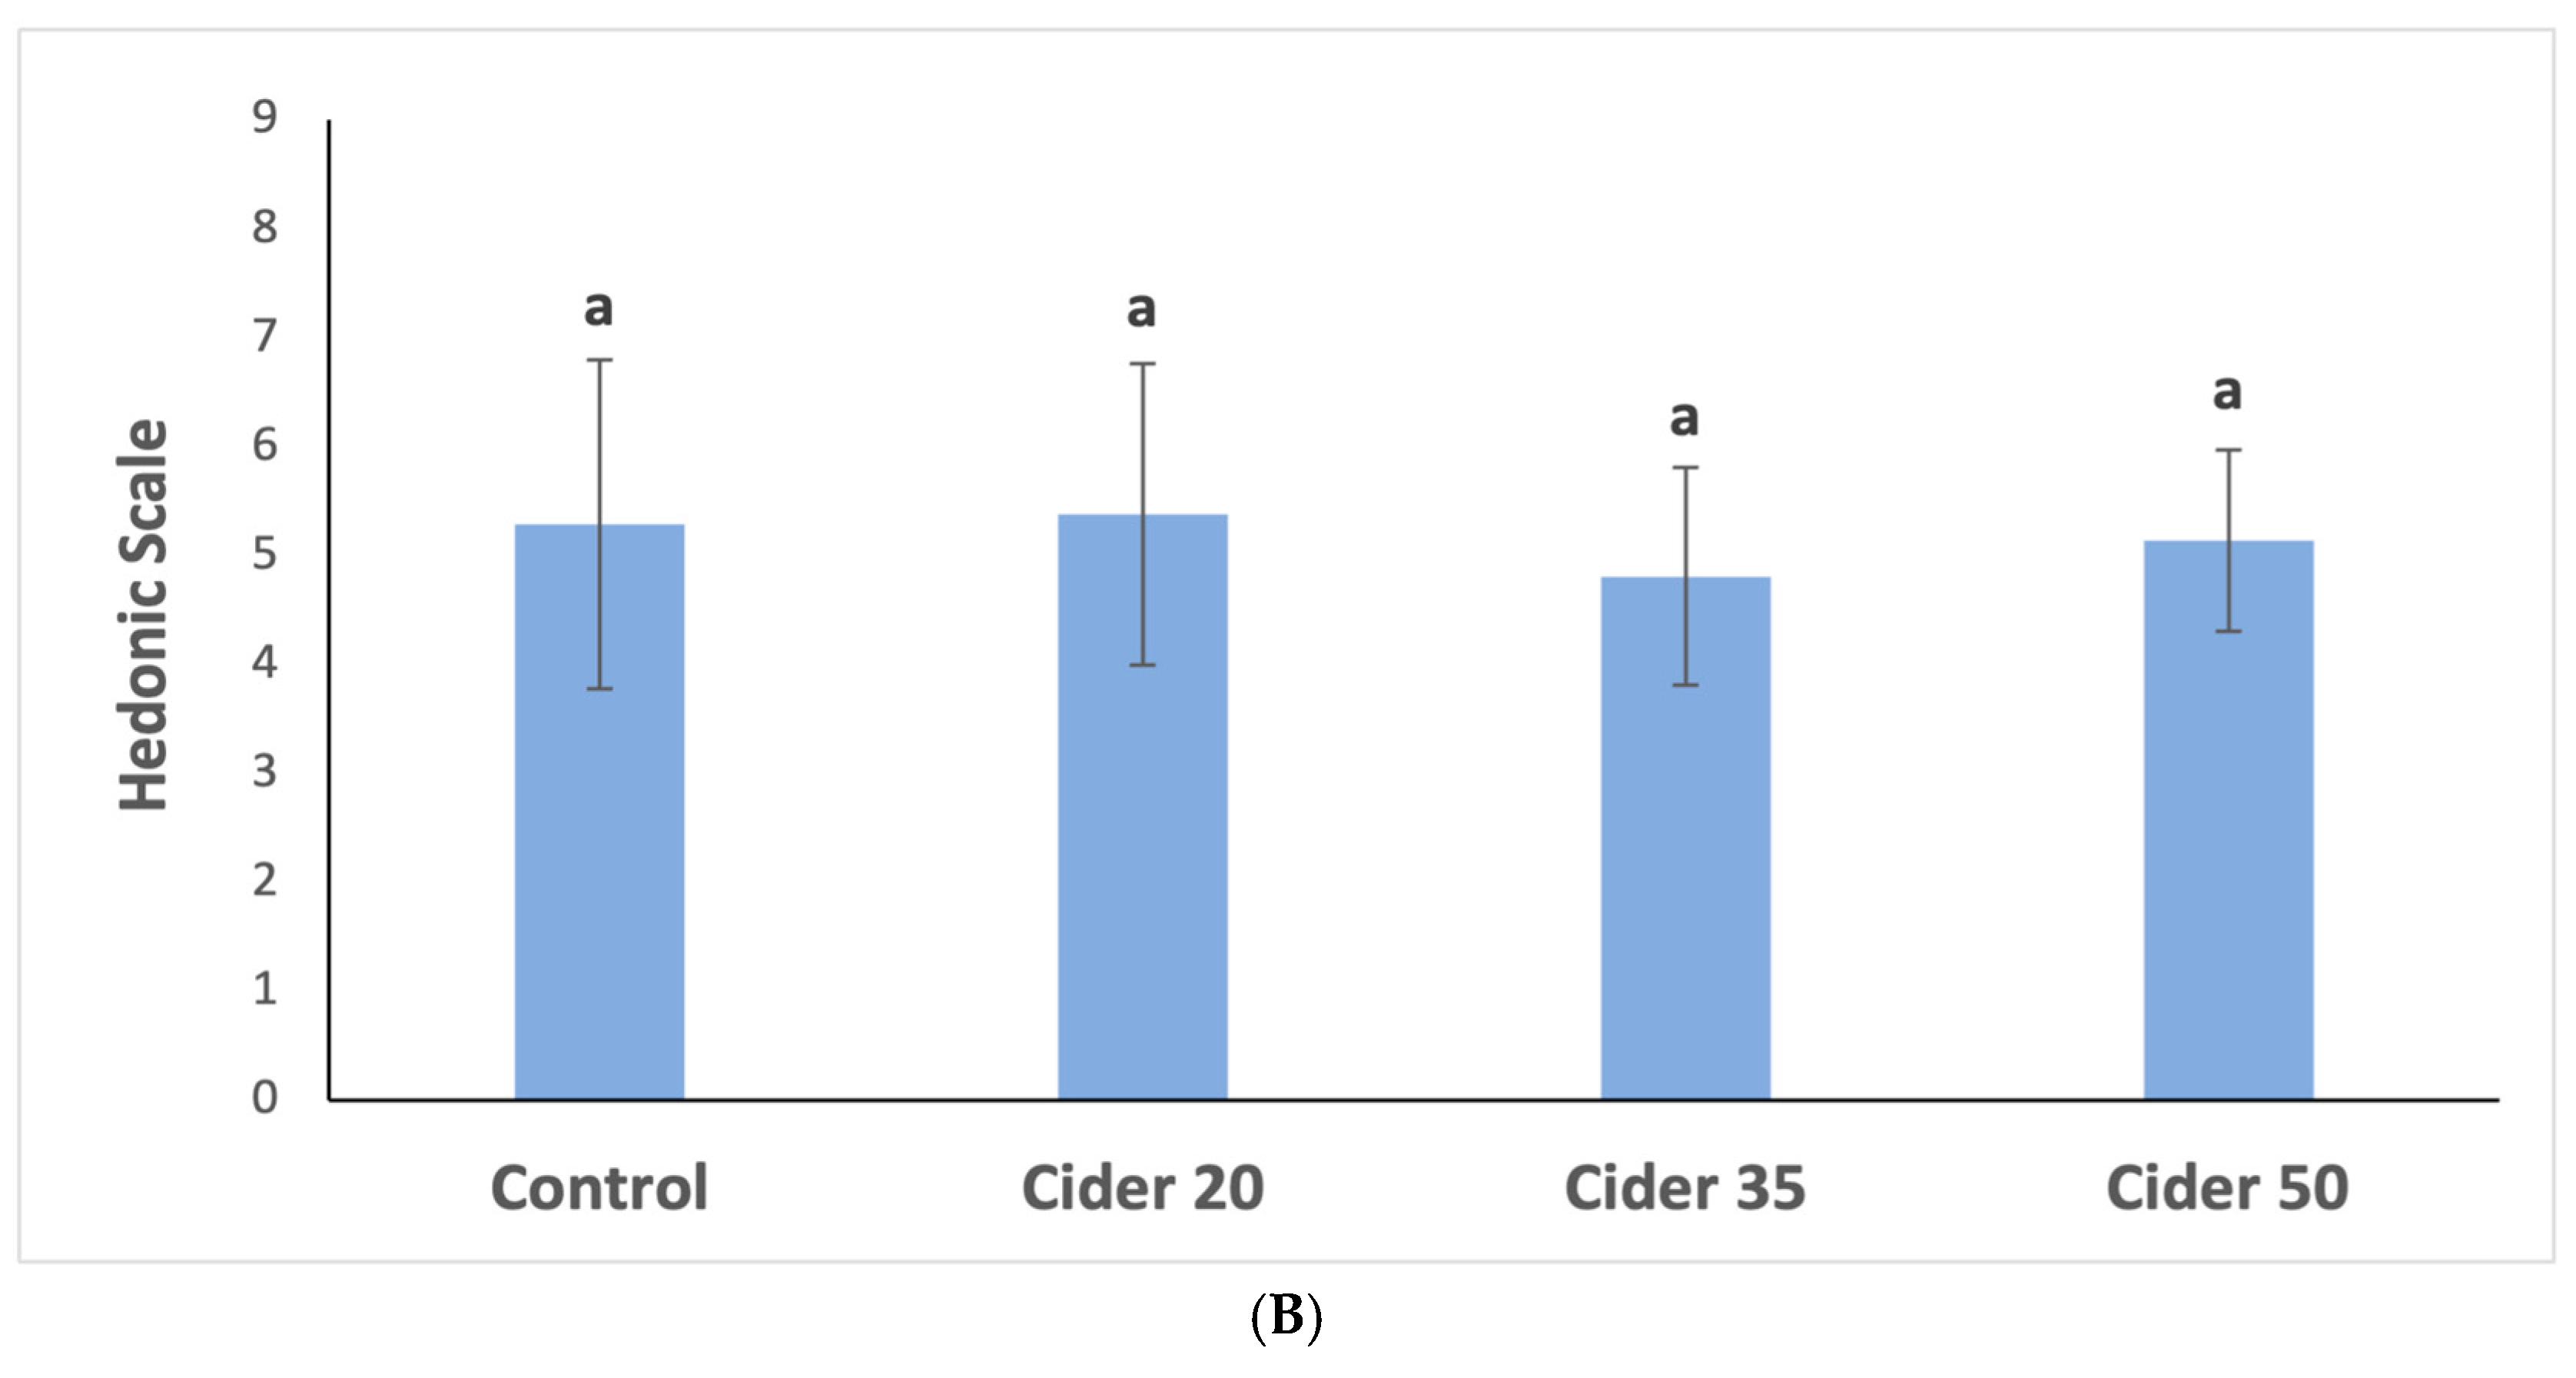
3.4. Sensory Analysis Results

Results for the intensity scores of the attributes evaluated in the cider samples are shown in Figure 1. According to the ANOVA of the sensory data, there was no significant difference (p < 0.05) between ciders for aroma intensity and acceptance. The volatile profile data (Table 3) showed a higher concentration of alcohol and ester compounds in the treatment ciders; however, this increase in compound levels was not accompanied by a higher perception of aroma. These results suggest that sensory perception data did not correlate with the volatile profile data. Previous studies have also reported that sensory evaluation does not always align with chemical composition data, as many factors can influence aroma perception. In a study by Castro and Ross (2018), the researchers reported no correlation between volatile compound concentrations and sensory aroma perception in beer solutions, the authors concluded that the nonvolatile fraction composition affected the aroma perception of the samples [46]. Therefore, it is possible that the aroma perception in the cider samples may have been influenced by the composition of the cider matrix, resulting in differences between the sensory and volatile profile data.
Ciders with apple pomace addition had significantly lower (p < 0.05) sourness perception than the controls (Figure 1). This decrease in sourness could be a result of their lower TA levels. Previous studies have demonstrated that sourness is strongly correlated to TA [47,48]. Additionally, the presence of malolactic fermentation could also help explain the sensory results. During malolactic fermentation, malic acid is converted to lactic acid, resulting in a reduced perception of sourness, as lactic acid is less intense than malic acid at equal concentrations [49].
Bitterness perception was significantly higher (p < 0.05) in ciders with apple pomace addition (Figure 1). This increase is likely related to the higher levels of phenolic compounds in the treatment ciders. Phenolic compounds contribute to bitterness in ciders. [48]. The observed increase in bitterness perception aligns with previous research, which has concluded that the phenolic content impacts bitterness in both wines and ciders [1,50,51].
Astringency perception was significantly lower (p < 0.05) in ciders fermented with apple pomace (Figure 1). Astringency is the sensory perception described as dryness, and is mainly attributed to phenolic compounds known as tannins. Tannins bind with salivary proteins and form insoluble complexes, causing a reduction in salivary lubrication properties, resulting in the dryness sensation [52]. The tannin content in dessert apples is very low [52], and as a result, ciders produced from these type of apples will exhibit low tannin levels. While higher levels of phenolic compounds were observed in ciders with the incorporation of apple pomace during fermentation, it is possible that tannin levels were not increased significantly. Apple pomace is also known to contain polysaccharides such as pectin, which is known to interfere with complex formation between tannins and salivary proteins [53]. Therefore, the incorporation of apple pomace could have led to the extraction of pectin into the ciders. The presence of pectin in the ciders with apple pomace likely interfered with the tannin–salivary protein interaction, which would explain the decrease in perceived astringency.
The acceptance test showed no significant difference (p < 0.05) in hedonic taste scores between the treatment ciders and the control. Although the chemical composition and volatile profile of the ciders were impacted by the addition of apple pomace during fermentation, it did not negatively impact overall taste. While specific taste attributes were influenced, the treatments did not reduce the acceptability of the ciders.

4. Conclusions

This study provides strong evidence that the addition of apple pomace during cider fermentation may enhance the total phenolic content. Although the Folin–Ciocalteu method indicated increased phenolic levels, further validation through the quantification of specific phenolic compounds using techniques such as high-performance chromatography (HPLC) is strongly recommended. Antioxidant activity did not show significant differences between samples, which may be attributed to inappropriate assay selection or suboptimal reaction conditions. Therefore, future research should employ multiple assays to accurately assess antioxidant potential.
Pomace addition appeared to influence chemical and sensory properties of the ciders. Malolactic fermentation occurred in ciders treated with apple pomace, resulting in reduced titratable acidity (TA) and increased pH. Volatile compound analysis showed lower acetaldehyde concentrations and higher levels of isoamyl alcohol, phenylethyl alcohol, and ethyl acetate in pomace-treated ciders. Sensory evaluation suggested that ciders treated with apple pomace were perceived as less sour and astringent, but more bitter than the controls, without significant differences in aroma intensity or taste acceptance. Overall, the addition of apple pomace may be a promising strategy for increasing phenolic content and modifying the chemical and sensory profile of cider. Further studies are warranted to confirm these findings using additional assays and analytical techniques.

Author Contributions

Conceptualization, L.F.C., A.D.A. and K.P.P.; methodology, L.F.C.; formal analysis, L.F.C., A.D.A. and K.P.P.; investigation, L.F.C., A.D.A. and K.P.P., resources, L.F.C.; writing—original draft preparation, L.F.C.; writing—review and editing, L.F.C., A.D.A. and K.P.P.; project administration, L.F.C.; funding acquisition, L.F.C. All authors have read and agreed to the published version of the manuscript.

Funding

This research was funded by the Capacity Building Grants for Non-Land Grant Colleges of Agriculture Program, project award no. 2021-70001-34525, from the U.S. Department of Agriculture’s National Institute of Food and Agriculture.

Institutional Review Board Statement

This project received approval by the California Polytechnic State University Institutional Review Board (IRB) (approval code: IRB protocol #2021-257; approval date: 23 December 2021) and all participants signed a written consent prior to participation.

Informed Consent Statement

Informed consent was obtained from all subjects involved in this study.

Data Availability Statement

The original contributions presented in this study are included in the article. Further inquiries can be directed to the corresponding author(s).

Acknowledgments

The authors would like to thank Swanton Pacific Ranch for the donation of apples for the project.

Conflicts of Interest

The authors declare no conflicts of interest.

References

  1. Bortolini, D.G.; Benvenutti, L.; Demiate, I.M.; Nogueira, A.; Alberti, A.; Zielinski, A.A.F. A new approach to the use of Apple Pomace in Cider Making for the Recovery of Phenolic Compounds. LWT-Food Sci. Technol. 2020, 126, 109316. [Google Scholar] [CrossRef]
  2. Beechum, D. A Cider Primer. In The Everything Hard Cider Book, 1st ed.; Laing, L., Guarco, A., Wissman, P., Palana-Shanahan, B., Eds.; Adams Media: Avon, MA, USA, 2013; Volume 1, pp. 11–19. [Google Scholar]
  3. Riekstina-Dolge, R.; Kruma, Z.; Dimins, F.; Straumite, E.; Karklina, D. Phenolic composition and sensory properties of ciders produced from Latvian apples. Rural. Sustain. Res. 2014, 31, 39–45. [Google Scholar] [CrossRef]
  4. Soomro, T.; Watts, S.; Migicovsky, Z.; Myles, S. Cider and dessert apples: What is the difference? Plants People Planet 2022, 4, 593–598. [Google Scholar] [CrossRef]
  5. Thompson-Witrick, K.A.; Goodrich, K.M.; Neilson, A.P.; Hurley, E.K.; Peck, G.M.; Stewart, A.C. Characterization of the polyphenol composition of 20 cultivars of cider, processing, and dessert apples (Malus × domestica Borkh.) grown in Virginia. J. Agric. Food Chem. 2014, 62, 10181–10191. [Google Scholar] [CrossRef] [PubMed]
  6. Nogueira, A.; Guyot, S.; Marnet, N.; Lequéré, J.M.; Drilleau, J.F.; Wosiacki, G. Effect of Alcoholic Fermentation in the Content of Phenolic Compounds in Cider Processing. Braz. Arch. Biol. Technol. 2008, 51, 1025–1031. [Google Scholar] [CrossRef]
  7. Shahidi, F.; Ambigaipalan, P. Phenolics and polyphenolics in foods, beverages and spices: Antioxidant activity and health effects—A review. J. Funct. Foods. 2015, 18, 820–897. [Google Scholar] [CrossRef]
  8. Benvenutti, L.; Bortolini, D.; Fischer, T.; Zardo, D.; Nogueira, A.; Zielinski, A.; Alberti, A. Bioactive compounds recovered from apple pomace as ingredient in cider processing: Monitoring of compounds during fermentation. J. Food Sci. Technol. 2022, 59, 3349–3358. [Google Scholar] [CrossRef]
  9. Dhillon, G.S.; Kaur, S.; Kaur, S.; Brar, S.K. Perspective of apple processing wastes as low-cost substrates for bioproduction of high value products: A review. Renew. Sustain. Energy Rev. 2013, 27, 789–805. [Google Scholar] [CrossRef]
  10. Benvenutti, L.; Bortolini, D.; Nogueira, A.; Zielinski, A.; Alberti, A. Effect of addition of phenolic compounds recovered from apple pomace on cider quality. LWT-Food Sci. Technol. 2019, 100, 348–354. [Google Scholar] [CrossRef]
  11. Bai, X.L.; Yue, T.L.; Yuan, Y.H.; Zhang, H.W. Optimization of microwave-assisted extraction of polyphenols from apple pomace using response surface methodology and HPLC analysis. J. Sep. Sci. 2010, 33, 3751–3758. [Google Scholar] [CrossRef]
  12. Vilkhu, K.; Mawson, R.; Simons, L.; Bates, D. Applications and opportunities for ultrasound assisted extraction in the food industry—A review. Innov. Food Sci. Emerg. Technol. 2008, 9, 161–169. [Google Scholar] [CrossRef]
  13. CDR Cider Lab Determination of L-Malic Acid in Cider. Available online: https://www.cdrfoodlab.com/cdrciderlab/analyses/malic-acid-cider (accessed on 9 June 2025).
  14. CDR Cider Lab Determination of L-Lactic Acid in Cider. Available online: https://www.cdrfoodlab.com/cdrciderlab/analyses/lactic-acid-cider (accessed on 9 June 2025).
  15. Slinkard, K.; Singleton, V.L. Total Phenol Analysis: Automation and Comparison with Manual Methods. Am. J. Enol. Vitic. 1977, 28, 49–55. [Google Scholar] [CrossRef]
  16. Shimamura, T.; Sumikura, Y.; Yamazaki, T.; Tada, A.; Kashiwagi, T.; Ishikawa, H.; Matsui, T.; Sugimoto, N.; Akiyama, H.; Ukeda, H. Applicability of the DPPH Assay for evaluating the antioxidant capacity of food additives—Inter-laboratory evaluation study. Anal. Sci. 2014, 30, 717–721. [Google Scholar] [CrossRef] [PubMed]
  17. Rosend, J.; Kuldjärv, R.; Rosenvald, S.; Paalme, T. The effects of apple variety, ripening stage, and yeast strain on the volatile composition of apple cider. Heliyon 2019, 5, e01953. [Google Scholar] [CrossRef] [PubMed]
  18. Fan, W.; Xu, Y.; Han, Y. Quantification of volatile compounds in Chinese Ciders by Stir Bar Sorptive Extraction (SBSE) and Gas Chromatography-Mass Spectrometry (GC-MS). J. Inst. Brew. 2011, 117, 61–66. [Google Scholar] [CrossRef]
  19. American Society of Brewing Chemists. Beer–48. Headspace Gas Chromatography-Flame Ionization Detection Analysis of Beer Volatiles. In Methods of Analysis, 14th ed.; The Society: St. Paul, MN, USA, 2011. [Google Scholar]
  20. Mu, Y.; Zeng, C.; Qiu, R.; Yang, J.; Zhang, H.; Song, J.; Yan, J.; Sun, J.; Kang, S. Optimization of the Fermentation Conditions of Huaniu Apple Cider and Quantification of Volatile Compounds Using HS-SPME-GC/MS. Metabolites 2023, 13, 998. [Google Scholar] [CrossRef] [PubMed]
  21. Kennedy, M.; List, D.; Lu, Y.; Foo, L.Y.; Newman, R.H.; Sims, I.M.; Bain, P.J.S.; Hamilton, B.; Fenton, G. Apple Pomace and Products Derived from Apple Pomace: Uses, Composition and Analysis. In Analysis of Plant Waste Materials, 1st ed.; Linskens, H.F., Jackson, J.F., Eds.; Springer: Heidelberg, Germany, 1999; pp. 75–119. [Google Scholar]
  22. Jolicoeur, C. The Acids. In The New Cider Maker’s Handbook, 1st ed.; Watson, B., Walden, H., Eds.; Chelsea Green Publishing: White River Junction, VT, USA, 2013; pp. 177–186. [Google Scholar]
  23. Valles, B.S.; Bedriñana, R.P.; Tascón, N.F.; Simón, A.Q.; Madrera, R.R. Yeast species associated with the spontaneous fermentation of cider. Food Microbiol. 2007, 24, 25–31. [Google Scholar] [CrossRef]
  24. Janiszewska-Turak, E.; Kołakowska, W.; Pobiega, K.; Gramza-Michałowska, A. Influence of Drying Type of Selected Fermented Vegetables Pomace on the Natural Colorants and Concentration of Lactic Acid Bacteria. App. Sci. 2021, 11, 7864. [Google Scholar] [CrossRef]
  25. Reuss, R.M.; Stratton, J.E.; Smith, D.A.; Read, P.E.; Cuppett, S.L.; Parkhurst, A.M. Malolactic Fermentation as a Technique of the Deacidification of Hard Apple Cider. Food Chem. 2010, 75, C74–C78. [Google Scholar] [CrossRef]
  26. Zhao, H.; Zhou, F.; Dziugan, P.; Yao, Y.; Zhang, J.; LV, Z.; Zhang, B. Development of organic acids and volatile compounds in cider during malolactic fermentation. Czech J. Food Sci. 2014, 32, 69–76. [Google Scholar] [CrossRef]
  27. Ye, M.; Yue, T.; Yuan, Y. Evolution of polyphenols and organic acids during the fermentation of apple cider. J. Sci. Food. Agric. 2014, 94, 2951–2957. [Google Scholar] [CrossRef]
  28. Way, M.; Jones, J.; Swarts, N.; Dambergs, R. Phenolic Content of Apple Juice for Cider Making as Influenced by Common Pre-Fermentation Processes using Two Analytical Methods. Beverages 2019, 5, 53. [Google Scholar] [CrossRef]
  29. Setford, P.C.; Jeffrey, D.W.; Grbin, P.R.; Muhlack, R.A. Factors affecting extraction and evolution of phenolic compounds during red wine maceration and the role of process modelling. Trends Food Sci. Technol. 2017, 69, 106–117. [Google Scholar] [CrossRef]
  30. Tsao, R.; Yang, R.; Xie, S.; Sockovie, E.; Khanizadeh, S. Which Polyphenolic Compounds Contribute to the Total Antioxidant Activities of Apple? J. Agric. Food Chem. 2005, 53, 4989–4995. [Google Scholar] [CrossRef] [PubMed]
  31. Lee, K.W.; Kim, Y.J.; Kim, D.O.; Lee, H.J.; Lee, C.Y. Major Phenolics in Apple and Their Contribution to the Total Antioxidant Capacity. J. Agric. Food Chem. 2003, 51, 6516–6520. [Google Scholar] [CrossRef] [PubMed]
  32. Oszmianski, J.; Wolniak, M.; Wojdylo, A.; Wawer, I. Comparative study of polyphenolic content and antiradical activity of cloudy and clear apple juices. J. Sci. Food Agric. 2007, 87, 573–579. [Google Scholar] [CrossRef]
  33. Pincinelli, L.A.; García, Y.D.; Sánchez, J.M.; Madrera, R.R.; Valles, B.S. Phenolic and antioxidant composition of cider. J. Food Compos. Anal. 2009, 22, 644–648. [Google Scholar] [CrossRef]
  34. Romanet, R.; Sarhane, Z.; Bahut, F.; Uhl, J.; Schmitt-Kopplin, P.; Nikolantonaki, M.; Gougeon, R.D. Exploring the chemical space of white wine antioxidant capacity: A combined DPPH, EPR and FT-ICR-MS study. Food Chem. 2021, 355, 129566. [Google Scholar] [CrossRef]
  35. Thaipong, K.; Boonprakob, U.; Crosby, K.; Cisneros-Zevallos, L.; Byrne, D.H. Comparison of ABTS, DPPH, FRAP, and ORAC assays for estimating antioxidant activity from guava fruit extracts. J. Food Compos. Anal. 2006, 19, 669–675. [Google Scholar] [CrossRef]
  36. Ferri, M.; Gianotti, A.; Tassoni, A. Optimization of assay conditions for the determination of antioxidant capacity and polyphenols in cereal food components. J. Food Compos. Anal. 2013, 30, 94–101. [Google Scholar] [CrossRef]
  37. Kliks, J.; Kawa-Rygielska, J.; Gasiński, A.; Rębas, J.; Szumny, A. Changes in the volatile composition of apple and apple/pear ciders affected by the different dilution rates in the continuous fermentation system. LWT 2021, 147, 111630. [Google Scholar] [CrossRef]
  38. Affonso, A.D. The Effects of Co-Fermentation of Cider and Apple Pomace on Cider Attributes. Master’s Thesis, California Polytechnic State University, San Luis Obispo, CA, USA, 2022. [Google Scholar]
  39. Herrero, M.; García, L.A.; Díaz, M. The effect of SO2 on the production of ethanol, acetaldehyde, organic acids, and flavor volatiles during industrial cider fermentation. J. Agric. Food Chem. 2003, 51, 3455–3459. [Google Scholar] [CrossRef] [PubMed]
  40. Osborne, J.P.; DeOrduña, R.M.; Pilone, G.J.; Liu, S. Acetaldehyde metabolism by wine lactic acid bacteria. FEMS Microbiol. Lett. 2000, 191, 51–55. [Google Scholar] [CrossRef] [PubMed]
  41. De la Roza, C.; Laca, A.; García, L.A.; Díaz, M. Ethanol and ethyl acetate production during the cider fermentation from laboratory to industrial scale. Proc. Biochem. 2003, 38, 1451–1456. [Google Scholar] [CrossRef]
  42. Cavazza, A.; Poznanski, E.; Guzzon, R. Must treatments and wild yeast growth before and during alcoholic fermentation. Ann. Micribiol. 2011, 61, 41–48. [Google Scholar] [CrossRef]
  43. Kauser, S.; Murtaza, M.A.; Hussain, A.; Imran, M.; Kabir, K.; Najam, A.; An, Q.U.; Akram, S.; Fatima, H.; Batool, S.A.; et al. Apple pomace, a bioresource of functional and nutritional components with potential of utilization in different food formulations: A review. Food Chem. Adv. 2024, 4, 100598. [Google Scholar] [CrossRef]
  44. Dzialo, M.C.; Park, R.; Steensels, J.; Lievens, B.; Verstrepeen, K.J. Physiology, ecology, and industrial applications of aroma formation in yeast. FEMS Microbiol. Rev. 2017, 41, S95–S128. [Google Scholar] [CrossRef]
  45. Vidrih, R.; Hribar, J. Synthesis of higher alcohols during cider processing. Food Chem. 1999, 67, 287–294. [Google Scholar] [CrossRef]
  46. Castro, L.F.; Ross, C.F. Correlation Between Sensory Descriptive Analysis and Volatile Composition of Beer Using Multivariate Analysis: The Effect of the NonVolatile Matrix on the Sensory Perception and Volatile Fraction Behavior. J. Am. Soc. Brew. Chem. 2018, 76, 86–95. [Google Scholar] [CrossRef]
  47. CoSeteng, M.Y.; McLellan, M.R.; Downing, D.L. Influence of Titratable Acidity and pH of Intensity of Sourness of Citric, Malic, Tartaric, Lactic and Acetic Acids Solutions and on the Overall Acceptability of Imitation Apple Juice. Can. Inst. Food Sci. Technol. J. 1989, 22, 46–51. [Google Scholar] [CrossRef]
  48. Batali, M.E.; Cotter, A.R.; Frost, S.C.; Ristenpart, W.D.; Guinard, J.X. Titratable Acidity, Perceived Sourness, and Liking of Acidity in Drip Brewed Coffee. ACS Food Sci. Technol. 2021, 1, 559–569. [Google Scholar] [CrossRef]
  49. Bergentall, M.K.; Niimi, J.; Persson, I.; Calmet, E.; As, D.; Plovie, A.; Malafronte, L.; Melin, P. Malolactic fermentation in lingonberry juice and its use as a preservative. Food Microbiol. 2024, 121, 104500. [Google Scholar] [CrossRef] [PubMed]
  50. Symoneaux, R.; Chollet, S.; Bauduin, R.; Quéré, J.M.L.; Baron, A. Impact of apple procyanidins on sensory perception in model cider (part 2): Degree of polymerization and interactions with the matrix components. LWT-Food Sci. Technol. 2014, 57, 28–34. [Google Scholar] [CrossRef]
  51. Bestulić, E.; Rossi, S.; Plavša, T.; Horvat, I.; Lukić, I.; Bubola, M.; Ilak Peršurić, A.S.; Jeromel, A.; Radeka, S. Comparison of different maceration and non-maceration treatments for enhancement of phenolic composition, colour intensity, and taste attributes of Malvazija istarska (Vitis vinifera L.) white wines. J. Food Compos. Anal. 2022, 109, 104472. [Google Scholar] [CrossRef]
  52. Karl, A.D.; Zakalik, D.L.; Cook, B.S.; Kumar, S.K.; Peck, G.M. The biochemical and physiological basis for hard cider apple fruit quality. Plants People Planet 2022, 5, 178–189. [Google Scholar] [CrossRef]
  53. Sommer, S.; Anderson, A.F.; Cohen, S.D. Analytical Methods to Assess Polyphenols, Tannin Concentration, and Astringency in Hard Apple Cider. Appl. Sci. 2022, 12, 9409. [Google Scholar] [CrossRef]
Figure 1. Mean intensity scores for taste and aroma of ciders (A). Acceptance scores for cider taste (B). Note: Control: cider with no pomace addition. 20% Pomace: cider with 20% pomace addition. 35% Pomace: cider with 35% pomace addition. 50% Pomace: cider with 50% pomace addition. Results are presented as the mean ± standard deviation for three replicates (n = 3). Different letters above the bars indicate significant differences (p < 0.05).
Beverages 11 00095 g001aBeverages 11 00095 g001b
Table 1. Chemical analysis of apple juice and cider samples.
SamplepHTA
(g/L)
Malic Acid (mg/L)Lactic Acid (mg/L)Degrees Brix
(°Bx)
ABV
(%v/v)
Apple Juice3.65 ± 0.01 a3.72 ± 0.01 a3.01 ± 0.12 a0.07 ± 0.77 a14.68 ± 0.77 a-
Control3.59 ± 0.02 a4.98 ± 0.77 b3.39 ± 0.17 a0.11 ± 0.10 a2.25 ± 0.09 b7.78 ± 0.10 a
Cider 203.92 ± 0.46 b2.90 ± 0.07 c0.27 ± 0.24 b2.34 ± 0.08 b1.81 ± 0.02 c7.91 ± 0.03 b
Cider 353.82 ± 0.113 b3.55 ± 0.64 c1.28 ± 1.10 b1.93 ± 0.62 b1.95 ± 0.10 c, d7.92 ± 0.01 b
Cider 503.83 ± 0.04 b3.27 ± 0.20 c0.55 ± 0.26 b2.42 ± 0.23 b2.03± 0.02 d7.90 ± 0.02 b
Results presented as the mean of three replicates (n = 3) ± standard deviation, Different letters within columns indicate significant differences as analyzed by Tukey’s HSD (p < 0.05). Control: cider with no pomace addition. Cider 20: cider with 20% pomace addition. Cider 35: cider with 35% pomace addition. Cider 50: cider with 50% pomace addition.
Table 2. Total phenolic content and antioxidant activity of apple juice and cider samples.
SampleTPC (mg Gallic Acid/L)DPPH (TEAC)
Apple Juice720 ± 29 a-
Control 400 ± 49 b6.02 ± 0.48 a
Cider 20524 ± 74 b,c5.90 ± 0.18 a
Cider 35647 ± 85 c6.29 ± 0.43 a
Cider 50597 ± 25 c6.25 ± 0.05 a
Results presented as mean of 3 replicates (n = 3) ± standard deviations. Different letters in the same column indicate significant differences as analyzed by Tukey’s HSD (p ≤ 0.05). Control Cider: cider with no pomace addition. Cider 20: cider with 20% pomace addition. Cider 35: cider with 35% pomace addition. Cider 50: cider with 50% pomace addition. TPC: total phenolic content. TEAC: Trolox equivalent antioxidant capacity.
Table 3. Volatile compound concentrations (mg/L) in cider samples [38].
SampleAcetaldehydeEthyl AcetateIsoamyl AlcoholPhenylethyl Alcohol
Control18.94 ± 1.04 a6.95 ± 0.84 a142.52 ± 1.78 a88.34 ± 0.74 a
Cider 2011.76 ± 1.34 b14.80 ± 0.85 b153.61 ± 0.50 b85.75 ± 1.96 a
Cider 359.58 ± 1.15 b14.02 ± 0.40 b153.20 ± 2.34 b97.37 ± 1.77 b
Cider 5010.13 ± 0.75 b19.72 ± 0.90 c166.36 ± 5.34 b120.20 ± 2.04 c
Values are reported in mg/L. Values in the same column with different letters indicate significant differences (p ≤ 0.05). Values are the mean of 3 replicates (n = 3) ± standard deviations. Control: cider with no pomace addition. Cider 20: cider with 20% pomace addition. Cider 35: cider with 35% pomace addition. Cider 50: cider with 50% pomace addition.
Disclaimer/Publisher’s Note: The statements, opinions and data contained in all publications are solely those of the individual author(s) and contributor(s) and not of MDPI and/or the editor(s). MDPI and/or the editor(s) disclaim responsibility for any injury to people or property resulting from any ideas, methods, instructions or products referred to in the content.

