Predicting Wine Quality Under Changing Climate: An Integrated Approach Combining Machine Learning, Statistical Analysis, and Systems Thinking
Abstract
1. Introduction
2. Literature Review
3. Materials and Methods
3.1. Wine Scores and the Dependent Variable
3.2. Geographical Classification of Wine-Growing Regions
3.3. Statistical Analysis: Software and Methods
4. Results
4.1. Results of Statistical Methodological Steps Performed in the SPSS Program
4.1.1. Checking the Normality of the Distribution
4.1.2. Trend Analysis (GLM)
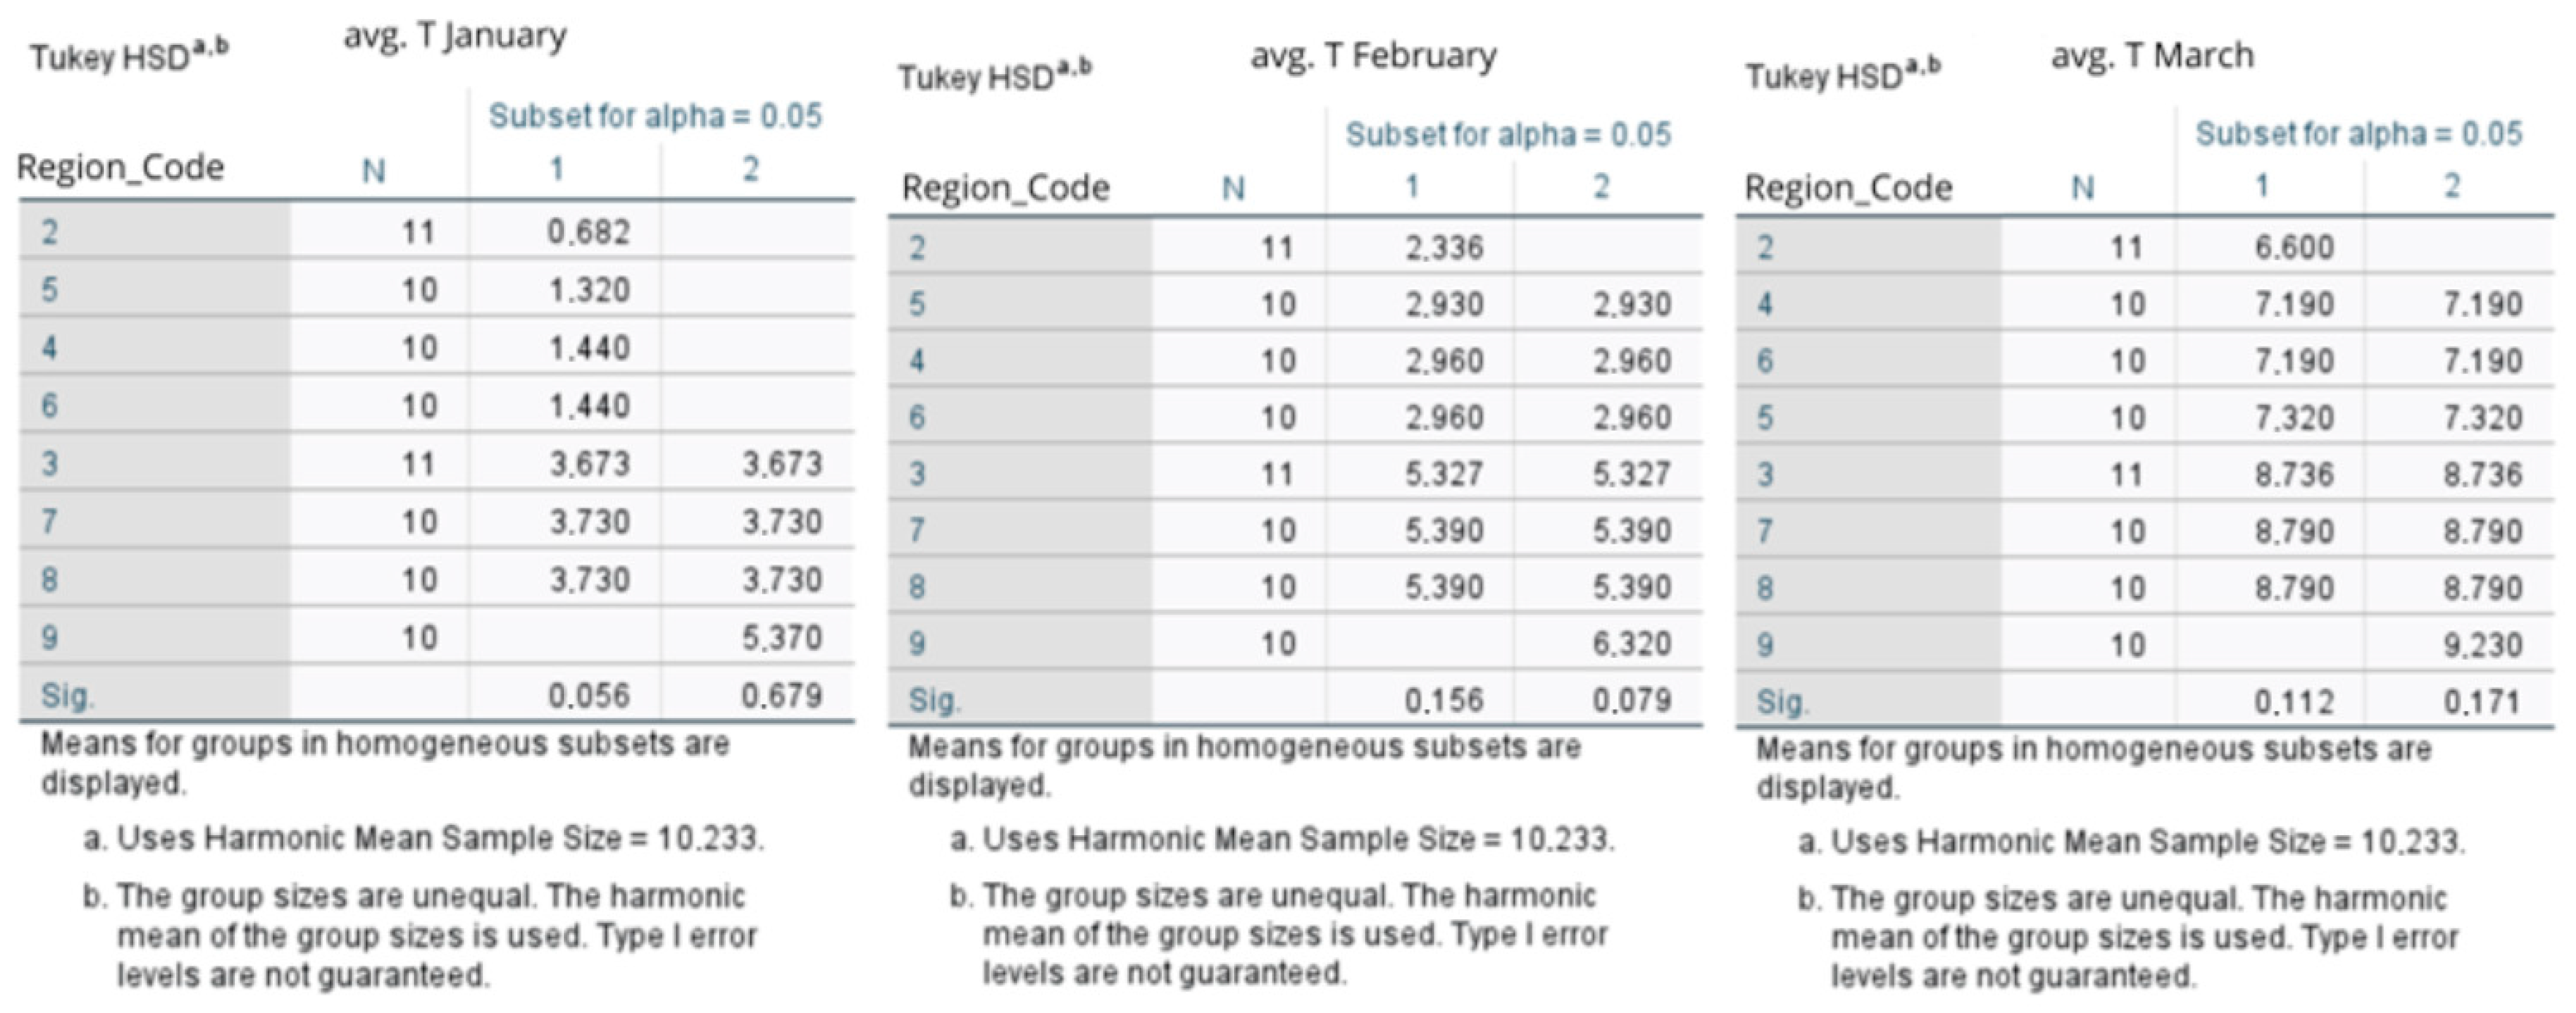
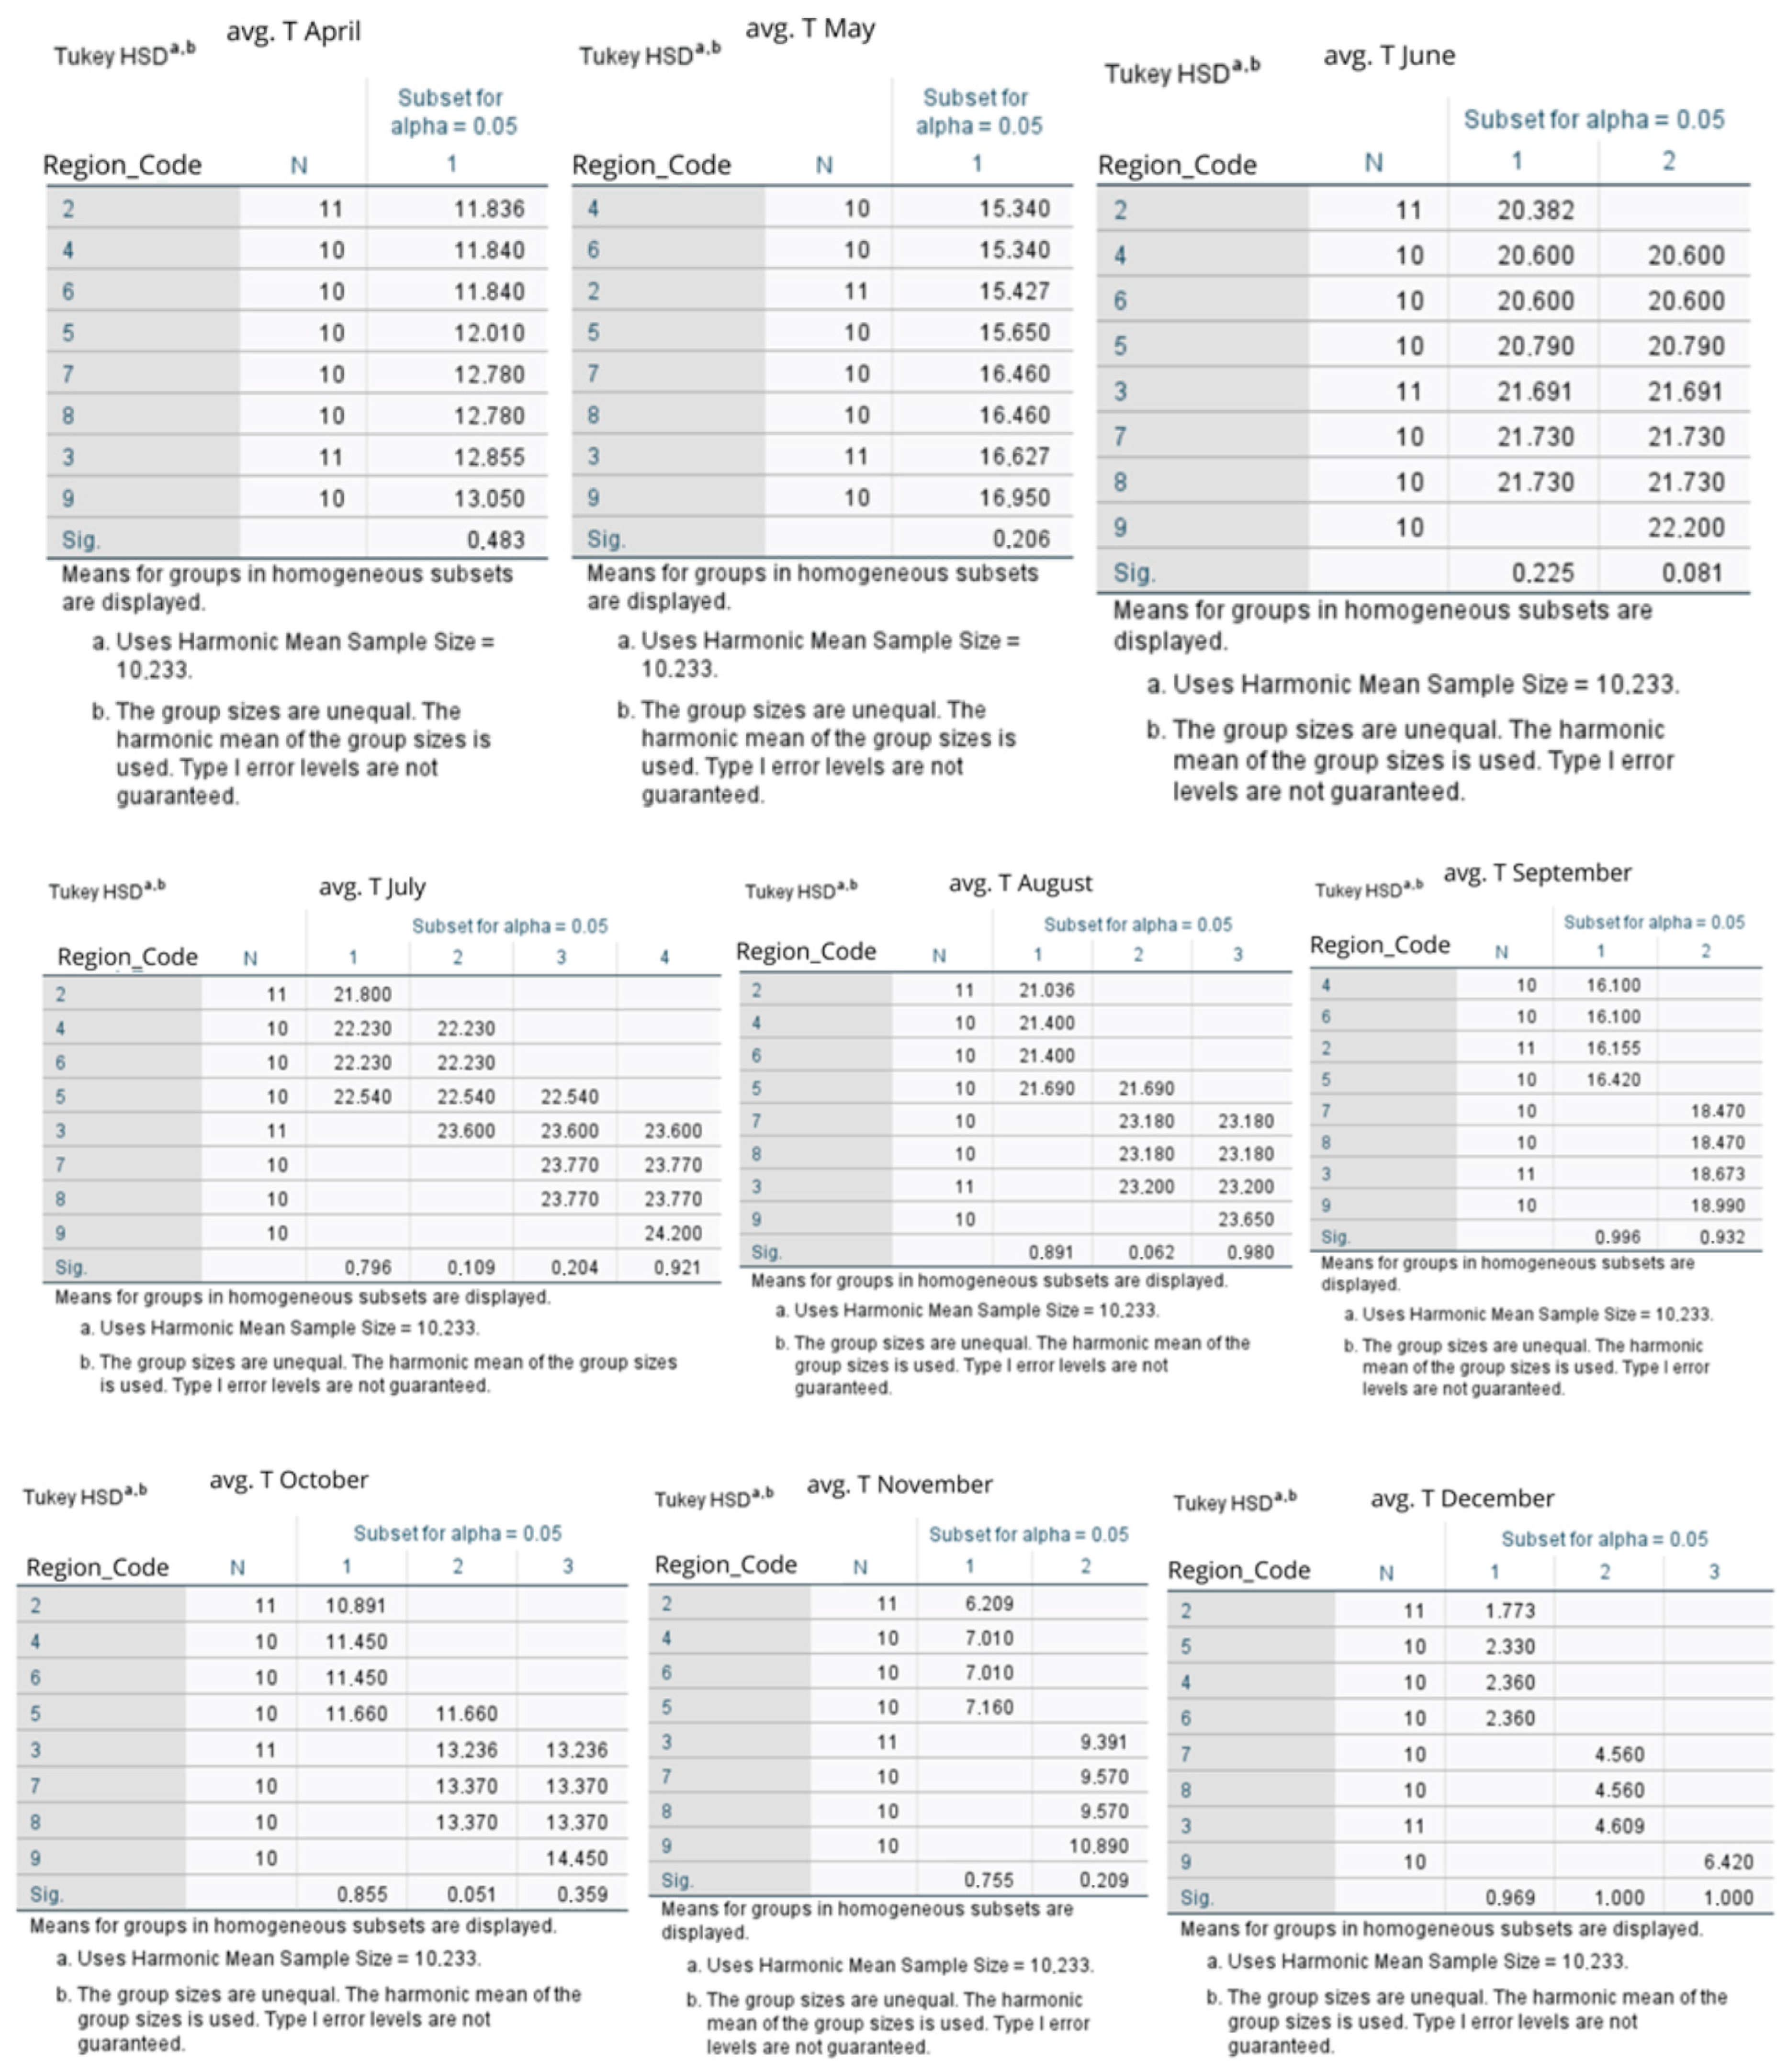
4.1.3. Spatial Differences Between Regions (ANOVA and Kruskal–Wallis)
4.1.4. Correlation Analysis
Relationship Between Temperature and Wine Score
Relationship Between Precipitation and Wine Score
4.1.5. Factor Analysis of Climatic Patterns
- Factor 1: Winter and Spring Influence
- Factor 2: Seasonal Transitions
- Factor 3: Summer Influence (“Hot and Dry Summer”)
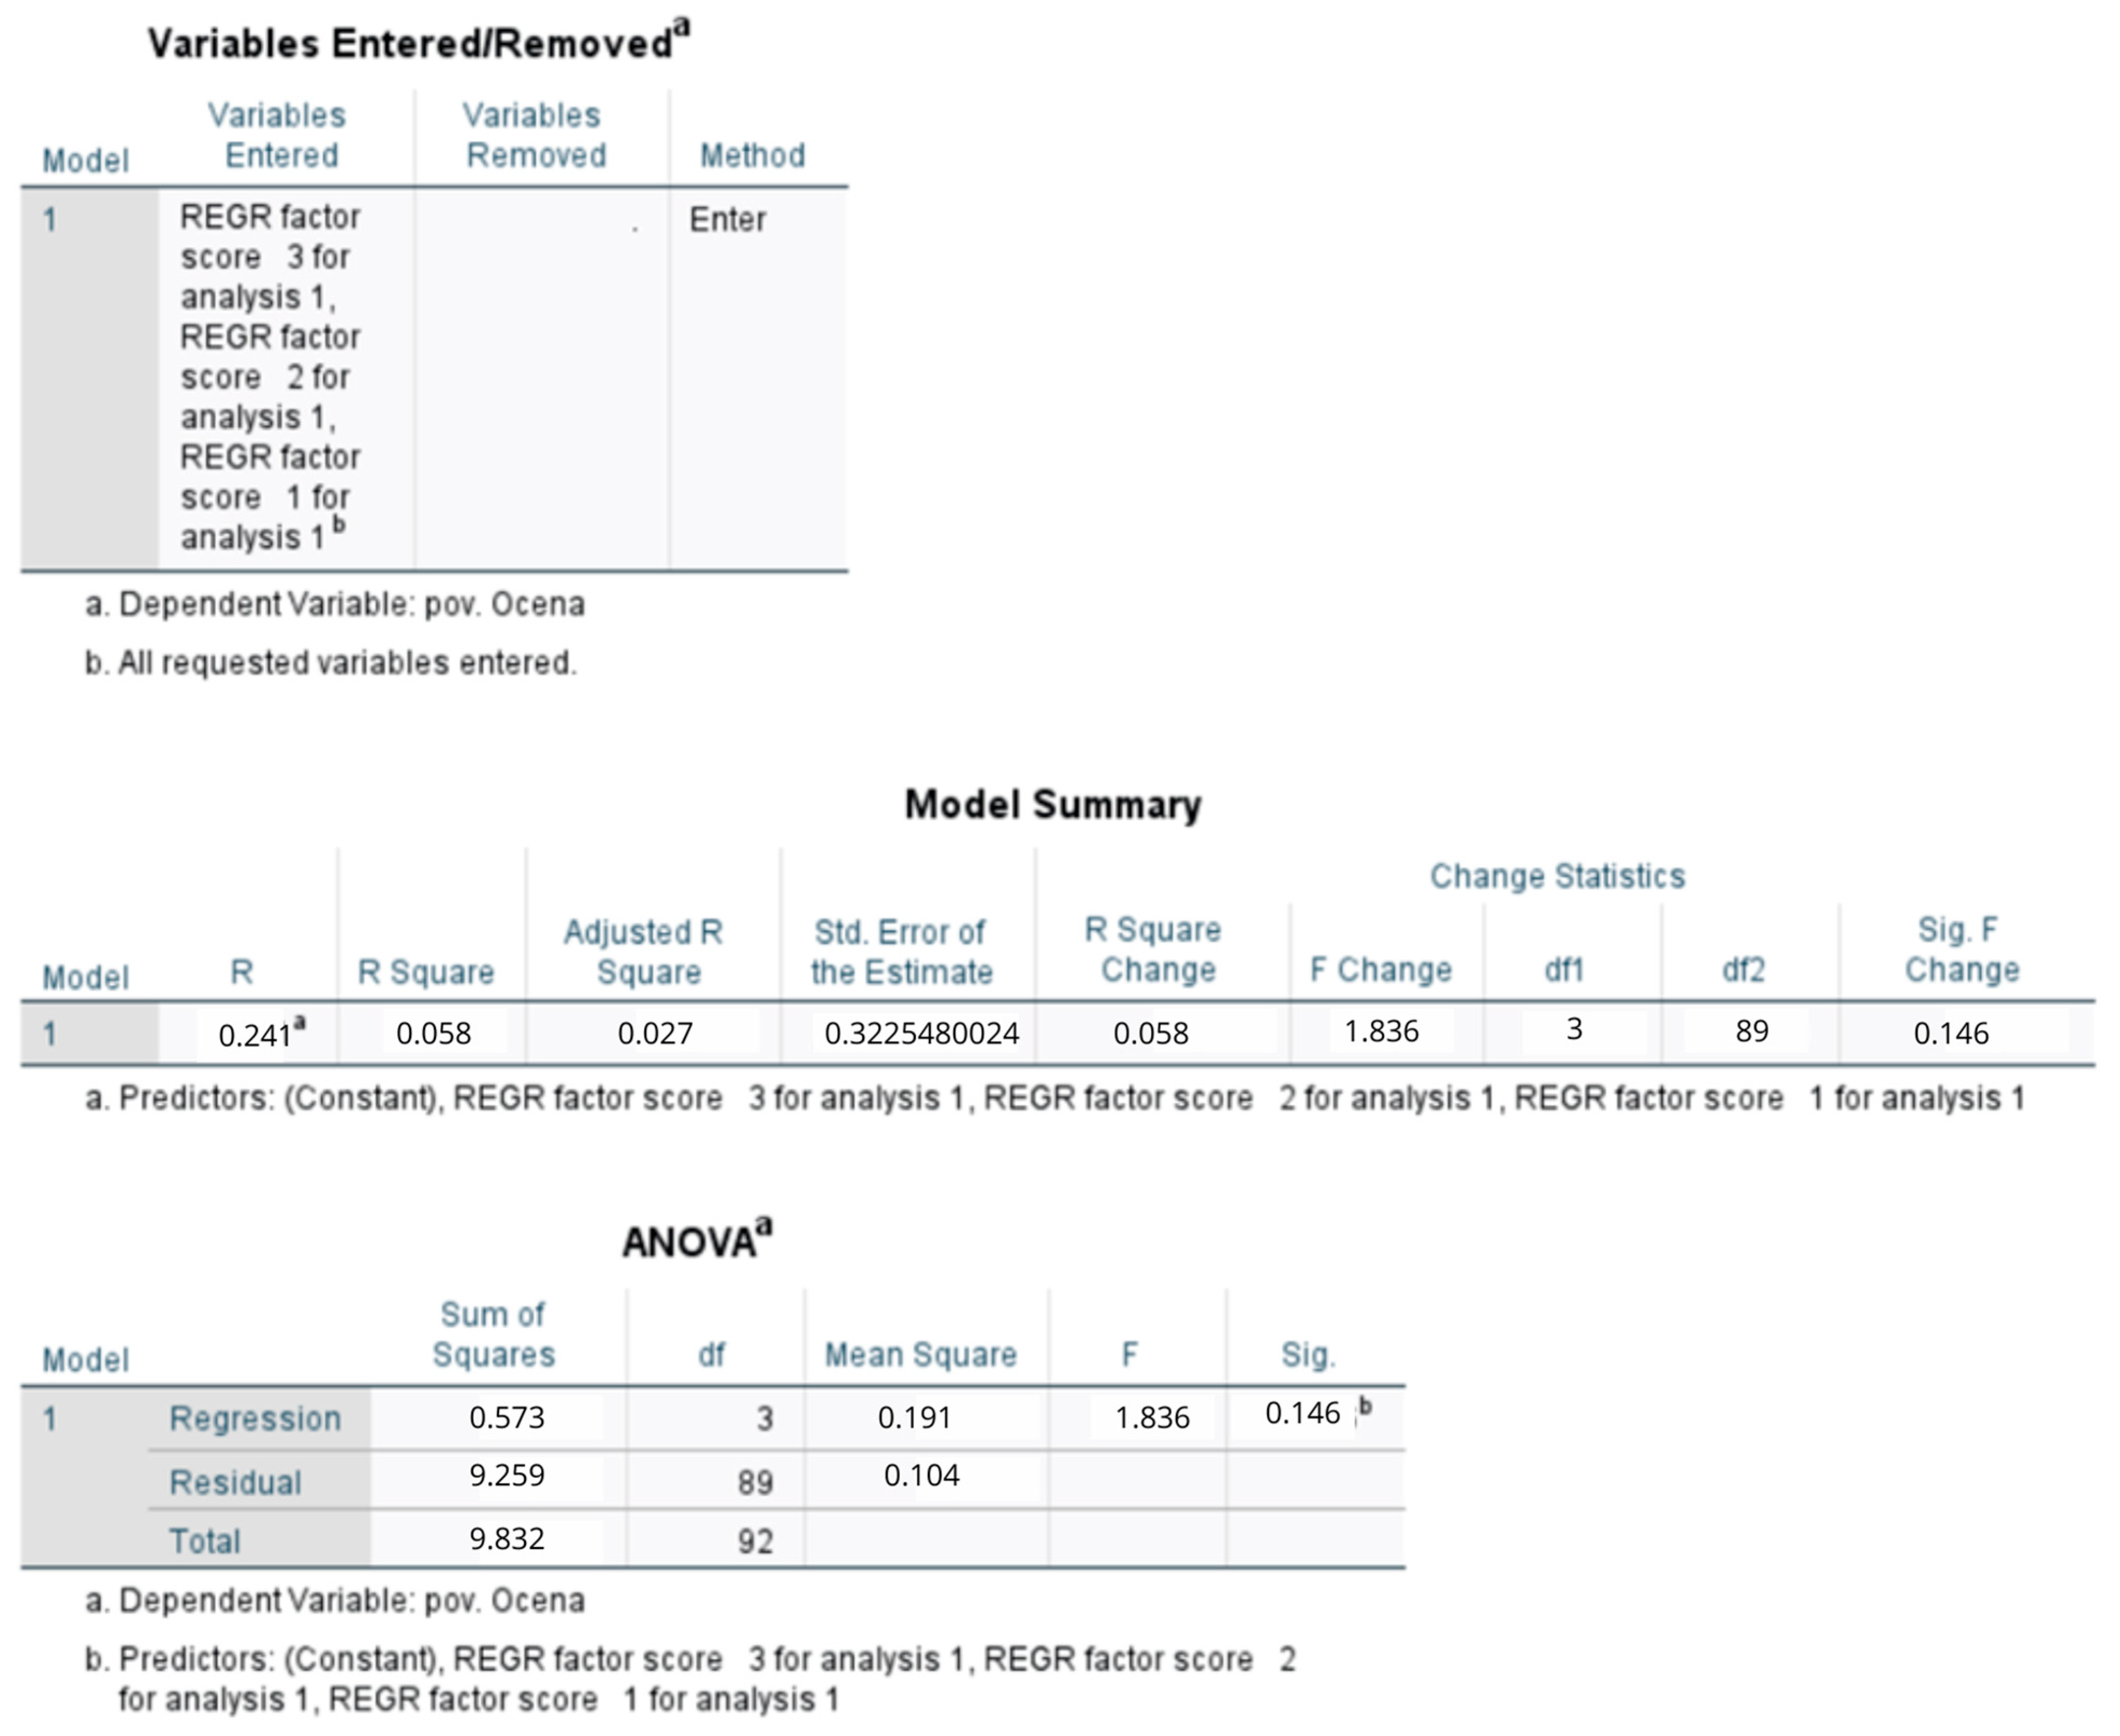
- The overall model was not statistically significant (R2 = 0.058; F(3,89) = 1.836; p = 0.146)
- Only Factor 3 (“hot and dry summer”) was a statistically significant predictor (β = 0.078; p = 0.023)
4.2. Machine Learning Models
4.2.1. Data Preparation and Software Environment
4.2.2. Algorithms Used
- Random Forest—an ensemble model based on multiple decision trees,
- Decision Tree—a single decision tree, useful for rule explanation,
- Support Vector Machine (SVM)—an efficient model for handling high-dimensional data,
- Linear Regression—a baseline model for comparison with ML approaches.
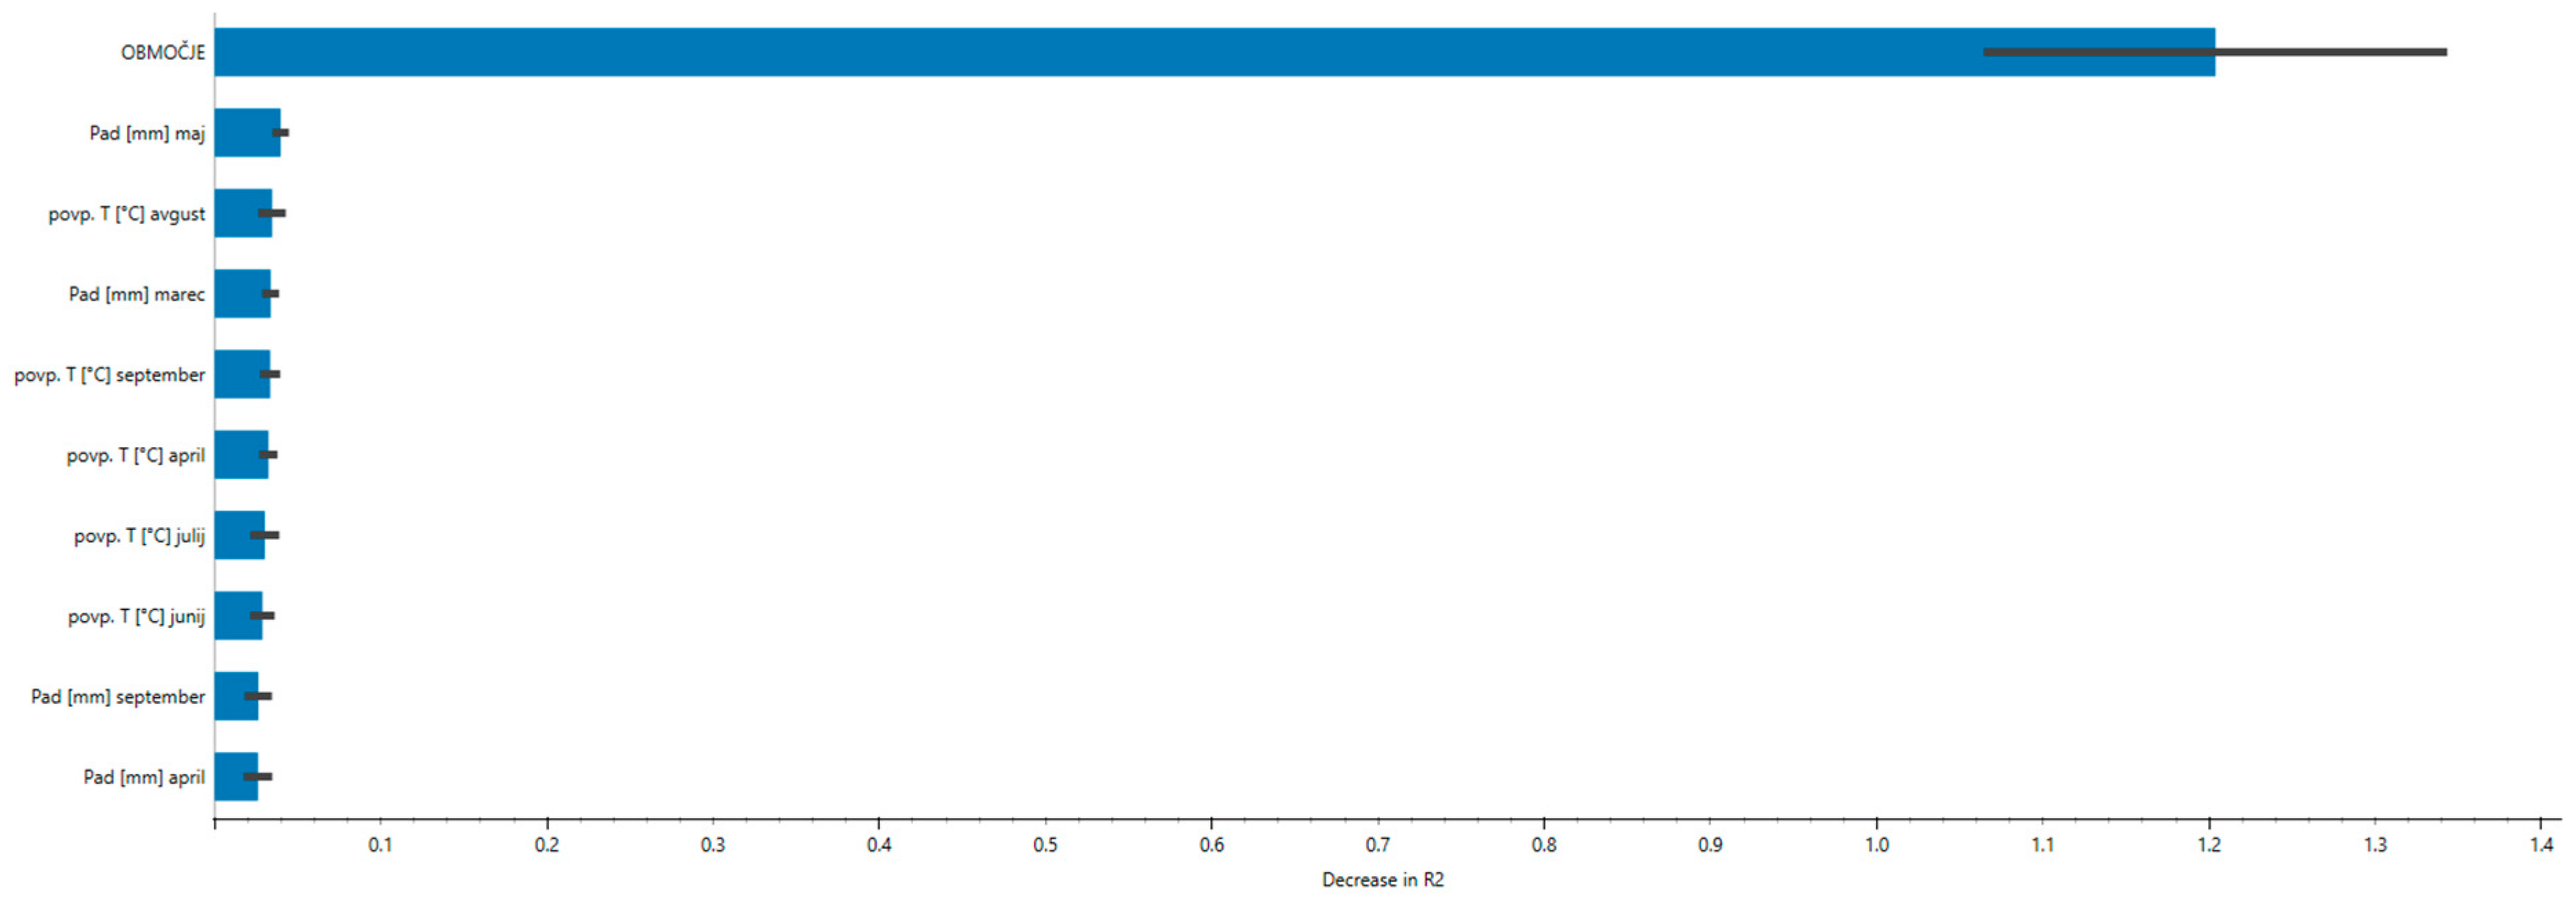
4.2.3. Modeling Results
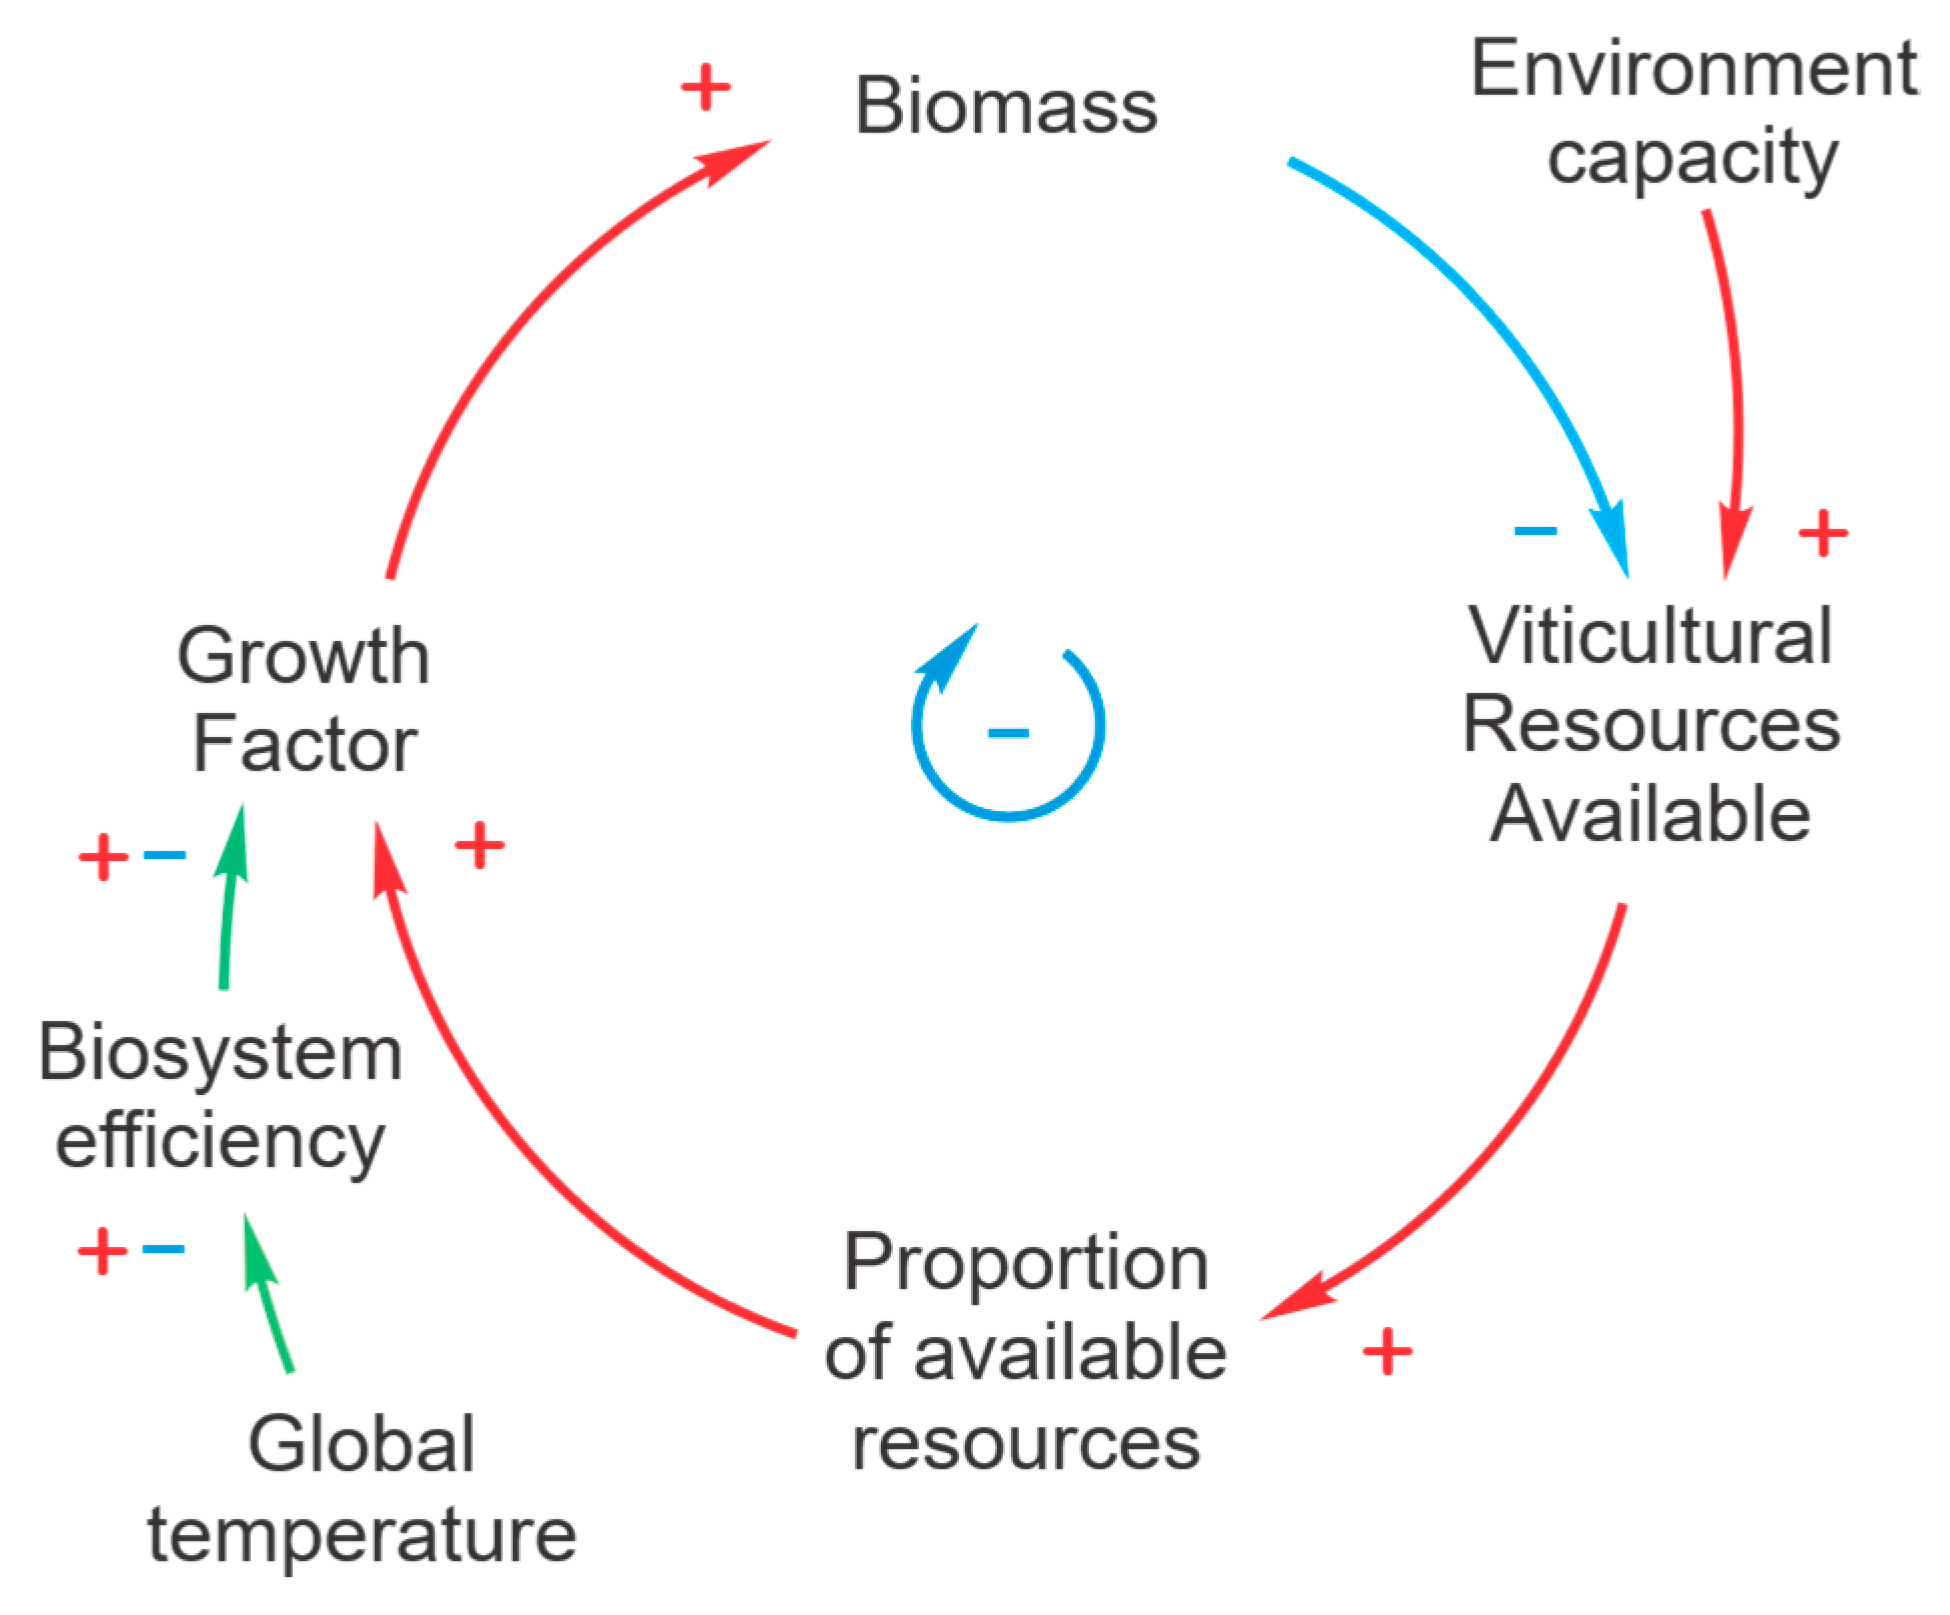
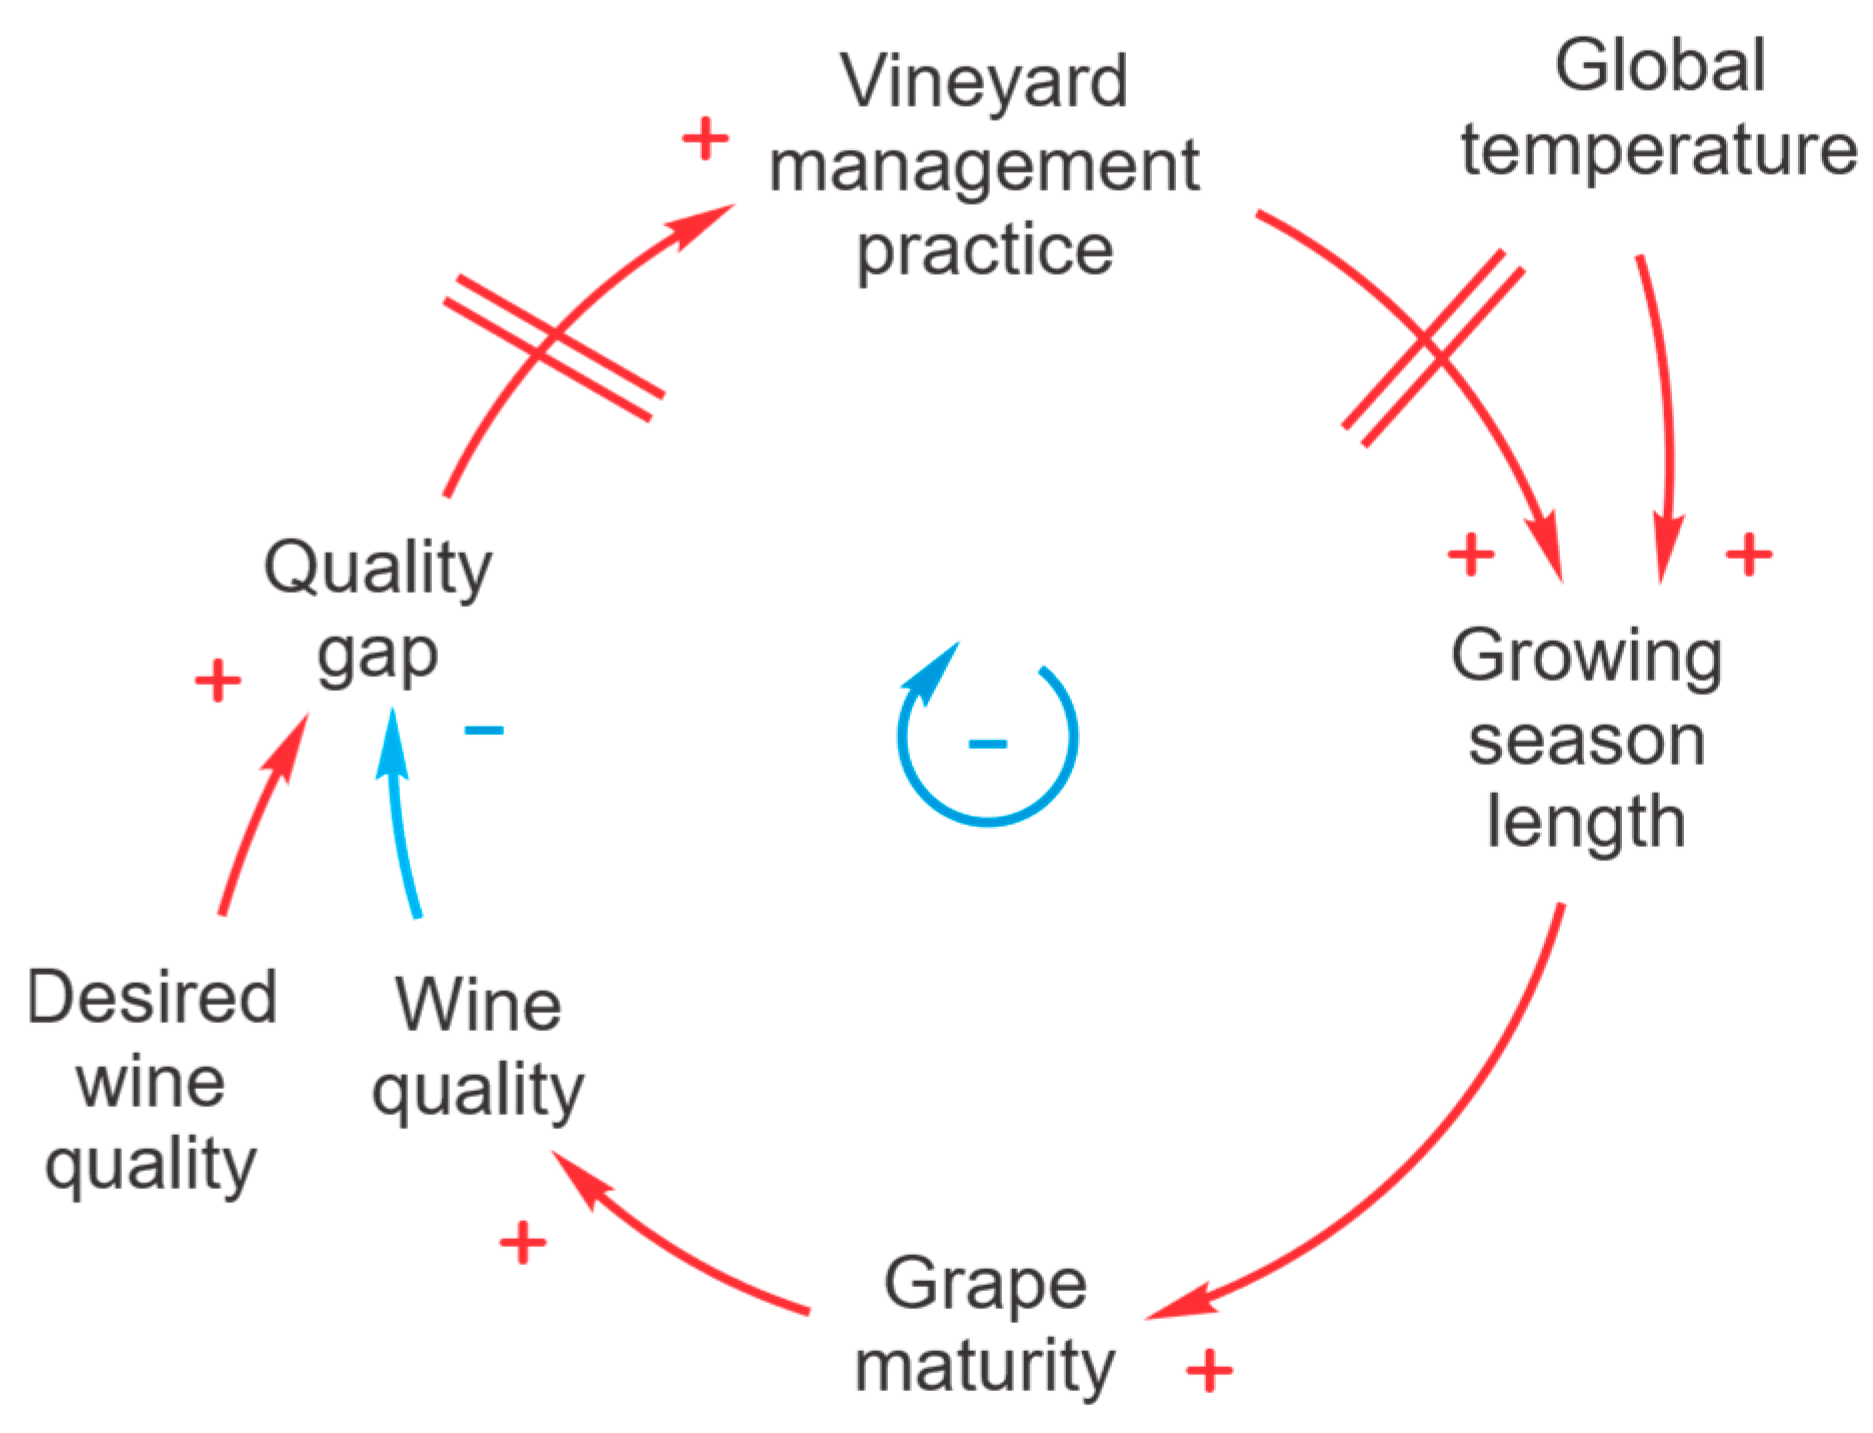
4.3. Systems Approach and Development of CLD Models
5. Discussion
Physiological Impacts of Heat on Vine Functioning and Grape Quality
6. Conclusions
Author Contributions
Funding
Institutional Review Board Statement
Informed Consent Statement
Data Availability Statement
Acknowledgments
Conflicts of Interest
Abbreviations
| ML | Machine Learning |
| CLD | Causal Loop Diagram |
| KGZS | Kmetijsko gozdarska zbornica Slovenije–Agricultural and Forestry Institute Slovenia |
| SVM | Support Vector Machine |
| OIV | Organisation Internationale de la vigne et du vin (French) |
| QSOR | Quantitative Structure–Odor Relationship |
| ANN | Artificial Neural Network |
| ARSO | Slovenian Environment Agency |
| GLM | General Linear Model |
| SPSS | Statistical Package for the Social Sciences |
| R2 | Coefficient of Determination |
| MAE | Mean Absolute Error |
| MSE | Mean Squared Error |
| RMSE | Root Mean Squared Error |
| MAPE | Mean Absolute Percentage Error |
References
- Trigo, A.F.R. Sustainability in the Wine Business: The Development of a Proper and Holistic Assessment Tool for Winegrowing. Ph.D. Thesis, Universidade de Trás-os-Montes e Alto Douro, Vila Real, Portugal, 2025. [Google Scholar]
- Haberla, M. Wine market development in Poland and its impact on regional attractiveness. Zesz. Nauk. Poli. Śląskiej Organ. I Zarządzanie 2024, 192, 345–357. [Google Scholar] [CrossRef]
- Yavas, C.E.; Kim, J.; Chen, L.; Kadlec, C.; Ji, Y. Exploring Predictive Modeling for Food Quality Enhancement: A Case Study on Wine. Big Data Cogn. Comput. 2025, 9, 55. [Google Scholar] [CrossRef]
- Suter, B.; Destrac Irvine, A.; Gowdy, M.; Dai, Z.; van Leeuwen, C. Adapting wine grape ripening to global change requires a multi-trait approach. Front. Plant Sci. 2021, 12, 624867. [Google Scholar] [CrossRef] [PubMed]
- Lima, D.C.; Bento, V.A.; Lemos, G.; Nogueira, M.; Soares, P.M. A multi-variable constrained ensemble of regional climate projections under multi-scenarios for Portugal–part II: Sectoral climate indices. Clim. Serv. 2023, 30, 100377. [Google Scholar] [CrossRef]
- Sgroi, F.; Sciancalepore, V.D. Climate change and risk management policies in viticulture. J. Agric. Food Res. 2022, 10, 100363. [Google Scholar] [CrossRef]
- Godoroja, M.; Nicolaescu, G.; Voinesco, C.; Procopenco, V.; Mogîldea, O.; Dosca, I.; Griza, I. Climatic conditions-important factor of the grapes and wine terroir. Sci. Pap. Ser. B Hortic. 2023, LXVII, 285–291. [Google Scholar]
- Colibaba, L.C.; Bosoi, I.; Pușcalău, M.; Bodale, I.; Luchian, C.; Rotaru, L.; Cotea, V.V. Climatic projections vs. grapevine phenology: A regional case study. Not. Bot. Horti Agrobot. Cluj-Napoca 2024, 52, 13381. [Google Scholar] [CrossRef]
- Comte, G.J.-P.; Goutouly, M.; Garcia de Cortazar-Atauri, M.; Barbeau; Moine, M. Climate Change Is Likely to Alter Grapevine Phenology, Must Quality and Economic Revenues in France’s Loire Valley. Agric. Syst. 2024, 217, 103749. [Google Scholar] [CrossRef]
- Ebrahimi, I.; de Castro, R.; Ehsani, R.; Brillante, L.; Feng, S. Advancing grape chemical analysis through machine learning and multi-sensor spectroscopy. J. Agric. Food Res. 2024, 16, 101085. [Google Scholar] [CrossRef]
- Sterman, J.D. Appropriate summary statistics for evaluating the historical fit of system dynamics models. Dynamica 1984, 10, 51–66. [Google Scholar]
- Sterman, J.D. All models are wrong: Reflections on becoming a systems scientist. Syst. Dyn. Rev. 2022, 18, 501–531. [Google Scholar] [CrossRef]
- Sterman, J. Communicating climate change risks in a skeptical world. Clim. Change 2011, 108, 811–826. [Google Scholar] [CrossRef]
- Luque, A.; Mazzoleni, M.; Zamora-Polo, F.; Ferramosca, A.; Lama, J.R.; Previdi, F. Determining the Importance of Physicochemical Properties in the Perceived Quality of Wines. IEEE Access 2023, 11, 115430–115449. [Google Scholar] [CrossRef]
- Bayoï, J.R.; Vandi, Y.; Foundikou, B.Y.; Etoa, F.X. Traditional Processing, Physicochemical Property, Phytochemical Content, and Microbiological and Sensory Quality of the Yellow “Téa Lémi” Wine Made in the Far-North of Cameroon. J. Food Qual. 2021, 2021, 6634747. [Google Scholar] [CrossRef]
- Sáenz-Navajas, M.P.; Ballester, J.; Fernández-Zurbano, P.; Ferreira, V.; Peyron, D.; Valentin, D. Wine quality perception: A sensory point of view. In Wine Safety, Consumer Preference, and Human Health; Springer Nature: Berlin/Heidelberg, Germany, 2016; pp. 119–138. [Google Scholar] [CrossRef]
- Jackson, R.S. Wine Science: Principles and Applications; Academic Press: Cambridge, MA, USA, 2020. [Google Scholar]
- Doncieux, A.; Demongeot, M.; MacDonald, K.I.; Renard, D.; Caillon, S. Unpacking farmers’ multiple values in grapevine variety choice. Agric. Hum. Values 2025, 1–21. [Google Scholar] [CrossRef]
- Polita, F.S.; Madureira, L. Transition pathways of agroecological innovation in Portugal’s Douro wine region. A multi-level perspective. Land 2021, 10, 322. [Google Scholar] [CrossRef]
- Robinson, J.; Harding, J. (Eds.) The Oxford Companion to Wine; Oxford University Press: Oxford, UK, 2015. [Google Scholar]
- van Leeuwen, C.; Seguin, G. The concept of terroir in viticulture. J. Wine Res. 2006, 17, 1–10. [Google Scholar] [CrossRef]
- Carpena, M.; Fraga-Corral, M.; Otero, P.; Nogueira, R.A.; Garcia-Oliveira, P.; Prieto, M.A.; Simal-Gandara, J. Secondary aroma: Influence of wine microorganisms in their aroma profile. Foods 2020, 10, 51. [Google Scholar] [CrossRef]
- Teissedre, P.L. Composition of grape and wine from resistant vines varieties. OENO One 2018, 52, 211–217. [Google Scholar] [CrossRef]
- Vršič, S. Podnebne Spremembe in Razvoj Vinske Trte. Fakulteta za Kmetijstvo in Biosistemske Vede; Univerzitetni Center za Vinogradništvo in Vinarstvo Meranovo: Maribor, Slovenia, 2016. [Google Scholar]
- Williamson, J.A.; Richard, M.; Petrone, R.V.; Merrin, L.M.; Andrew, R. Assessing the Influence of Climate Controls on Grapevine Biophysical Responses: A Review of Ontario Viticulture in a Changing Climate. Can. J. Plant Sci. 2024, 104, 394–409. [Google Scholar] [CrossRef]
- Garcia-Galan, M. Designations of Origin as Brand for Agro-Food Market: The Case of Spanish Wine Producers. OSF Preprints 2024, cfg5w. [Google Scholar] [CrossRef]
- Wagner, M.; Stanbury, P.; Dietrich, T.; Döring, J.; Ewert, J.; Foerster, C.; Freund, M.; Friedel, M.; Kammann, C.; Koch, M.; et al. Developing a sustainability vision for the global wine industry. Sustainability 2023, 15, 10487. [Google Scholar] [CrossRef]
- Baiano, A. An overview on sustainability in the wine production chain. Beverages 2021, 7, 15. [Google Scholar] [CrossRef]
- Giacomarra, M.; Galati, A.; Crescimanno, M.; Tinervia, S. The integration of quality and safety concerns in the wine industry: The role of third-party voluntary certifications. J. Clean. Prod. 2016, 112, 267–274. [Google Scholar] [CrossRef]
- Pennerstorfer, D.; Weiss, C.R. Product quality in the agri-food chain: Do cooperatives offer high-quality wine? Eur. Rev. Agric. Econ. 2013, 40, 143–162. [Google Scholar] [CrossRef]
- Johnson, R.; Bruwer, J. Regional brand image and perceived wine quality: The consumer perspective. Int. J. Wine Bus. Res. 2007, 19, 276–297. [Google Scholar] [CrossRef]
- Ling, B.H.; Lockshin, L. Components of wine prices for Australian wine: How winery reputation, wine quality, region, vintage, and winery size contribute to the price of varietal wines. Australas. Mark. J. (AMJ) 2003, 11, 19–32. [Google Scholar] [CrossRef]
- Brand, J.; Panzeri, V.; Buica, A. Wine quality drivers: A case study on South African Chenin Blanc and Pinotage wines. Foods 2020, 9, 805. [Google Scholar] [CrossRef]
- Gambetta, J.M.; Schmidtke, L.M.; Wang, J.; Cozzolino, D.; Bastian, S.E.; Jeffery, D.W. Relating expert quality ratings of Australian chardonnay wines to volatile composition and production method. Am. J. Enol. Vitic. 2017, 68, 39–48. [Google Scholar] [CrossRef]
- Leolini, L.; Moriondo, M.; Romboli, Y.; Gardiman, M.; Costafreda-Aumedes, S.; de Cortázar-Atauri, I.G.; Bindi, M.; Granchi, L.; Brilli, L. Modelling sugar and acid content in Sangiovese grapes under future climates: An Italian case study. Clim. Res. 2019, 78, 211–224. [Google Scholar] [CrossRef]
- Van Leeuwen, C.; Destrac-Irvine, A.; Dubernet, M.; Duchêne, E.; Gowdy, M.; Marguerit, E.; Pieri, P.; Parker, A.; de Rességuier, L.; Ollat, N. An update on the impact of climate change in viticulture and potential adaptations. Agronomy 2019, 9, 514. [Google Scholar] [CrossRef]
- Rouxinol, M.I.; Martins, M.R.; Barroso, J.M.; Rato, A.E. Wine grapes ripening: A review on climate effect and analytical approach to increase wine quality. Appl. Biosci. 2023, 2, 347–372. [Google Scholar] [CrossRef]
- Zhang, D.; Wei, Z.; Han, Y.; Duan, Y.; Shi, B.; Ma, W. A review on wine flavour profiles altered by bottle aging. Molecules 2023, 28, 6522. [Google Scholar] [CrossRef] [PubMed]
- Van Leeuwen, C. Terroir: The effect of the physical environment on vine growth, grape ripening, and wine sensory attributes. In Managing Wine Quality; Woodhead Publishing: Cambridge, UK, 2022; pp. 341–393. [Google Scholar] [CrossRef]
- Bonada, M.; Sadras, V.; Moran, M.; Fuentes, S. Elevated temperature and water stress accelerate mesocarp cell death and shrivelling, and decouple sensory traits in Shiraz berries. Irrig. Sci. 2013, 31, 1317–1331. [Google Scholar] [CrossRef]
- Straffelini, E.; Carrillo, N.; Schilardi, C.; Aguilera, R.; Orrego, M.J.E.; Tarolli, P. Viticulture in Argentina under extreme weather scenarios: Actual challenges, future perspectives. Geogr. Sustain. 2023, 4, 161–169. [Google Scholar] [CrossRef]
- Faralli, M.; Mallucci, S.; Bignardi, A.; Varner, M.; Bertamini, M. Four decades in the vineyard: The impact of climate change on grapevine phenology and wine quality in northern Italy. OENO One 2024, 58, 8083. [Google Scholar] [CrossRef]
- Terpou, A.; Arvaniti, O.S.; Afratis, N.; Athanasiou, G.; Binard, F.; Zahariadis, T. Sustainable solutions for mitigating spring frost effects on grape and wine quality: Facilitating digital transactions in the viniculture sector. Sustain. Food Technol. 2024, 2, 967–975. [Google Scholar] [CrossRef]
- Rasilla, D.F.; Aransay, R.; Conde-Oria, F. Climate variability links to changes in Rioja wine (Spain). Int. J. Biometeorol. 2025, 69, 383–395. [Google Scholar] [CrossRef]
- Souza Gonzaga, L.; Capone, D.L.; Bastian, S.E.P.; Jeffery, D.W. Defining wine typicity: Sensory characterisation and consumer perspectives. Aust. J. Grape Wine Res. 2021, 27, 246–256. [Google Scholar] [CrossRef]
- Castelló, E. The will for terroir: A communicative approach. J. Rural Stud. 2021, 86, 386–397. [Google Scholar] [CrossRef]
- Unwin, T. Cultures of terroir. In The Routledge Handbook of Wine and Culture; Routledge: Abingdon, UK, 2022; pp. 61–71. [Google Scholar]
- Niu, N. Terroir, Wine Varieties, Brands and Their Translations into Chinese. Int. J. Chin. Engl. Transl. Interpret. 2023, 4, 1–20. [Google Scholar] [CrossRef]
- Aveni, A. Terroir geographical category is an important difference between brazil and european geographic indication. Rev. Process. Estud. Gestão Jurídicos Financ. 2024, 15, e481277. [Google Scholar]
- Moroz, D. What does terroir mean? A science mapping of a multidimensional concept. J. Agric. Econ. 2024, 75, 889–913. [Google Scholar] [CrossRef]
- Bonfante, A.; Brillante, L. Terroir analysis and its complexity: This article is published in cooperation with Terclim 2022 (XIVth International Terroir Congress and 2nd ClimWine Symposium), 3–8 July 2022, Bordeaux, France. OENO One 2022, 56, 375–388. [Google Scholar] [CrossRef]
- Mason, S. Internationalization Strategies in the Wine Sector: A Comparison of Firms in Different Geographic Indications. Master’s Thesis, Ca’ Foscari University of Venice, Venice, Italy, 2023. Available online: https://unitesi.unive.it/retrieve/56ff81ff-24c3-493a-a679-ec3f4d74ddf3/873501-1278684.pdf (accessed on 8 April 2025).
- Lisetskii, F.; Poletaev, A.; Zelenskaya, E. Soil Indicators of Terroir and Their Importance for Adaptive and Sustainable Viticulture. Sustainability 2025, 17, 3166. [Google Scholar] [CrossRef]
- Awujoola, J.O.; Enem, T.A.; Ogwueleka, F.N.; Abioye, O.; Adelegan, R.O. Machine Learning—Enabled Predictive Analytics for Quality Assurance in Industry 4.0 and Smart Manufacturing: A Case Study on Red and White Wine Quality Classification. In Industry 4.0, Smart Manufacturing, and Industrial Engineering; CRC Press: Boca Raton, FL, USA, 2024; pp. 65–97. [Google Scholar]
- Jana, D.K.; Bhunia, P.; Adhikary, S.D.; Mishra, A. Analyzing of salient features and classification of wine type based on quality through various neural network and support vector machine classifiers. Results Control Optim. 2023, 11, 100219. [Google Scholar] [CrossRef]
- Bhardwaj, P.; Tiwari, P.; Olejar, K., Jr.; Parr, W.; Kulasiri, D. A machine learning application in wine quality prediction. Mach. Learn. Appl. 2022, 8, 100261. [Google Scholar] [CrossRef]
- Tiwari, P.; Bhardwaj, P.; Somin, S.; Parr, W.V.; Harrison, R.; Kulasiri, D. Understanding quality of Pinot noir wine: Can modelling and machine learning pave the way? Foods 2022, 11, 3072. [Google Scholar] [CrossRef]
- Jain, K.; Kaushik, K.; Gupta, S.K.; Mahajan, S.; Kadry, S. Machine learning-based predictive modelling for the enhancement of wine quality. Sci. Rep. 2023, 13, 17042. [Google Scholar] [CrossRef]
- Cardoso Schwindt, V.; Coletto, M.M.; Díaz, M.F.; Ponzoni, I. Could QSOR modelling and machine learning techniques be useful to predict wine aroma? Food Bioprocess Technol. 2023, 16, 24–42. [Google Scholar] [CrossRef]
- Sterman, D.J. Business Dynamics: System Thinking and Modeling for a Complex World; Irwin McGraw-Hill: Boston, MA, USA, 2000. [Google Scholar]
- van der Lee, J.; Kangogo, D.; Gülzari, Ş.Ö.; Dentoni, D.; Oosting, S.; Bijman, J.; Klerkx, L. Theoretical positions and approaches to resilience assessment in farming systems. A review. Agron. Sustain. Dev. 2022, 42, 27. [Google Scholar] [CrossRef]
- Chopin, P.; Mubaya, C.P.; Descheemaeker, K.; Öborn, I.; Bergkvist, G. Avenues for improving farming sustainability assessment with upgraded tools, sustainability framing and indicators. A review. Agron. Sustain. Dev. 2021, 41, 19. [Google Scholar] [CrossRef]
- Žibert, M.; Prevolšek, B.; Pažek, K.; Rozman, Č.; Škraba, A. Developing a Diversification Strategy of Non-Agricultural Activities on Farms Using System Dynamics Modelling: A Case Study of Slovenia. Kybernetes 2022, 51, 33–56. [Google Scholar] [CrossRef]
- Rozman, Č.; Pažek, K.; Kljajić, M.; Bavec, M.; Turk, J.; Bavec, F.; Škraba, A. The Dynamic Simulation of Organic Farming Development Scenarios–A Case Study in Slovenia. Comput. Electron. Agric. 2013, 96, 163–172. [Google Scholar] [CrossRef]
- Borlinič Gačnik, M.; Škraba, A.; Rozman, Č.; Prevolšek, B. The Impact of Climate Change on the Quality of Wine Production—Development of a System Dynamics Model. In Proceedings of the XVII. International Conference on Logistics in Agriculture 2023: Conference Proceedings, Novo Mesto, Slovenia, 9 November 2023; Lisec, A., Ed.; University of Maribor, University Press: Maribor, Slovenia, 2023; pp. 63–70. [Google Scholar] [CrossRef]
- Borlinič Gačnik, M.; Rozman, Č.; Škraba, A. Decision Support Systems in the Agricultural and Tourism Industries; Verlag Dr. Kovač: Hamburg, Germany, 2025. [Google Scholar]
- Liakos, K.G.; Busato, P.; Moshou, D.; Pearson, S.; Bochtis, D. Machine learning in agriculture: A review. Sensors 2018, 18, 2674. [Google Scholar] [CrossRef] [PubMed]
- Barriguinha, A.; de Castro Neto, M.; Gil, A. Vineyard yield estimation, prediction, and forecasting: A systematic literature review. Agronomy 2021, 11, 1789. [Google Scholar] [CrossRef]
- Sarri, D.; Lombardo, S.; Pagliai, A.; Perna, C.; Lisci, R.; De Pascale, V.; Rimediotti, M.; Cencini, G.; Vieri, M. Smart farming introduction in wine farms: A systematic review and a new proposal. Sustainability 2020, 12, 7191. [Google Scholar] [CrossRef]
- Jones, G.V.; Goodrich, G.B. Influence of Climate Variability on Wine Regions in the Western USA and on Wine Quality in the Napa Valley. Clim. Res. 2008, 35, 241–254. [Google Scholar] [CrossRef]
- Available online: https://www.winetourism.com/wine-country/slovenia/ (accessed on 15 June 2024).
- Pearl, J. The Seven Tools of Causal Inference, with Reflections on Machine Learning. Commun. ACM 2019, 62, 54–60. [Google Scholar] [CrossRef]


| Variable | N | Range | Minimum | Maximum | Mean | Std. Deviation | Variance |
|---|---|---|---|---|---|---|---|
| avg. T [°C] January | 93 | 14.6 | −5.2 | 9.4 | 2.437 | 2.6803 | 7.184 |
| avg. T [°C] February | 93 | 12.8 | −3.0 | 9.8 | 3.973 | 2.9404 | 8.646 |
| avg. T [°C] March | 93 | 7.5 | 3.3 | 10.8 | 7.804 | 1.984 | 3.936 |
| avg. T [°C] April | 93 | 6.8 | 8.5 | 15.3 | 12.29 | 1.424 | 2.028 |
| avg. T [°C] May | 93 | 6.5 | 12.8 | 19.3 | 15.937 | 1.5123 | 2.287 |
| avg. T [°C] June | 93 | 5.2 | 19.1 | 24.3 | 21.108 | 1.3636 | 1.859 |
| avg. T [°C] July | 93 | 5.9 | 20.0 | 25.9 | 22.856 | 1.3781 | 1.899 |
| avg. T [°C] August | 93 | 6.0 | 18.7 | 24.7 | 22.172 | 1.4957 | 2.237 |
| avg. T [°C] September | 93 | 6.8 | 13.9 | 20.7 | 17.282 | 1.5681 | 2.457 |
| avg. T [°C] October | 93 | 6.7 | 9.2 | 15.9 | 12.303 | 1.7097 | 2.923 |
| avg. T [°C] November | 93 | 10.4 | 2.6 | 13.0 | 8.092 | 2.1157 | 4.476 |
| avg. T [°C] December | 93 | 8.9 | −0.1 | 8.8 | 3.389 | 1.9382 | 3.933 |
| Avg. Score | 93 | 1.464819611 | 16.09227053 | 17.55709014 | 17.05754438 | 0.3269151454 | 0.107 |
| Variable | N | Minimum | Maximum | Mean | Std. Deviation |
|---|---|---|---|---|---|
| precipitation [mm] January | 93 | 8.7 | 214.5 | 69.744 | 41.0083 |
| precipitation [mm] February | 93 | 2.6 | 322.9 | 66.485 | 59.6276 |
| precipitation [mm] March | 93 | 8.1 | 311.7 | 95.719 | 75.6143 |
| precipitation [mm] April | 93 | 0.8 | 305.6 | 59.376 | 59.924 |
| precipitation [mm] May | 93 | 8.7 | 214.5 | 70.117 | 40.6936 |
| precipitation [mm] June | 93 | 25.4 | 265.9 | 119.65 | 53.1897 |
| precipitation [mm] July | 93 | 3.4 | 199.5 | 90.333 | 52.08 |
| precipitation [mm] August | 93 | 5.2 | 264.7 | 92.744 | 56.7478 |
| precipitation [mm] September | 93 | 2.0 | 230.3 | 89.205 | 65.4562 |
| precipitation [mm] October | 93 | 27.9 | 300.9 | 137.978 | 73.9767 |
| precipitation [mm] November | 93 | 19.4 | 360.4 | 115.977 | 68.8845 |
| precipitation [mm] December | 93 | 0.0 | 452.4 | 136.898 | 103.4163 |
| Number–Categorical Variable | Wine-Growing District | Wine-Growing Region | Weather Station |
|---|---|---|---|
| 1. | Štajerska Slovenija | Podravje | Maribor |
| 2. | Prekmurje | Podravje | Murska Sobota |
| 3. | Bizeljsko-Sremič | Posavje | Cerklje |
| 4. | Dolenjska | Posavje | Novo mesto |
| 5. | Bela krajina | Posavje | Novo mesto |
| 6. | Vipavska dolina | Primorska | Bilje |
| 7. | Goriška brda | Primorska | Bilje |
| 8. | Kras | Primorska | Bilje |
| 9. | Slovenska Istra | Primorska | Portorož |
| Variable Type | Name in Models | Description |
|---|---|---|
| Dependent variable | pov. ocena | Average annual wine rating for each region |
| Independent variables | temp_1–12, pad_1–12 | Monthly temperatures and precipitation (January–December) |
| temp_sez, pad_sez | Seasonal temperatures and precipitation (spring, summer, autumn, winter) | |
| Categorical variable | regija (1–9) | Wine-growing area |
| Time variable | leto | Year of wine production |
| Variable | KS a Statistic | KS a df | KS a Sig. | SW Statistic | SW df | SW Sig. |
|---|---|---|---|---|---|---|
| precipitation [mm] January | 0.153 | 93 | <0.001 | 0.881 | 93 | <0.001 |
| precipitation [mm] February | 0.164 | 93 | <0.001 | 0.74 | 93 | <0.001 |
| precipitation [mm] March | 0.155 | 93 | <0.001 | 0.889 | 93 | <0.001 |
| precipitation [mm] April | 0.205 | 93 | <0.001 | 0.758 | 93 | <0.001 |
| precipitation [mm] May | 0.156 | 93 | <0.001 | 0.878 | 93 | <0.001 |
| precipitation [mm] June | 0.12 | 93 | 0.002 | 0.957 | 93 | 0.004 |
| precipitation [mm] July | 0.11 | 93 | 0.008 | 0.963 | 93 | 0.010 |
| precipitation [mm] August | 0.142 | 93 | <0.001 | 0.932 | 93 | <0.001 |
| precipitation [mm] September | 0.157 | 93 | <0.001 | 0.924 | 93 | <0.001 |
| precipitation [mm] October | 0.148 | 93 | <0.001 | 0.899 | 93 | <0.001 |
| precipitation [mm] November | 0.14 | 93 | <0.001 | 0.877 | 93 | <0.001 |
| precipitation [mm] December | 0.155 | 93 | <0.001 | 0.877 | 93 | <0.001 |
| Variable | KS a Statistic | KS a df | KS a Sig. | SW Statistic | SW df | SW Sig. |
|---|---|---|---|---|---|---|
| avg. T [°C] January | 0.109 | 93 | 0.008 | 0.958 | 93 | 0.004 |
| avg. T [°C] February | 0.14 | 93 | <0.001 | 0.948 | 93 | 0.001 |
| avg. T [°C] March | 0.11 | 93 | 0.007 | 0.937 | 93 | <0.001 |
| avg. T [°C] April | 0.104 | 93 | 0.015 | 0.956 | 93 | 0.003 |
| avg. T [°C] May | 0.085 | 93 | 0.091 | 0.983 | 93 | 0.280 |
| avg. T [°C] June | 0.107 | 93 | 0.011 | 0.947 | 93 | <0.001 |
| avg. T [°C] July | 0.076 | 93 | 0.200 * | 0.981 | 93 | 0.196 |
| avg. T [°C] August | 0.104 | 93 | 0.015 | 0.962 | 93 | 0.009 |
| avg. T [°C] September | 0.115 | 93 | 0.004 | 0.969 | 93 | 0.026 |
| avg. T [°C] October | 0.06 | 93 | 0.200 * | 0.974 | 93 | 0.060 |
| avg. T [°C] November | 0.045 | 93 | 0.200 * | 0.992 | 93 | 0.824 |
| avg. T [°C] December | 0.106 | 93 | 0.012 | 0.976 | 93 | 0.086 |
| avg. Score | 0.154 | 93 | <0.001 | 0.868 | 93 | <0.001 |
| Effect | Test | Value | F | Hypothesis df | Error df | Sig. | Partial Eta Squared |
|---|---|---|---|---|---|---|---|
| Intercept | Pillai’s Trace | 1.000 | 58,056.833 b | 12.000 | 71.000 | <0.001 | 1.000 |
| Intercept | Wilks’ Lambda | 0.000 | 58,056.833 b | 12.000 | 71.000 | <0.001 | 1.000 |
| Intercept | Hotelling’s Trace | 9812.422 | 58,056.833 b | 12.000 | 71.000 | <0.001 | 1.000 |
| Intercept | Roy’s Largest Root | 9812.422 | 58,056.833 b | 12.000 | 71.000 | <0.001 | 1.000 |
| Year | Pillai’s Trace | 7.972 | 26.208 | 120.000 | 800.000 | <0.001 | 0.797 |
| Year | Wilks’ Lambda | 0.000 | 118.032 | 120.000 | 565.767 | <0.001 | 0.920 |
| Year | Hotelling’s Trace | 251.369 | 144.956 | 120.000 | 692.000 | <0.001 | 0.962 |
| Year | Roy’s Largest Root | 91.882 | 612.549 c | 12.000 | 80.000 | <0.001 | 0.989 |
| Source | Dependent Variable | Type III Sum of Squares | df | Mean Square | F | Sig. | Partial Eta Squared |
|---|---|---|---|---|---|---|---|
| Corrected Model | avg. T [°C] January | 396.033 a | 10 | 39.603 | 12.259 | <0.001 | 0.599 |
| Corrected Model | avg. T [°C] February | 565.252 b | 10 | 56.525 | 20.137 | <0.001 | 0.711 |
| Corrected Model | avg. T [°C] March | 253.036 c | 10 | 25.304 | 19.018 | <0.001 | 0.699 |
| Corrected Model | avg. T [°C] April | 153.828 d | 10 | 15.383 | 38.535 | <0.001 | 0.825 |
| Corrected Model | avg. T [°C] May | 160.876 e | 10 | 16.088 | 26.639 | <0.001 | 0.765 |
| Corrected Model | avg. T [°C] June | 125.114 f | 10 | 12.511 | 22.367 | <0.001 | 0.731 |
| Corrected Model | avg. T [°C] July | 88.716 g | 10 | 8.872 | 8.485 | <0.001 | 0.508 |
| Corrected Model | avg. T [°C] August | 98.504 h | 10 | 9.85 | 7.527 | <0.001 | 0.479 |
| Corrected Model | avg. T [°C] September | 78.214 i | 10 | 7.821 | 4.339 | <0.001 | 0.346 |
| Corrected Model | avg. T [°C] October | 131.229 j | 10 | 13.123 | 7.815 | <0.001 | 0.488 |
| Corrected Model | avg. T [°C] November | 160.845 k | 10 | 16.084 | 5.256 | <0.001 | 0.391 |
| Corrected Model | avg. T [°C] December | 118.156 l | 10 | 11.816 | 3.976 | <0.001 | 0.327 |
| Intercept | avg. T [°C] January | 1224.664 | 1 | 1224.664 | 378.661 | <0.001 | 0.643 |
| Intercept | avg. T [°C] February | 1224.464 | 1 | 1224.464 | 378.654 | <0.001 | 0.842 |
| Intercept | avg. T [°C] March | 5004.539 | 1 | 5004.539 | 3761.365 | <0.001 | 0.979 |
| Intercept | avg. T [°C] April | 12,750.539 | 1 | 12,750.539 | 8367.54 | <0.001 | 0.997 |
| Intercept | avg. T [°C] May | 2132.681 | 1 | 2132.681 | 856.5 | <0.001 | 0.998 |
| Intercept | avg. T [°C] June | 4125.384 | 1 | 4125.384 | 935.684 | <0.001 | 0.999 |
| Intercept | avg. T [°C] July | 4325.881 | 1 | 4325.881 | 1136.423 | <0.001 | 0.998 |
| Intercept | avg. T [°C] August | 41,127.188 | 1 | 41,127.188 | 31,428.609 | <0.001 | 0.997 |
| Intercept | avg. T [°C] September | 25,320.764 | 1 | 25,320.764 | 1404.753 | <0.001 | 0.994 |
| Intercept | avg. T [°C] October | 12,144.59 | 1 | 12,144.59 | 7392.857 | <0.001 | 0.989 |
| Intercept | avg. T [°C] November | 5189.539 | 1 | 5189.539 | 1695.892 | <0.001 | 0.954 |
| Intercept | avg. T [°C] December | 962.627 | 1 | 962.627 | 323.913 | <0.001 | 0.798 |
| Year | avg. T [°C] January | 396.033 | 10 | 39.603 | 12.259 | <0.001 | 0.599 |
| Year | avg. T [°C] February | 565.252 | 10 | 56.525 | 20.137 | <0.001 | 0.711 |
| Year | avg. T [°C] March | 253.036 | 10 | 25.304 | 19.018 | <0.001 | 0.699 |
| Year | avg. T [°C] April | 153.828 | 10 | 15.383 | 38.535 | <0.001 | 0.825 |
| Year | avg. T [°C] May | 160.876 | 10 | 16.088 | 26.639 | <0.001 | 0.765 |
| Year | avg. T [°C] June | 125.114 | 10 | 12.511 | 22.367 | <0.001 | 0.731 |
| Year | avg. T [°C] July | 88.716 | 10 | 8.872 | 8.485 | <0.001 | 0.508 |
| Year | avg. T [°C] August | 98.504 | 10 | 9.85 | 7.527 | <0.001 | 0.479 |
| Year | avg. T [°C] September | 78.214 | 10 | 7.821 | 4.339 | <0.001 | 0.346 |
| Year | avg. T [°C] October | 131.229 | 10 | 13.123 | 7.815 | <0.001 | 0.488 |
| Year | avg. T [°C] November | 160.845 | 10 | 16.084 | 5.256 | <0.001 | 0.391 |
| Year | avg. T [°C] December | 118.156 | 10 | 11.816 | 3.976 | <0.001 | 0.327 |
| Error | avg. T [°C] January | 264.902 | 82 | 3.232 | |||
| Error | avg. T [°C] February | 230.171 | 82 | 2.807 | |||
| Error | avg. T [°C] March | 109.102 | 82 | 1.331 | |||
| Error | avg. T [°C] April | 32.733 | 82 | 0.399 | |||
| Error | avg. T [°C] May | 49.52 | 82 | 0.604 | |||
| Error | avg. T [°C] June | 45.951 | 82 | 0.56 | |||
| Error | avg. T [°C] July | 86.013 | 82 | 1.049 | |||
| Error | avg. T [°C] August | 107.304 | 82 | 1.309 | |||
| Error | avg. T [°C] September | 147.824 | 82 | 1.803 | |||
| Error | avg. T [°C] October | 137.7 | 82 | 1.679 | |||
| Error | avg. T [°C] November | 250.96 | 82 | 3.06 | |||
| Error | avg. T [°C] December | 243.693 | 82 | 2.972 | |||
| Total | avg. T [°C] January | 1213.06 | 93 | ||||
| Total | avg. T [°C] February | 2263.49 | 93 | ||||
| Total | avg. T [°C] March | 6026.5 | 93 | ||||
| Total | avg. T [°C] April | 14,234.0 | 93 | ||||
| Total | avg. T [°C] May | 23,289.97 | 93 | ||||
| Total | avg. T [°C] June | 41,605.14 | 93 | ||||
| Total | avg. T [°C] July | 48,757.26 | 93 | ||||
| Total | avg. T [°C] August | 45,924.56 | 93 | ||||
| Total | avg. T [°C] September | 28,001.22 | 93 | ||||
| Total | avg. T [°C] October | 14,346.28 | 93 | ||||
| Total | avg. T [°C] November | 6502.2 | 93 | ||||
| Total | avg. T [°C] December | 1430.14 | 93 | ||||
| Corrected Total | avg. T [°C] January | 660.936 | 92 | ||||
| Corrected Total | avg. T [°C] February | 795.423 | 92 | ||||
| Corrected Total | avg. T [°C] March | 362.138 | 92 | ||||
| Corrected Total | avg. T [°C] April | 186.561 | 92 | ||||
| Corrected Total | avg. T [°C] May | 210.396 | 92 | ||||
| Corrected Total | avg. T [°C] June | 171.065 | 92 | ||||
| Corrected Total | avg. T [°C] July | 174.729 | 92 | ||||
| Corrected Total | avg. T [°C] August | 205.807 | 92 | ||||
| Corrected Total | avg. T [°C] September | 226.039 | 92 | ||||
| Corrected Total | avg. T [°C] October | 268.929 | 92 | ||||
| Corrected Total | avg. T [°C] November | 361.805 | 92 | ||||
| Corrected Total | avg. T [°C] December | 361.849 | 92 |
| Region_Code | N | Mean Rank |
| BEL. KRAJ. | 10 | 74.5 |
| BIZ. SREM. | 10 | 24.1 |
| DOL. | 10 | 5.5 |
| GOR BRDA | 10 | 59.6 |
| KRA | 10 | 41.3 |
| PREKM | 11 | 52.09 |
| SLO. ISTRA | 10 | 55.6 |
| ŠT. SLO. | 11 | 68.36 |
| VIP. DOL. | 11 | 40.0 |
| Total | 93 | |
| Test | Kruskal–Wallis H | |
| Value | 52.884 | |
| Degrees of Freedom (df) | 8 | |
| Asymptotic Significance (Asymp. Sig.) | <0.001 | |
| (A) | |||
| Variable | Component 1 | Component 2 | Component 3 |
| avgT_summer | 0.243 | 0.221 | 0.831 |
| avgT_autumn | 0.635 | 0.543 | 0.424 |
| avgT_winter | 0.540 | 0.576 | 0.103 |
| avgT_spring | 0.223 | 0.804 | 0.221 |
| winter_precipitation | 0.856 | −0.001 | 0.053 |
| spring_precipitation | 0.866 | 0.070 | −0.142 |
| summer_precipitation | 0.299 | 0.162 | −0.777 |
| autumn_precipitation | −0.248 | 0.772 | −0.317 |
| (B) | |||
| Component | 1 | 2 | 3 |
| 1 | 0.770 | 0.574 | 0.279 |
| 2 | 0.259 | 0.119 | −0.959 |
| 3 | −0.583 | 0.810 | −0.057 |
| Model | MSE | RMSE | MAE | MAPE | R2 |
|---|---|---|---|---|---|
| Random Forest | 0.023 | 0.153 | 0.119 | 0.007 | 0.779 |
| Decision Tree | 0.032 | 0.178 | 0.133 | 0.008 | 0.701 |
| SVM | 0.029 | 0.171 | 0.134 | 0.008 | 0.725 |
Disclaimer/Publisher’s Note: The statements, opinions and data contained in all publications are solely those of the individual author(s) and contributor(s) and not of MDPI and/or the editor(s). MDPI and/or the editor(s) disclaim responsibility for any injury to people or property resulting from any ideas, methods, instructions or products referred to in the content. |
© 2025 by the authors. Licensee MDPI, Basel, Switzerland. This article is an open access article distributed under the terms and conditions of the Creative Commons Attribution (CC BY) license (https://creativecommons.org/licenses/by/4.0/).
Share and Cite
Gačnik, M.B.; Škraba, A.; Pažek, K.; Rozman, Č. Predicting Wine Quality Under Changing Climate: An Integrated Approach Combining Machine Learning, Statistical Analysis, and Systems Thinking. Beverages 2025, 11, 116. https://doi.org/10.3390/beverages11040116
Gačnik MB, Škraba A, Pažek K, Rozman Č. Predicting Wine Quality Under Changing Climate: An Integrated Approach Combining Machine Learning, Statistical Analysis, and Systems Thinking. Beverages. 2025; 11(4):116. https://doi.org/10.3390/beverages11040116
Chicago/Turabian StyleGačnik, Maja Borlinič, Andrej Škraba, Karmen Pažek, and Črtomir Rozman. 2025. "Predicting Wine Quality Under Changing Climate: An Integrated Approach Combining Machine Learning, Statistical Analysis, and Systems Thinking" Beverages 11, no. 4: 116. https://doi.org/10.3390/beverages11040116
APA StyleGačnik, M. B., Škraba, A., Pažek, K., & Rozman, Č. (2025). Predicting Wine Quality Under Changing Climate: An Integrated Approach Combining Machine Learning, Statistical Analysis, and Systems Thinking. Beverages, 11(4), 116. https://doi.org/10.3390/beverages11040116


