Abstract
This study examines how bourbon label design complexity and local product information influence consumers’ willingness-to-pay (WTP), while considering the moderating effects of objective bourbon knowledge and age. Using artificially intelligent (AI) generated bourbon labels varying in complexity, data were collected from American bourbon consumers (n = 276) through an online survey. The results indicate that consumers’ preference for label simplicity positively influences WTP for bourbons with concise labels, while preference for locality shows positive associations with WTP across all label types. Objective bourbon knowledge negatively moderates the relationship between simplicity preference and WTP for concise labels, as well as between locality preference and WTP for complex labels. Age positively moderates the relationship between locality preference and WTP, particularly for moderately concise labels. These findings provide practical implications for bourbon producers in designing labels that effectively communicate product information while meeting diverse consumer preferences across different market segments. The study contributes to the limited research on bourbon label design and extends the application of General Evaluability Theory in the spirits industry.
1. Introduction
Bourbon whiskey represents a significant economic force in the American spirits industry, with exports exceeding 14 million proof gallons year-to-date in 2024, with expected continued growth prior to the 2025 global tariff concerns. Beyond these impressive numbers, bourbon holds a distinguished place in American cultural identity, regulated by strict production standards that define its authenticity [1]. As a protected category, bourbon must be produced in the United States using specific ingredients and processes, including a minimum 51% corn content and aging in new, charred oak barrels.
Despite bourbon’s economic and cultural significance, consumers often face challenges in evaluating product quality as they mostly rely on extrinsic cues such as labeling, which currently lacks transparency in several key areas, when they have no prior experience with the product. For example, terms like “small batch” and “hand-crafted” remain unregulated, potentially misleading consumers about production scale and authenticity [2]. This information asymmetry is particularly noteworthy given the extensive research on label design influence in related categories such as beer and wine [3], where studies have demonstrated clear relationships between label information, consumer confidence, and willingness-to-pay (WTP).
The evolving demographics of bourbon consumers present additional complexities for producers and marketers. Legal-age Millennials and Gen Z consumers demonstrate distinct preferences for label design and information presentation, favoring concise design elements while simultaneously seeking authentic quality assurance [4]. Research indicates that these younger consumers respond differently to marketing cues than previous generations, particularly in their evaluation of product authenticity and quality signals [5].
This study addresses two critical gaps in the current bourbon marketing literature. First, while extensive research exists on label design in parallel premium beverage categories like wine and beer, limited attention has been paid to understanding how bourbon label design elements, particularly the spectrum from simplicity to complexity, influence consumers’ willingness-to-pay (WTP). Second, despite bourbon’s strong cultural and regional identity, there remains a significant gap in understanding how consumers’ preferences for local products influence their bourbon purchase decisions and subsequent WTP. As such, the following research questions are proposed to guide the study:
RQ1: What is the relationship between preference for simplicity of label design and WTP?
RQ2: What is the relationship between preference for locality statements in label design and WTP?
RQ3: How do consumer age and bourbon knowledge moderate the relationship between preference for simplicity and WTP?
RQ4: How do consumer age and bourbon knowledge moderate the relationship between preference for locality and WTP?
2. Literature Review
2.1. Theoretical Framework: General Evaluability Theory
General Evaluability Theory (GET) [6,7] provides a robust framework for understanding how consumers evaluate product attributes and make purchase decisions. GET posits that consumers struggle to accurately assess value when evaluating product attributes in isolation, potentially leading to preference reversals during comparative evaluations. This theory is particularly relevant to bourbon label design, as consumers’ willingness-to-pay (WTP) can be significantly influenced by how product information is presented and evaluated. GET identifies three critical factors influencing product evaluability and subsequent WTP: (1) Mode: The evaluation context (single vs. comparative assessment); (2) Knowledge: The evaluator’s objective understanding of product attributes; and (3) Nature: Inherent assessment capabilities independent of acquired knowledge.
In the bourbon context, these factors interact uniquely with label design elements. For instance, when consumers evaluate bourbon labels in isolation (single evaluation mode), their ability to assess quality and value may be significantly impaired compared to comparative shopping situations. This effect is particularly pronounced among younger legal-age consumers who may lack category expertise [4]. The theory suggests that providing appropriate reference points through label design could enhance consumers’ ability to make value judgments, ultimately influencing their WTP.
Recent applications of GET in consumer behavior research have demonstrated its utility in understanding purchase decisions and WTP. Drawing from the craft beverage literature, consumers with higher product knowledge demonstrate increased WTP for craft products compared to mass-market alternatives [8]. This aligns with GET’s proposition that objective knowledge enhances evaluability by enabling consumers to more accurately assess product worth and adjust their WTP accordingly [9].
The current study extends GET by examining how bourbon label design elements—specifically locality information and design simplicity—influence consumers’ WTP. These attributes represent evaluable characteristics that can be processed through both inherent psychological systems and acquired knowledge. Additionally, this research introduces age as a previously unexplored moderating variable within the GET framework, acknowledging that generational differences may affect evaluation processes. Recent research indicates that younger consumers (Millennials and Gen Z) exhibit distinct consumption patterns and information processing approaches compared to older generations [4,10].
This theoretical extension is supported by emerging research in craft beverage contexts, which suggests that consumers’ WTP increases when purchasing directly from producers [11] and that variety-seeking behavior influences price sensitivity [12]. The interaction between objective bourbon knowledge and age as moderating variables provides a novel contribution to GET, particularly in understanding how different consumer segments evaluate and value premium spirits.
2.2. Consumer Willingness-to-Pay in Premium Spirits Markets
WTP represents consumers’ maximum monetary value assignment for goods or services, serving as a fundamental indicator of perceived product worth [13]. This is particularly relevant in the bourbon industry, where price points vary significantly based on product attributes and consumer perceptions. Contemporary research has extensively examined WTP in food [14,15] and beverage contexts [16,17,18], with particular emphasis on premium and sustainable products. Li and Kallas’ [19] meta-analysis of 80 studies revealed that WTP is influenced by demographic factors, regional differences, and sustainability attributes, with European and Asian consumers demonstrating higher WTP for sustainable products compared to North Americans.
In premium beverage markets, WTP varies significantly based on consumer characteristics, product attributes, and the market context [19]. More specifically, consumer category knowledge/expertise, demographic profiles, and regional preferences or cultural connections influence purchase decisions. For product attributes, intrinsic qualities (i.e., ingredients, method of production, etc.), extrinsic qualities (i.e., brand reputation, label design, etc.), and certifications or authenticity markers all influence consumer behavior. Relatedly, competitive positioning, distribution channels, and regional availability are all examples of market context aspects that influence behavior. Research indicates that organic certification emerges as a primary driver of consumer confidence and WTP, particularly in premium beverage categories [18]. This finding suggests that verified product attributes on bourbon labels could similarly influence consumer value perceptions and purchase decisions.
2.3. Label Design and Generational Information Processing in Bourbon Markets
The bourbon industry’s significant economic impact, evidenced by substantial job creation and federal tax contributions [20,21], necessitates a deeper understanding of how label design influences consumer purchase behavior and willingness-to-pay across different consumer segments. Current bourbon labeling regulations present unique challenges in consumer information processing, as they combine strict production requirements with loosely regulated marketing terminology [2]. Terms such as “small batch” and “hand-crafted” lack standardized definitions, potentially creating confusion and skepticism among consumers attempting to evaluate product quality through label information alone.
Drawing from parallel premium beverage categories, evidence suggests that American consumers generally demonstrate skepticism toward overly elaborate labels that might raise quality concerns [3]. However, consumer preferences vary based on multiple factors, including flavor preferences and sensory expectations [22]; health considerations and ingredient transparency [23]; environmental attitudes and sustainability claims [24]; and regional identity and local production indicators [2].
Recent research also indicates distinct generational differences in label perception and information processing. Millennials and Gen Z consumers demonstrate clear preferences for concise design elements and transparent production information [4], while simultaneously seeking authentic quality assurance through labeling [5]. This preference for simplicity, however, creates a paradox for bourbon producers, as Luo et al. [25] found that labels with higher complexity might appeal to uninformed consumers seeking quality cues through detailed product information. This finding suggests a complex interaction between consumer knowledge, generational preferences, and label design effectiveness.
The relationship between label design and consumer behavior is further complicated by varying information needs across consumer segments. While younger consumers prioritize authenticity and transparency in product presentation [4], traditional bourbon consumers often rely on geographical indication (GI) and origin-based marketing cues, which have been shown to significantly impact bourbon sales [26]. This dichotomy presents a challenge for producers attempting to balance comprehensive product information with aesthetic simplicity.
This complex interplay between label design elements and consumer preferences creates a foundation for understanding how local product preferences might influence consumer willingness-to-pay, particularly as younger generations enter the bourbon market with distinct expectations for product information and presentation.
2.4. Local Product Preference and Regional Identity in Bourbon Markets
The relationship between local product preference and consumer behavior extends beyond simple geographic proximity, particularly in the bourbon industry, where regional identity and heritage play crucial roles in consumer perception. Research demonstrates that consumers’ willingness to purchase local products is influenced by a complex interplay of psychological, economic, and social factors [27,28]. This multifaceted relationship becomes especially relevant when examining bourbon consumption, where geographical indication (GI) has emerged as a significant contributor to sales growth [26].
Consumer preference for local products manifests through multiple dimensions, including demographic characteristics, health considerations, and economic impact perceptions [29]. In the bourbon context, consumers often exhibit higher confidence in products with local origins, driven by patriotic sentiments and perceived authenticity [30,31]. This trust in local products extends particularly to those made with local ingredients, as consumers believe these products inherently possess a higher degree of authenticity and regional connection.
A critical distinction exists between ethnocentric consumers and those with high regional commitment [32]. While ethnocentric consumers generally prefer domestic products over global alternatives, they maintain flexibility in their purchasing behavior. In contrast, consumers with strong regional commitment demonstrate more consistent loyalty to local products, particularly when those products emphasize local ingredients and production methods. This finding has significant implications for bourbon producers, suggesting that emphasizing local ingredients and regional production methods on labels could influence consumer WTP.
The relationship between local preference and purchasing behavior is moderated by several interconnected factors that influence consumer decision-making. Price sensitivity emerges as a primary moderator, with consumers demonstrating rational evaluation of local products’ value propositions [33] and varying sensitivity levels between urban and rural populations [34]. This evaluation extends beyond simple monetary considerations to include non-monetary factors such as the perceived benefit of supporting local economies. Accessibility and distribution channels also significantly impact purchasing decisions, with urban consumers typically facing greater challenges in accessing local products compared to their rural counterparts, who often maintain stronger connections to local producers [35]. Regional commitment further moderates this relationship, as cultural and historical connections frequently supersede specific product knowledge in driving purchase decisions [36]. This is particularly relevant in the bourbon market, where regional identity plays a crucial role in consumer perception, and local ingredient sourcing can substantially enhance perceived product authenticity. These moderating factors create a complex dynamic that shapes how consumers evaluate and ultimately make purchasing decisions regarding local products.
These findings suggest that bourbon producers must carefully balance local identity emphasis with price positioning and distribution strategies. While consumers generally support local products, their willingness-to-pay premium prices are contingent upon perceived value and authentic regional connections [37]. This relationship becomes particularly relevant when examining how knowledge about bourbon and its production processes influences consumer WTP, as explored in the following section.
2.5. Knowledge’s Role in Consumer Willingness-to-Pay
The relationship between consumer knowledge and willingness-to-pay (WTP) presents a complex dynamic in the premium spirits market, particularly within the bourbon category, where information asymmetry remains a significant challenge. While research has traditionally suggested that higher product knowledge correlates with increased WTP for craft products compared to mass-market alternatives [8], recent studies indicate a more nuanced relationship between knowledge and purchase decisions.
The distinction between subjective and objective knowledge emerges as a critical factor in understanding consumer behavior in the bourbon market. Subjective knowledge (what consumers believe they know) often diverges significantly from objective knowledge (what consumers actually know), creating a complex dynamic that influences purchase decisions [38]. This divergence becomes particularly relevant in the bourbon category, where marketing narratives and actual product knowledge frequently misalign. Recent research by Gumbel [2] highlights this disparity, noting that even bourbon enthusiasts often lack a comprehensive understanding beyond the basic marketing information available on distillery websites.
The assessment of consumer knowledge presents methodological challenges that have implications for understanding WTP. Traditional research has relied heavily on self-report mechanisms, where respondents subjectively assess their expertise [39,40,41]. However, this approach may not accurately reflect consumers’ actual knowledge levels. More objective measures, such as knowledge quizzes testing specific product attributes and production processes [9], provide more reliable indicators of consumer expertise and its relationship to WTP.
The relationship between knowledge and WTP is further complicated by several interconnected factors related to education, information processing, and value perception. Higher education levels consistently correlate with increased product knowledge and willingness to engage with detailed product information [42], while consumers with greater objective knowledge demonstrate more sophisticated information processing capabilities. This sophistication often leads expert consumers to exhibit more critical evaluation of price–value relationships [39]. In terms of label information and decision-making, research indicates that consumers frequently rely on label information for purchase decisions, regardless of their knowledge level [43], though information asymmetry in bourbon markets creates significant challenges for consumer evaluation. The impact of label complexity on the perceived value varies depending on consumer expertise, with expert consumers often displaying greater skepticism toward premium pricing justified by marketing claims. Personal preferences and subjective knowledge frequently override objective product information in purchase decisions, suggesting that the relationship between expertise and WTP is not linear but varies based on specific product attributes and marketing claims.
This complex relationship between knowledge and WTP has particular relevance for the bourbon industry, where traditional marketing narratives emphasize heritage and craftsmanship. The current information asymmetry in bourbon markets [2] creates an opportunity to examine how objective knowledge, rather than merely subjective expertise, influences consumer WTP. This understanding becomes crucial as producers attempt to balance authentic product information with marketing narratives that appeal to varying levels of consumer expertise.
2.6. Research Hypotheses
Based on the literature review, we propose the following hypotheses and the framework shown in Figure 1:
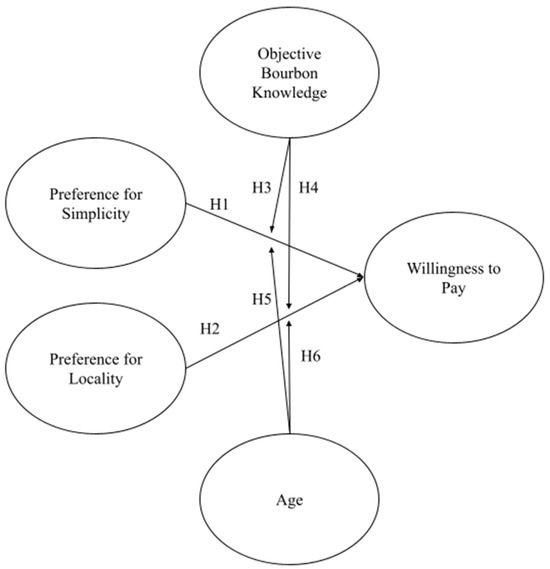
Figure 1.
Hypothesized framework. Note: H1-H6 and corresponding arrows indicate the proposed hypotheses of the study.
H1:
Preference for simplicity is positively related to consumers’ WTP.
H2:
Preference for locality is positively related to consumers’ WTP.
H3:
Bourbon knowledge moderates the relationship between preference for simplicity and willingness-to-pay (WTP), such that the positive effect of simplicity preference on WTP is weaker among individuals with higher levels of objective knowledge about bourbon.
H4:
Bourbon knowledge moderates the relationship between preference for locality and willingness-to-pay (WTP), such that the positive effect of locality preference on WTP is weaker among individuals with higher levels of objective knowledge about bourbon.
H5:
Age moderates the relationship between preference for simplicity and willingness-to-pay (WTP), such that the positive effect of simplicity on WTP is stronger among younger consumers compared to older consumers.
H6:
Age moderates the relationship between preference for locality and willingness-to-pay (WTP), such that the positive effect of locality preference on WTP is stronger among older consumers compared to younger consumers.
3. Methodology
3.1. Survey Instrument
Data are collected from an online survey that was developed utilizing Qualtrics and distributed via Prolific to U.S. citizens aged 21+ who had previously indicated that they drink bourbon. The questionnaire survey consists of four sections. The first section is a bourbon knowledge test comprising 10 multiple-choice questions from the Wine and Spirit Education Trust (WSET) Spirits practice test. Responses were coded as “1” when correct or “0” when incorrect. Next, multiple items were adapted from previous research on consumer preferences for simplicity [3,4,5] and preferences for locality [27,35,36]. All items in the second section utilized a 5-point Likert Scale (1 is “strongly disagree” and 5 is “strongly agree”). Third, participants were exposed to one of four distinct label types:
- Very concise label (name, proof);
- Moderately concise label (name, proof, local ingredients information);
- Moderately complex label (name, proof, pattern, established year, paintings of distillery);
- Very complex label (name, proof, pattern, established year, local ingredients information, paintings of the distillery, notes of flavors).
To ensure that personal preference for a specific brand did not interfere with the responses, this study employed Generative AI to create four different labels (i.e., two concise and two complex). The label generation went through multiple rounds of refinement and review by the authors before the final labels were further reviewed by five additional researchers and spirits professionals. Each of the five professionals holds a Ph.D., has worked in beverage alcohol sales and education, and agreed that the final four labels met the expected criteria of concise or complex, the final label images can be found in Appendix A. The final section of the survey included items assessing WTP, utilizing a five-point scale: “1” for “≤USD 20”, “2” “USD 21 to USD 30”, “3” “USD 31 to USD 40”, “4” “USD 41 to USD 50”, and “5” “≥USD 51” [16]. That is, participants’ WTP was measured for each label: WTPLabel1, WTPLabel2, WTPLable3, and WTPLabel4. As such, if a respondent indicated WTPLabel1 = 1, that suggests that the participant is willing to pay less than USD 20 for bourbon under Label 1. Demographic information, including gender, age, ethnicity, and drinking habits, was also collected. Samples with missing data or questionnaires with a completion lower than 100% were removed. Consequently, this study collected 286 questionnaires, with 276 being valid (96.5%). In the first part of this study, a paired t-test was employed to investigate the difference among WTPs across four different labels, which aims to identify whether a concise design and a complex design would influence consumers’ WTP. Additionally, a mixed-design ANOVA is applied to examine the between-group difference based on participants’ age. In the second part, the structural equation model (SEM) was built, and the path analysis was conducted.
3.2. Descriptive Statistics
The demographic composition of the study sample (N = 276) reveals a diverse range of characteristics across several categories. In terms of gender, the sample is predominantly male, comprising 58% (n = 160) of participants, followed by females at 4.6% (n = 112), and a small representation of non-binary individuals at 1.4% (n = 4). Age distribution indicates an even spread across three categories: 21–34 = 31.5% (n = 87), 35–54 = 57.6% (n = 159), and 55–64 = 1.9% (n = 30). Regarding personal income, the participants are distributed across various income brackets, with the largest group earning between USD 50,000 and USD 79,999 annually (26.1%, n = 72), while those earning USD 100,000 or more represent 25% (n = 69). Most participants hold a Bachelor’s degree (39.1%, n = 108), followed by those with a Master’s degree (19.2%, n = 53). The drinking habits of participants show that 4.2% (n = 111) consume alcohol a few times per month, and 31.2% (n = 86) drink once a month. A full summary of demographic information is presented in Table 1.

Table 1.
Demographic information (N = 276).
4. Results
4.1. Pairwise Comparisons and Mixed Design ANOVA
Given that all labels are generated by AI, it is necessary to conduct a series of contrasts to acknowledge which label is considered more expensive than the others. Table 2 presents the results of pairwise comparisons among participants’ willingness-to-pay (WTP) for bourbon under four different label conditions, using the Tukey HSD method for post-hoc test. Significant differences were observed between WTPLabel1 and each of the other three labels. Specifically, participants’ WTP for bourbon labeled under Label2, Label3, and Label4 was significantly higher than that for Label1, with mean differences of 0.38 (p < 0.001), 0.78 (p < 0.001), and 0.68 (p < 0.001), respectively. Additionally, WTPLabel3 showed a significantly higher WTP than WTPLabel2 (mean difference = 0.41, p < 0.001), and WTPLabel4 was significantly higher than WTPLabel2 (mean difference = 0.30, p < 0.01). No significant difference was found between WTPLabel4 and WTPLabel3 (p > 0.05). With these findings, it is inferred that participants are more willing to pay a higher price for bourbon under labels with complex designs.

Table 2.
Pairwise comparison.
The mixed-design ANOVA examined how WTP for bourbon varied across different label designs and age cohorts. As shown in Figure 2 and detailed in Table 3, no substantial differences were observed across age groups for WTPLabel1, which indicated that the baseline label elicited similar consumer responses across younger, middle-aged, and senior adults. Regarding WTPLabel2, both younger and mid-aged adults reported higher WTP than senior adults (p < 0.05 and p < 0.01, respectively), with mean differences of −0.62 and −0.64. In contrast, complex designs such as WTPLabel3 and WTPLabel4 elicited more uniform responses across age cohorts. The result of mixed design ANOVA suggested that younger and middle-aged consumers are more responsive to specific label innovations compared to senior consumers.
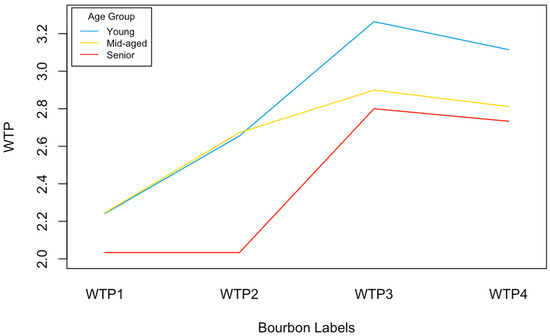
Figure 2.
Interaction plot illustrating the effect of the label design and age factors on the means of WTP. Note. WTP1 = WTPLabel1, WTP2 = WTPLabel2, WTP3 = WTPLabel3, WTP4 = WTPLabel4.

Table 3.
Mixed design ANOVA results and post-hoc comparisons.
4.2. Confirmatory Factor Analysis
The confirmatory factor analysis (CFA) is conducted for construct validation [44]. It is suggested that factor loading for each item should be greater than 0.70 and no less than 0.50 [45]. A series of indices indicate that this model has an average or weak fit (χ2/df = 2.35, CFI = 0.86, TLI = 0.84, p < 0.001, IFI = 0.86, GFI = 0.85, AGFI = 0.82, RMSEA = 0.07) [46]. Although a high value of fitness index (e.g., GFI > 0.90) could successfully discriminate a correctly specified model from others, the index of fitness with a relatively low value may be related to the sample size [45]. To enhance the fitness of the model, three items were removed due to factor loadings less than 0.70, one related to locality and two related to simplicity. This was followed by a second round of CFA. The output (shown in Table 4) indicated that the new model had a better fit than the previous model (χ2/df = 3.26, CFI = 0.94, NFI = 0.92, TLI = 0.93, IFI = 0.94, GFI = 0.91, AGFI = 0.86, RMSEA = 0.07).

Table 4.
CFA (revised model).
4.3. Estimated Result of SEM
The result of the SEM is shown in Table 5. It revealed that consumers’ preference for simplicity is positively related to WTPLabel1 (β = 0.24, p < 0.05) and WTPLabel2 (β = 0.10, p < 0.001). However, neither the relationship between preference for simplicity and WTPLabel3 nor WTPLabel4 is statistically significant. Therefore, H1 is partially supported. Consumers who prefer concise labels indicated an overall lower WTP (i.e., USD 21–USD 30) when they are shown a bourbon under a complex design. Consumers’ preference for locality is found to be positively associated with WTPLabel1 (β = 0.18, p < 0.01), WTPLabel2 (β = 0.17, p < 0.05), WTPLabel3 (β = 0.24, p < 0.05), and WTPLabel4 (β = 0.17, p < 0.05). That is, H2 is completely supported. It is indicated that consumers favoring local products would possess higher WTP when the bourbon label mentioned information about the locality, such as “locally grown barley is used for ingredients”. The last column of Table 5 presents values of the variance inflation factor (VIF). Since both values are less than 5, the likelihood of collinearity is very minor [47].

Table 5.
Estimated result of SEM.
After accounting for control variables, it is found that personal income level is positively related to WTPLabel1 (β = 0.15, p < 0.05), WTPLabel2 (β = 0.20, p < 0.01), and WTPLabel4 (β = 0.18, p < 0.01), which roughly concluded that higher income level contributes to higher WTP for bourbon. Age was negatively associated with WTPLabel2 (β = −0.19, p < 0.01), WTPLabel3 (β = −0.14, p < 0.05), and WTPLabel4 (β = −0.15, p < 0.05), which indicated that younger consumers tend to report higher WTP for bourbon, especially when they were shown the bourbon labels in complex designs. Drinking habits also showed a significant positive relationship with WTP for WTPLabel2 (β = 0.14, p < 0.05) and WTPLabel4 (β = 0.13, p < 0.05), suggesting that individuals who drink more frequently are willing to pay more for bourbon with certain label types. In contrast, gender did not significantly predict WTP in any of the models, implying that differences in willingness-to-pay between male and female consumers were not substantial based on the sample of this study.
4.4. Moderation Analysis
Table 6 and Table 7 present the main effects of preference for locality and simplicity on consumer WTP when objective bourbon knowledge and age were added as two moderators. Participants were categorized into higher and lower knowledge groups based on their scores relative to the sample mean. Individuals scoring more than one standard deviation above the mean were classified as having higher knowledge, whereas individuals scoring more than one standard deviation below the mean were classified as having lower knowledge. Those within one standard deviation of the mean were categorized as having moderate knowledge. The interaction plots are shown in Figure 3, Figure 4, Figure 5 and Figure 6. The objective knowledge of bourbon moderated three types of relationships. The effect sizes and the value of ΔR2 are estimated to assess the effectiveness of the interaction term involved [48].

Table 6.
Moderation analysis of preference for simplicity.

Table 7.
Moderation analysis of preference for locality.
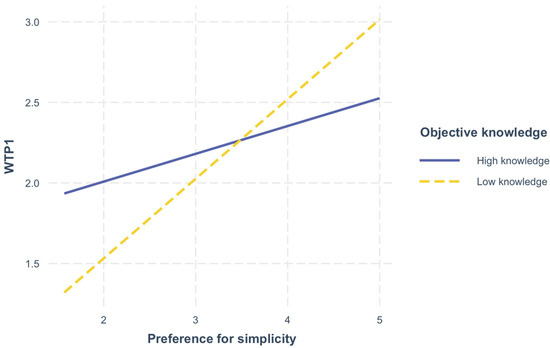
Figure 3.
Interaction Plot–Preference for simplicity × WTP1. Note. WTP1 = WTPLabel1.
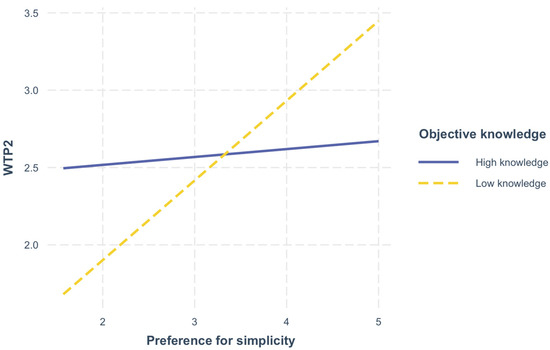
Figure 4.
Interaction Plot–Preference for simplicity × WTP2. Note. WTP2 = WTPLabel2.
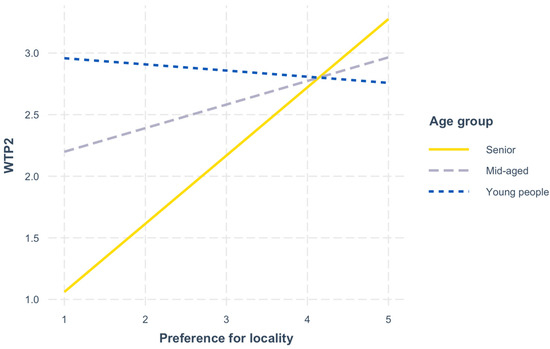
Figure 5.
Interaction Plot–Preference for locality × WTP2. Note. WTP2 = WTPLabel2.
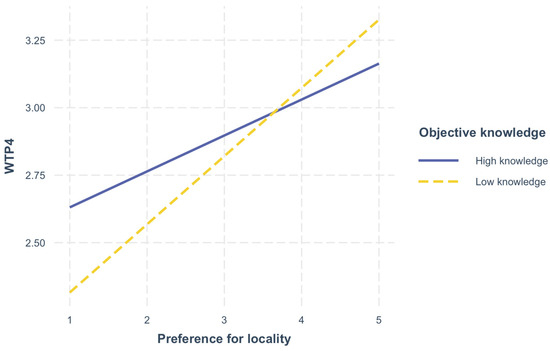
Figure 6.
Interaction Plot–Preference for locality × WTP4. Note. WTP4 = WTPLabel4.
First, when objective bourbon knowledge is accounted for, the preference for simplicity has a significantly negative influence on WTPLabel1 (effect = −0.60, p < 0.01), contributing an additional 5% to the total explained variance (ΔR2 = 0.05). Figure 3 below shows a graphical depiction of the results. Likewise, with the inclusion of objective bourbon knowledge (shown in Figure 4), the preference for simplicity also shows a significantly negative influence on WTPLabel2 (effect = −0.64, ΔR2 = 0.04, p < 0.05), accounting for a 4% increase in explained variance. These results revealed that a novice consumer usually has a higher WTP than a knowledgeable consumer for bourbon under a very concise label. Accordingly, objective knowledge of bourbon negatively moderated the relationship between consumers’ preference for simplicity and their WTP for bourbon under a moderately concise label. Figure 3 and Figure 4 both visualize how objective knowledge moderates the relationship between preference for simplicity and WTP, which illustrates that when a consumer, if they prefer a simple design, is estimated to purchase bourbon with a concise or moderately concise label, those knowledgeable consumers are likely to pay less.
Third, the empirical analysis also demonstrated that age only positively moderated the relationship between preference for locality and WTPLabel2 (effect = 0.12, ΔR2 = 0.03, p < 0.01), which implies that when an older consumer sees a bourbon under a moderately concise label that mentions the local ingredients that are used for distilling, they have a slightly higher WTP than younger consumers. Figure 5 visualizes the interaction effect, which illustrates that senior consumers who prefer the local bourbon are more likely to pay higher than mid-aged consumers when showing a moderately concise label. Interestingly, young people, if they have a preference for local products, might even pay much less than either middle-aged or senior consumers, which is visualized as a negative relationship. Thus, H4 is partially supported.
Additionally, when objective bourbon knowledge is accounted for, the preference for locality has a significantly negative influence on WTPLabel4 (effect = −0.35, ΔR2 = 0.03, p < 0.05). The increase in ΔR2, which is 0.03, indicated that the involvement of objective knowledge explains an additional 3% of the variance in the WTPLabel4. Hence, it is concluded that bourbon knowledge negatively moderated the relationship between consumers’ preference for locality and their WTP for a bourbon under a highly complex label. Objective knowledge is believed to prevent bourbon consumers from paying a high price for bourbon with a highly complex label. As shown in the interaction plot (Figure 6), although consumers favor purchasing local bourbon, those who are knowledgeable about bourbon are likely to pay less than novices. Therefore, H3 is partially supported.
Based on the estimates of the SEM, Figure 7 shows the result of the model analysis.
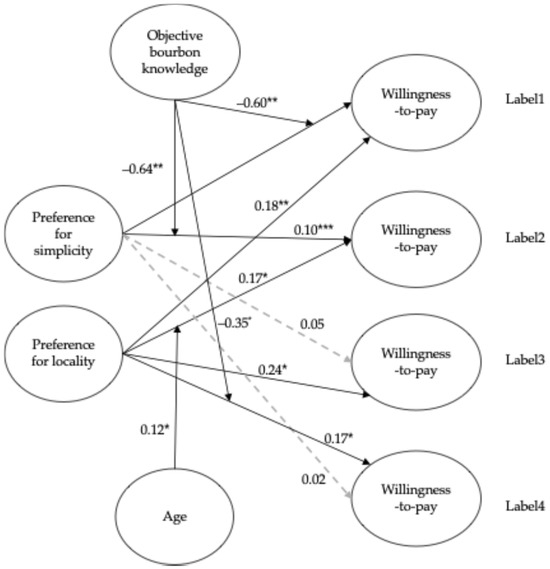
Figure 7.
Estimated Model. Note: Arrows depict tested hypotheses with beta weights. The coefficient is presented. * p < 0.05. ** p < 0.01. *** p < 0.001.
5. Discussion
The empirical analysis reveals complex relationships between label design elements, consumer preferences, and willingness-to-pay (WTP) in the bourbon market. While preferences for locality and simplicity emerge as crucial factors influencing WTP, their effects vary across consumer segments and label complexity levels. Specifically, consumers demonstrate higher WTP when presented with highly and moderately concise bourbon labels, aligning with previous research on label design preferences [3,4]. The influence of locality information on labels consistently enhances consumers’ WTP [43], though this effect moderates when labels are highly complex. This finding supports General Evaluability Theory (GET), suggesting that strong visceral connections to local culture and tradition can lead consumers to overestimate product value [7].
Age and objective bourbon knowledge emerge as significant moderating variables in the relationship between label design and WTP. Older consumers demonstrate higher WTP for bourbon featuring local ingredients and moderately concise labels compared to younger consumers, suggesting a stronger valuation of tradition and regional identity. However, this age-related effect diminishes with highly complex labels, indicating potential information overload effects. The moderating role of bourbon knowledge presents an interesting dynamic: while it strengthens consumers’ ability to evaluate product attributes, it paradoxically weakens the positive relationship between locality preference and WTP. This finding suggests that knowledgeable consumers employ more critical evaluation processes, particularly when assessing price–value relationships.
The study reveals two key mechanisms influencing WTP. First, when presented with concise labels providing only basic information, consumers rely on reference values and related attributes to infer product worth [49]. Second, knowledgeable consumers demonstrate greater price sensitivity and require substantial information to justify higher WTP [9]. This finding aligns with existing evidence that while consumers generally support local products, they resist paying premium prices without clear value justification [37].
5.1. Theoretical Contributions
This research makes several significant contributions to both theory and the literature in premium spirits marketing. First, it extends General Evaluability Theory (GET) by demonstrating how evaluability varies across generational cohorts, particularly in how different age cohorts process and value local product information. While GET has traditionally focused on mode, knowledge, and nature as key evaluability factors [7], our findings suggest that age cohort serves as a previously unexamined moderator of these relationships. This extension is particularly relevant as it demonstrates how the ‘nature’ component of GET may be more demographically dependent than previously theorized.
Second, the study provides novel insights into the interaction between objective knowledge and evaluability in premium spirits markets. While previous research has examined knowledge effects in parallel categories like craft beer [11] and wine [50], our findings reveal that bourbon knowledge serves as a distinct moderator that can decrease WTP when consumers possess higher levels of objective product knowledge. These findings challenge traditional assumptions about expertise and value perception, suggesting that knowledgeable consumers may be more critical in their evaluation of marketing claims, particularly those related to locality and authenticity.
Third, this research contributes to the understanding of how locality information is processed across different consumer segments. By examining the interaction between regional commitment and label complexity, we extend GET’s application to geographic indication (GI) and local product preferences. This builds upon previous work in craft beverages [51] while providing new insights specific to the bourbon category. The finding that locality information’s impact on WTP varies based on label complexity and consumer knowledge levels adds nuance to existing theories about local product preference.
Fourth, the study advances methodological approaches to measuring consumer knowledge in premium spirits markets. By employing objective knowledge assessments rather than relying on self-reported expertise, we provide a more robust framework for understanding how actual product knowledge, rather than perceived expertise, influences evaluation processes. This methodological contribution addresses limitations noted in previous research that relied primarily on subjective knowledge measures.
Finally, the findings contribute to the broader understanding of how different consumer segments process and value product information in premium spirits markets. The identification of age-based differences in information processing and value assessment extends beyond simple demographic segmentation, providing insights into how age cohorts interact with both traditional and modern marketing cues. This has specific relevance for premium spirits producers attempting to bridge generational gaps in their marketing approaches.
5.2. Practical Implications
This research yields several significant implications for bourbon producers and marketers seeking to optimize their label design, pricing, and market segmentation strategies. First, when targeting younger consumers, distillers should move away from elaborate storytelling strategies and historical narratives on labels. Instead, our findings suggest that concise labels featuring straightforward information and emphasizing simplicity would more effectively appeal to this demographic. While younger consumers demonstrate interest in local products, which may drive bourbon consumption, distillers must carefully consider their pricing strategy, as these consumers, particularly those knowledgeable about bourbon, demonstrate a limited willingness-to-pay for local products.
For producers targeting older consumers, our research indicates that this demographic holds a more respectful attitude toward tradition and local culture, showing increased willingness-to-pay for products featuring locally sourced ingredients. However, the study reveals an important caveat: complex patterns and unrelated design elements should be used judiciously, as the positive relationship between preference for locality and willingness-to-pay weakens significantly when presented with highly complex labels. This finding suggests that while local ingredients and cultural connections resonate with older consumers, the information must be presented in a clear, accessible manner.
The study also provides crucial insights for pricing strategy development. Our findings indicate that producers should adjust their pricing approaches based on both consumer knowledge levels and age demographics. Given that knowledgeable consumers exhibited lower WTP for bourbon presented with concise labels, distillers should consider tailoring their labeling strategies to different market segments. For more informed consumers, labels could incorporate richer product information, such as detailed tasting notes, production methods, or provenance narratives, to reinforce the perceived value. Alternatively, distillers targeting less knowledgeable consumers may continue to emphasize minimalist label designs that prioritize aesthetic appeal over informational depth. Segmenting labeling strategies based on consumer knowledge levels can help maximize appeal and justify premium pricing across diverse buyer groups.
Additionally, the positive moderating effect of age on willingness-to-pay for products with local attributes indicates opportunities for premium pricing strategies when marketing to older consumers, provided the local connections are clearly and authentically communicated.
From a methodological perspective, this study makes a notable contribution by employing an objective knowledge quiz to assess participants’ bourbon expertise, rather than relying on potentially biased self-reported measures. This approach provides a more authentic measurement of consumer knowledge and its relationship to willingness-to-pay, offering producers more reliable insights for market segmentation and pricing strategies. These findings collectively suggest that bourbon producers should consider adopting a differentiated approach to label design and pricing based on their target demographic, while maintaining a careful balance between information complexity and clarity across all consumer segments.
6. Limitations and Future Research
While this study provides valuable insights into bourbon label design and consumer willingness-to-pay, several methodological and conceptual limitations suggest important directions for future research. First, the use of AI-generated labels rather than actual market examples may limit ecological validity, particularly given the complex historical and cultural significance of bourbon labeling [2]. Future studies should incorporate real bourbon labels from the market to enhance practical applicability and better reflect the nuanced design elements that have evolved within the industry.
Second, the single evaluation methodology employed in this study, while providing clear initial insights, may not fully capture how consumers evaluate bourbon labels in realistic purchase situations where multiple options are available simultaneously. Future research should consider implementing both comparative (joint evaluation) and individual assessment approaches to analyze potential differences in willingness-to-pay (WTP) between these evaluation methods, as suggested by General Evaluability Theory [7].
Third, while this study considered multiple label attributes, including proof, pattern, established year, local ingredients information, distillery imagery, and flavor notes in creating concise and complex labels, it did not systematically examine which specific attributes most significantly influence consumers’ WTP or authenticity perceptions. Future research should explore the relative impact of individual label elements on consumer decision-making, particularly focusing on how different combinations of attributes might interact to influence WTP across various consumer segments. Similarly, future research should explore other extrinsic attributes that could influence WTP, such as bottle shape, closure style, color, label, etc. Additional studies are also needed to assess the potential for regulatory labeling standards, especially given recent amendments to Title 27 that have yet to be finalized by the U.S. Alcohol and Tobacco Tax and Trade Bureau [52].
Additionally, the study’s focus on bourbon may limit generalizability to other premium spirits categories, where different label design elements and consumer preferences may be more salient. Future research could explore how these findings translate across different spirits categories and international markets, particularly considering varying regulatory environments and cultural attitudes toward local production and traditional craftsmanship. Furthermore, future studies should seek to expand their sample size to ensure greater generalizability.
Author Contributions
Conceptualization, S.T.J.; Methodology, Y.Z. and S.T.J.; Formal Analysis, Y.Z.; Writing—original draft, Y.Z.; Writing—review and editing, S.T.J. and C.N. All authors have read and agreed to the published version of the manuscript.
Funding
This research received no external funding.
Institutional Review Board Statement
Reviewed in accordance with 45 CFR 46.104 (d) (3) and 45 CFR 46.111 (a) (7); the study received an exemption from Human Research Subject Regulations.
Informed Consent Statement
Informed consent was obtained from all subjects in the study.
Data Availability Statement
Data available upon request.
Conflicts of Interest
The authors declare no conflicts of interest.
Appendix A. Artificially Generated Images of Bourbon Labels
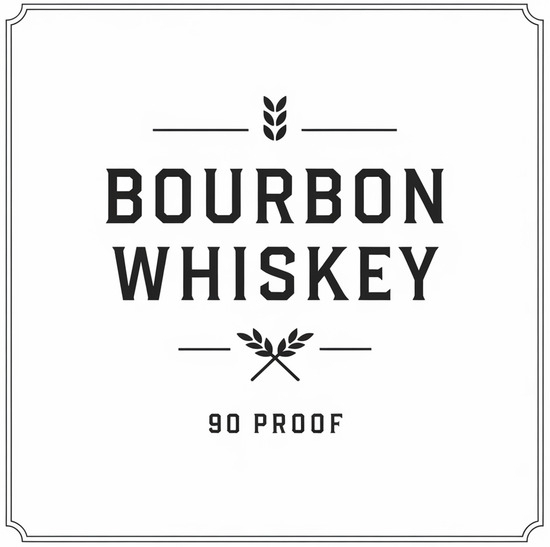
Figure A1.
Label 1.
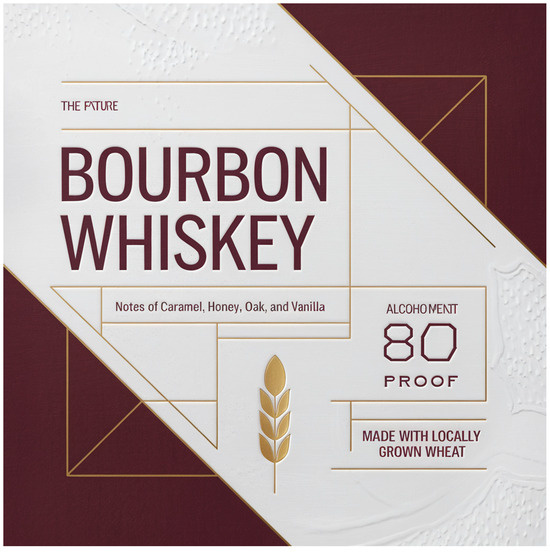
Figure A2.
Label 2.
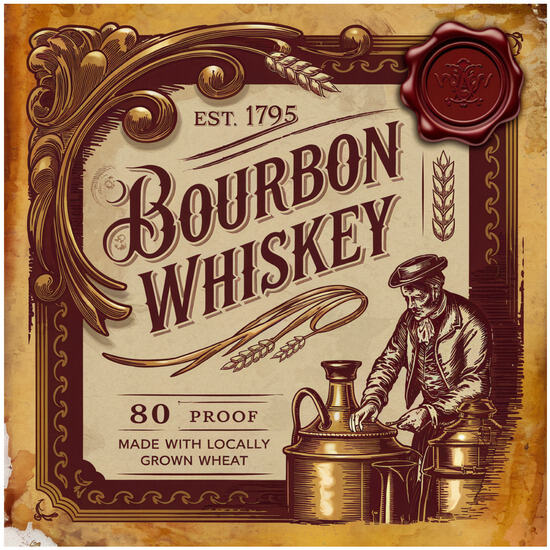
Figure A3.
Label 3.
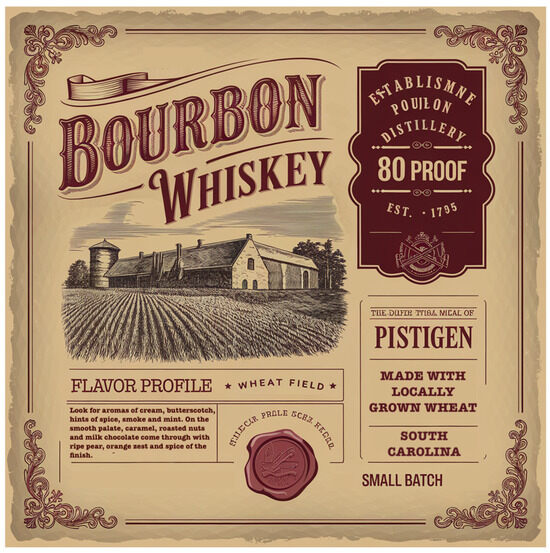
Figure A4.
Label 4.
References
- Wright, S.; Pilkington, H. Whiskies of Canada and the United States. In Whisky and Other Spirits, 3rd ed.; Russell, I., Stewart, G.G., Kel-lershohn, J., Eds.; Academic Press: Cambridge, MA, USA, 2022; Chapter 7; pp. 87–104. [Google Scholar] [CrossRef]
- Gumbel, R. How Neat: Using Geographical Indications to Expand Consumers’ Knowledge of Bourbon. Univ. Louisville Law Rev. 2024, 62, 483. [Google Scholar]
- Lunardo, R.; Rickard, B. How do consumers respond to fun wine labels? Br. Food J. 2020, 122, 2603–2619. [Google Scholar] [CrossRef]
- Kellershohn, J.; Lumby, N.; Kozar, M. Label design, packaging, and the Canadian Millennial/Gen Z wine consumer. J. Foodserv. Bus. Res. 2023, 28, 485–510. [Google Scholar] [CrossRef]
- Favier, M.; Celhay, F.; Pantin-Sohier, G. Is less more or a bore? Package design simplicity and brand perception: An application to Champagne. J. Retail. Consum. Serv. 2019, 46, 11–20. [Google Scholar] [CrossRef]
- Hsee, C.K. The Evaluability Hypothesis: An Explanation for Preference Reversals between Joint and Separate Evaluations of Alternatives. Organ. Behav. Hum. Decis. Process. 1996, 67, 247–257. [Google Scholar] [CrossRef]
- Hsee, C.K.; Zhang, J. General Evaluability Theory. Perspect. Psychol. Sci. 2010, 5, 343–355. [Google Scholar] [CrossRef]
- Carbone, A.; Quici, L. Craft beer mon amour: An exploration of Italian craft consumers. Br. Food J. 2020, 122, 2671–2687. [Google Scholar] [CrossRef]
- Gustafson, C.R.; Lybbert, T.J.; Sumner, D.A.; Buck, F.H. Consumer knowledge affects valuation of product attributes: Experimental results for wine. J. Behav. Exp. Econ. 2016, 65, 85–94. [Google Scholar] [CrossRef]
- Pelet, J.; Durrieu, F.; Lick, E. Label design of wines sold online: Effects of perceived authenticity on purchase intentions. J. Retail. Consum. Serv. 2020, 55, 102087. [Google Scholar] [CrossRef]
- Adams, D.C.; Salois, M.J. Local versus organic: A turn in consumer preferences and willingness-to-pay. Renew. Agric. Food Syst. 2010, 25, 331–341. [Google Scholar] [CrossRef]
- Olsen, J.E.; Atkin, T.; Thach, L.; Cuellar, S.S. Variety seeking by wine consumers in the southern states of the US. Int. J. Wine Bus. Res. 2015, 27, 260–280. [Google Scholar] [CrossRef]
- Hanemann, M. Willingness to Pay and Willingness to Accept: How Much Can They Differ? Am. Econ. Rev. 1991, 81, 635–647. Available online: https://www.jstor.org/stable/2006525 (accessed on 4 August 2025). [CrossRef]
- Angulo, A.M.; Gil, J.M. Risk perception and consumer willingness to pay for certified beef in Spain. Food Qual. Prefer. 2007, 18, 1106–1117. [Google Scholar] [CrossRef]
- Bronnmann, J.; Koemle, D.; Meyerhoff, J.; Weltersbach, M.S.; Strehlow, H.V.; Arlinghaus, R. Willingness to pay for harvest regulations and catch outcomes in recreational fisheries: A stated preference study of German cod anglers. Fish. Res. 2023, 259, 106536. [Google Scholar] [CrossRef]
- Jensen, K.L.; DeLong, K.L.; Gill, M.B.; Hughes, D.W. Consumer willingness to pay for locally produced hard cider in the USA. Int. J. Wine Bus. Res. 2021, 33, 411–431. [Google Scholar] [CrossRef]
- Liu, X.; Xu, L.; Zhu, D.; Wu, L. Consumers’ WTP for certified traceable tea in China. Br. Food J. 2015, 117, 1440–1452. [Google Scholar] [CrossRef]
- Schäufele, I.; Hamm, U. Consumers’ perceptions, preferences and willingness-to-pay for wine with sustainability characteristics: A review. J. Clean. Prod. 2017, 147, 379–394. [Google Scholar] [CrossRef]
- Li, S.; Kallas, Z. Meta-analysis of consumers’ willingness to pay for sustainable food products. Appetite 2021, 163, 105239. [Google Scholar] [CrossRef]
- DISCUS. Annual Economic Briefing. 2024. Available online: https://www.distilledspirits.org/wp-content/uploads/2024/02/2023-AEB-Slide-Deck-2.6.24-517PM.pdf (accessed on 4 August 2025).
- Kentucky Distillers’ Association. The Economic and Fiscal Impacts of the Distilling Industry in Kentucky. 2023. Available online: https://kybourbon.com/wp-content/uploads/2024/02/Economic-and-Fiscal-Impacts-FINAL-2-6-24.pdf (accessed on 4 August 2025).
- Hamilton, L.M.; Neill, C.L.; Lahne, J. Flavor language in expert reviews versus consumer preferences: An application to expensive American whiskeys. Food Qual. Prefer. 2023, 109, 104892. [Google Scholar] [CrossRef]
- González, P.A.; Parga-Dans, E. Natural wine: Do consumers know what it is, and how natural it really is? J. Clean. Prod. 2020, 251, 119635. [Google Scholar] [CrossRef]
- Capitello, R.; Agnoli, L.; Charters, S.; Begalli, D. Labelling environmental and terroir attributes: Young Italian consumers’ wine preferences. J. Clean. Prod. 2021, 304, 126991. [Google Scholar] [CrossRef]
- Luo, A.Q.; Quadri-Felitti, D.L.; Mattila, A.S. The double-edged effects of visualizing wine style: Sweetness scale on wine label. Int. J. Contemp. Hosp. Manag. 2024, 36, 2824–2841. [Google Scholar] [CrossRef]
- Zhang, W.; Saghaian, S.; Reed, M. Investigation of export-driving forces and trade potentials of the U.S. bourbon whisky industry. Appl. Econ. 2024, 56, 1950–1970. [Google Scholar] [CrossRef]
- Bellows, A.C.; Alcaraz, V.G.; Hallman, W.K. Gender and food, a study of attitudes in the USA towards organic, local, U.S. grown, and GM-free foods. Appetite 2010, 55, 540–550. [Google Scholar] [CrossRef] [PubMed]
- Gracia, A.; de Magistris, T.; Nayga, R.M., Jr. Importance of Social Influence in Consumers’ Willingness to Pay for Local Food: Are There Gender Differences? Agribusiness 2012, 28, 361–371. [Google Scholar] [CrossRef]
- Carpio, C.E.; Isengildina-Massa, O. Consumer willingness to pay for locally grown products: The case of South Carolina. Agribusiness 2009, 25, 412–426. [Google Scholar] [CrossRef]
- Canziani, B.; Byrd, E.T.; Boles, J.S. Consumer Drivers of Muscadine Wine Purchase Decisions. Beverages 2018, 4, 98. [Google Scholar] [CrossRef]
- Glenk, K.; Hall, C.; Liebe, U.; Meyerhoff, J. Preferences of Scotch malt whisky consumers for changes in pesticide use and origin of barley. Food Policy 2012, 37, 719–731. [Google Scholar] [CrossRef]
- Yildiz, H.; Heitz-Spahn, S.; Belaud, L. Do ethnocentric consumers really buy local products? J. Retail. Consum. Serv. 2018, 43, 139–148. [Google Scholar] [CrossRef]
- Weatherell, C.; Tregear, A.; Allinson, J. In search of the concerned consumer: UK public perceptions of food, farming and buying local. J. Rural. Stud. 2003, 19, 233–244. [Google Scholar] [CrossRef]
- Khan, F.; Prior, C. Evaluating the urban consumer with regard to sourcing local food: A Heart of England study. Int. J. Consum. Stud. 2010, 34, 161–168. [Google Scholar] [CrossRef]
- Fricz, Á.S.; Ittzés, A.; Ózsvári, L.; Szakos, D.; Kasza, G. Consumer perception of local food products in Hungary. Br. Food J. 2020, 122, 2965–2979. [Google Scholar] [CrossRef]
- Fernández-Ferrín, P.; Calvo-Turrientes, A.; Bande, B.; Artaraz-Miñón, M.; Galán-Ladero, M.M. The valuation and purchase of food products that combine local, regional and traditional features: The influence of consumer ethnocentrism. Food Qual. Prefer. 2018, 64, 138–147. [Google Scholar] [CrossRef]
- Chambers, S.; Lobb, A.; Butler, L.; Harvey, K.; Traill, W.B. Local, national and imported foods: A qualitative study. Appetite 2007, 49, 208–213. [Google Scholar] [CrossRef] [PubMed]
- Brucks, M. The Effects of Product Class Knowledge on Information Search Behavior. J. Consum. Res. 1985, 12, 1–16. [Google Scholar] [CrossRef]
- Gow, J.; Rana, R.H.; Moscovici, D.; Ugaglia, A.A.; Valenzuela, L.; Mihailescu, R.; Coelli, R. Australian consumers and environmental characteristics of wine: Price premium indications. Int. J. Wine Bus. Res. 2022, 34, 542–566. [Google Scholar] [CrossRef]
- Macht, J.; Klink-Lehmann, J.; Piqueras-Fiszman, B.; Hartmann, M. Insights into the organic labelling effect: The special case of wine. Br. Food J. 2021, 124, 3974–3992. [Google Scholar] [CrossRef]
- Moscovici, D.; Rezwanul, R.; Mihailescu, R.; Gow, J.; Ugaglia, A.A.; Valenzuela, L.; Rinaldi, A. Preferences for eco certified wines in the United States. Int. J. Wine Bus. Res. 2021, 33, 153–175. [Google Scholar] [CrossRef]
- Drichoutis, A.C.; Lazaridis, P.; Nayga, R.M. Nutrition knowledge and consumer use of nutritional food labels. Eur. Rev. Agric. Econ. 2005, 32, 93–118. [Google Scholar] [CrossRef]
- Eustice, C.; McCole, D.; Rutty, M. The impact of different product messages on wine tourists’ willingness to pay: A non-hypothetical experiment. Tour. Manag. 2019, 72, 242–248. [Google Scholar] [CrossRef]
- Brown, T.A.; Moore, M.T. Confirmatory factor analysis. In Handbook of Structural Equation Modeling; Hoyle, R.H., Ed.; Guilford Publications: New York, NY, USA, 2012; Volume 361, pp. 261–276. [Google Scholar]
- Shevlin, M.; Miles, J. Effects of sample size, model specification and factor loadings on the GFI in confirmatory factor analysis. Pers. Individ. Differ. 1998, 25, 85–90. [Google Scholar] [CrossRef]
- Marsh, H.W.; Balla, J.R.; McDonald, R.P. Goodness-of-fit indexes in confirmatory factor analysis: The effect of sample size. Psychol. Bull. 1988, 103, 391–410. [Google Scholar] [CrossRef]
- O’Brien, R.M. A Caution Regarding Rules of Thumb for Variance Inflation Factors. Qual. Quant. 2007, 41, 673–690. [Google Scholar] [CrossRef]
- Liu, H.; Yuan, K.-H. New Measures of Effect Size in Moderation Analysis. Psychol. Methods 2021, 26, 680–700. [Google Scholar] [CrossRef]
- Evangelidis, I.; van Osselaer, S.M.J. Interattribute evaluation theory. J. Exp. Psychol. Gen. 2019, 148, 1733–1746. [Google Scholar] [CrossRef] [PubMed]
- Thomas, A.; Pickering, G. The Importance of Wine Label Information. Int. J. Wine Mark. 2003, 15, 58–74. [Google Scholar] [CrossRef]
- Graefe, D.; Mowen, A.; Graefe, A. Craft beer enthusiasts’ support for neolocalism and environmental causes. In Craft Beverages and Tourism, Volume 2: Environmental, Societal, and Marketing Implications; Palgrave Macmillan: Cham, Switzerland, 2018; pp. 27–47. [Google Scholar] [CrossRef]
- Department of the Treasury, Alcohol and Tobacco Tax and Trade Bureau. Modernization of the Labeling and Advertising Regulations for Distilled Spirits and Malt Beverages; Correction. Fed. Regist. 2022, 87, 13156–13157. Available online: https://www.federalregister.gov/documents/2022/03/09/2022-04893/modernization-of-the-labeling-and-advertising-regulations-for-distilled-spirits-and-malt-beverages (accessed on 4 August 2025).
Disclaimer/Publisher’s Note: The statements, opinions and data contained in all publications are solely those of the individual author(s) and contributor(s) and not of MDPI and/or the editor(s). MDPI and/or the editor(s) disclaim responsibility for any injury to people or property resulting from any ideas, methods, instructions or products referred to in the content. |
© 2025 by the authors. Licensee MDPI, Basel, Switzerland. This article is an open access article distributed under the terms and conditions of the Creative Commons Attribution (CC BY) license (https://creativecommons.org/licenses/by/4.0/).