Article

Astringency Modification of Mandilaria Wines: Vineyard and Winery Strategies

by
Christina Karadimou
1,*,
Theodoros Gkrimpizis
1,
Eleni Louki
2,
Lamprini Roussi
2,
Nikolaos Theodorou
2,
Stefanos Koundouras
1 and
Stamatina Kallithraka
2,*
1
Laboratory of Viticulture, School of Agriculture, Aristotle University of Thessaloniki, 54124 Thessaloniki, Greece
2
Laboratory of Oenology and Alcoholic Drinks, Department of Food Science & Human Nutrition, Agricultural University of Athens, 75 Iera Odos, 11855 Athens, Greece
*
Authors to whom correspondence should be addressed.
Beverages 2025, 11(3), 76; https://doi.org/10.3390/beverages11030076
Submission received: 21 March 2025 / Revised: 7 May 2025 / Accepted: 8 May 2025 / Published: 26 May 2025

Abstract

:
This paper aims to explore the impact of targeted viticultural and enological interventions on reducing the astringency of wines made solely with Mandilaria, a red Vitis Vinifera L. grape variety. Mandilaria is characterized by its high berry density, high tannin content, intense color and full body profile, all of which contribute to the distinctive enological characteristics of the wines while also pretending challenges for producers during vinification. This research aims to improve phenolic ripeness and adapt the wine produced to the requirements of the present consumers demands. In the vineyards of Paros Island, different intensities of leaf removal and modifications to pruning load were applied. Three distinct post-harvest grape dehydration techniques and two varying levels of seed removal during alcoholic fermentation were evaluated for their effectiveness in reducing astringency. Sensory analysis with a trained panel was also performed. The results demonstrate that post-harvest dehydration techniques, particularly air and sun dehydration, significantly influence the quality indicators of Mandilaria wines, enhancing the phenolic content, tannin levels and antioxidant activity, while also improving the phenolic ripeness and reducing the harsh tannic profile. Furthermore, seed removal effectively diminished astringency without affecting the wine’s structure. These findings suggest that the integration of these viticultural and enological techniques can significantly enhance the sensory attributes of Mandilaria wines, making them more appealing to modern consumers.

Graphical Abstract

1. Introduction

Greek viticulture and enology have a rich history, showcasing a diverse array of genetically distinct Vitis vinifera L. grape varieties that have shaped unique wine styles from antiquity to the present. With over 300 indigenous grape varieties, Greece has maintained a strong winemaking tradition, cultivating a genetically rich population [1,2]. However, the globalization of the wine market has led to a significant reduction in biodiversity, as many local varieties were replaced by a few international cultivars prized for their phenolic and aromatic properties critical to vinification [3]. Recently, there has been renewed global and local interest in native grape varieties to preserve rare native stocks at risk of extinction and to diversify the wine market. Minor grape varieties and newly identified genotypes are increasingly valued for their potential to offer vibrant, aromatic wines and to meet consumer demand while preserving genetic diversity and cultural heritage [4,5].
Wine polyphenols, a diverse group of secondary metabolites primarily derived from grape berries, are essential to wine’s sensory, antioxidant and nutraceutical properties [6,7]. These compounds have a crucial role in wine quality by contributing to color, taste and oxidative stability, as well as playing a significant role in plant metabolism. Their composition is shaped by genetic factors, environmental conditions and viticultural practices. Among polyphenols, anthocyanins are responsible for the red and purple hues in wine and undergo reactions during fermentation and aging that affect long-term color stability [1]. Flavanols, another vital polyphenol subgroup, are particularly significant as they polymerize to form tannins, or proanthocyanidins, which are extracted from grape skins, seeds and stems during winemaking [6,7,8]. These condensed tannins contribute to astringency by precipitating proteins, influence bitterness and stabilize red wine’s color through interactions with anthocyanins. The contribution of tannins to astringency is determined by their molecular size and subunit composition, both of which are influenced by winemaking practices such as fermentation and pressing. Additionally, extended maceration can modulate their content by either stabilizing or reducing it [9,10]. Polyphenols form the foundation of wine’s sensory and structural qualities while being integral to its appealing and health-related attributes [7].
Astringency in wine, often described as a “tannic” sensation, is a tactile experience characterized by dryness, roughness and shrinking in the mouth, primarily caused by tannins–polymeric pigments formed from flavan-3-ol subunits like catechin and epicatechin [4,11]. These tannins interact with salivary proteins, forming complexes that reduce lubrication, leading to the distinct perception of astringency. While tannins are the primary contributors, other factors such as anthocyanins, acidity, ethanol concentration and polysaccharides also play roles, and imbalances can lead to an overly astringent wine, described as “harsh” or “unripe” [12,13]. The perception of astringency is influenced by the wine’s tannin content, pH, polyphenolic composition and alcohol level, with extensive research linking reduced astringency to adjustments in these elements. Winemakers can manage astringency by carefully balancing tannin extraction, enhancing polysaccharide content and optimizing production processes. Although newer methods to mitigate undesirable phenolic astringency are emerging, comprehensive evaluations of their effectiveness are still needed [14,15,16].
Several viticultural practices are essential for modifying the grapevine microclimate to enhance fruit quality and address environmental challenges, with various strategies employed during grape cultivation or winemaking to influence the phenolic composition of red wines [17,18]. Adjusting the canopy, through techniques, like leaf removal and different pruning systems, regulates light exposure to grape clusters, affecting their microclimate and altering their chemical composition [19]. Building on these approaches, further adaptation strategies are necessary to address climate change impacts in warm regions [20,21]. These include exploring new winemaking processes or the use of natural products to mitigate ripening imbalances, which take advantage of high radiation and temperatures. Techniques like post-harvest withering, involving the partial dehydration of grapes, induce metabolic changes that enhance their physical and chemical properties [22,23]. Thereby, over-ripening grapes through sunlight techniques naturally alters their composition and facilitates the creation of new styles of wines [24].
Recent research has emphasized that vineyard and winery practices not only influence the phenolic and structural attributes of wines but also have a considerable impact on their volatile composition and aromatic profile. In particular, basal and cluster-zone defoliation have been shown to increase key varietal and fermentation-derived aromas such as β-damascenone and linalool, while simultaneously reducing undesired green notes like methoxypyrazines when applied early in the season [25]. These changes contribute positively to wine’s complexity and sensory appeal. Additionally, air dehydration, by modulating the concentration of aroma precursors, and seed removal, by reducing astringent bitterness and influencing volatile release during fermentation, may further shape the wine’s aromatic expression. Therefore, it is essential to consider not only the structural and phenolic outcomes but also the volatile and sensory implications of these interventions when aiming to optimize wine quality.
In the light of the above, the aim of this study was a modification in the astringency of wines made exclusively from Mandilaria grapes, a red, indigenous variety cultivated on the Aegean islands, particularly under the environmental conditions of Paros Island. Mandilaria is known for its high tannic content, full-bodied profile and dense grape clusters, which often suffer from rot and present challenges for winemakers because of their pronounced bitterness and astringency. To achieve this goal, viticultural practices, improving phenolic ripening through grape exposure to sunlight and reducing cluster density, were employed. Additionally, dehydration techniques and tannin reduction methods were used. Finally, a complementary sensory analysis conducted by trained assessors was included to support the observed modification in astringency and to explore its potential correlation with other measured parameters.

2. Materials and Methods

2.1. Chemicals and Reagents

Methanol, ethanol, acetonitrile, ethyl acetate, water, acetone (HPLC grade), phloroglucinol and sodium metabisulfite were purchased from Merck (Zedelgem, Belgium). Methanol (HPLC-Ultra LC-MS grade) was also obtained from HiPerSolv CHROMANORM, (VWR Chemicals BDH, Amsterdam, The Netherlands) to produce standard solutions. L-ascorbic acid, formic acid (99%) and hydrochloric acid (37%) for the analysis were purchased from Carlo Erba (Val-de-Reuil, France), and the trifluoroacetic acid for the LC-MS was obtained from Fluka (Buchs, Switzerland). Sodium hydroxide, Folin–Ciocalteu phenol reagent, 2,2-diphenyl-picryl-hydrazyl radical (DPPH), methylcellulose (MCP) and bovine serum albumin (BSA, fraction V) were obtained from Sigma Aldrich (Darmstadt, Germany). The analytical standards of delphinidin-3-O-glucoside chloride (99.5%), cyanidin-3-O-glucoside chloride (96.2%), petunidin-3-O-glucoside chloride (97.5%), peonidin-3-O glucoside chloride (96.6%) and malvidin-3-O-glucoside chloride (96.7%) were obtained from Extrasynthese (Genay Cedex, France). The anthocyanin standards were diluted separately in methanol LC-MS with 0.1%HCl. Catechin (98%), epicatechin (97%), epigallocatechin (99.5%), epicatechin gallate (98%), gallocatechin (98%), epigallocatechin gallate (95%), procyanidin B1 (90%) and procyanidin B2 (90%) were acquired from Sigma-Aldrich (Darmstadt, Germany).

2.2. Experimental Design

On Paros Island (Greece), the experiments were conducted in linear vineyards to facilitate the application of treatments. The Mandilaria grapes were harvested in 2023, when the soluble solids content was 18.8 ± 1° Brix. Initially, viticultural practices were conducted to increase the grapes’ exposure to light, reducing the cluster density and berry size through complete (T-RIF) and partial defoliation (E-RIF), carried out in late May. Additionally, the distribution of the pruning load was modified to influence the phenolic content of the Mandilaria grapes. To achieve this goal, long pruning (Guyot system) was applied, retaining one cane with 10 buds (CANE).
Furthermore, the following three different dehydration techniques were used: sun-drying (D-SUN); dehydration in a closed room with shaded air circulation (D-AIR), which is comparable to the Amarone procedure; and pedicel crushing for extended ripening on the vine (D-VIN). The dehydration process was closely observed, measuring the sugar content and fruit weight every day.
Simultaneously, the following two interventions were tried consecutively during the winery phase: mechanically removing 20% (SE20) and 30% (SE30) of the seeds on the 8th day of maceration. The seeds were removed to reduce the extraction of seed-bound phenolics, which are mostly responsible for astringency.

2.3. Vinification Protocol

Experimental winemaking was carried out using 70 kg of harvested grapes for each treatment. Grapes were crushed, destemmed and supplemented with potassium metabisulfite (SO2) at 50 mg/L. Pectolytic enzymes at 40 mg/L (Safizym Pres, Fermentis, Marquette-Lez-Lille, France) (previously hydrated in water 15 min, 38 °C) and nutrients at 30 g/tn were also added. All vinifications for the different treatments were carried out in 100 L tanks to ensure stable and standardized conditions. In vineyard and seed removal experimental trials, spontaneous alcoholic fermentation was carried out, whereas with the vinification of the dehydrated grapes, because of the high initial density, a commercial strain of Saccharomyces cerevisiae Collezione Primavera ‘56 (Laffort, Bordeaux, France) at 300 mg/L was used to ensure the complete conversion of sugars into alcohol. Fermentation was monitored by twice daily punch-downs to enhance the extraction of the phenolic compounds, with the frequency reduced over time as the days passed. At the end of the maceration, the juice was separated from the pomace and allowed to completely ferment over the following six days, during which all fermentations were finalized. Wines were racked, supplemented with 40 mg/L SO2 and bottled after filtration or stabilization. No malolactic fermentation was performed. After the completion of alcoholic fermentation, the wines were stored at 18 ± 2 °C in the dark until the analysis.

2.4. Grape and Wine Analysis

Following the OIV standard procedures for wine analysis, samples were collected for each treatment’s grape maturity analysis [26]. In particular, the measurements of pH, total soluble solids (Brix) and total titratable acidity (TA) were performed for samples of about 50 grapes. All analyses were performed in triplicate. Another sub-sample of 50 berries was weighed, and skins and seeds were manually separated to measure the average berry mass and analyze the distribution of the berry mass components. The percentage of skin and seed per berry weight ratio was assessed across the different treatments.

2.5. Chemical Analysis

The seeds and skins from 50 berries per replicate were manually separated, freeze-dried and ground into powder. The extraction of phenolics from skins and seeds was carried out followed previously established protocols [27,28] with slight modifications. Briefly, 0.3 g of powdered material was first extracted with 2.5 mL of acetone/water (80:20, v/v) for 3 h, followed by a second extraction using 2.5 mL of methanol/water (60:40, v/v) for 2.5 h. The resulting supernatants were combined, and the organic solvents were removed by evaporation under pressure at 30 °C. Finally, the residue was dissolved in water and lyophilized, yielding a crude phenolic extract. In the case of grapes, only total anthocyanins and extractability were measured in whole berries, while all other grape analyses were conducted on freeze-dried tissue. The phenolic compounds in the grapes and wines were analyzed utilizing the methods described in the following assays.

2.5.1. Color and Polyphenol Analyses

The color characteristics of the wine samples were assessed following the Glories method [29], characterizing the color intensity and hue, with the absorbance recorded at 420, 520 and 620 nm using a UV-VIS spectrophotometer equipped with 1 mm quartz cells.
For the analysis of the total polyphenolic index (TPI), wine samples were first filtered and then diluted with distilled water at a 1:100 ratio before measuring absorbance at 280 nm. All absorbance measurements were performed on a Hitachi U-2000 spectrophotometer (Jasco, Victoria, BC, Canada).

2.5.2. Total Phenols and Antioxidant Activity

The total polyphenol concentration in grapes and wines was determined using the Folin–Ciocalteu assay, following a previously established microscale protocol with slight modifications [30,31]. The absorbance was recorded at 750 nm using a spectrophotometer, and the polyphenol levels are expressed as gallic acid equivalents (GAE) in mg/L for wines and mg/g for grapes.
The antioxidant activities of the wine samples and grape extracts were assessed using the DPPH radical scavenging method. The reaction was monitored at 515 nm over 30 min, while the absorbance measurements were recorded using a UV-VIS spectrophotometer. The antioxidant capacity is expressed as the Trolox equivalent antioxidant capacity (TEAC) in mmol Trolox, determined through interpolation in a Trolox standard curve.

2.5.3. Analysis of Anthocyanins

The total anthocyanin content of the grape berries was assessed by spectrophotometry using the Iland method [32], while extractable anthocyanins were quantified following Glories’ method [29]. To further characterize the monomeric anthocyanins in grapes and wines, high-performance liquid chromatography (HPLC) was used, following previously established methods [33]. The identification and quantification of the individual anthocyanins were achieved by comparing retention times with those of the authentic standards. Chromatographic analysis was performed using a SpectraSYSTEM HPLC system (Thermo Separation Products, Austin, TX, USA), which included a P2000 secondary solvent pump, an AS3000 autosampler with a 100 μL injection loop and a UV6000LP diode array detector. The chromatographic separation was performed on a Nucleosil 100-5 C18, 250 × 4.6 mm, 5-μm and reversed-phase (RP) column (Macherey–Nagel, Düren, Germany). The column oven temperature was 40 °C, the injection volume was 5 μL and the total runtime was 40 min. The mobile phases were aqueous formic acid 5% (Solvent A) and methanol (Solvent B) at a flow rate of 1 mL/min. The gradient elution program was applied, starting with 10% Solvent B (90% A) and held for 22 min, at which point the ratio was adjusted to 50:50. This was followed by a sharp increase to 95% B at 32 min, maintained briefly until 34 min and re-equilibrated to 10% B (90% A) by 35 min, which was maintained until the end at 40 min.

2.5.4. Analysis of Tannins

The tannin contents in the grape and wine samples were evaluated using protein precipitation assays with bovine serum albumin (BSA), following an established methodology [34]. The absorbance at 510 nm was recorded using a UV-/VIS spectrophotometer. Additionally, tannins were measured with an alternative method developed by Sarneckis et al. [35], and the estimated tannin levels were compared to those of a control sample, with a methylcellulose-precipitated sample, and the absorbance measured at 280 nm. For both methods, the tannin concentration was determined based on a catechin standard curve, and the results are expressed in mg catechin equivalents per liter.
The mean degree of polymerization (mDP), percentage of galloylation (%G) and prodelphinidin (%P) of the tannins were determined using acid-catalyzed cleavage in the presence of excess phloroglucinol. No fractionation was performed to differentiate oligomeric and polymeric proanthocyanidins, and the total tannin extracts were dissolved in methanol and reacted with phloroglucinol reagent, followed by quenching with aqueous sodium acetate, according to modifications of previously described methods [27,36,37]. The reaction products were analyzed by LC/MS on a Shimadzu 2010A (Shimatzu Corporation, Tokyo, Japan) coupled to a single-quadrupole mass spectrometer equipped with an electrospray ion source, according to the method described by Kyraleou et al. [18]. The monomers (+)-catechin, (-)-epicatechin, (-)-epicatechin-3-O-gallate and (--)-epigallocatechin were identified by comparing their retention times with those of the pure compounds. Separation was achieved on a reversed-phase Waters XTerra RR C18 (100 × 4.6 mm, 3.5 μm) column, at a flow rate of 0.5 mL/min, and the column oven temperature was 30 °C with an injection volume of 20 μL. The elution program involved decreasing eluent A from 80% to 40% over 20 min, maintaining this composition isocratically for an additional 10 min and then increasing it back to 80% over 2 min. Eluent A consisted of 0.1% acetic acid in water, while eluent B was methanol. Each sample was analyzed in triplicate. The elution performed under previously established conditions [38].

2.6. Sensory Analysis

Fifteen healthy participants from the Laboratory of Oenology of the Agricultural University of Athens took part in this study. All participants were skilled wine assessors who had undergone prior training in evaluating astringency. The experiment was conducted over three weeks, comprising six sessions (three replications). The assessments took place between 11:00 a.m. and 1:00 p.m. in individual booths.
A balanced block design was implemented to counteract the progressive accumulation of astringency perception and to equalize the impact of presentation order. The panelists were given 10 mL samples at room temperature and instructed to assess astringency intensity on a scale from 0 to 7. To prevent any lingering effects from previous samples, a five-minute break was observed between tastings, during which panelists rinsed their mouths with water. This ensured the restoration of normal oral lubrication and minimized any carryover effects. To comply with the research code of ethics, the sensorial evaluation of the wines received approval from the Research Ethics Commission of Agricultural University of Athens.

2.7. Statistical Analysis

A statistical analysis was conducted to evaluate differences at a 95% confidence level (p < 0.05). The analysis included one-way ANOVA performed using Microsoft Excel (Microsoft Excel 2019, Excel for Microsoft 365) with the Data Analysis tool, followed by Tukey’s HSD test for mean comparison when significant differences were observed. All analyses were conducted in triplicate to ensure reliability.

3. Results and Discussion

3.1. Berry Features

3.1.1. Vineyard Treatments

Berry size is an important factor influencing yield and grape quality, particularly in Mandilaria, a variety known for its dense clusters and high tannin content. The impacts of both vineyard interventions on grape morphology measurements are notable. Specifically, a significant increase in bunch length was observed in the case of the long pruning (CANE) (21.3 cm) and total defoliation (T-RIF) (19.1 cm), while the width changed only with total defoliation (12.7 cm). Additionally, the long pruning greatly increased the peduncle length (3.1 cm), which is a well-known issue with the Mandilaria variety, while it also negatively affected the berry size (Table 1). Concerning the distribution of weights after the cultivation interventions, an increase in skin weight was observed in all cases, while the percentage of seeds increased only in the case of long pruning (5.9%).
The results of the classical chemical analysis of the grapes from the two cultivation practices—long pruning and defoliation—were compared to those obtained for the control (short pruning without defoliation) sample. The data show that long pruning had no impact on sugar levels but led to an increase in acidity (6.4 g tartaric acid/L). In contrast, both defoliation methods (eastern and total) raised sugar levels (19.0° Brix and 19.4° Brix, respectively) while reducing acidity (3.5 g tartaric acid/L and 4.0 g tartaric acid/L, respectively). No significant difference was observed between eastern defoliation (E-RIF) and total defoliation (T-RIF). These findings are summarized in Table 2.

3.1.2. Dehydration Treatments

Variations in the physical and chemical properties of the berries subjected to different dehydration methods demonstrate differences in moisture removal time. The grapes dried under direct sunlight (D-SUN) reached the highest sugar concentration (27.6° Brix) and had an elevated pH (3.71). In contrast, shade and air dehydration (D-AIR) resulted in a moderate increase in sugar (23.5° Brix), a lower pH (3.25) and the highest observed titratable acidity (7.8 g tartaric acid/L). The grapes left to ripen further on the vine (D-VIN) exhibited intermediate values for both° Brix and acidity (Table 3).
Different dehydration techniques were applied to modulate the grape density and enhance quality characteristics. All methods led to a significant reduction in berry weight, even though the distribution of the grape components (skins, seeds and flesh) varied across treatments. Sun-dried grapes (D-SUN) showed a notable increase in skin weight, whereas the proportion of seeds remained relatively stable across all methods. The skin-to-flesh ratio plays a key role in defining a wine’s quality and sensory attributes, as skins are rich in phenolic and volatile compounds, which are extracted during vinification [39]. Among the dehydration techniques, D-SUN grapes exhibited the highest skin-to-flesh ratio (0.270), while D-VIN (0.081) and D-AIR (0.129) resulted in lower ratios.
The dehydration time varied depending on the method used, influencing the final berry characteristics. The weight and sugar content were recorded at two-day intervals to monitor the dehydration process. With a higher determination coefficient (R2 = 0.9404) for the D-SUN method, the weight loss and Brix curves exhibited a linear decline in relation to dehydration time (Figure 1a). Meanwhile, the D-VIN approach demonstrated the most consistent linear decrease in weight loss (Figure 1b), showing a strong correlation (R2 = 0.924).

3.2. Phenolic Composition in Grapes and Wines

3.2.1. Total Phenolics and Antioxidant Activity

Table 4 illustrates the effects of several vineyard and winery practices on the phenolic index (TPI), total phenolics (TP) and antioxidant activity (TEAC) in grape skins, seeds and wine. Significant patterns and variations among treatments are revealed by the data.
The findings indicate that vineyard and winery practices have a greater influence on the phenolic content and antioxidant activity (TEAC) of the final wines than on the grapes (skins and seeds) from which they were produced. While vineyard treatments (pruning and defoliation) and dehydration methods led to changes in the phenolic profiles of grape components, these alterations were relatively minor compared to the significant transformations observed in the wine.
The control sample (CTRL-V) exhibited the highest total phenolics and antioxidant activity values in the grape skins, indicating that viticultural interventions do not directly influence these compounds. TEAC and TP levels were higher in the T-RIF and CANE samples compared to E-RIF, implying that more intensive canopy management may have a modest yet positive effect on phenolic retention in skins. However, these variations in vineyard treatments were less pronounced than those observed in dehydration methods, where significant reductions in antioxidant activity and total phenolics were recorded—particularly for the D-SUN treatment (1.62 mM and 282.27 mg GAE/L, respectively).
The values of the antioxidant activity in the grape seeds showed minimal variation across vineyard treatments, suggesting that seeds are less affected by defoliation or pruning. Unlike grape skins, seeds subjected to dehydration techniques maintained relatively stable antioxidant activity, indicating their ability to preserve phenolic content during post-harvest processing. These findings emphasize the protective nature of seeds, which may act as reservoirs of phenolic compounds under processing and stress conditions. The influence of vineyard treatments on wine samples became increasingly evident throughout the winemaking process. Defoliation effectively enhanced phenolic extraction, as wines made from grapes undergoing this treatment displayed higher antioxidant activity and phenolic content than those from the long pruning treatment. Similar findings have been documented in the literature [40]. However, the impact of dehydration techniques was even more pronounced. Wines produced from dehydrated grapes, particularly those subjected to D-SUN and D-AIR treatments, displayed the highest levels of antioxidant activity and total phenols, which are key factors contributing to the wine’s body and aging potential. Similar results have also been reported for other varieties [41]. This suggests that, beyond concentrating phenolic compounds, dehydration techniques also enhance their extraction during maceration. Conversely, seed removal treatments (SE20 and SE30) led to a decline in phenolic content and antioxidant activity, in accordance with previous results [42], demonstrating the essential role of seeds in determining the wine’s overall phenolic profile.

3.2.2. Color Parameters

Vineyard and winery treatments significantly influenced the intensity (E) and hue (A) values of the resulting wines compared to their respective controls (Figure 2). Among the vineyard interventions, T-RIF resulted in wines with the most vibrant and intense red color, with the highest intensity (20.72 AU) and the lowest hue (5) values. Partial defoliation followed closely, yielding wines with color intensity of 19.50 (AU) and a similarly low hue (5.3), suggesting that both defoliation techniques enhance pigment concentration in grape skins. Additionally, long pruning resulted in slightly higher intensity (17.9 AU) and similar hue (5.3) values compared to the vineyard control (16.34 AU intensity, 5.41 hue). These findings indicate that defoliation, particularly when applied fully, enhances wine color intensity and vibrancy by promoting the synthesis of anthocyanins and other pigments.
No significant differences were observed in color parameters of the wines produced by the seed removal treatments and the control sample, which is consistent with other studies [42]. This reflects the reduced contribution of phenolic compounds from seed removal, leading to lighter and less intense wines. In contrast, dehydration treatments had a pronounced effect. D-VIN and D-SUN significantly enhanced color intensity compared to control sample (18.53 and 17.85 AU respectively), with D-VIN maintaining a moderate hue (6.1), indicative of a more attractive red color. Meanwhile, the samples derived from D-SUN treatment exhibited the highest hue (8.38) value, suggesting a shift toward browner tones due to oxidative changes during sun-drying. The D-AIR samples on the other hand displayed moderate color intensity (14.24 AU) and hue (6.86) values, indicating a more balanced color development. This positive effect of defoliation on color intensity is in agreement with previous findings reported in the literature [43].

3.2.3. Anthocyanins in Grapes and Wines

  • Vineyard interventions
Grapes subjected to long pruning exhibited the highest extractability value (53.04%), suggesting that this vineyard treatment enhances the release of anthocyanins from grape skins. In contrast, leaf removal treatments showed significantly lower extractability, values indicating a negative impact on anthocyanin release (Table 5). Regarding total anthocyanin content per berry, total leaf removal resulted in the highest content (1.47 mg/berry), suggesting that this practice may contribute to wines with a more intense color.
The liquid chromatography analysis of the total anthocyanin content in grape skins further confirmed that total defoliation yielded the most favorable results. This is followed by long pruning (26.57 mg/g fresh weight of skins), in contrast to the spectrophotometric data, which clearly show the benefits of the two defoliation techniques. Similarly, the anthocyanin contents of the wines follow this trend with T-RIF exhibiting the highest contents, (375.39 mg/L), followed by E-RIF wines (341.55 mg/L). These findings indicate that defoliation treatments enhance the anthocyanin content of wines, potentially contributing to a higher phenolic content and more intense coloration.
As shown in Figure 3a, the anthocyanin composition in the grapes changed following the vineyard treatments. Defoliation resulted in higher concentrations of Pet and Dlp, while Mlv, the most stable anthocyanin [1], was the most abundant in the grapes of the long-pruned vines. Additionally, Peo emerged as the most prevalent anthocyanin in T-RIF grape skins, along with Mlv coum, suggesting that the vineyard treatments significantly influenced the anthocyanin profile. Similar trends were observed in the corresponding experimental wines (Figure 4a), where Mlv remained the dominant anthocyanin, particularly in long-pruned vines. Meanwhile, wines produced from grapes subjected to defoliation treatments retained higher contents of Dlp and Pet, consistent with the grape composition. Another significant finding regarding defoliation treatments was the higher amounts of Mlv acet found in wines in comparison with the control.
  • Winery interventions
Anthocyanin extractability was significantly low across all drying treatments, with sun dehydration exhibiting the most pronounced reduction. This finding supports previous research indicating that dehydration techniques significantly decrease anthocyanin extractability [23]. Moreover, dehydration considerably affected the overall anthocyanin concentration in grapes, with D-SUN grapes showing the lowest levels (0.61 mg/berry), followed by D-AIR with a slightly higher concentration (0.69 mg/berry).
Similarly, the HPLC analysis revealed that sun-dehydrated grapes had a considerably low anthocyanin concentration (3.10 mg/g fresh weight of skins), while D-AIR and D-VIN exhibited slightly higher contents (10.60 mg/g and 9.70 mg/g, respectively). Regarding wines, D-VIN treatment resulted in the highest anthocyanin content (101.80 mg/L), while D-AIR showed considerably lower levels (41.24 mg/L). The most pronounced reduction was observed in wines produced by D-SUN grapes, where the anthocyanin concentration was nearly negligible (2.07 mg/L), suggesting that this drying process severely degraded the anthocyanins. These findings align with the existing literature, as increased light exposure and elevated temperatures intensify grape skin rupture, leading to enhanced oxidative anthocyanin degradation [44].
The HPLC analysis of the individual anthocyanins in the dehydrated grapes (Figure 3b) revealed no significant differences between the air dehydration and vine over-ripening treatments. Mlv remained largely stable, particularly in the D-AIR and D-VIN grapes, while Peo exhibited a significant reduction in the grapes subjected to both dehydration methods. Mlv coum contributed substantially across all dehydration treatments. The impact of the dehydration treatments was more pronounced in the wines (Figure 4b). Dlp and Pet were completely absent in the D-SUN and D-AIR wines, while in D-VIN they were present in low amounts. Across all treatments, Mlv was the predominant anthocyanin, with the D-SUN intervention resulting in the highest concentration. Another noteworthy finding was the absence of the acetyl ester of malvidin in D-AIR wines while its coumaroylated ester was significantly more abundant in the corresponding wines. Furthermore, consistent with previous research [42], no significant alterations in the anthocyanin profile were observed in the wines where the seeds were removed during the winemaking process. The SE20 wine showed a slight but non-significant decrease in the total anthocyanin content. Overall, polyphenol extraction from seeds and skins occurred independently under the same maceration conditions and removing seeds did not affect anthocyanin extraction from the skins.

3.2.4. Total Tannins in Grapes and Wines

The findings from both viticultural and winemaking practices clearly demonstrate their significant influence on the tannin content and, consequently, the astringency of the final wines. Tannin content in grapes and wines as measured by the MCP and BSA methods, directly correlates with perceived astringency. As shown in Table 6, practices such as defoliation and long pruning result in moderate tannin contents in grape skins and seeds. These canopy management techniques enhance light exposure and air circulation, promoting maturation of phenolic compounds.
In contrast, winery management strategies involving overripening tend to reduce skin tannin contributions while enhancing the extraction of seed tannins during winemaking. The treatments such as off-vine dehydration (specifically D-AIR and D-SUN) resulted in wines with the highest concentrations of tannin. Notably, D-AIR consistently exhibited the highest tannin levels across both assays, suggesting that air dehydration significantly enhances tannin extraction. Although the D-VIN treatment resulted in lower total tannin concentrations compared to the other dehydration techniques, the wines were still perceived as highly astringent. This phenomenon may be attributed to a higher relative contribution of seed-derived tannins, known for their more aggressive astringent character compared to skin-derived tannins [6]. Furthermore, the on-vine dehydration process may have selectively favored the extraction of smaller, highly reactive phenolic compounds, amplifying the sensory perception of astringency despite the lower overall tannin content.
Additionally, seed removal during maceration was found to reduce the overall tannin concentrations, resulting in wines with lower astringency, as expected. However, this reduction is not consistently observed across all studies [42], highlighting the complex interactions between vineyard practices and winemaking techniques in determining the final tannin structure.
As presented in Table 7, the sensory evaluation revealed distinct effects of the applied practices on astringency perception. Dehydration treatments consistently resulted in higher astringency scores, reflecting the concentration of phenolic compounds associated with this sensation. Conversely, the seed removal treatments led to significantly lower astringency, indicating the important role of seed-derived tannins. Vineyard management practices showed intermediate effects, suggesting a more moderate impact on the phenolic profile related to astringency. Figure 5 illustrates the correlation between astringency and tannin content measured by the MCP and BSA methods. The data obtained from the BSA (R2 = 0.750) and MCP (R2 = 0.740) methods demonstrate a strong correlation with astringency. Τo the best of our knowledge, this study is the first to explore how viticultural treatments, dehydration and seed removal practices influence the sensory characteristics of a highly tannic grape variety. The questionnaire used for the sensory evaluation is provided in Figure S1 in Supplementary Material, including a detailed description of the astringency scale applied.
The data presented in Figure 6 highlight the effects of various viticultural and enological practices on grape and wine characteristics, with a focus on the structural properties of proanthocyanidins. Among the vineyard treatments, no significant changes were observed regarding the mean degree of polymerization (mDp) of tannins, as well as in the percentages of prodelphinidins (%P) and the percentage of gallic esters (%G). The dehydration treatments, particularly D-SUN, significantly decreased the mDp values, suggesting that overripening methods may induce polymer degradation or structural rearrangement of polyphenolic compounds. The dehydrated grapes also exhibited a higher prodelphinidin content, though the control treatment consistently showed the highest levels. The results of this study suggest that seed removal during fermentation leads to tannins with a higher mDp, as the remaining tannins, predominantly derived from the skins, exhibit a higher degree of polymerization. Conversely, the mDp values observed in dehydrated treatments were lower than in the control, indicating potential tannin breakdown or inhibition of polymerization during dehydration. Furthermore, partial seed removal did not significantly alter the overall proportion of galloylated tannins despite their higher abundance in grape seeds. However, dehydration appeared to slightly increase galloylation levels, likely because of the compound concentration effects during the dehydration process. Similarly, seed removal treatments maintained relatively stable %P levels, as prodelphinidins are primarily associated with skin tannins [45]. In contrast to other studies, dehydrated treatments exhibited a slight decline in prodelphinidin levels, likely due to oxidation, enhanced polymerization, cellular breakdown and enzymatic degradation [46,47].
Overall, these observations highlight the significant impact of both viticultural and winemaking practices on the tannin content and profile of grapes and, consequently, on the sensory character of the final wine. By optimizing these practices, wine makers can effectively modulate the chemical composition and the sensory attributes of grapes and wines to achieve the desired quality and organoleptic characteristics.
This study is based on data from a single experimental year, which may limit the generalizability of the results. However, all trials were performed in biological triplicates both in the vineyard and winery to ensure data robustness. The experiment continued into a second year, with ongoing experimental work. To maintain clarity and methodological consistency, subsequent data will be presented separately.

4. Conclusions

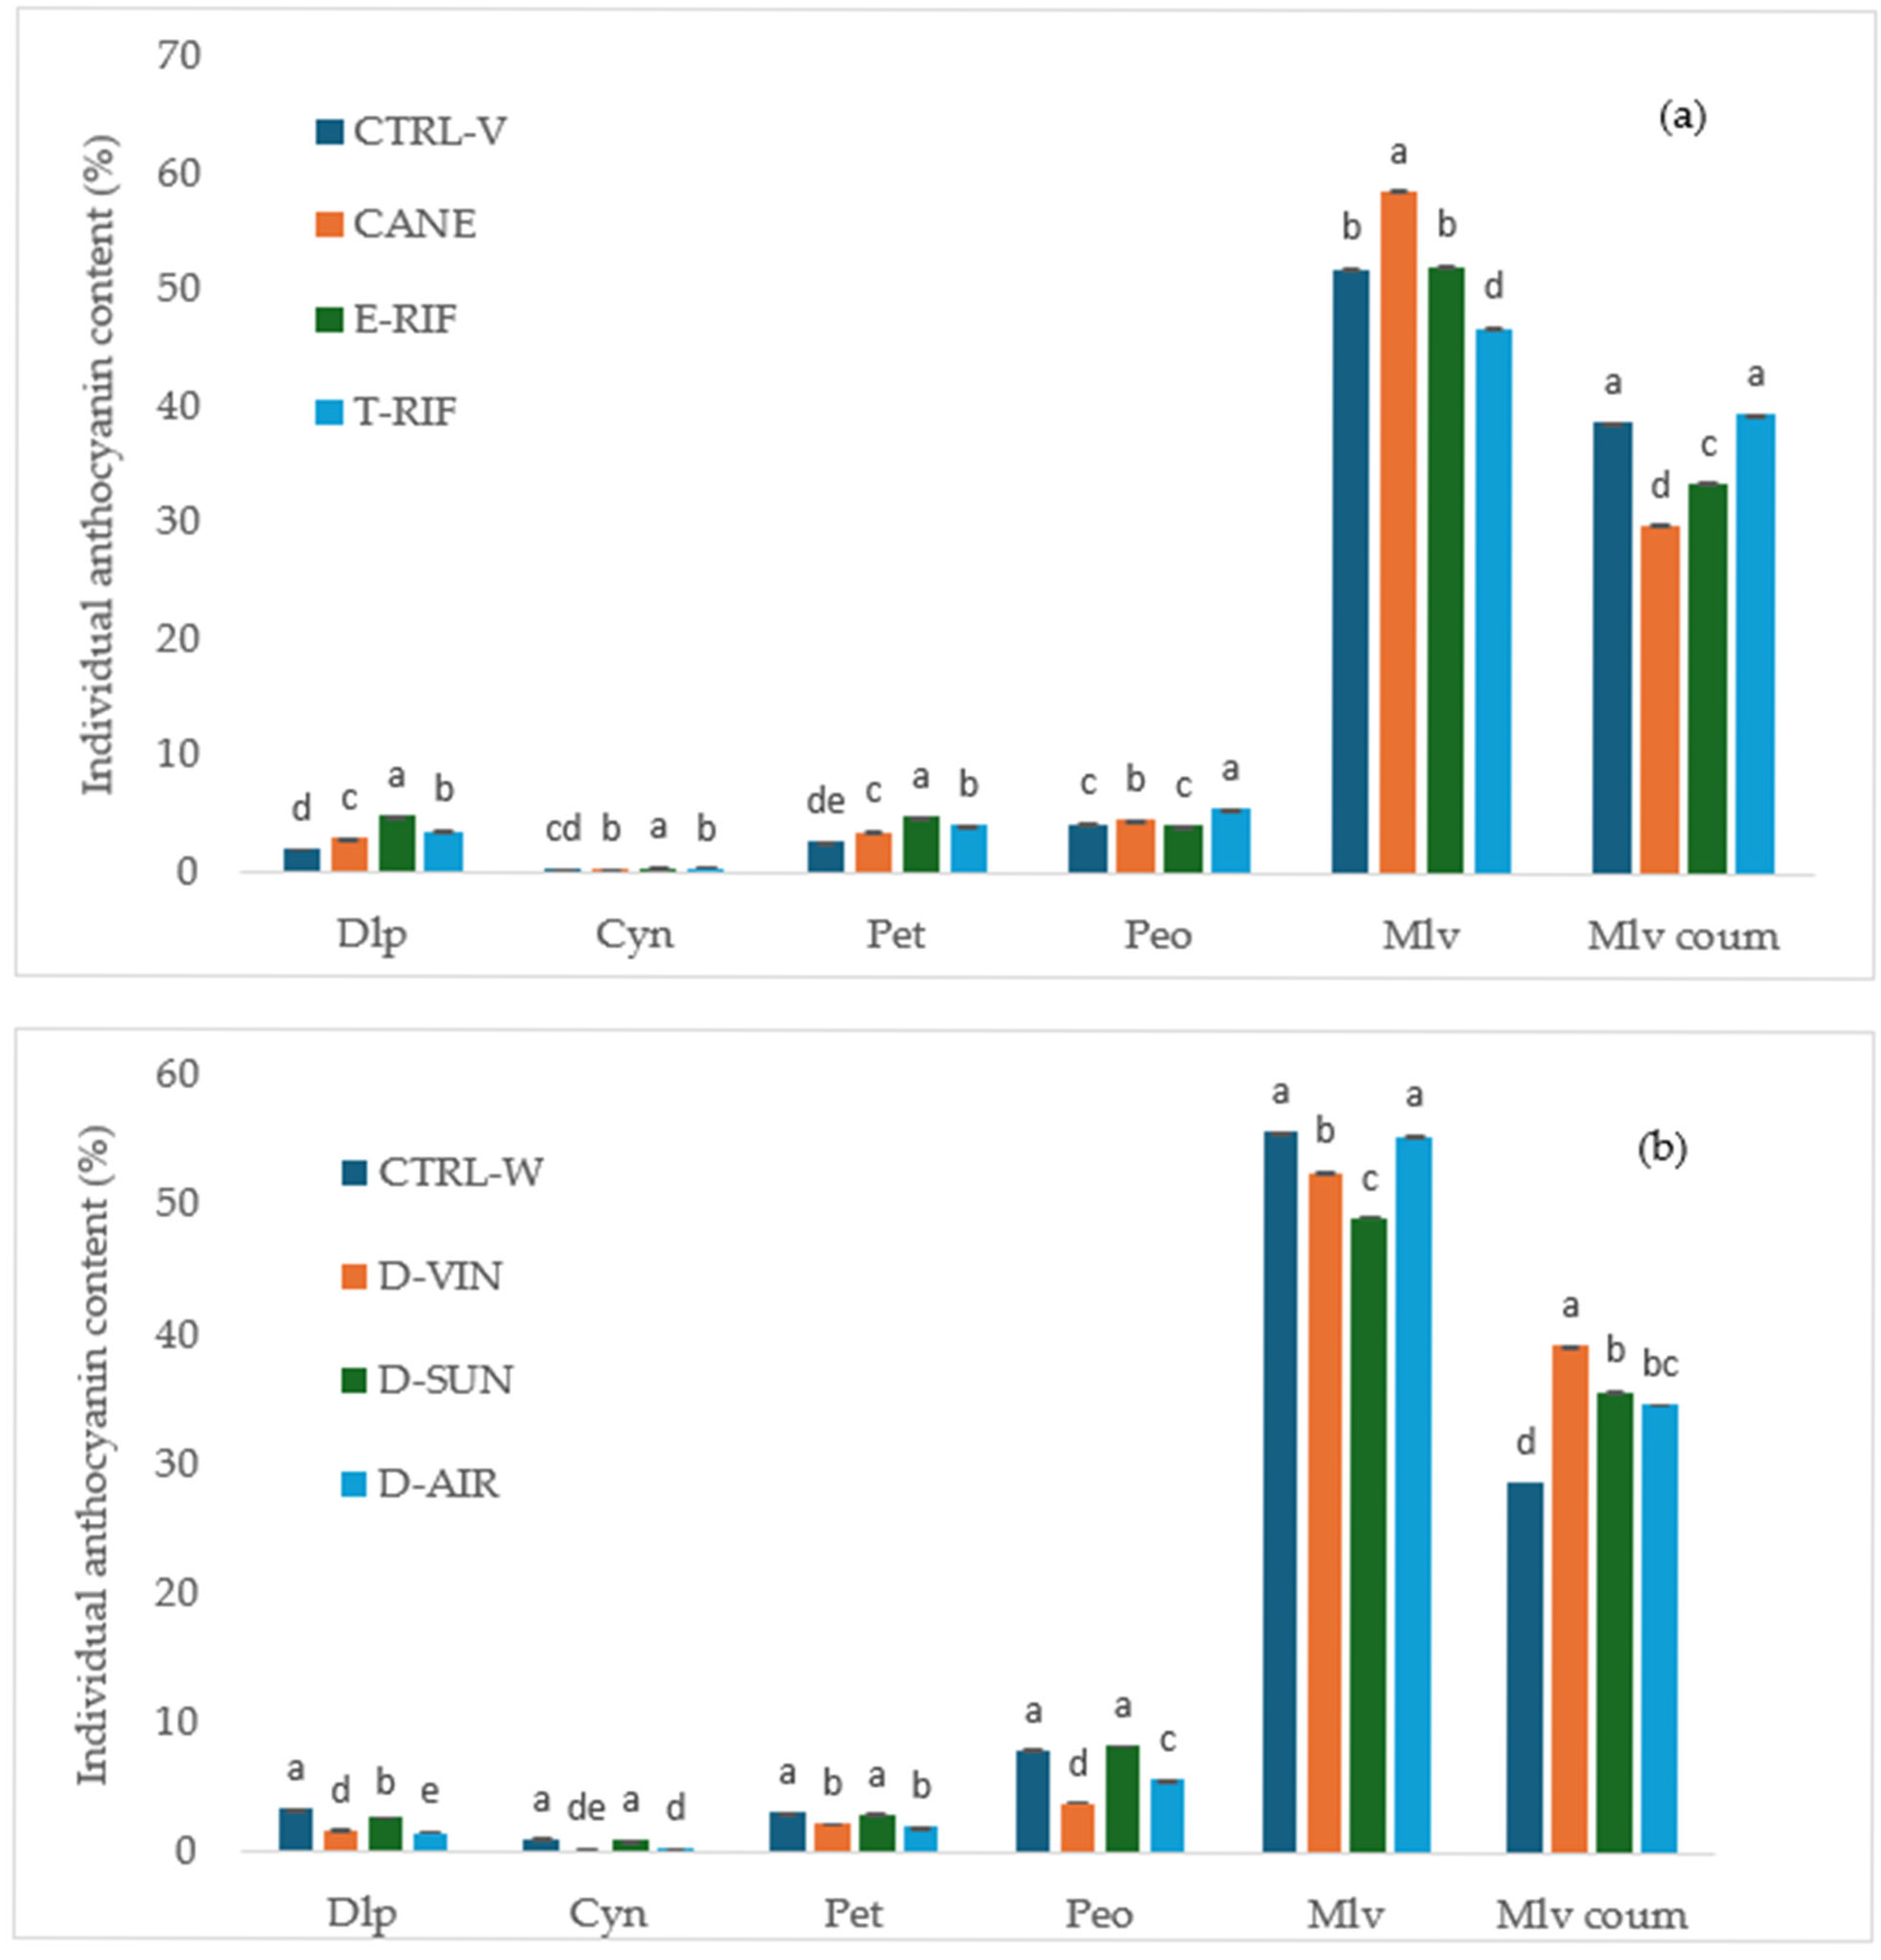
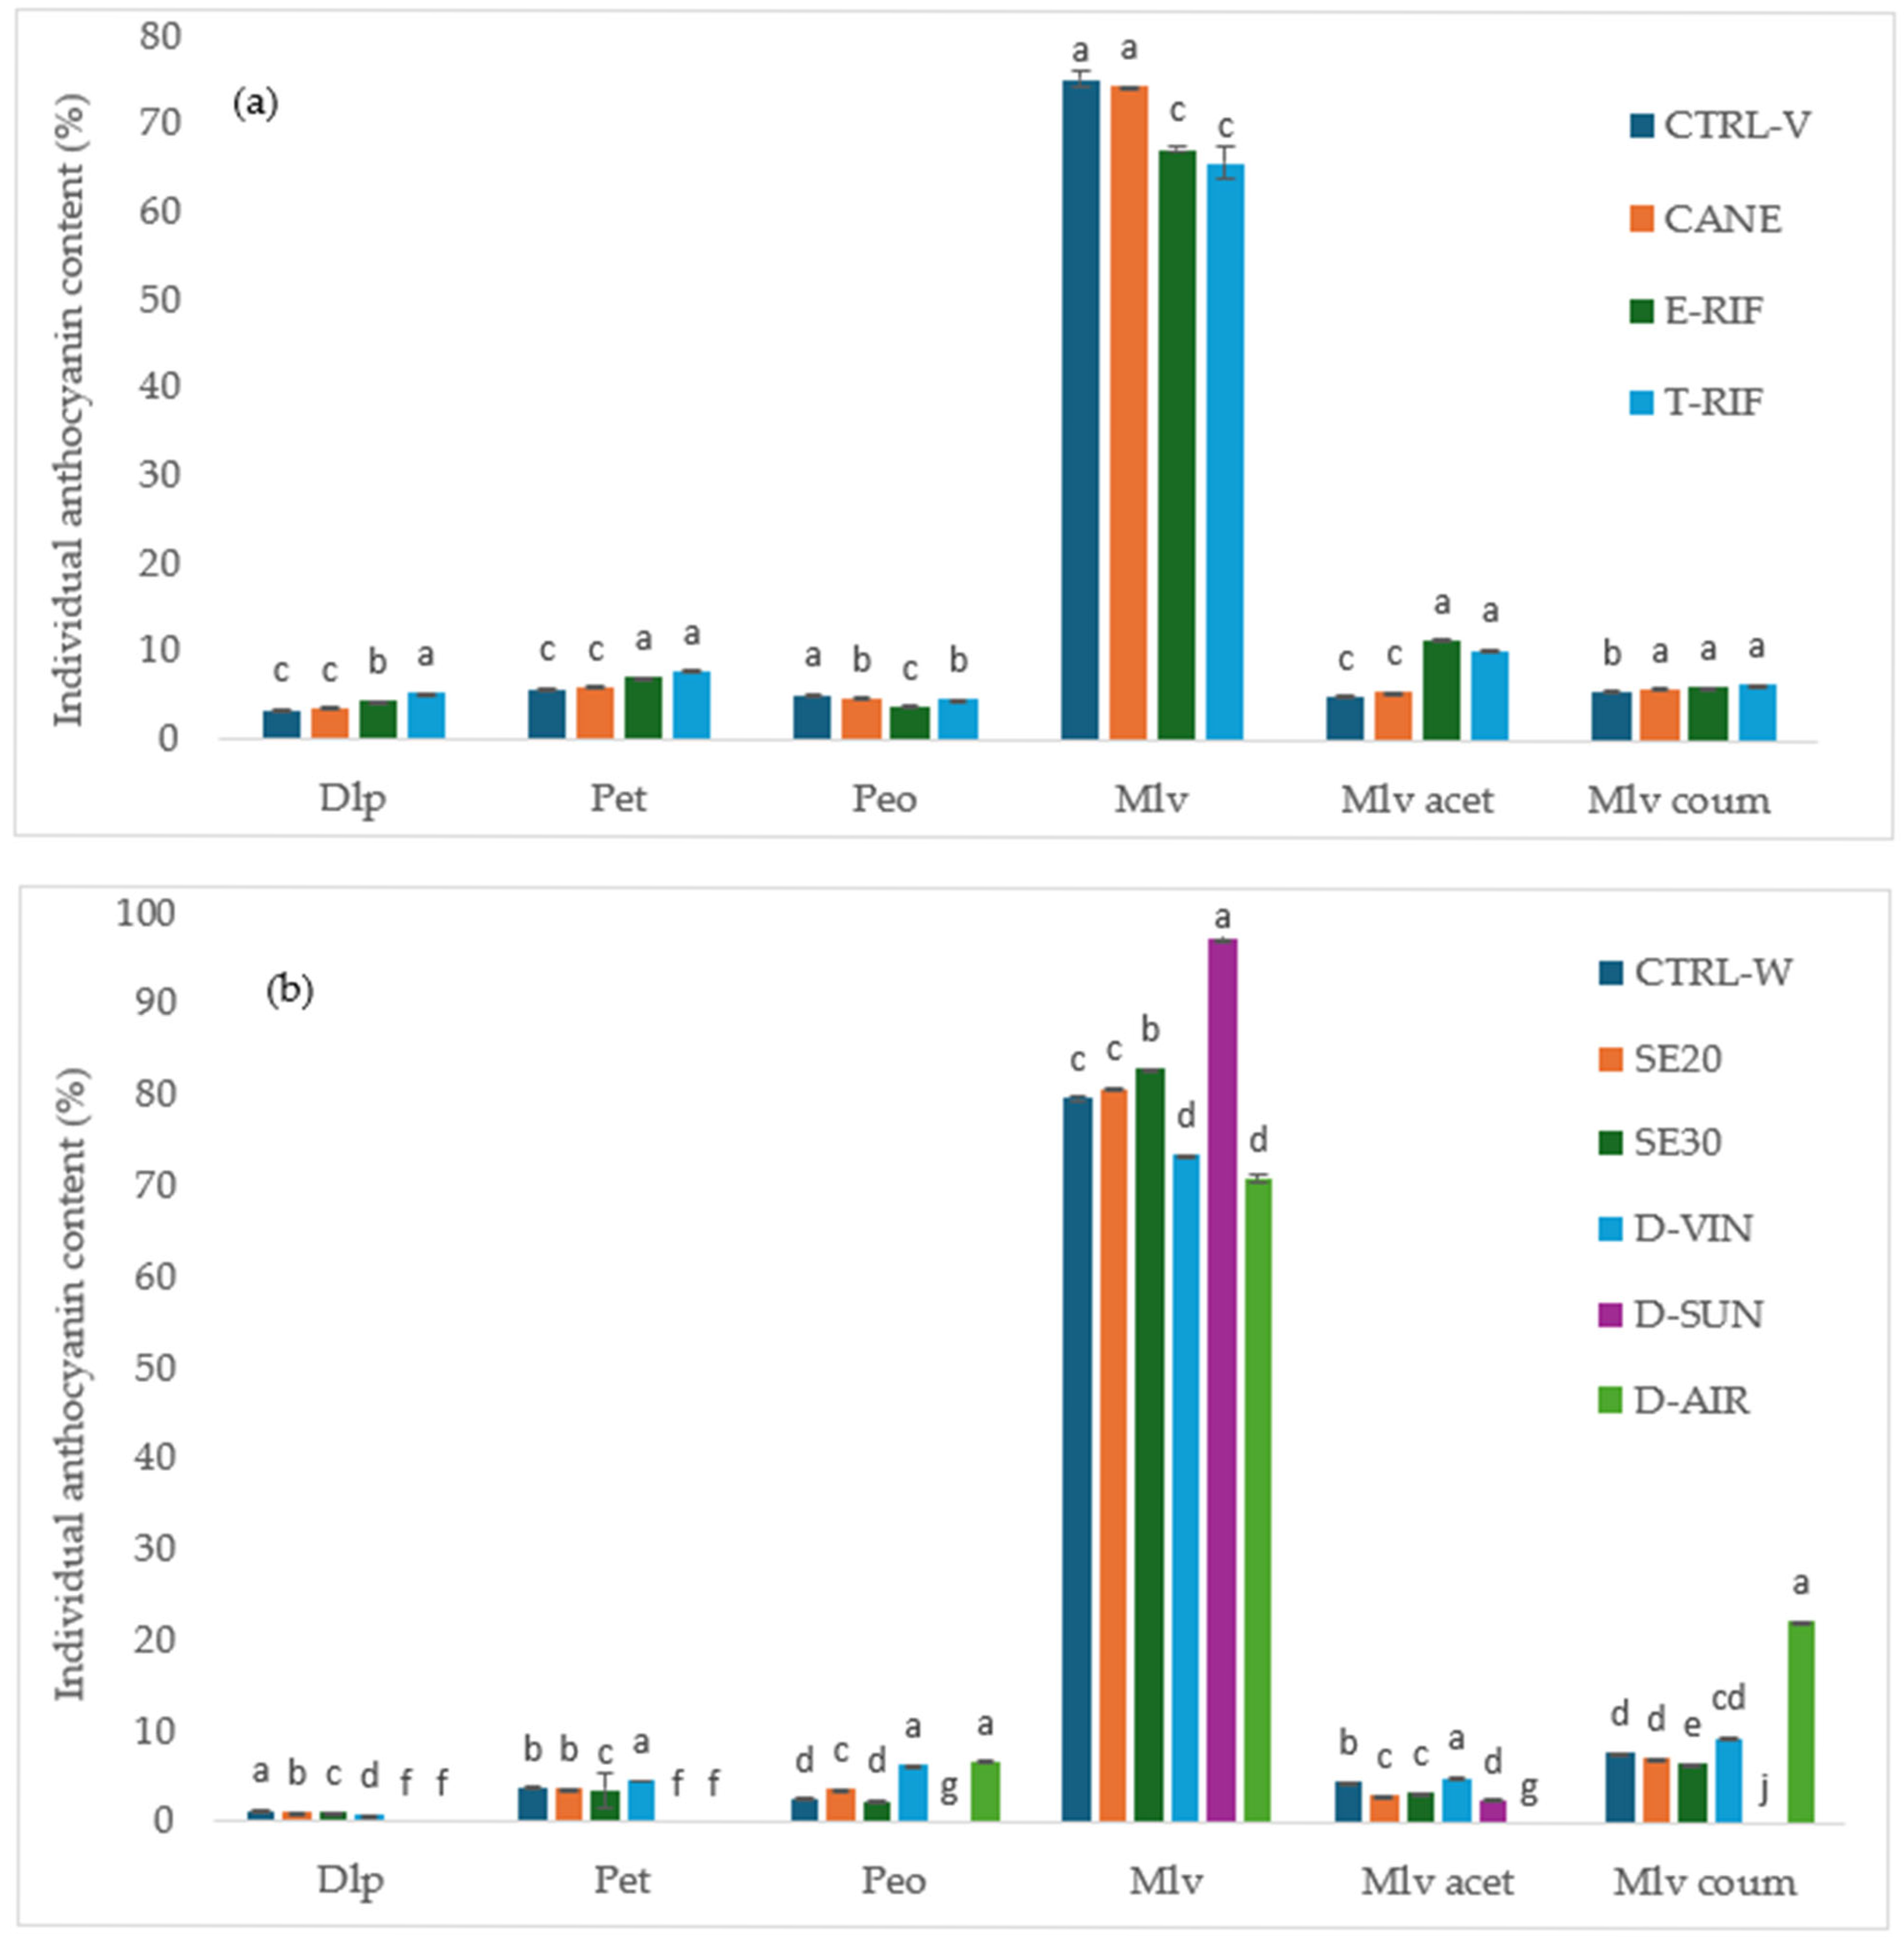
This study provides clear and quantifiable evidence that targeted vineyard interventions significantly impact grape and wine quality characteristics of the Mandilaria variety. Among these, total defoliation proved most effective, resulting in the highest anthocyanin content per berry (1.47 mg/berry), increased pigment concentration and superior wine color intensity (20.72 AU), alongside a lower hue value (5) indicative of a more vibrant red color. Long pruning enhanced the anthocyanin extractability (53.04%), facilitating more efficient pigment transfer during maceration. These interventions also influenced anthocyanin composition, favoring delphinidin, petunidin and malvidin derivatives, with the T-RIF treatments showing enriched malvidin acetates, known markers of phenolic maturity and stability. While pruning increased acidity without altering sugar levels—potentially supporting longer aging—defoliation improved sugar accumulation and lowered acidity, optimizing the balance for red wine production. Although the phenolic content and antioxidant activity changes in the grapes were modest, wines from treated vines—particularly under the T-RIF—exhibited significantly elevated levels, confirming that the combined effects of these viticultural practices substantially enhance wine composition, color vibrancy and aging potential.
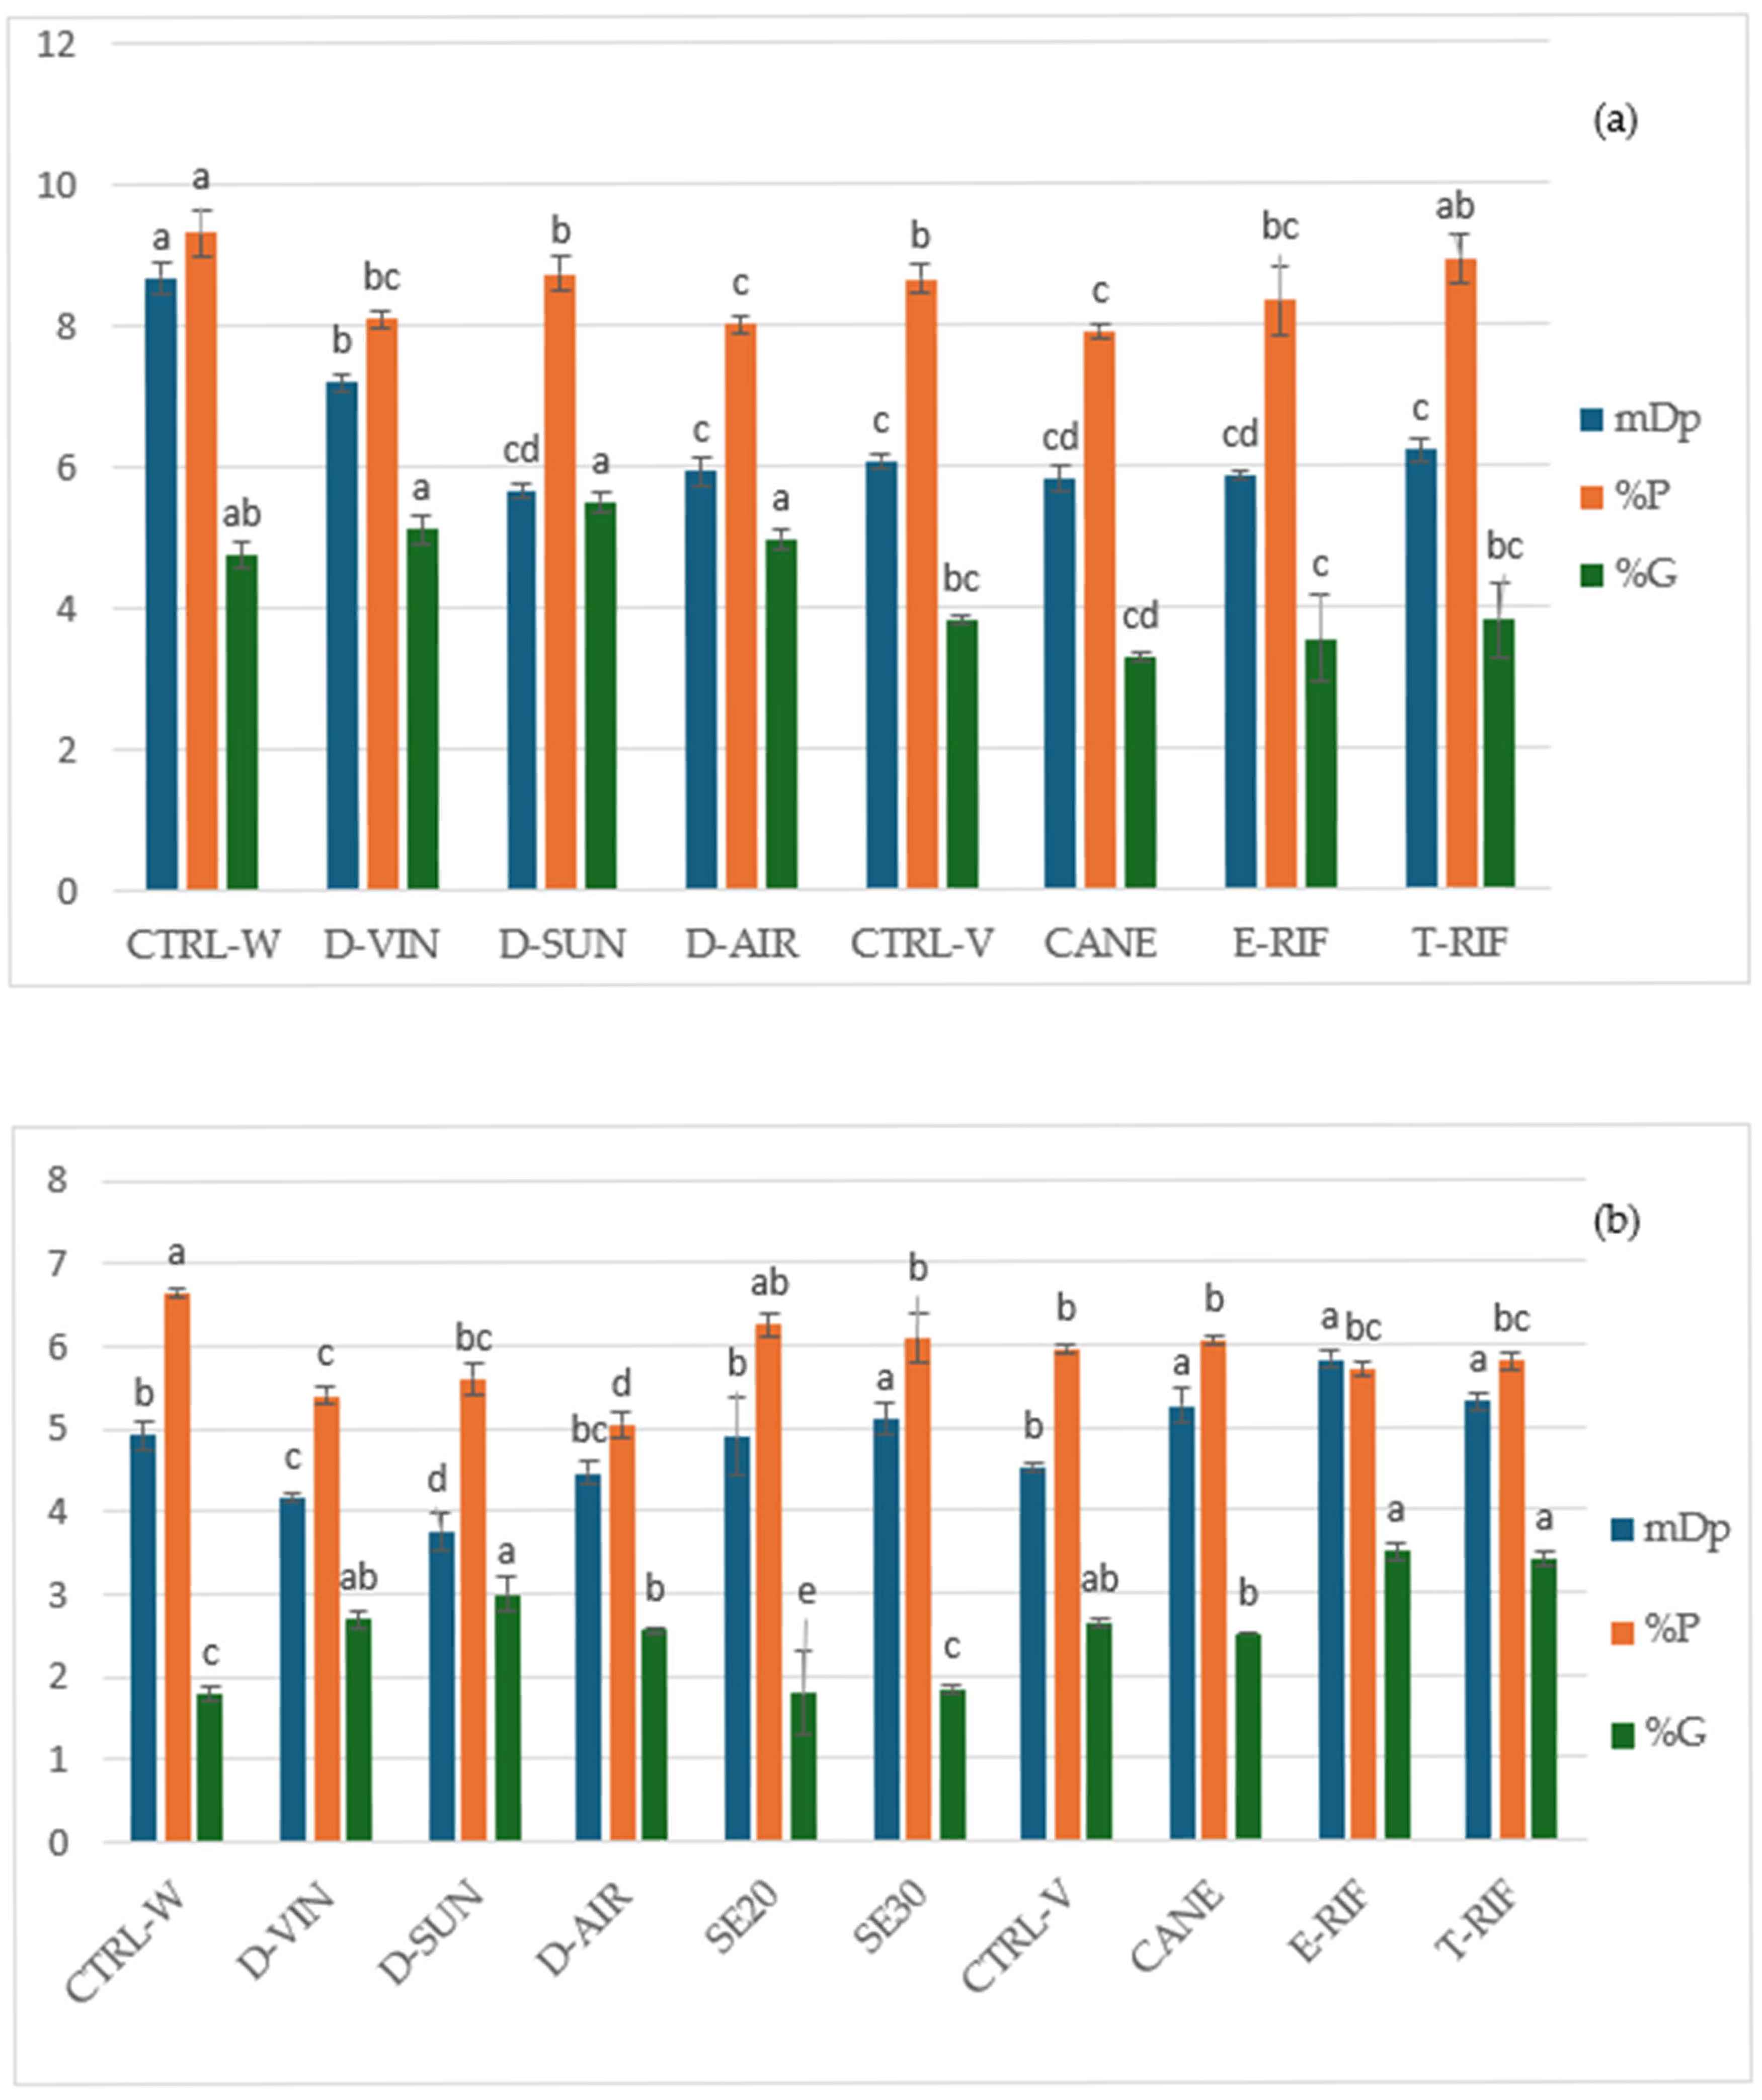
Complementing the vineyard results, the study also demonstrates that post-harvest winery techniques play a decisive role in shaping the phenolic and sensory profile of Mandilaria wines. Air dehydration emerged as particularly effective, yielding wines with elevated phenolic content, improved tannin structure and higher antioxidant activity, while simultaneously reducing the harsh tannin characteristics associated with the grape skins of the variety. Early seed removal during maceration reduced astringency without compromising wine structure, a result tied to a shift toward more polymerized skin-derived tannins (high mDp). In contrast, dehydration treatments exhibited lower mDp values, suggesting a disruption in polymerization processes. Although galloylation is typically associated with seed tannins, in the seed removal experiment no significant changes were observed, whereas all dehydration techniques led to an increase in the degree of galloylation. Prodelphinidin percentages (%P) remained stable with seed removal, as expected, but declined slightly with dehydration, potentially due to oxidative and enzymatic degradation.
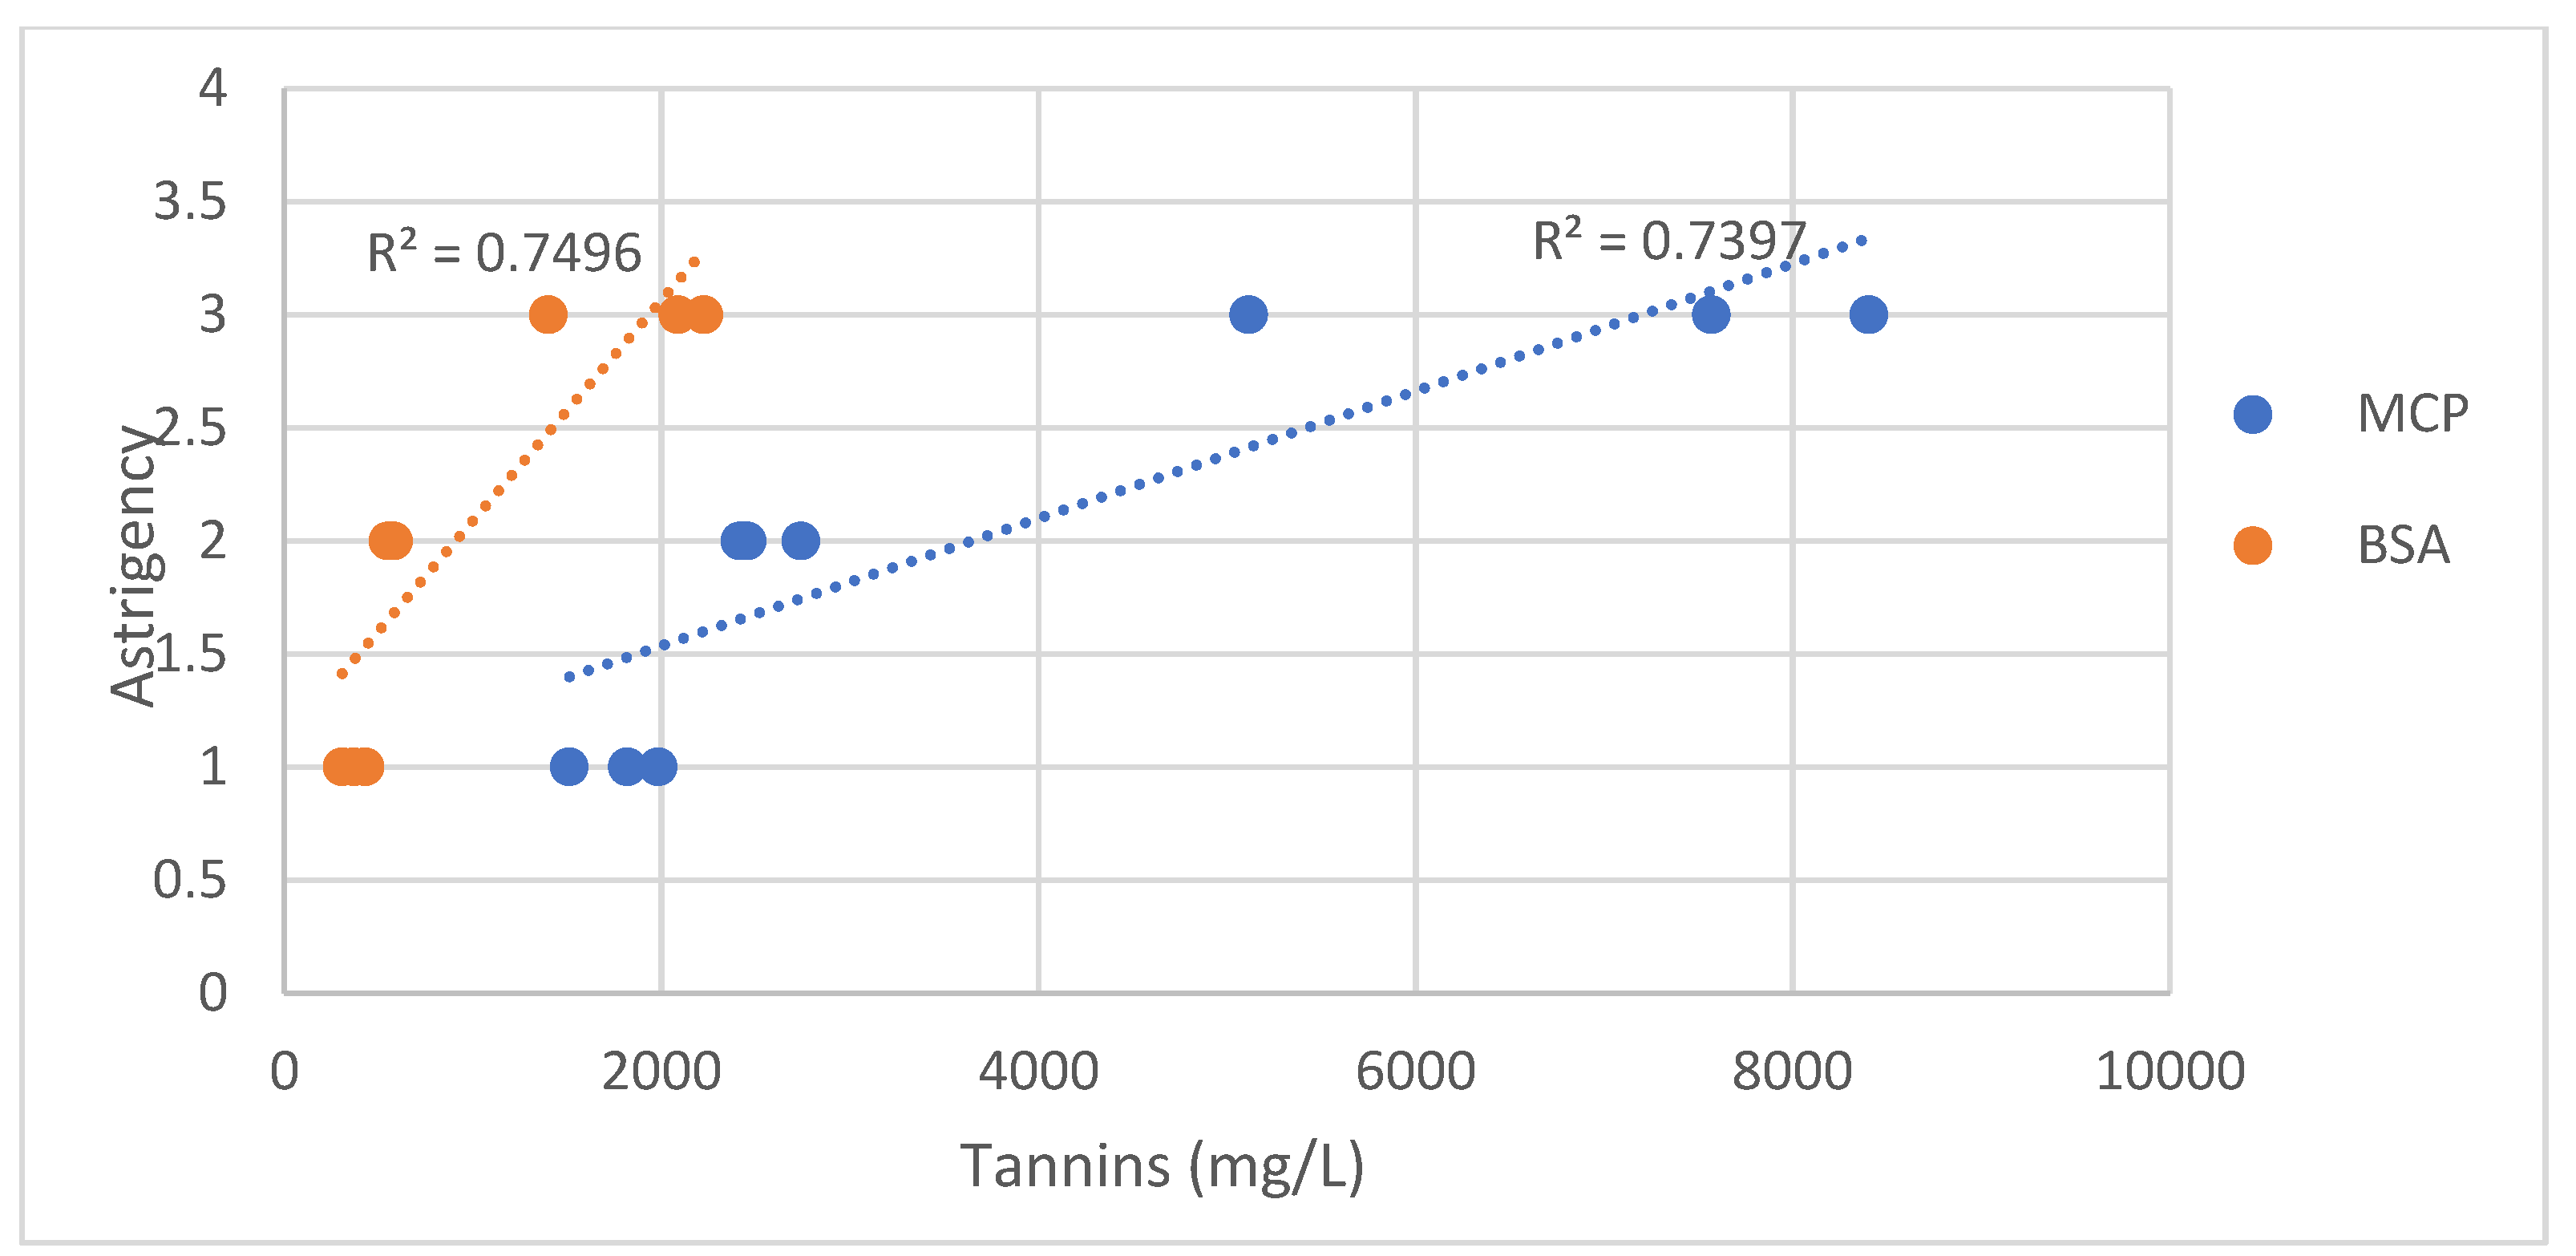
The findings of this study demonstrate that both vineyard interventions and post-harvest dehydration techniques applied to Mandilaria grapes led to an increase in perceived astringency, while seed removal significantly reduced it. Although dehydration intensified the astringent character, it simultaneously contributed to the concentration of sugars and the enhancement of certain structural and sensory attributes of the wines. Importantly, the results highlight that the sensory perception of astringency was influenced not merely by the total tannin concentration but also by the quality and origin of tannins, with the seed-derived tannins playing a critical role in harsher sensations. The modulation of phenolic composition, berry morphology and sugar levels, as well as their combined impact on the sensory perception of astringency, were key factors shaping the final wine profile. In Mandilaria, a traditionally highly tannic variety, the application of these strategies allows for a more precise management of astringency, supporting the production of wines with greater balance, refined tannic structure and enhanced consumer appeal. These results underline the potential of integrated vineyard and winemaking practices to optimize the sensory characteristics of Mandilaria and promote its repositioning as a premium Greek variety in the modern enological landscape.

Supplementary Materials

The following supporting information can be downloaded at: https://www.mdpi.com/article/10.3390/beverages11030076/s1, Figure S1: Questionnaire used for the sensory evaluation of the astringency;.

Author Contributions

Conceptualization, S.K. (Stefanos Koundouras) and S.K. (Stamatina Kallithraka); methodology, C.K., T.G., E.L., L.R. and N.T.; investigation, C.K., T.G., E.L., L.R. and N.T.; data curation, C.K., T.G., E.L. and S.K. (Stamatina Kallithraka); software, C.K., T.G. and S.K. (Stamatina Kallithraka); visualization, C.K., T.G. and S.K. (Stamatina Kallithraka); formal analysis, C.K., T.G., N.T., S.K. and S.K. (Stamatina Kallithraka); writing—original draft preparation, C.K., T.G. and S.K. (Stamatina Kallithraka); writing—review and editing, S.K. (Stefanos Koundouras) and S.K. (Stamatina Kallithraka); supervision, S.K. (Stefanos Koundouras) and S.K. (Stamatina Kallithraka); resources, S.K. (Stefanos Koundouras) and S.K. (Stamatina Kallithraka); funding acquisition, S.K. (Stefanos Koundouras) and S.K. (Stamatina Kallithraka); project administration, S.K. (Stefanos Koundouras) and S.K. (Stamatina Kallithraka) All authors have read and agreed to the published version of the manuscript.

Funding

Financial support was provided by the project entitled “Innovative innervations for improving the quality of PDO red wine of Paros” (MEASURE 16 COOPERATION, SUB-MEASURE 16.1–16.2 “ESTABLISHMENT AND OPERATION OF OPERATIONAL GROUPS OF THE EUROPEAN INNOVATION PARTNERSHIP FOR AGRICULTURAL PRODUCTIVITY AND SUSTAINABILITY”).

Institutional Review Board Statement

The sensory study was conducted in accordance with the guidelines of the Declaration of Helsinki. The study protocol was initially approved by the Ethics Committee of the Agricultural University of Athens (approval code: 60/20 September 2024). A similar protocol was subsequently approved under the following approval code: 22/30 March 2025.

Informed Consent Statement

Informed consent was obtained from all subjects involved in the study.

Data Availability Statement

The data presented in this study are available upon request from the corresponding author (pending privacy and ethical considerations).

Acknowledgments

The authors would like to thank the Pesticide Science Laboratory, School of Agriculture, Faculty of Agriculture Forestry and Natural Environment, Aristotle University of Thessaloniki, for providing access to the facilities of the unit.

Conflicts of Interest

The authors declare no conflicts of interest.

References

  1. Kalogiouri, N.P.; Karadimou, C.; Avgidou, M.S.; Petsa, E.; Papadakis, E.N.; Theocharis, S.; Mourtzinos, I.; Menkissoglu-Spiroudi, U.; Koundouras, S. An Optimized HPLC-DAD Methodology for the Determination of Anthocyanins in Grape Skins of Red Greek Winegrape Cultivars (Vitis Vinifera L.). Molecules 2022, 27, 7107. [Google Scholar] [CrossRef]
  2. Koufos, G.C.; Mavromatis, T.; Koundouras, S.; Jones, G.V. Adaptive Capacity of Winegrape Varieties Cultivated in Greece to Climate Change: Current Trends and Future Projections. Oeno One 2020, 54, 1201–1219. [Google Scholar] [CrossRef]
  3. Tello, J.; Galán, Á.; Rodríguez-Torres, I.; Martínez-Zapater, J.M.; Rubio Casanova, A.; Ibáñez, J. Genetic Fingerprinting Reveals How Traditional Farming Practices Aided to Preserve Ancient Table Grape Varieties in Almería (Southeastern Spain). Plants People Planet 2024, 6, 1453–1468. [Google Scholar] [CrossRef]
  4. Kallithraka, S.; Kim, D.; Tsakiris, A.; Paraskevopoulos, I.; Soleas, G. Sensory Assessment and Chemical Measurement of Astringency of Greek Wines: Correlations with Analytical Polyphenolic Composition. Food Chem. 2011, 126, 1953–1958. [Google Scholar] [CrossRef] [PubMed]
  5. Pérez-Navarro, J.; Izquierdo-Cañas, P.M.; Mena-Morales, A.; Martínez-Gascueña, J.; Chacón-Vozmediano, J.L.; García-Romero, E.; Gómez-Alonso, S.; Hermosín-Gutiérrez, I. First Chemical and Sensory Characterization of Moribel and Tinto Fragoso Wines Using HPLC-DAD-ESI-MS/MS, GC-MS, and Napping® Techniques: Comparison with Tempranillo. J. Sci. Food Agric. 2019, 99, 2108–2123. [Google Scholar] [CrossRef]
  6. Pavez, C.; González-Muñoz, B.; O’Brien, J.A.; Laurie, V.F.; Osorio, F.; Núñez, E.; Vega, R.E.; Bordeu, E.; Brossard, N. Red Wine Astringency: Correlations between Chemical and Sensory Features. LWT 2022, 154, 112656. [Google Scholar] [CrossRef]
  7. Flamini, R.; Mattivi, F.; De Rosso, M.; Arapitsas, P.; Bavaresco, L. Advanced Knowledge of Three Important Classes of Grape Phenolics: Anthocyanins, Stilbenes and Flavonols. Int. J. Mol. Sci. 2013, 14, 19651–19669. [Google Scholar] [CrossRef] [PubMed]
  8. Monagas, M.; Gómez-Cordovés, C.; Bartolomé, B.; Laureano, O.; Ricardo Da Silva, J.M. Monomeric, Oligomeric, and Polymeric Flavan-3-Ol Composition of Wines and Grapes from Vitis Vinifera L. Cv. Graciano, Tempranillo, and Cabernet Sauvignon. J. Agric. Food Chem. 2003, 51, 6475–6481. [Google Scholar] [CrossRef]
  9. Lorrain, B.; Ky, I.; Pechamat, L.; Teissedre, P.L. Evolution of Analysis of Polyhenols from Grapes, Wines, and Extracts. Molecules 2013, 18, 1076–1100. [Google Scholar] [CrossRef]
  10. Yacco, R.S.; Watrelot, A.A.; Kennedy, J.A. Red Wine Tannin Structure-Activity Relationships during Fermentation and Maceration. J. Agric. Food Chem. 2016, 64, 860–869. [Google Scholar] [CrossRef]
  11. Schwarz, B.; Hofmann, T. Is There a Direct Relationship between Oral Astringency and Human Salivary Protein Binding? Eur. Food Res. Technol. 2008, 227, 1693–1698. [Google Scholar] [CrossRef]
  12. Kennedy, J.A. Grape and Wine Phenolics: Observations and Recent Findings. Cienc. E Investig. Agrar. 2008, 35, 77–90. [Google Scholar] [CrossRef]
  13. McRae, J.M.; Kennedy, J.A. Wine and Grape Tannin Interactions with Salivary Proteins and Their Impact on Astringency: A Review of Current Research. Molecules 2011, 16, 2348–2364. [Google Scholar] [CrossRef] [PubMed]
  14. González-Muñoz, B.; Garrido-Vargas, F.; Pavez, C.; Osorio, F.; Chen, J.; Bordeu, E.; O’Brien, J.A.; Brossard, N. Wine Astringency: More than Just Tannin–Protein Interactions. J. Sci. Food Agric. 2022, 102, 1771–1781. [Google Scholar] [CrossRef]
  15. Nel, A.P. Tannins and Anthocyanins: From Their Origin to Wine Analysis—A Review. S. Afr. J. Enol. Vitic. 2018, 39, 1–20. [Google Scholar] [CrossRef]
  16. Huang, R.; Xu, C. An Overview of the Perception and Mitigation of Astringency Associated with Phenolic Compounds. Compr. Rev. Food Sci. Food Saf. 2021, 20, 1036–1074. [Google Scholar] [CrossRef] [PubMed]
  17. Alatzas, A.; Theocharis, S.; Miliordos, D.E.; Kotseridis, Y.; Koundouras, S.; Hatzopoulos, P. Leaf Removal and Deficit Irrigation Have Diverse Outcomes on Composition and Gene Expression during Berry Development of Vitis Vinifera L. Cultivar Xinomavro. Oeno One 2023, 57, 289–305. [Google Scholar] [CrossRef]
  18. Kyraleou, M.; Kallithraka, S.; Koundouras, S.; Chira, K.; Haroutounian, S.; Spinthiropoulou, H.; Kotseridis, Y. Effect of Vine Training System on the Phenolic Composition of Red Grapes (Vitis Vinifera L. Cv. Xinomavro). J. Int. Sci. Vigne Du Vin. 2015, 49, 71–84. [Google Scholar] [CrossRef]
  19. Martin, D.; Grose, C.; Fedrizzi, B.; Stuart, L.; Albright, A.; McLachlan, A. Grape Cluster Microclimate Influences the Aroma Composition of Sauvignon Blanc Wine. Food Chem. 2016, 210, 640–647. [Google Scholar] [CrossRef]
  20. Amores-Arrocha, A.; Sancho-Galán, P.; Jiménez-Cantizano, A.; Palacios, V. Bee Pollen as Oenological Tool to Carry out Red Winemaking in Warm Climate Conditions. Agronomy 2020, 10, 634. [Google Scholar] [CrossRef]
  21. Sancho-Galán, P.; Amores-Arrocha, A.; Palacios, V.; Jiménez-Cantizano, A. Effect of Grape Over-Ripening and Its Skin Presence on White Wine Alcoholic Fermentation in a Warm Climate Zone. Foods 2021, 10, 1583. [Google Scholar] [CrossRef] [PubMed]
  22. Panceri, C.P.; De Gois, J.S.; Borges, D.L.G.; Bordignon-Luiz, M.T. Effect of Grape Dehydration under Controlled Conditions on Chemical Composition and Sensory Characteristics of Cabernet Sauvignon and Merlot Wines. LWT 2015, 63, 228–235. [Google Scholar] [CrossRef]
  23. Scalzini, G.; Vernhet, A.; Carillo, S.; Roi, S.; Véran, F.; Jørgensen, B.; Hansen, J.; Giacosa, S.; Segade, S.R.; Paissoni, M.A.; et al. Cell Wall Polysaccharides, Phenolic Extractability and Mechanical Properties of Aleatico Winegrapes Dehydrated under Sun or in Controlled Conditions. Food Hydrocoll. 2024, 149, 109605. [Google Scholar] [CrossRef]
  24. Figueiredo-González, M.; Cancho-Grande, B.; Simal-Gándara, J. Effects on Colour and Phenolic Composition of Sugar Concentration Processes in Dried-on- or Dried-off-Vine Grapes and Their Aged or Not Natural Sweet Wines. Trends Food Sci. Technol. 2013, 31, 36–54. [Google Scholar] [CrossRef]
  25. Wang, Y.; He, L.; Pan, Q.; Duan, C.; Wang, J. Effects of Basal Defoliation on Wine Aromas: A Meta-Analysis. Molecules 2018, 23, 779. [Google Scholar] [CrossRef] [PubMed]
  26. OIV. Compendium of International Methods of Wine and Must Analysis International Organisation of Vine and Wine; OIV: Paris, France, 2021; ISBN 9782850380334. [Google Scholar]
  27. Lorrain, B.; Chira, K.; Teissedre, P.L. Phenolic Composition of Merlot and Cabernet-Sauvignon Grapes from Bordeaux Vineyard for the 2009-Vintage: Comparison to 2006, 2007 and 2008 Vintages. Food Chem. 2011, 126, 1991–1999. [Google Scholar] [CrossRef]
  28. Chira, K.; Pacella, N.; Jourdes, M.; Teissedre, P.L. Chemical and Sensory Evaluation of Bordeaux Wines (Cabernet-Sauvignon and Merlot) and Correlation with Wine Age. Food Chem. 2011, 126, 1971–1977. [Google Scholar] [CrossRef]
  29. Glories, Y. Il Colore Del Vino Rosso I Parte. Connaiss. Vigne Vin. 1984, 18, 195–217. [Google Scholar]
  30. Arnous, A.; Makris, D.P.; Kefalas, P. Effect of Principal Polyphenolic Components in Relation to Antioxidant Characteristics of Aged Red Wines. J. Agric. Food Chem. 2001, 49, 5736–5742. [Google Scholar] [CrossRef]
  31. Singleton, V.L.; Orthofer, R.; Lamuela-Raventos, R.M. Analysis of Total Phenols and Other Oxidation Substrates and Antioxidants by Means of Folin–Ciocalteu Reagent. Methods Enzymol. 1999, 299, 152–178. [Google Scholar]
  32. Iland, P.G.; Cynkar, W.; Francis, I.L.; Williams, P.J.; Coombe, B.C. Optimisation of Methods for the Determination of Total and Red-Free Glycosyl Glucose in Black Grape Berries of Vitis Vinifera. Aust. J. Grape Wine Res. 1996, 2, 171–178. [Google Scholar] [CrossRef]
  33. Karadimou, C.; Petsa, E.; Ouroumi, N.A.; Papadakis, E.N.; Kontoudakis, N.; Theocharis, S.; Mourtzinos, I.; Menkissoglu-Spiroudi, U.; Kalogiouri, N.P.; Koundouras, S. Exploration of the Anthocyanin and Proanthocyanidin Profile of Greek Red Grape Skins Belonging to Vradiano, Limnio, and Kotsifali Cultivars, Analyzed by a Novel LC-QTOF-MS/MS Method. Phytochem. Anal. 2024, 35, 1781–1793. [Google Scholar] [CrossRef]
  34. Harbertson, J.F.; Picciotto, E.A.; Adams, D.O. Measurement of Polymeric Pigments in Grape Berry Extract Sand Wines Using a Protein Precipitation Assay Combined with Bisulfite Bleaching. Am. J. Enol. Vitic. 2003, 54, 301–306. [Google Scholar] [CrossRef]
  35. Sarneckis, C.J.; Dambergs, R.G.; Jones, P.; Mercurio, M.; Herderich, M.J.; Smith, P.A. Quantification of Condensed Tannins by Precipitation with Methyl Cellulose: Development and Validation of an Optimised Tool for Grape and Wine Analysis. Aust. J. Grape Wine Res. 2006, 12, 39–49. [Google Scholar] [CrossRef]
  36. Kennedy, J.A.; Jones, G.P. Analysis of Proanthocyanidin Cleavage Products Following Acid-Catalysis in the Presence of Excess Phloroglucinol. J. Agric. Food Chem. 2001, 49, 1740–1746. [Google Scholar] [CrossRef] [PubMed]
  37. Chira, K.; Schmauch, G.; Saucier, C.; Fabre, S.; Teissedre, P.L. Grape Variety Effect on Proanthocyanidin Composition and Sensory Perception of Skin and Seed Tannin Extracts from Bordeaux Wine Grapes (Cabernet Sauvignon and Merlot) for Two Consecutive Vintages (2006 and 2007). J. Agric. Food Chem. 2009, 57, 545–553. [Google Scholar] [CrossRef]
  38. Kyraleou, M.; Kallithraka, S.; Theodorou, N.; Teissedre, P.L.; Kotseridis, Y.; Koundouras, S. Changes in Tannin Composition of Syrah Grape Skins and Seeds during Fruit Ripening under Contrasting Water Conditions. Molecules 2017, 22, 1453. [Google Scholar] [CrossRef]
  39. Orbanić, F.; Rossi, S.; Bestulić, E.; Budić-Leto, I.; Kovačević Ganić, K.; Horvat, I.; Plavša, T.; Bubola, M.; Lukić, I.; Jeromel, A.; et al. Applying Different Vinification Techniques in Teran Red Wine Production: Impact on Bioactive Compounds and Sensory Attributes. Foods 2023, 12, 3838. [Google Scholar] [CrossRef]
  40. Pavić, V.; Kujundžić, T.; Kopić, M.; Jukić, V.; Braun, U.; Schwander, F.; Drenjančević, M. Effects of Defoliation on Phenolic Concentrations, Antioxidant and Antibacterial Activity of Grape Skin Extracts of the Varieties Blaufränkisch and Merlot (Vitis Vinifera L.). Molecules 2019, 24, 2444. [Google Scholar] [CrossRef]
  41. Xi, C.; Zhang, J.; Zhang, F.; Liu, D.; Cheng, W.; Gao, F.; Wang, P. Effect of Postharvest Grape Dehydration on Chemical Composition, Antioxidant Activity and Sensory Characeteristics of Marselan Wines. Food Chem. X 2024, 22, 101503. [Google Scholar] [CrossRef]
  42. Jagatić Korenika, A.M.; Kozina, B.; Preiner, D.; Tomaz, I.; Volarević, J.; Jeromel, A. The Effect of Seed Removal and Extraction Time on the Phenolic Profile of Plavac Mali Wine. Appl. Sci. 2023, 13, 5411. [Google Scholar] [CrossRef]
  43. Mucalo, A.; Budić-Leto, I.; Lukšić, K.; Maletić, E.; Zdunić, G. Early Defoliation Techniques Enhance Yield Components, Grape and Wine Composition of Cv. Trnjak (Vitis Vinifera L.) in Dalmatian Hinterland Wine Region. Plants 2021, 10, 551. [Google Scholar] [CrossRef]
  44. Zheng, W.; Alim, A.; Bai, Y.; Feng, Z.; Zhang, J.; Xia, N.; Ding, Z. Effect of Postharvest Dehydration on the Microstructure and Anthocyanin Content of Grapes. Hortic. Environ. Biotechnol. 2021, 62, 423–434. [Google Scholar] [CrossRef]
  45. Vignault, A.; Pascual, O.; Jourdes, M.; Moine, V.; Fermaud, M.; Roudet, J.; Canals, J.M.; Teissedre, P.L.; Zamora, F. Impact of Enological Tannins on Laccase Activity. Oeno One 2019, 53, 27–38. [Google Scholar] [CrossRef]
  46. Modesti, M.; Macaluso, M.; Taglieri, I.; Bellincontro, A.; Sanmartin, C. Ozone and Bioactive Compounds in Grapes and Wine. Foods 2021, 10, 2934. [Google Scholar] [CrossRef]
  47. Río Segade, S.; Bautista-Ortín, A.B.; Paissoni, M.A.; Giacosa, S.; Gerbi, V.; Rolle, L.; Gómez-Plaza, E. Changes in Skin Flavanol Composition as a Response to Ozone-Induced Stress during Postharvest Dehydration of Red Wine Grapes with Different Phenolic Profiles. J. Agric. Food Chem. 2020, 68, 13439–13449. [Google Scholar] [CrossRef]
Figure 1. Sugar (a) and weight evolution (b) during the dehydration experiment.
Beverages 11 00076 g001
Figure 2. Color parameters of wines: (a) intensity (AU) and (b) hue. CTRL-V: control of vineyard treatments; CANE: long pruning; E-RIF: partial defoliation; T-RIF: complete defoliation; CTRL-W: control of winery treatments; SE20: removal 20% of the seeds; SE30: removal 30% of the seeds; D-VIN: extended ripening on the vine; D-SUN: sun-drying; D-AIR: dehydration in a closed room with shaded air circulation. The data are presented as the mean value ± standard deviation. Statistically significant differences among the practices are marked with different letters (Tukey’s test, p < 0.05).
Beverages 11 00076 g002
Figure 3. Distribution of the individual anthocyanins in grape skins, presented as a percentage of total anthocyanin concentration, for Mandilaria grapes under vineyard (a) and winery (b) treatments. Dlp: delphinidin-3-O-glucoside; Cyn: cyanidin-3-O-glucoside; Peo: peonidin-3-O-glucoside; Pet: petunidin-3-O-glucoside; Mlv: malvidin-3-O-glucoside; Mlv acet: malvidin-3-O-(6-acetyl) glucoside; Mlv coum: malvidin 3-O-(6-p-coumaroyl) glucoside; CTRL-V: control of vineyard treatments; CANE: long pruning; E-RIF: partial defoliation; T-RIF: complete defoliation; CTRL-W: control of winery treatments; D-VIN: extended ripening on the vine; D-SUN: sun-drying; D-AIR: dehydration in a closed room with shaded air circulation. The data are presented as the mean value ± standard deviation. Statistically significant differences between the practices are marked with different letters (Tukey’s test, p < 0.05).
Beverages 11 00076 g003
Figure 4. Distribution of the individual anthocyanins, presented as a percentage of the total anthocyanin concentration for Mandilaria wines under the vineyard (a) and winery (b) treatments. Dlp: delphinidin-3-O-glucoside; Cyn: cyanidin-3-O-glucoside; Peo: peonidin-3-O-glucoside; Pet: petunidin-3-O-glucoside; Mlv: malvidin-3-O-glucoside; Mlv acet: malvidin-3-O-(6-acetyl)glucoside; Mlv coum: malvidin 3-O-(6-p-coumaroyl) glucoside; CTRL-V: control of vineyard treatments; CANE: long pruning; E-RIF: partial defoliation; T-RIF: complete defoliation; CTRL-W: control of winery treatments; SE20: removal 20% of the seeds; SE30: removal 30% of the seeds; D-VIN: extended ripening on the vine; D-SUN: sun-drying; D-AIR: dehydration in a closed room with shaded air circulation. The data are presented as the mean value ± standard deviation. Statistically significant differences among the practices are marked with different letters (Tukey’s test, p < 0.05).
Beverages 11 00076 g004
Figure 5. Correlation between the sensory astringency and tannin content calculated using both the MCP and BSA methods. Tannins measured with the MCP and BSA methods are expressed as (mg/L catechin equivalents).
Beverages 11 00076 g005
Figure 6. Mean degree of polymerization (mDp), percentage of prodelphinidins (%P) and galloylation (%G) in Mandilaria grapes (a) and wines (b) under vineyard and winery treatments. CTRL-V: control of vineyard treatments; CANE: long pruning; E-RIF: partial defoliation; T-RIF: complete defoliation; CTRL-W: control of winery treatments; SE20: removal 20% of the seeds; SE30: removal 30% of the seeds; D-VIN: extended ripening on the vine; D-SUN: sun-drying; D-AIR: dehydration in a closed room with shaded air circulation. The data are presented as the mean value ± standard deviation. Statistically significant differences among the practices are marked with different letters (Tukey’s test, p < 0.05).
Beverages 11 00076 g006
Table 1. Grape parameters affected by the viticultural practices.
*Bunch Length (cm)Bunch Width (cm)Peduncle Length (cm)Weight of 50 Grapes (g)% Skins/Berry% Seeds/Berry% Flesh/BerrySkin/FleshHarvest Day
CTRL-V16.8 ± 0.2 c10.4 ± 0.3 b1.4 ± 0.0 c109.8 ± 0.7 b4.6 ± 0.1 c4.1 ± 0.2 b91.2 ± 0.8 a0.051 ± 0.0 c16/9/23
CANE21.3 ± 0.6 a10.2 ± 0.2 b3.1 ± 0.2 a75.7 ± 0.3 c5.9 ± 0.4 b5.9 ± 0.4 a88.3 ± 0.6 b0.066 ± 0.0 b16/9/23
E-RIF16.5 ± 0.5 c9.3 ± 0.2 b2.7 ± 0.3 b127.7 ± 0.6 a7.1 ± 0.5 a4.3 ± 0.4 b88.6 ± 0.6 b0.080 ± 0.1 a16/9/23
T-RIF19.1 ± 0.3 b12.7 ± 0.5 a2.1 ± 0.4 b114.3 ± 0.5 b6.9 ± 0.3 a4.4 ± 0.5 b88.7 ± 0.5 b0.077 ± 0.1 a16/9/23
* CTRL-V: control of vineyard treatments; CANE: long pruning; E-RIF: partial defoliation; T-RIF: complete defoliation. The data are presented as the mean value ± standard deviation. Statistically significant differences among the practices are marked with different letters (Tukey’s test, p < 0.05).
Table 2. Chemical composition of grapes under different viticultural practices.
*BrixpHTotal Acidity (g Tartaric Acid/L)
CTRL-V17.8 ± 0.4 b3.32 ± 0.1 b5.0 ± 0.6 b
CANE17.4 ± 0.5 b3.21 ± 0.3 b6.4 ± 0.4 a
E-RIF19.0 ± 0.5 a3.50 ± 0.3 a3.5 ± 0.3 c
T-RIF19.4 ± 0.2 a3.47 ± 0.2 a4.0 ± 0.3 c
* CTRL-V: control of vineyard treatments; CANE: long pruning; E-RIF: partial defoliation; T-RIF: complete defoliation. The data are presented as the mean value ± standard deviation. Statistically significant differences among the practices are marked with different letters (Tukey’s test, p < 0.05).
Table 3. Parameters of the dehydrated grapes.
*BrixpHTotal Acidity (g Tartaric Acid/L)Weight of 50 Grapes (g)Dehydration %% Skins/Berry% Seeds/Berry% Flesh/BerrySkin/FleshHarvest Day
CTRL-W18.8 ± 0.3 d3.86 ± 0.0 a2.6 ± 0.2 f114.2 ± 0.4 a-7.6 ± 0.2 de3.7 ± 0.2 d88.7 ± 0.7 a0.085 ± 0.1 c22/9/23
D-VIN24.4 ± 0.5 c3.53 ± 0.0 c4.9 ± 0.3 c65.8 ± 0.5 c42.387.1 ± 0.5 de5.3 ± 0.2 c87.6 ± 0.4 a0.081 ± 0.0 c9/10/23
D-SUN27.6 ± 0.6 a3.71 ± 0.1 b5.7 ± 0.2 bc43.5 ± 0.4 e61.9119.6 ± 0.3 a7.8 ± 0.6 a72.6 ± 0.2 d0.270 ± 0.1 a5/10/23
D-AIR23.5 ± 0.5 c3.25 ± 0.0 d7.8 ± 0.4 a48.8 ± 0.3 e57.2710.7 ± 0.7 c6.3 ± 0.4 b83.0 ± 0.5 b0.129 ± 0.3 b17/10/23
* CTRL-W: control of winery treatments; D-VIN: extended ripening on the vine; D-SUN: sun-drying; D-AIR: dehydration in a closed room with shaded air circulation. The data are presented as the mean value ± standard deviation. Statistically significant differences among the practices are marked with different letters (Tukey’s test, p < 0.05).
Table 4. Total phenols and antioxidant activity of grapes and wines.
Grape—SkinsGrape—SeedsWine
*DPPHTPDPPHTPDPPHTPITP
CTRL-V6.43 ± 0.40 a1488.6 ± 47.17 a5.41 ± 0.12 c1039.77 ± 16.16 bc10.54 ± 0.15 e71.08 ± 0.18 i3531.8 ± 263.64 cd
CANE5.85 ± 0.24 b1275.0 ± 31.60 b5.40 ± 0.15 c1010.22 ± 245.74 c13.30 ± 0.04 d88.37± 0.07 f3977.3 ± 454.54 cd
E-RIF5.55 ± 0.22 bc1171.6 ± 83.50 c5.76 ± 0.22 b1135.23 ± 31.04 a15.26 ± 1.08 c96.96 ± 0.00 d4186.4 ± 218.18 c
T-RIF6.08 ± 0.16 ab1312.5 ± 36.73 b6.02 ± 0.10 a1106.81 ± 58.26 ab15.20 ± 0.32 c96.86 ± 0.29 d3886.4 ± 72.72 cd
CTRL-W4.89 ± 0.23 c1075.0 ± 189.19 d5.36 ± 0.09 c995.45 ± 20.62 cd16.09 ± 0.73 c90.15 ± 0.03 e3790.91 ± 240.91 cd
SE20----12.86 ± 0.62 d84.53 ± 0.13 g3531.82 ± 9.09 cd
SE30----12.70 ± 0.08 d77.92 ± 0.05 h3372.73 ± 40.91 d
D-VIN3.51 ± 0.06 d783.63 ± 8.13 f5.81 ± 0.21 ab1081.81 ± 36.34 b25.63 ± 0.95 b155.7 ± 0.30 c6518.18 ± 109.09 b
D-SUN1.62 ± 0.11 f282.27 ± 37.40 g5.55 ± 0.12 ab1020.45 ± 71.45 bc28.61 ± 0.05 a187.6 ± 0.60 b9018.18 ± 336.36 a
D-AIR3.27 ± 0.05 d747.05 ± 12.04 f5.71 ± 0.06 b1010.23 ± 53.21 c29.64 ± 0.62 a236.2 ± 0.00 a9281.82 ± 345.45 a
* Antioxidant activity measured with DPPH as TEAC (mM) and total phenolics as (mg GAE/L). CTRL-V: control of vineyard treatments; CANE: long pruning; E-RIF: partial defoliation; T-RIF: complete defoliation; CTRL-W: control of winery treatments; SE20: removal 20% of the seeds; SE30: removal 30% of the seeds; D-VIN: extended ripening on the vine; D-SUN: sun-drying; D-AIR: dehydration in a closed room with shaded air circulation. The data are presented as the mean value ± standard deviation. Statistically significant differences among the practices are marked with different letters (Tukey’s test, p < 0.05).
Table 5. Extractability and total anthocyanin contents of the grape skin extracts and wines of the Mandilaria variety.
GrapeWine
*Extractability (AE%)Anthocyanins (mg/Berry)Anthocyanins (mg/g Fresh Weight of Skins)Anthocyanins (mg Mlv/L)
CTRL-V54.48 ± 1.32 a0.99 ± 0.08 cd16.69 ± 0.06 d286.26 ± 0.97 ab
CANE53.04 ± 1.87 a1.04 ± 0.10 c26.57 ± 0.14 bc260.56 ± 0.20 b
E-RIF19.59 ± 2.16 e1.19 ± 0.04 b23.47 ± 0.17 c341.55 ± 0.57 a
T-RIF14.03 ± 0.84 f1.47 ± 0.02 a33.43 ± 0.21 a375.39 ± 2.11 a
CTRL-W45.26 ± 2.17 cd1.41 ± 0.04 a12.20 ± 0.20 d189.74 ± 0.61 c
SE20---167.31 ± 0.37 c
SE30---189.14 ± 0.19 c
D-VIN17.31 ± 1.43 e1.07 ± 0.05 c9.70 ± 0.40 e101.80 ± 1.95 de
D-SUN14.20 ± 1.25 f0.61 ± 0.07 e3.10 ± 0.10 g2.07 ± 0.00 j
D-AIR18.58 ± 2.00 e0.69 ± 0.05 e10.60 ± 0.30 e41.24 ± 0.00 h
* CTRL-V: control of vineyard treatments; CANE: long pruning; E-RIF: partial defoliation; T-RIF: complete defoliation; CTRL-W: control of winery treatments; SE20: removal 20% of the seeds; SE30: removal 30% of the seeds; D-VIN: extended ripening on the vine; D-SUN: sun-drying; D-AIR: dehydration in a closed room with shaded air circulation. The data are presented as the mean value ± standard deviation. Statistically significant differences among the practices are marked with different letters (Tukey’s test, p < 0.05).
Table 6. Tannin content in the grapes and wines.
Grape—SkinsGrape—SeedsWine
*MCPBSAMCPBSAMCPBSA
CTRL-V1149 ± 55.52 b347.49 ± 90.73 ab1538.51 ± 97.90 c476.21 ± 8.89 a1820.0 ± 52 ef306.70 ± 25.0 g
CANE690 ± 379.27 d370.77 ± 11.33 a1699.73 ± 253.57 b447.70 ± 17.45 b2440.0 ± 64 de566.81 ± 2.13 d
E-RIF1318 ± 168.20 a335.23 ± 14.16 b1509.87 ± 140.73 c 482.81 ± 4.27 a2456.0 ± 72 de560.43 ± 22.34 d
T-RIF948 ± 120.33 c335.66 ± 10.35 b1824.53 ± 137.15 a478.34 ± 37.76 a2740.0 ± 12 d549.79 ± 15.96 d
CTRL-W928 ± 142.97 c255.55 ± 7.12 c1114.67 ± 147.60 e489.40 ± 41.38 a2416.0± 304 de580.11 ± 10.11 d
SE20----1984.0 ± 8 ef427.98 ± 9.04 e
SE30----1512.0 ± 304 f370.00 ± 0.00 f
D-VIN422 ± 140.40 f158.67 ± 18.69 d1630.93 ± 334.74 b496.21 ± 23.42 a5114.7 ± 341.79 c1400.64 ± 24.47 c
D-SUN234 ± 32.42 g56.55 ± 10.21 g1377.6 ± 123.56 d431.11 ± 28.27 b7568.0 ± 57.69 b2086.38 ± 36.17 b
D-AIR549 ± 38.21 e100.85 ± 29.43 e1489.07 ± 40.92 cd473.66 ± 17.47 a8405.3 ± 473.10 a2224.68 ± 0.00 a
* Tannins measured with the MCP and BSA methods are expressed as (mg/L catechin equivalents). CTRL-V: control of vineyard treatments; CANE: long pruning; E-RIF: partial defoliation; T-RIF: complete defoliation; CTRL-W: control of winery treatments; SE20: removal 20% of the seeds; SE30: removal 30% of the seeds; D-VIN: extended ripening on the vine; D-SUN: sun-drying; D-AIR: dehydration in a closed room with shaded air circulation. The data are presented as the mean value ± standard deviation. Statistically significant differences among the practices are marked with different letters (Tukey’s test, p < 0.05).
Table 7. Sensory evaluation of the wines’ astringency from the various treatments based on the intensity levels.
Astringency
CTRL-V2.5 a
CANE3.5 b
E-RIF4.0 c
T-RIF3.3 ab
CTRL-W3.8 b
SE203.2 a
SE303.0 a
D-VIN4.2 bc
D-SUN4.8 c
D-AIR5.4 d
CTRL-V: control of vineyard treatments; CANE: long pruning; E-RIF: partial defoliation; T-RIF: complete defoliation; CTRL-W: control of winery treatments; SE20: removal 20% of the seeds; SE30: removal 30% of the seeds; D-VIN: extended ripening on the vine; D-SUN: sun-drying; D-AIR: dehydration in a closed room with shaded air circulation. Statistically significant differences among the practices are marked with different letters (Tukey’s test, p < 0.05).
Disclaimer/Publisher’s Note: The statements, opinions and data contained in all publications are solely those of the individual author(s) and contributor(s) and not of MDPI and/or the editor(s). MDPI and/or the editor(s) disclaim responsibility for any injury to people or property resulting from any ideas, methods, instructions or products referred to in the content.

