Article

Caffeine and Polyphenolic Compound Recovery Optimization from Spent Coffee Grounds Utilizing Pressurized Liquid Extraction

by
Athanasios Christoforidis
,
Martha Mantiniotou
,
Vassilis Athanasiadis
and
Stavros I. Lalas
*
Department of Food Science and Nutrition, University of Thessaly, Terma N. Temponera Street, 43100 Karditsa, Greece
*
Author to whom correspondence should be addressed.
Beverages 2025, 11(3), 74; https://doi.org/10.3390/beverages11030074
Submission received: 15 March 2025 / Revised: 26 April 2025 / Accepted: 13 May 2025 / Published: 20 May 2025

Abstract

Coffee belongs among the most widespread beverages worldwide, and its increasing consumption leads to the generation of a large amount of by-products, mainly spent coffee grounds (SCGs). SCGs can be further recycled as they contain bioactive compounds. This research aims to search for the extraction conditions that lead to the highest recovery of these compounds through a green extraction technique, pressurized liquid extraction (PLE). The parameters studied were solvent composition, temperature, and extraction time, while the pressure was kept constant at 1700 psi. The optimum conditions were 48% v/v ethanol solution at 160 °C for 25 min. Under these conditions, the maximum recoveries were total polyphenol content of 15.99 mg gallic acid equivalents/g dry weight (dw), a total caffeine content of 1.15 mg/g dw, and an antioxidant capacity determined through the ferric-reducing antioxidant power of 101.87 μmol ascorbic acid equivalents/g dw. Additionally, individual polyphenols in SCGs were studied by high-performance liquid chromatography, revealing that the extracts were rich in chlorogenic acid, (−)-epicatechin, and rutin. The results of this work can set the basis for the further utilization of SCGs through PLE by the beverage, food, pharmaceutical, and cosmetic industries.

1. Introduction

Coffee belongs among the most prevalent non-alcoholic beverages consumed globally, due to its exceptional flavor and alignment with consumer tastes [1,2]. Commonly, two primary blends of coffee are exploited: Coffea robusta (Coffea canephora), constituting 25% of global production, and Coffea arabica, accounting for 75% of global production. These blends are typically processed using either dry or wet processes. Arabica coffee is generally regarded as superior to Robusta because of its delicate scent, high acidity, and wine-like flavor [2]. Despite these differences in quality, both coffee types are highly consumed worldwide, reflecting their shared popularity and significance. Not only is coffee a renowned beverage, but it is also the second most commercialized product worldwide [3]. The International Coffee Organization reports that coffee consumption worldwide was 9.98 × 10⁶ kg in 2020, while global coffee production rose by 0.1% to 168.2 million bags in 2022–2023 [4]. Spent coffee grounds (SCGs), which comprise the solid residues after the brewing process, make up a significant waste material stream. Around 6 million tons of SCGs are estimated to be produced by the instant coffee industry annually. The majority of the produced coffee is harvested, roasted, and finally provided for coffee making [5].
SCGs are solid remnants produced following the manufacture of coffee beverages and can be found in various locations, including residential and coffee-serving commercial facilities. Disposing of SCGs poses significant environmental challenges. The average weight of SCGs comprises around 75% of the original coffee bean [6]. These residues are typically discarded in the trash, ultimately ending up in landfills, where they are highly polluting due to the substantial volumes of organic matter that require considerable oxygen for decomposition [7]. Valorizing SCG through their application in several sectors, including cosmetics, pharmaceuticals, soil composites, food, biogas, and energy generation, has been previously mentioned [8]. Agricultural waste valorization within a circular economy model has rapidly increased in recent years. The food business often utilizes various by-products to recycle ingredients, so enhancing and adding economic value to waste [9]. This waste is usually discarded into landfills and water bodies, resulting in the leaching of these molecules into the environment [10]. Polyphenols, a type of secondary metabolite that is found in SCGs, could be utilized as the primary antioxidants in the human diet [11]. Polyphenols may exhibit many beneficial properties, including antioxidant, anticarcinogenic, anti-inflammatory, anticancer, and neuroprotective actions [11]. It is noteworthy that 1 kg of soluble coffee preparation yields 2 kg of wet SCG [12].
SCGs have been valorized in a plethora of ways, including their utilization as wood powder or fertilizers, as sources of antioxidants and polysaccharides, or as absorbents for the removal of cationic dyes in wastewater treatment; however, these strategies have not been consistently applied at an industrial scale [5,13]. Recently, there has been heightened interest in utilizing SCGs as biodiesel feedstock [5]. Numerous uses of SCG pertinent to the food business are linked to the observation that moderate daily coffee consumption may confer favorable health benefits [14]. Depressive disorders, Alzheimer’s disease, cancer, Parkinson’s disease, diabetes, and other conditions have been found to have an inverse association with coffee extracts, whether they are green or roasted [15,16,17,18,19,20]. Coffee exhibits protective effects on multiple systems, including the neurological, skeletal, reproductive, immune, and cardiovascular systems [21,22,23]. The health advantages associated with coffee stem from its abundant phytochemistry, which comprises chemicals like caffeine and other biologically active components mostly classified as polyphenols and alkaloids [7]. These compounds are found in coffee beans, the resultant beverage, and the solid waste produced during coffee processing, such as SCGs [7].
Pressurized liquid extraction (PLE) is an innovative extraction technique that was initially used to analyze contaminants from plant material but is currently often used to extract bioactive compounds from plant tissues [24]. PLE is typically based on the applied pressure and the solvent’s temperature above its boiling point. The employed temperatures often span from 50 to 200 °C, while the pressure levels vary between 35 and 200 bar [25]. Thus, it enhances extraction performance as higher temperatures than conventional extraction techniques are attained. Elevated pressure augments mass transfer by enhancing cellular permeability. Conversely, increased temperatures enhance the solvent’s diffusion into the sample by reducing its viscosity. Moreover, it improves the yield of extraction by promoting mass transfer, thus augmenting the solubility of the desired molecules. This process is straightforward, ensures safe and rapid recovery, reduces solvent consumption, shortens extraction duration, and delivers great accuracy and reproducibility [25,26].
Despite investigations into the impact of PLE on SCGs, the majority have concentrated on the application of the residues as biorefinery products or the extraction of caffeine and caffeoylquinic acids [27,28,29,30]. Insufficient attention has been placed on the concurrent extraction of caffeine alongside other antioxidant compounds, notably the diverse polar polyphenols present in SCGs. Moreover, it is essential to emphasize that environmentally friendly solvents are utilized to maintain an ecologically responsible profile, free from dangerous organic solvents. Extraction optimization was accomplished by response surface methodology (RSM). In this work, we examined the influence of green solvent mixtures of water and ethanol, along with the effects of temperature and extraction duration on the extraction process. Additionally, a partial least squares (PLS) model was employed to ascertain the most favorable conditions. Caffeine, individual polar polyphenols, and flavonoids were identified through high-performance liquid chromatography (HPLC) coupled with a diode array detector (DAD), and the antioxidant activity of all extracts was assessed.

2. Materials and Methods

2.1. Chemicals and Reagents

All chemical standards utilized for HPLC analysis were provided by MetaSci (Toronto, ON, Canada) and were at least 97% pure or higher. A deionizing column was utilized to produce deionized water for every experiment done. Acetonitrile was acquired from Labkem (Barcelona, Spain). Sodium carbonate (anhydrous, 99.5%), rutin (≥94%), and formic acid (99.8%) were from Penta (Prague, Czech Republic). Sigma-Aldrich (Darmstadt, Germany) supplied L-ascorbic acid (99%), 2,4,6-tris(2-pyridyl)-s-triazine (TPTZ) (≥98%), and hydrochloric acid (37%). The supplier of iron (III) chloride hexahydrate (97%) was Merck (Darmstadt, Germany). Panreac Co. (Barcelona, Spain) provided gallic acid (97%), Folin-Ciocalteu reagent, and ethanol (99.8%).

2.2. Spent Coffee Grounds Material

SCGs utilized in this study were derived from espresso brewing and were kindly donated by a local coffee store in Karditsa, Greece. The coffee variety was 90% Arabica and 10% Robusta. The coffee beans were freshly ground immediately prior to brewing to preserve their optimal flavor and aroma. The coffee was prepared using a professional espresso machine set to a water temperature of 96 °C, an extraction time of 30–35 s, a brewing pressure of 8 bar, and a coffee dose of 16 g, using a coffee-to-water ratio of 1:2. After espresso preparation, the SCGs were collected, sealed in a plastic bag, and transported to the laboratory within two hours of coffee production and allowed to dry naturally at room temperature (20 °C) for 3 days. The moisture content was determined by recording the mass of the SCGs before and after three days of drying, and it was 40%. Then, the SCGs were sieved through an Analysette 3 PRO (Fritsch GmbH, Oberstein, Germany) sieving machine, and the grains with diameters less than 400 μm were used for all the experiments.

2.3. Design of the Experiment

The response surface methodology (RSM) with a Box–Behnken design, involving three independent variables at three levels, was utilized to determine the optimal extraction parameters for total polyphenolic content (TPC), total identified polyphenols (TIP), caffeine content (CAF), and ferric reducing antioxidant power (FRAP). This approach was applied to the PLE technique using SCGs after espresso extraction. For the extraction procedure, Fluid Management Systems Inc. (Watertown, MA, USA) provided a PLE apparatus. The pressure level was maintained at 1700 psi for all extractions to ensure reproducibility and reliable results. This choice was informed by prior optimization studies, which identified this pressure as optimal for the efficient operation of the instrument. After each extraction procedure, the supernatant was separated from the solid residue at a NEYA 16R centrifuge from Remi Elektrotechnik Ltd. (Palghar, India). The independent variables investigated included ethanol concentration in water (C, % v/v) as X1, temperature (T, °C) as X2, and extraction time (t, min) as X3, each coded at three levels: low (−1), medium (0), and high (+1), as shown in Table 1. More specifically, for independent variable X1, the values were 0% v/v (low), 50% v/v (medium), and 100% v/v (high); for X2, the values were 40 °C (low), 100 °C (medium), and 160 °C (high); and for X3, the values were 5 min (low), 15 min (medium), and 25 min (high). To evaluate the method’s reproducibility, 15 experimental runs with three central points were conducted. Each design point was conducted in triplicate, recording the average response values. After each extraction procedure, the supernatant was separated from the solid residue through a NEYA 16R centrifuge from Remi Elektrotechnik Ltd. (Palghar, India).
The method of least squares was utilized for the predictive accuracy of the model, resulting in a second-order polynomial equation that modeled the interactions between the three independent variables:
Y k = β 0 + i   = 1 2 β i X i + i   = 1 2 β ii X i 2 + i   = 1 2 j   = i   + 1 3 β ij X i X j
where Yk defines the expected response variable and Xi and Xj represent the independent variables. The linear, quadratic, and interaction terms in the model are represented by the intercept and regression coefficients β0, βi, βii, and βij, respectively.

2.4. Bioactive Compound Determination

2.4.1. Spectrophotometric Evaluation of Total Polyphenolic Content (TPC)

The total polyphenolic content (TPC) was measured using a spectrophotometric approach, specifically the Folin–Ciocalteu method, which was previously described [31]. The findings were expressed in milligrams of gallic acid equivalents (GAE) per gram of dry weight (dw). The analysis was conducted at a wavelength of 740 nm using a Shimadzu UV-1900i UV/Vis spectrophotometer (Kyoto, Japan), calibrated against a standard curve of gallic acid (10–100 mg/L, R2 = 0.9996) in water. The samples underwent incubation at 40 °C in an ultrasonic bath (Elmasonic P70H, Elma Schmidbauer GmbH, Singen, Germany) before measurement. Each experimental analysis was repeated in triplicate, and the average was used to evaluate the results.

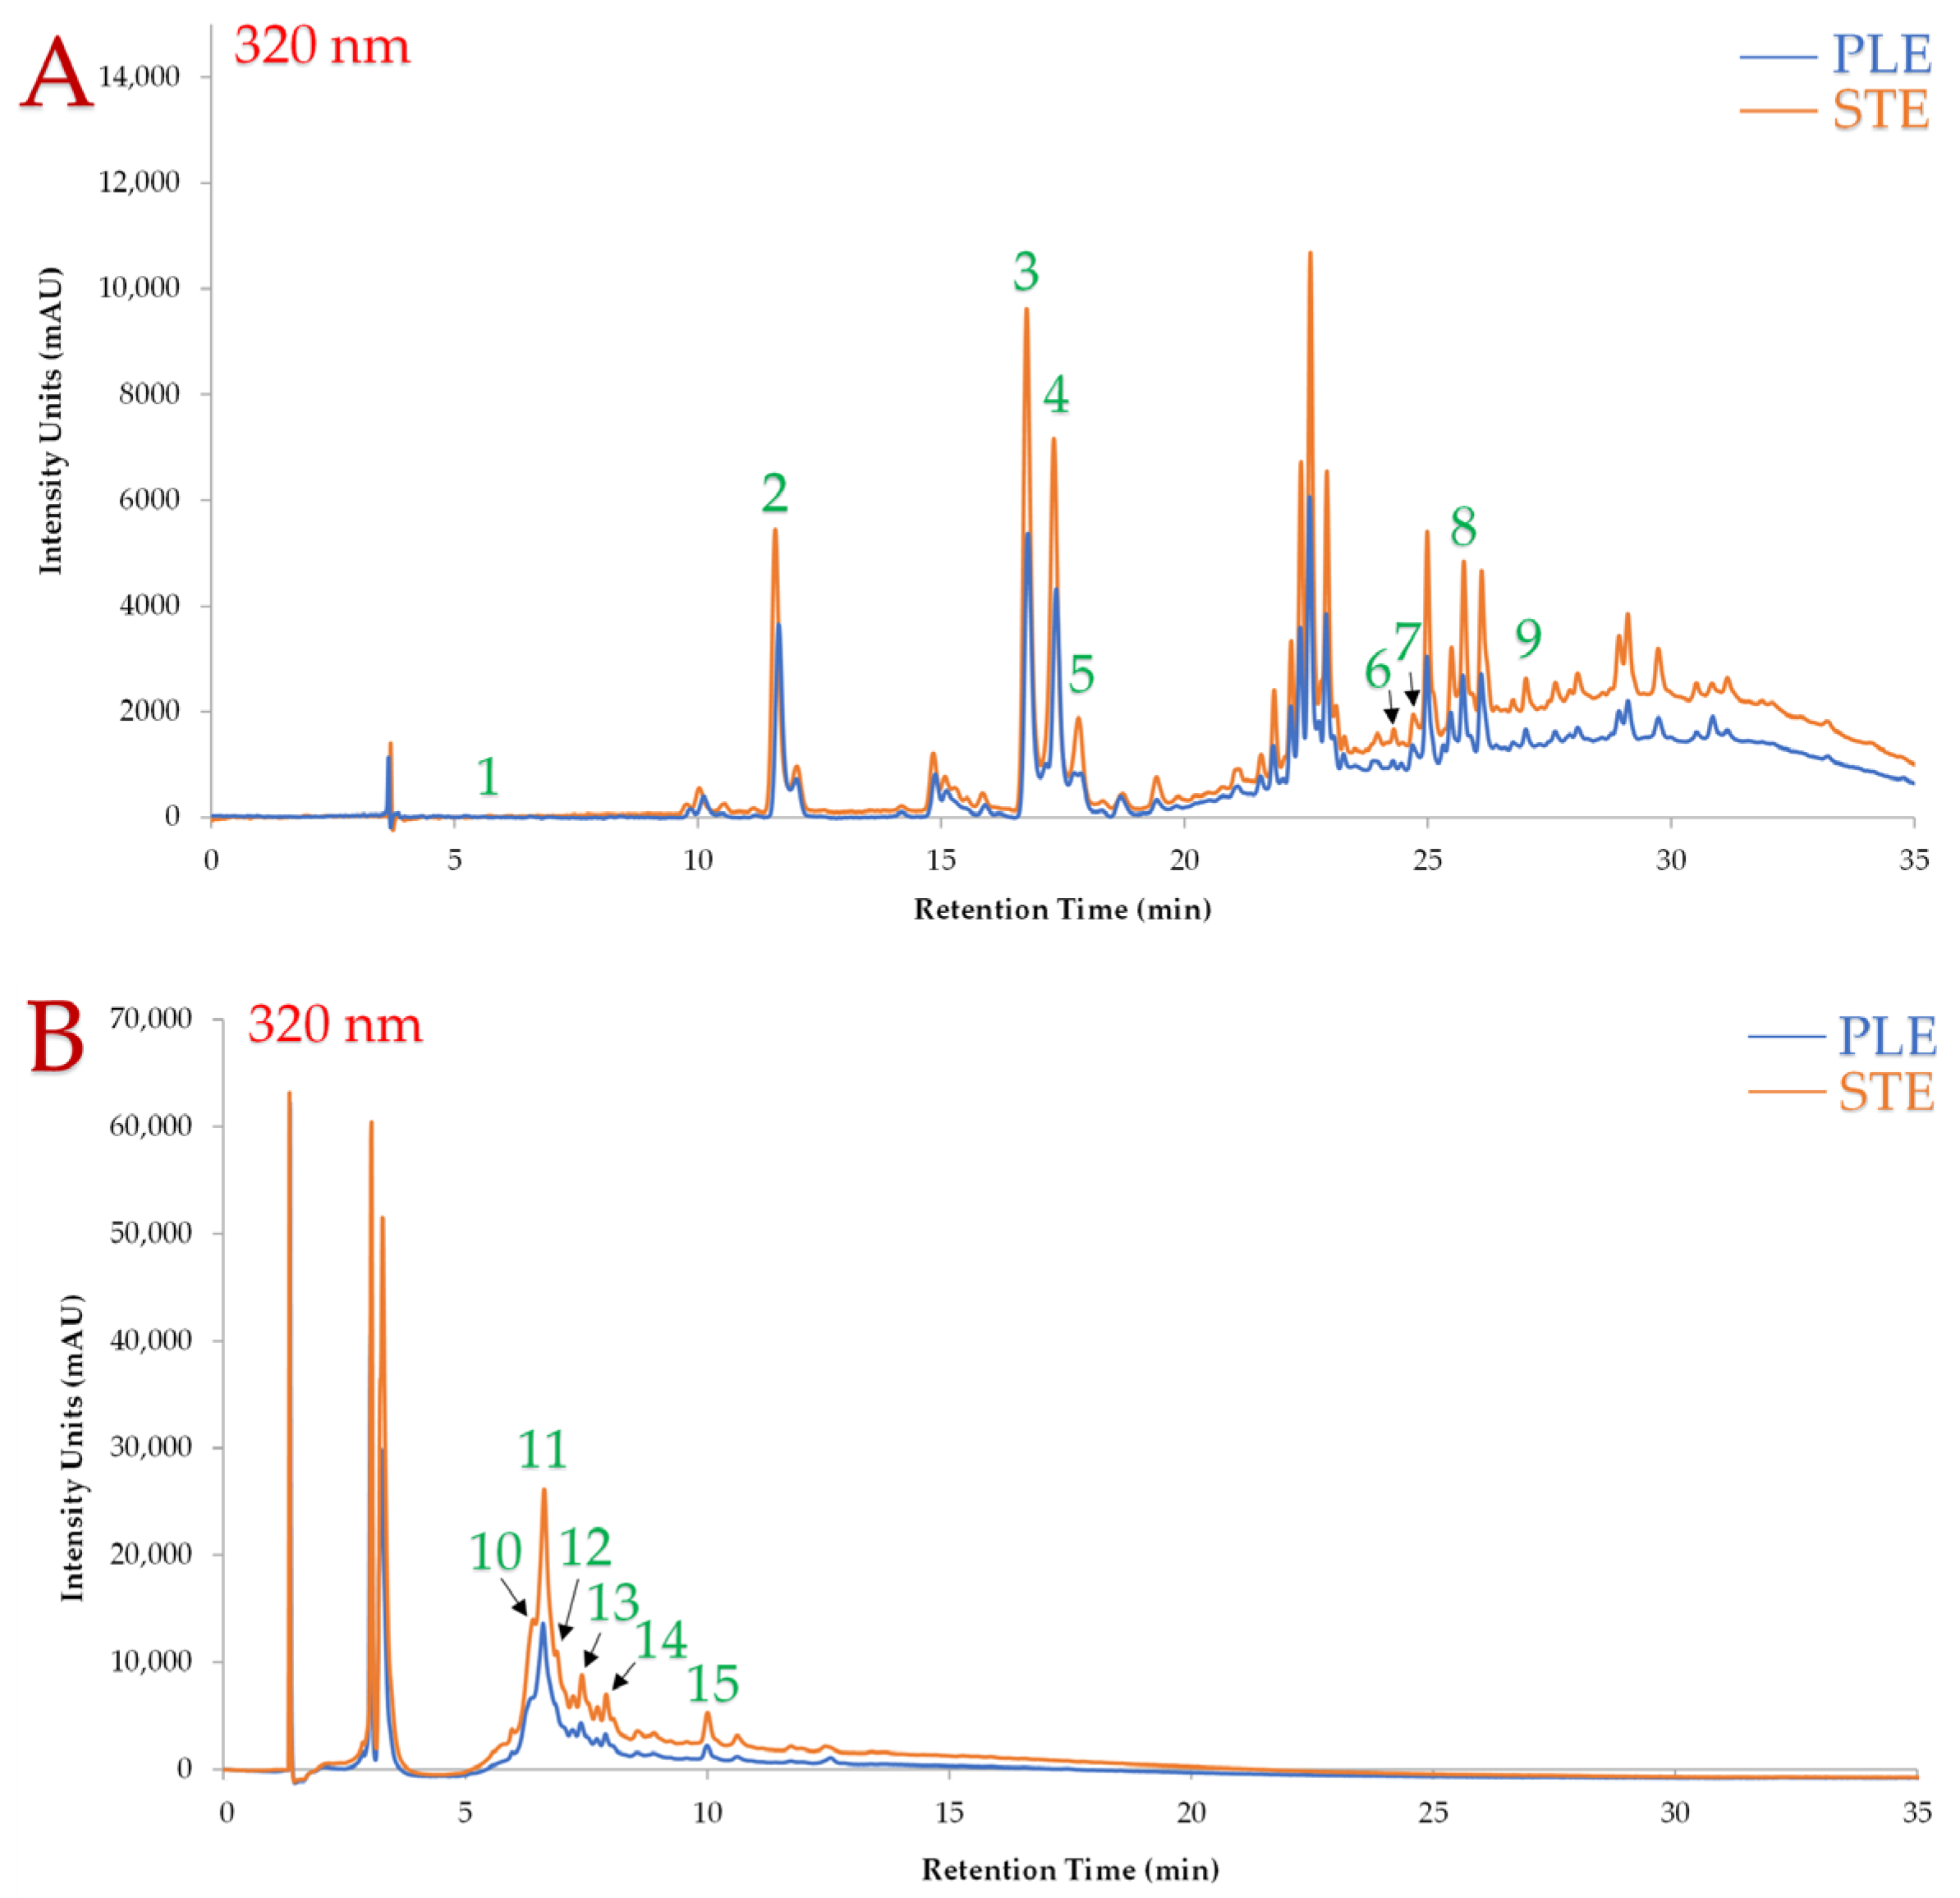
2.4.2. Chromatographic Analysis of Individual Phenolic Acids, Flavonoids, and Caffeine

Using high-performance liquid chromatography (HPLC), each polar phenolic compound present in the sample extracts was identified and measured. Shimadzu Europa GmbH (Duisburg, Germany) provided a Shimadzu SPD-M20A diode array detector (DAD) and a Shimadzu CBM-20A liquid chromatograph, which were used to analyze SCG extracts. Phenomenex Inc. (Torrance, CA, USA) supplied a Phenomenex Luna C18(2) column (100 Å, 5 μm, 4.6 mm × 250 mm), where the compounds were separated. The mobile phase was comprised of 0.5% v/v HCOOH in water (A) and 0.5% v/v HCOOH in acetonitrile (B) at a column temperature of 40 °C. Phenolic acids and caffeine were identified using a gradient method, starting at 5% B, gradually increasing to 12% in 15 min, then reaching 55% in 35 min, followed by 100% in 1 min, held for 3 min, and finally reduced to 5% B over 40 min. For flavonoid identification, the gradient started at 5% B, increased to 30% in 3 min, then reached 68% over 34 min, peaked at 100% in 1 min, held for 3 min, and returned to 5% B over 40 min. The mobile phase flowed at 1 mL/min for all analyses. Identification of compounds was based on absorbance spectra and retention times compared with standard references. Quantification was achieved using calibration curves ranging from 0 to 500 μg/mL, with each analysis performed in triplicate, and results averaged.

2.5. Ferric-Reducing Antioxidant Power (FRAP) Evaluation of Antioxidant Activity

A previously established study provides a thorough description of the method used to test the antioxidant capacity of SCG extracts utilizing the common electron-transfer method [31]. The reduction of the iron oxidation state from Fe3+ to Fe2+ was detected using this method at a wavelength of 620 nm. Ascorbic acid (50–500 μM in 0.05 M HCl, R2= 0.9997) was used as a calibration curve, and the results were reported as μmol of ascorbic acid equivalents (AAE) per gram of dw. Each analysis was performed in triplicate and the average was used to evaluate the results.

2.6. Statistical Analysis

RSM and distribution analysis were statistically analyzed using the JMP® Pro 16 software (SAS, Cary, NC, USA). Each set of SCG extracts underwent the extraction process a minimum of two times, and quantitative analyses were conducted in triplicate. The Shapiro–Wilk test evaluated the data’s normality. One-way analysis of variance (ANOVA) and the Tukey–Kramer HSD multiple comparison test were used to determine whether there were any significant differences. Results were presented as means along with measures of variability. Additionally, the statistical evaluation of partial least squares (PLS), Pareto plot analysis, multiple factor analysis (MFA), and multivariate correlation analysis (MCA) was made possible by JMP® Pro 16.

3. Results and Discussion

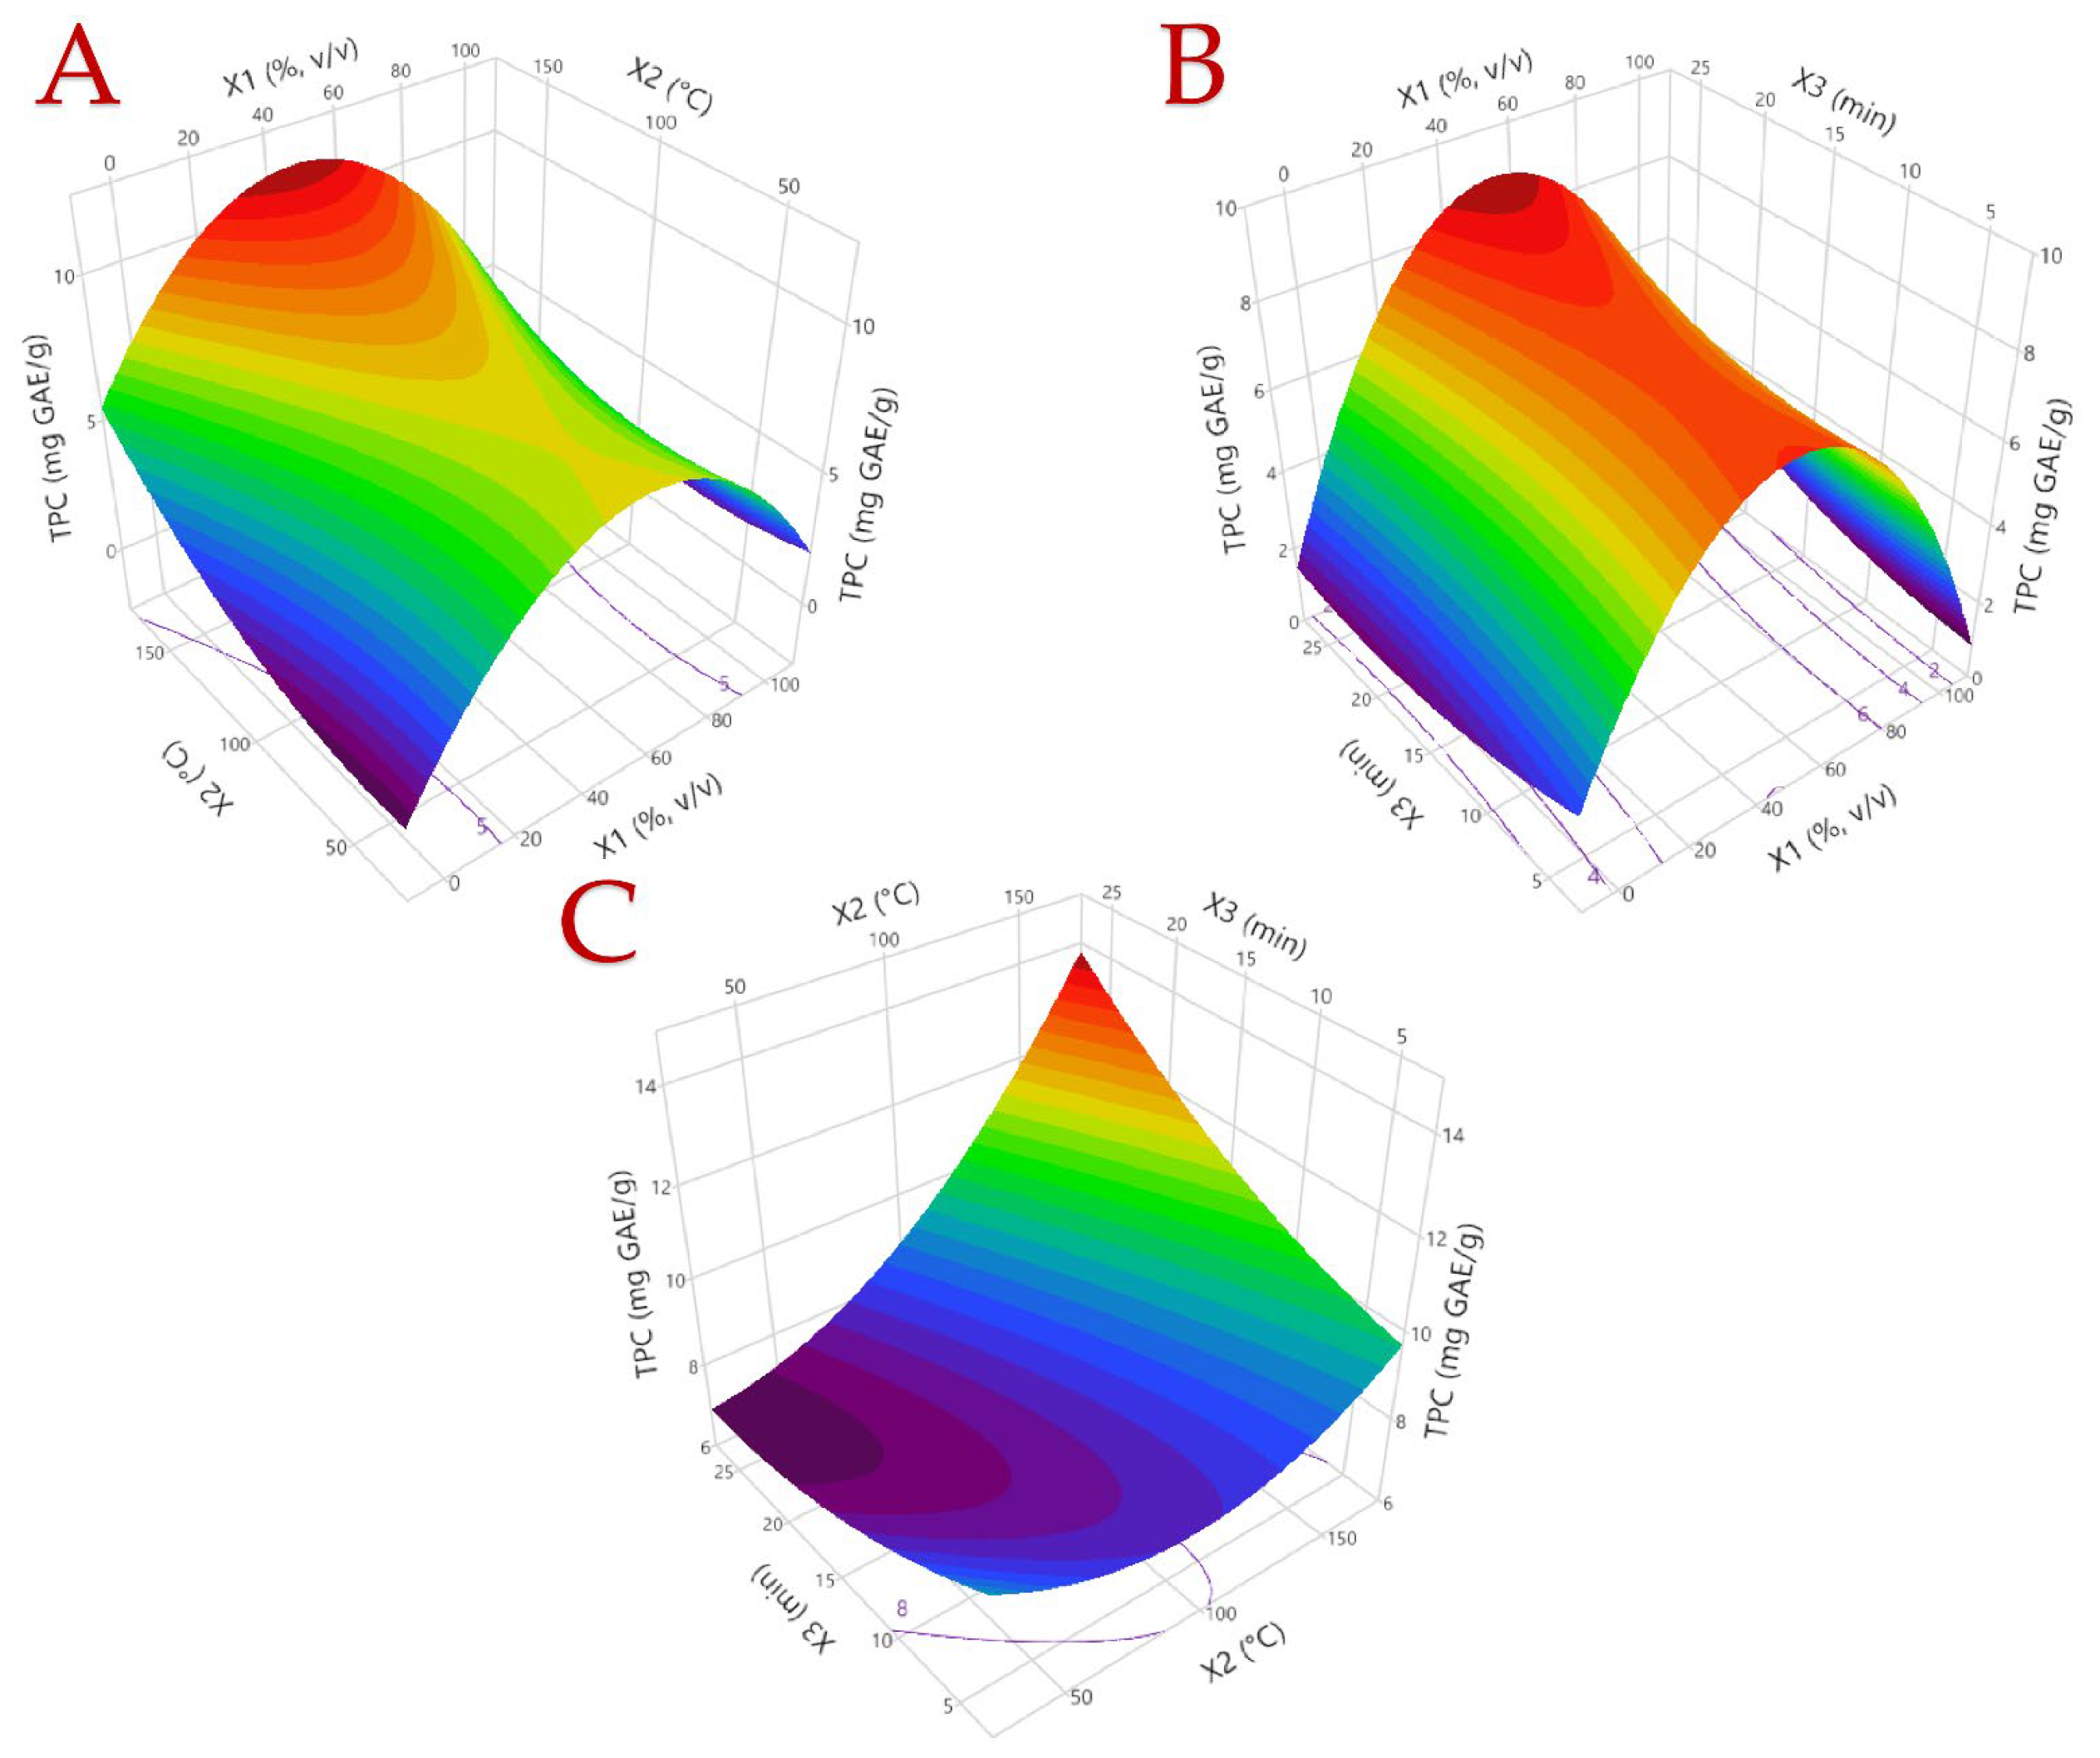
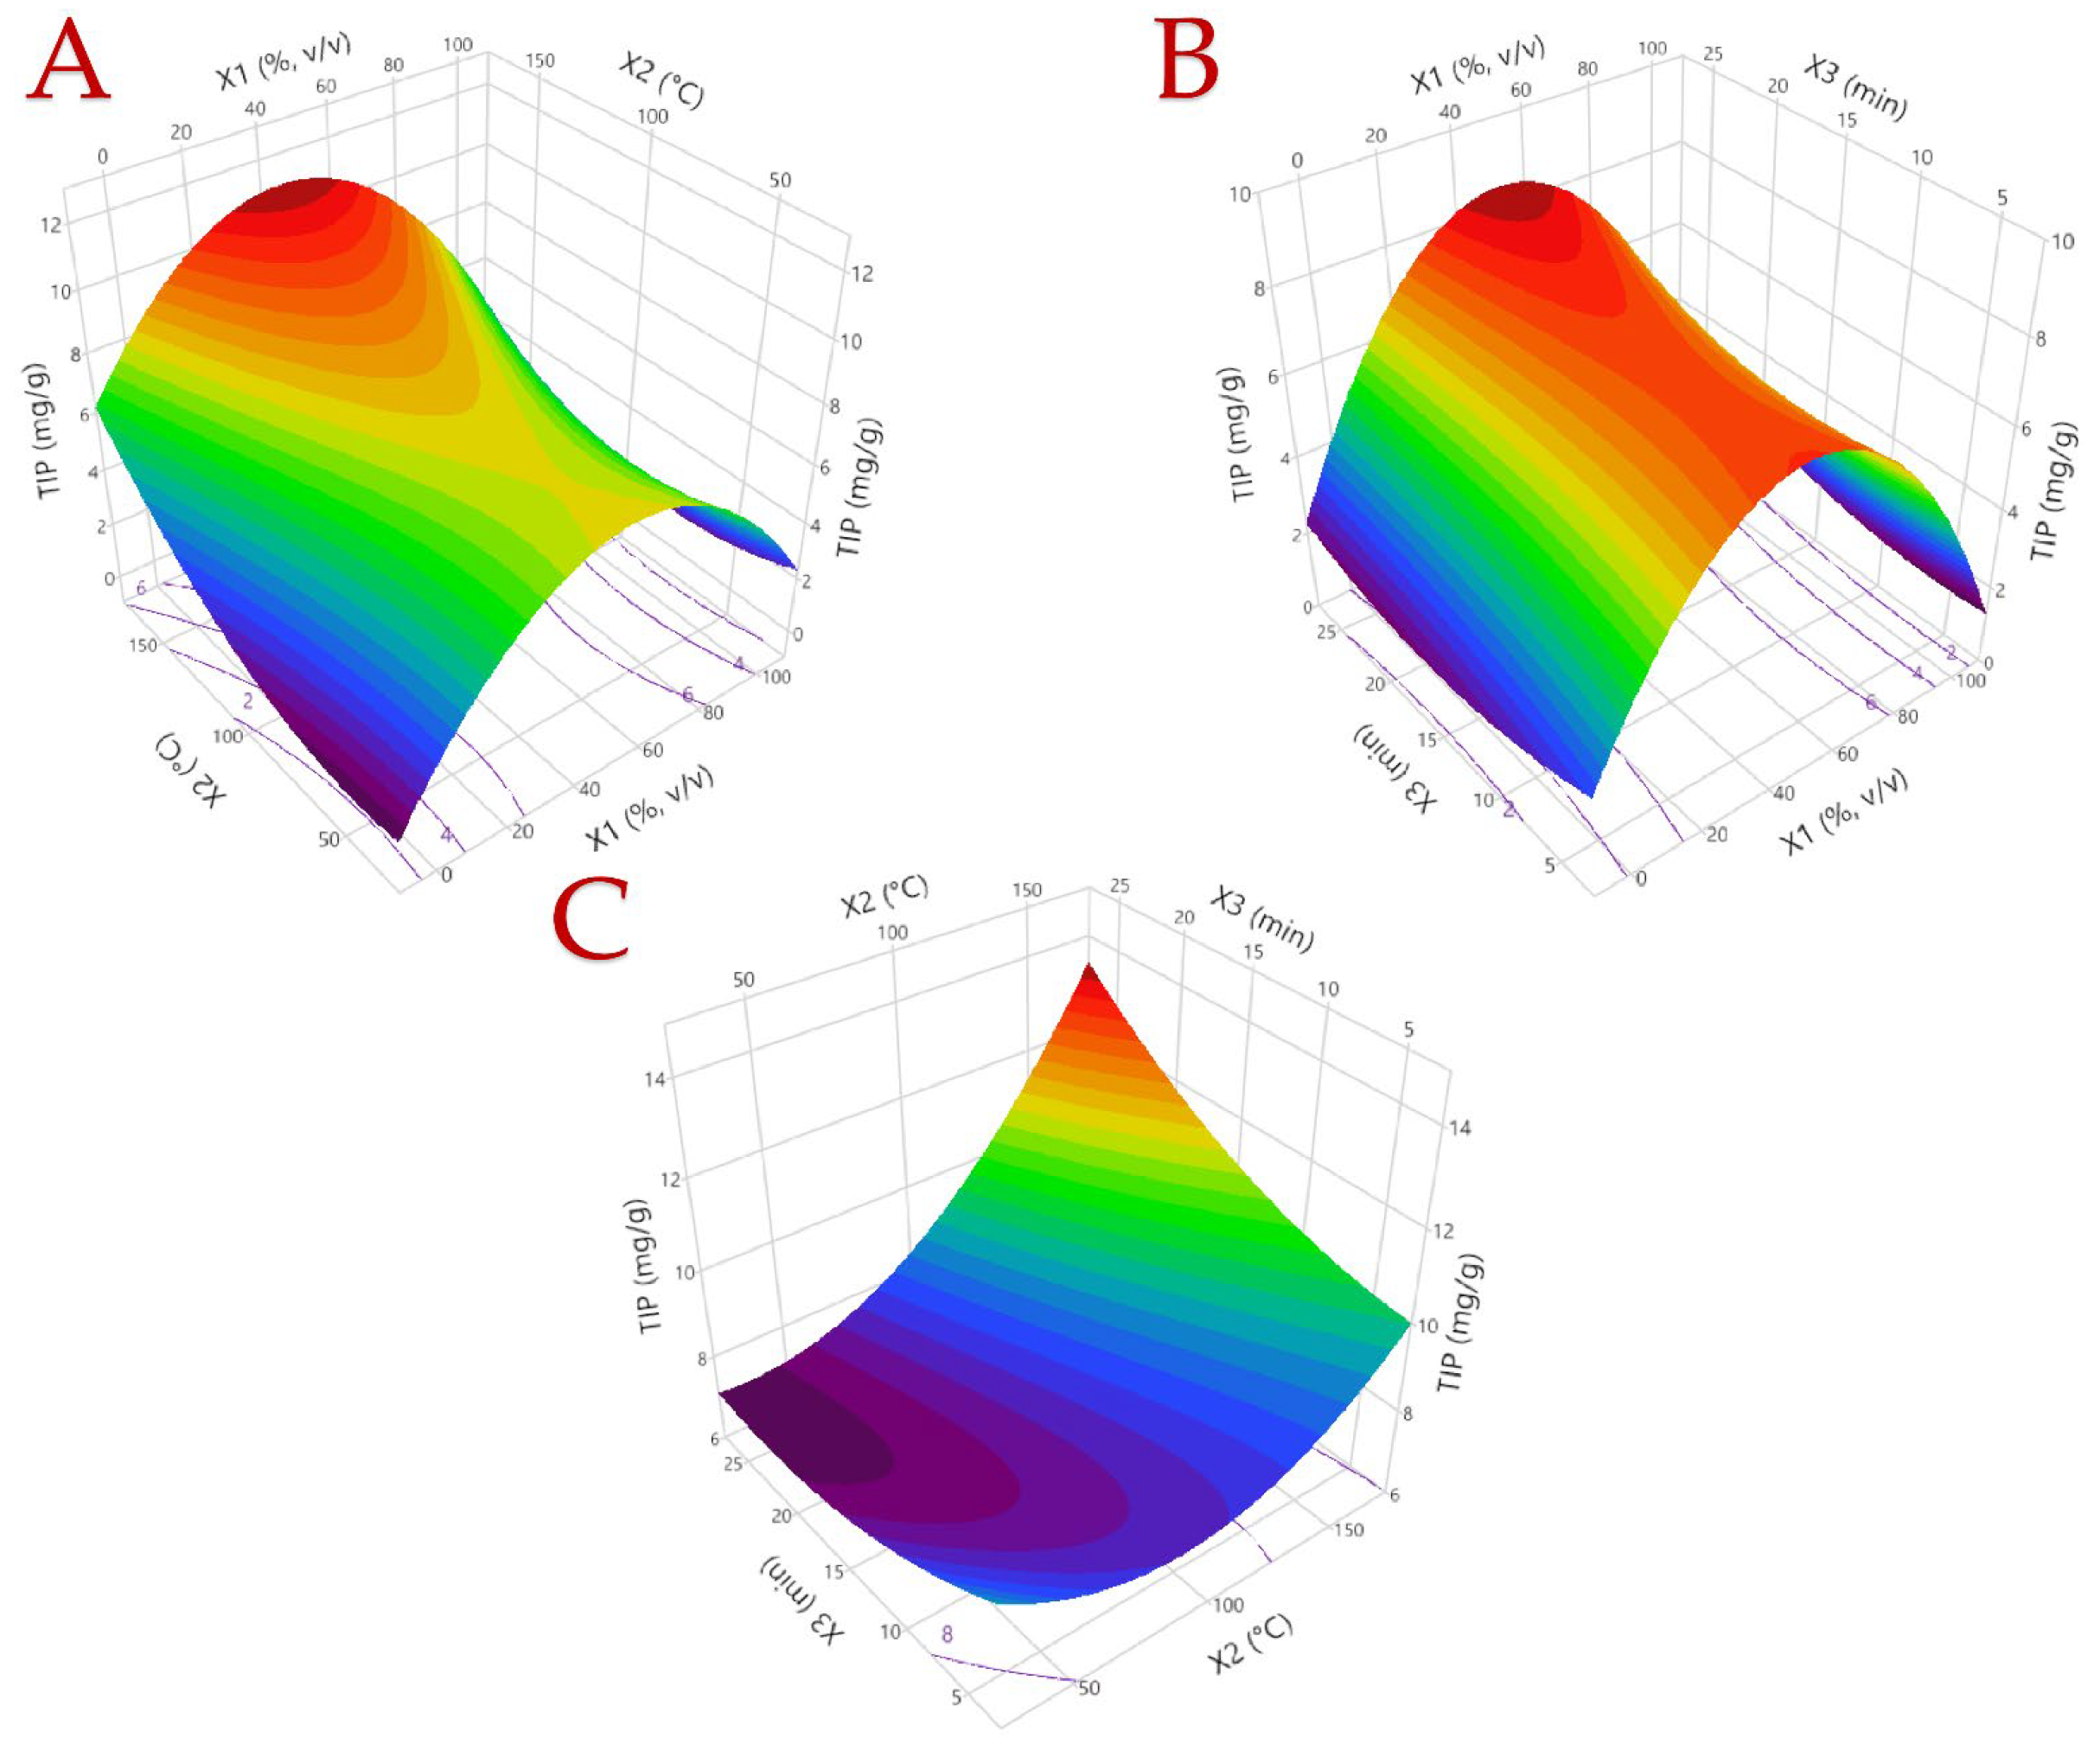
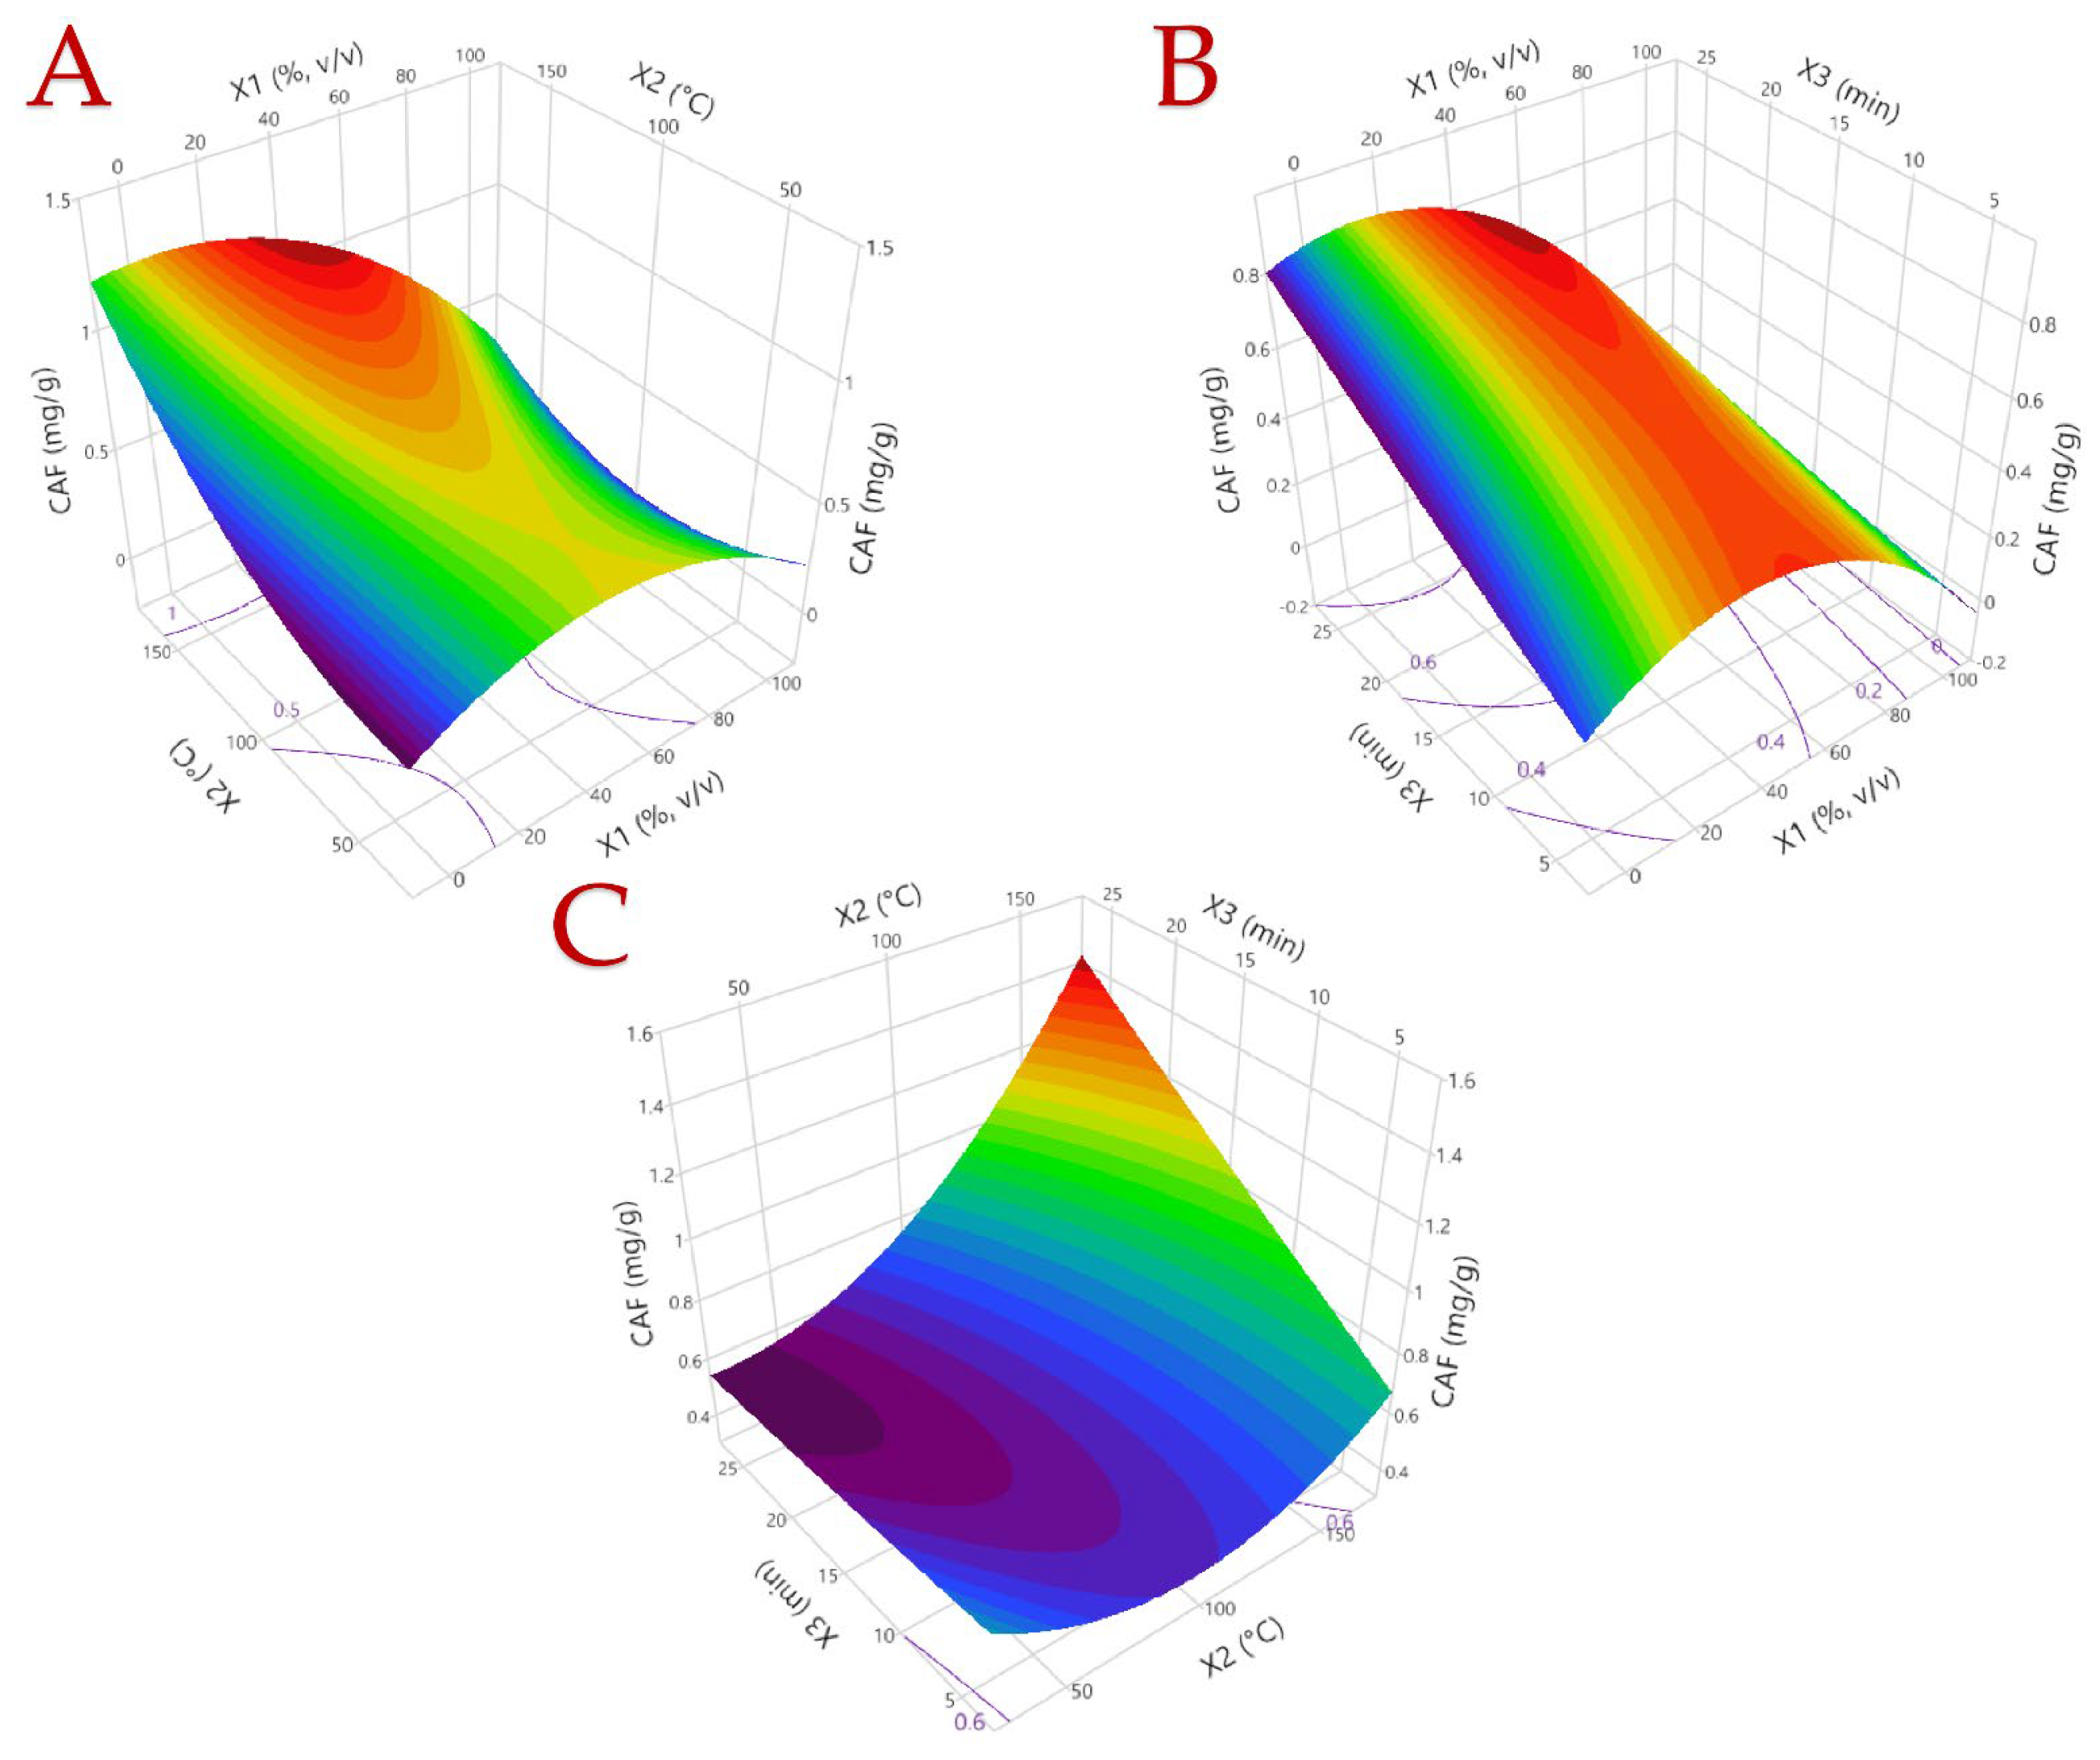
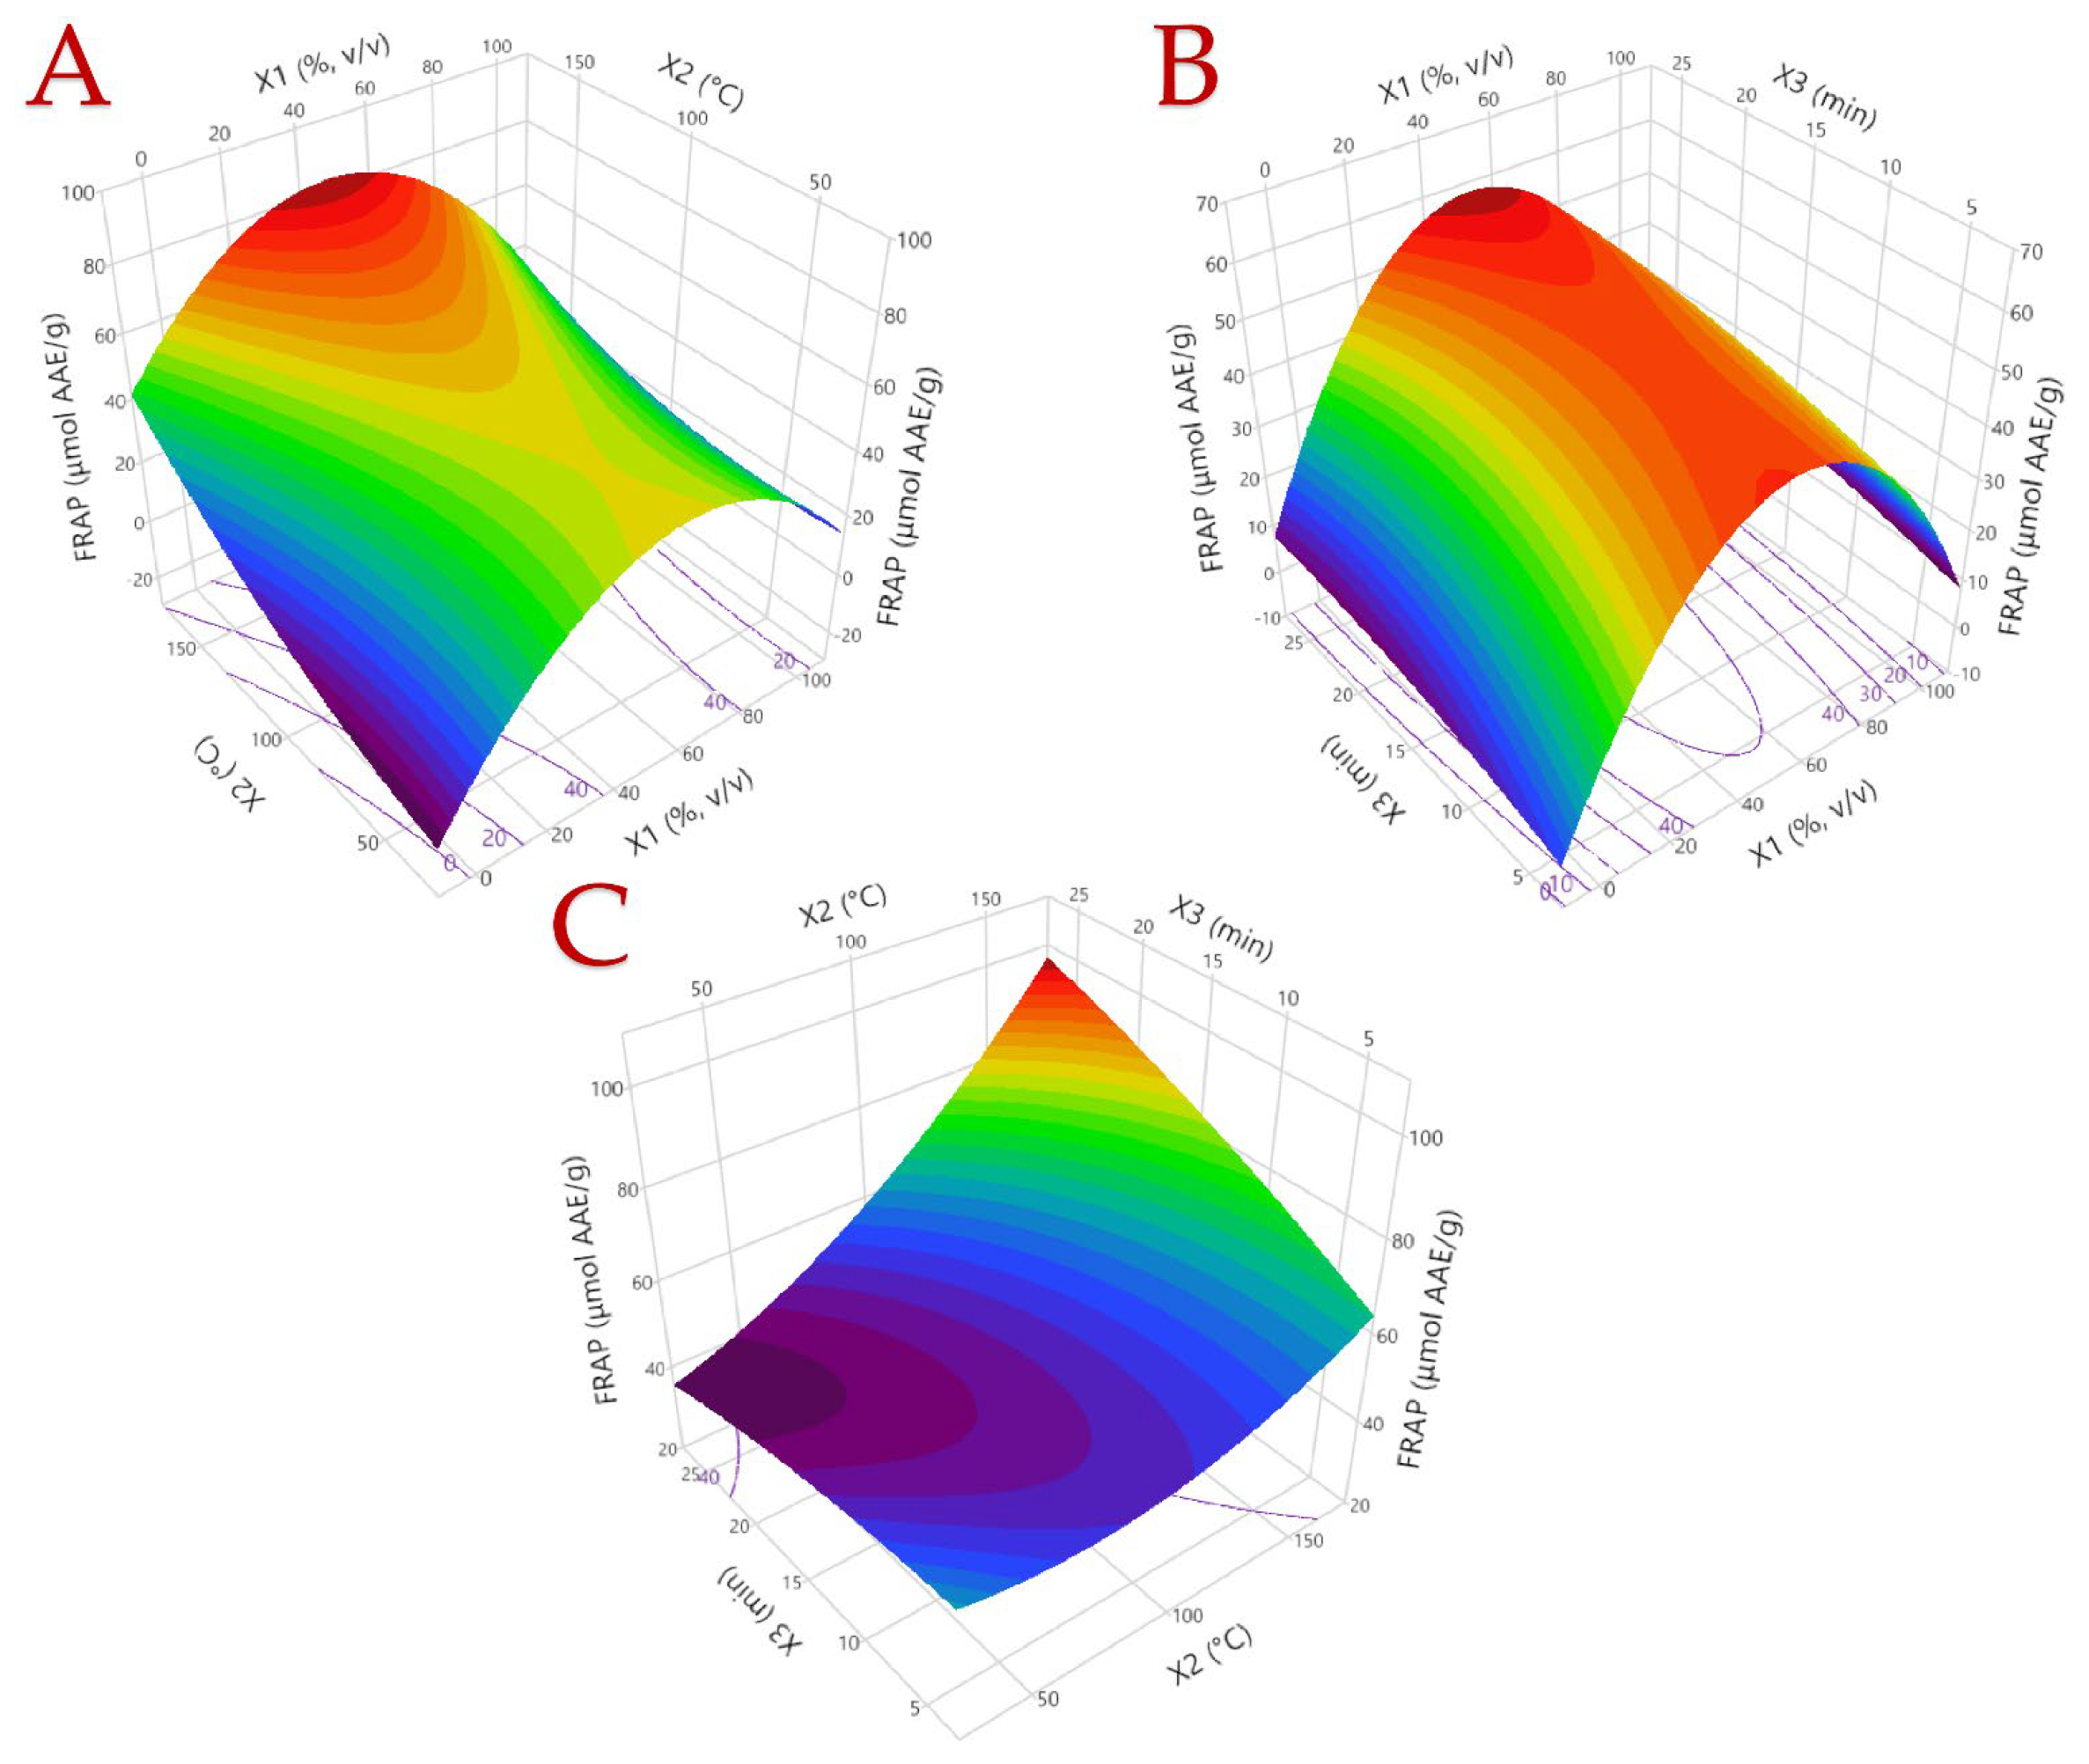
3.1. Optimization of the Extraction Procedure

Optimizing the extraction conditions from SCGs using PLE is essential to achieve maximum yield. The inclusion of numerous bioactive compounds can make the extraction process complex, resulting in differences in polarity and solubility [32]. Moreover, the extraction method and additional processing factors significantly influence the yield of the extracts and their antioxidant activity. Current developments in extraction technology have reduced reliance on hazardous solvents, protecting human health, and requiring minimal energy use. For this procedure to be applied successfully, an environmentally friendly solvent must be added [33]. As water is inexpensive, non-toxic to humans, and has a remarkable ability to extract polar compounds, it is a sustainable and easily accessible solvent. Furthermore, organic solvents like ethanol are frequently used to improve the extraction procedure. Water and ethanol can be combined to create an extraction solvent that can be used in the food industry [34]. Considering all these factors, several parameters, including solvent composition, extraction temperature, and duration, were assessed. The effect of different levels of these parameters on TPC, FRAP, and TIP and their values are shown in Table 1. Table 2 exhibits the details of the ANOVA along with the p-value and R-square values. In addition, Table A1 and Table A2 present in detail all the individual compounds identified through HPLC-DAD from the different extractions performed under different conditions. A first examination of Table 1, Table A1 and Table A2 reveals that the interplay of extraction parameters heavily impacts performance. Low temperatures seem to be detrimental to performance, and a similar pattern is observed in the brief duration.

3.2. Model Analysis

From the statistical analysis of the data, Equations (2)–(5) were derived, which will lead to the maximum performance of TPC, TIP, CAF, and FRAP, respectively. Table 3 shows the PLE conditions that led to the maximum yields in all assays. Figure A1, Figure A2, Figure A3 and Figure A4 depict the 3D plots, which also provide information on how each parameter affects TPC, TIP, CAF, and FRAP, respectively. It is worth noting that all assays require the same conditions (except for caffeine content, which requires a lower ethanol concentration) and all models have excellent desirability. This is a positive result, as it is feasible to obtain maximum yields from all assays at the same time.
TPC = 6.64 + 0.174X1 − 0.047X2 − 0.313X3 − 0.002X12 + 0.0003X22 + 0.004X32 − 0.0002X1X2 + 0.001X1X3 + 0.002X2X3
TIP = 6.522 + 0.162X1 − 0.053X2 − 0.282X3 − 0.002X12 + 0.0003X22 + 0.005X32 − 0.0002X1X2 + 0.001X1X3 + 0.001X2X3
CAF = 0.511 + 0.011X1 − 0.006X2 − 0.004X3 − 0.0001X12 + 0.00004X22 + 0.00004X32 − 0.00004X1X2 − 0.0001X1X3 + 0.0002X2X3
FRAP = 10.838 + 1.515X1 − 0.142X2 − 0.472X3 − 0.013X12 + 0.001X22 − 0.015X32 − 0.002X1X2 + 0.001X1X3 + 0.013X2X3

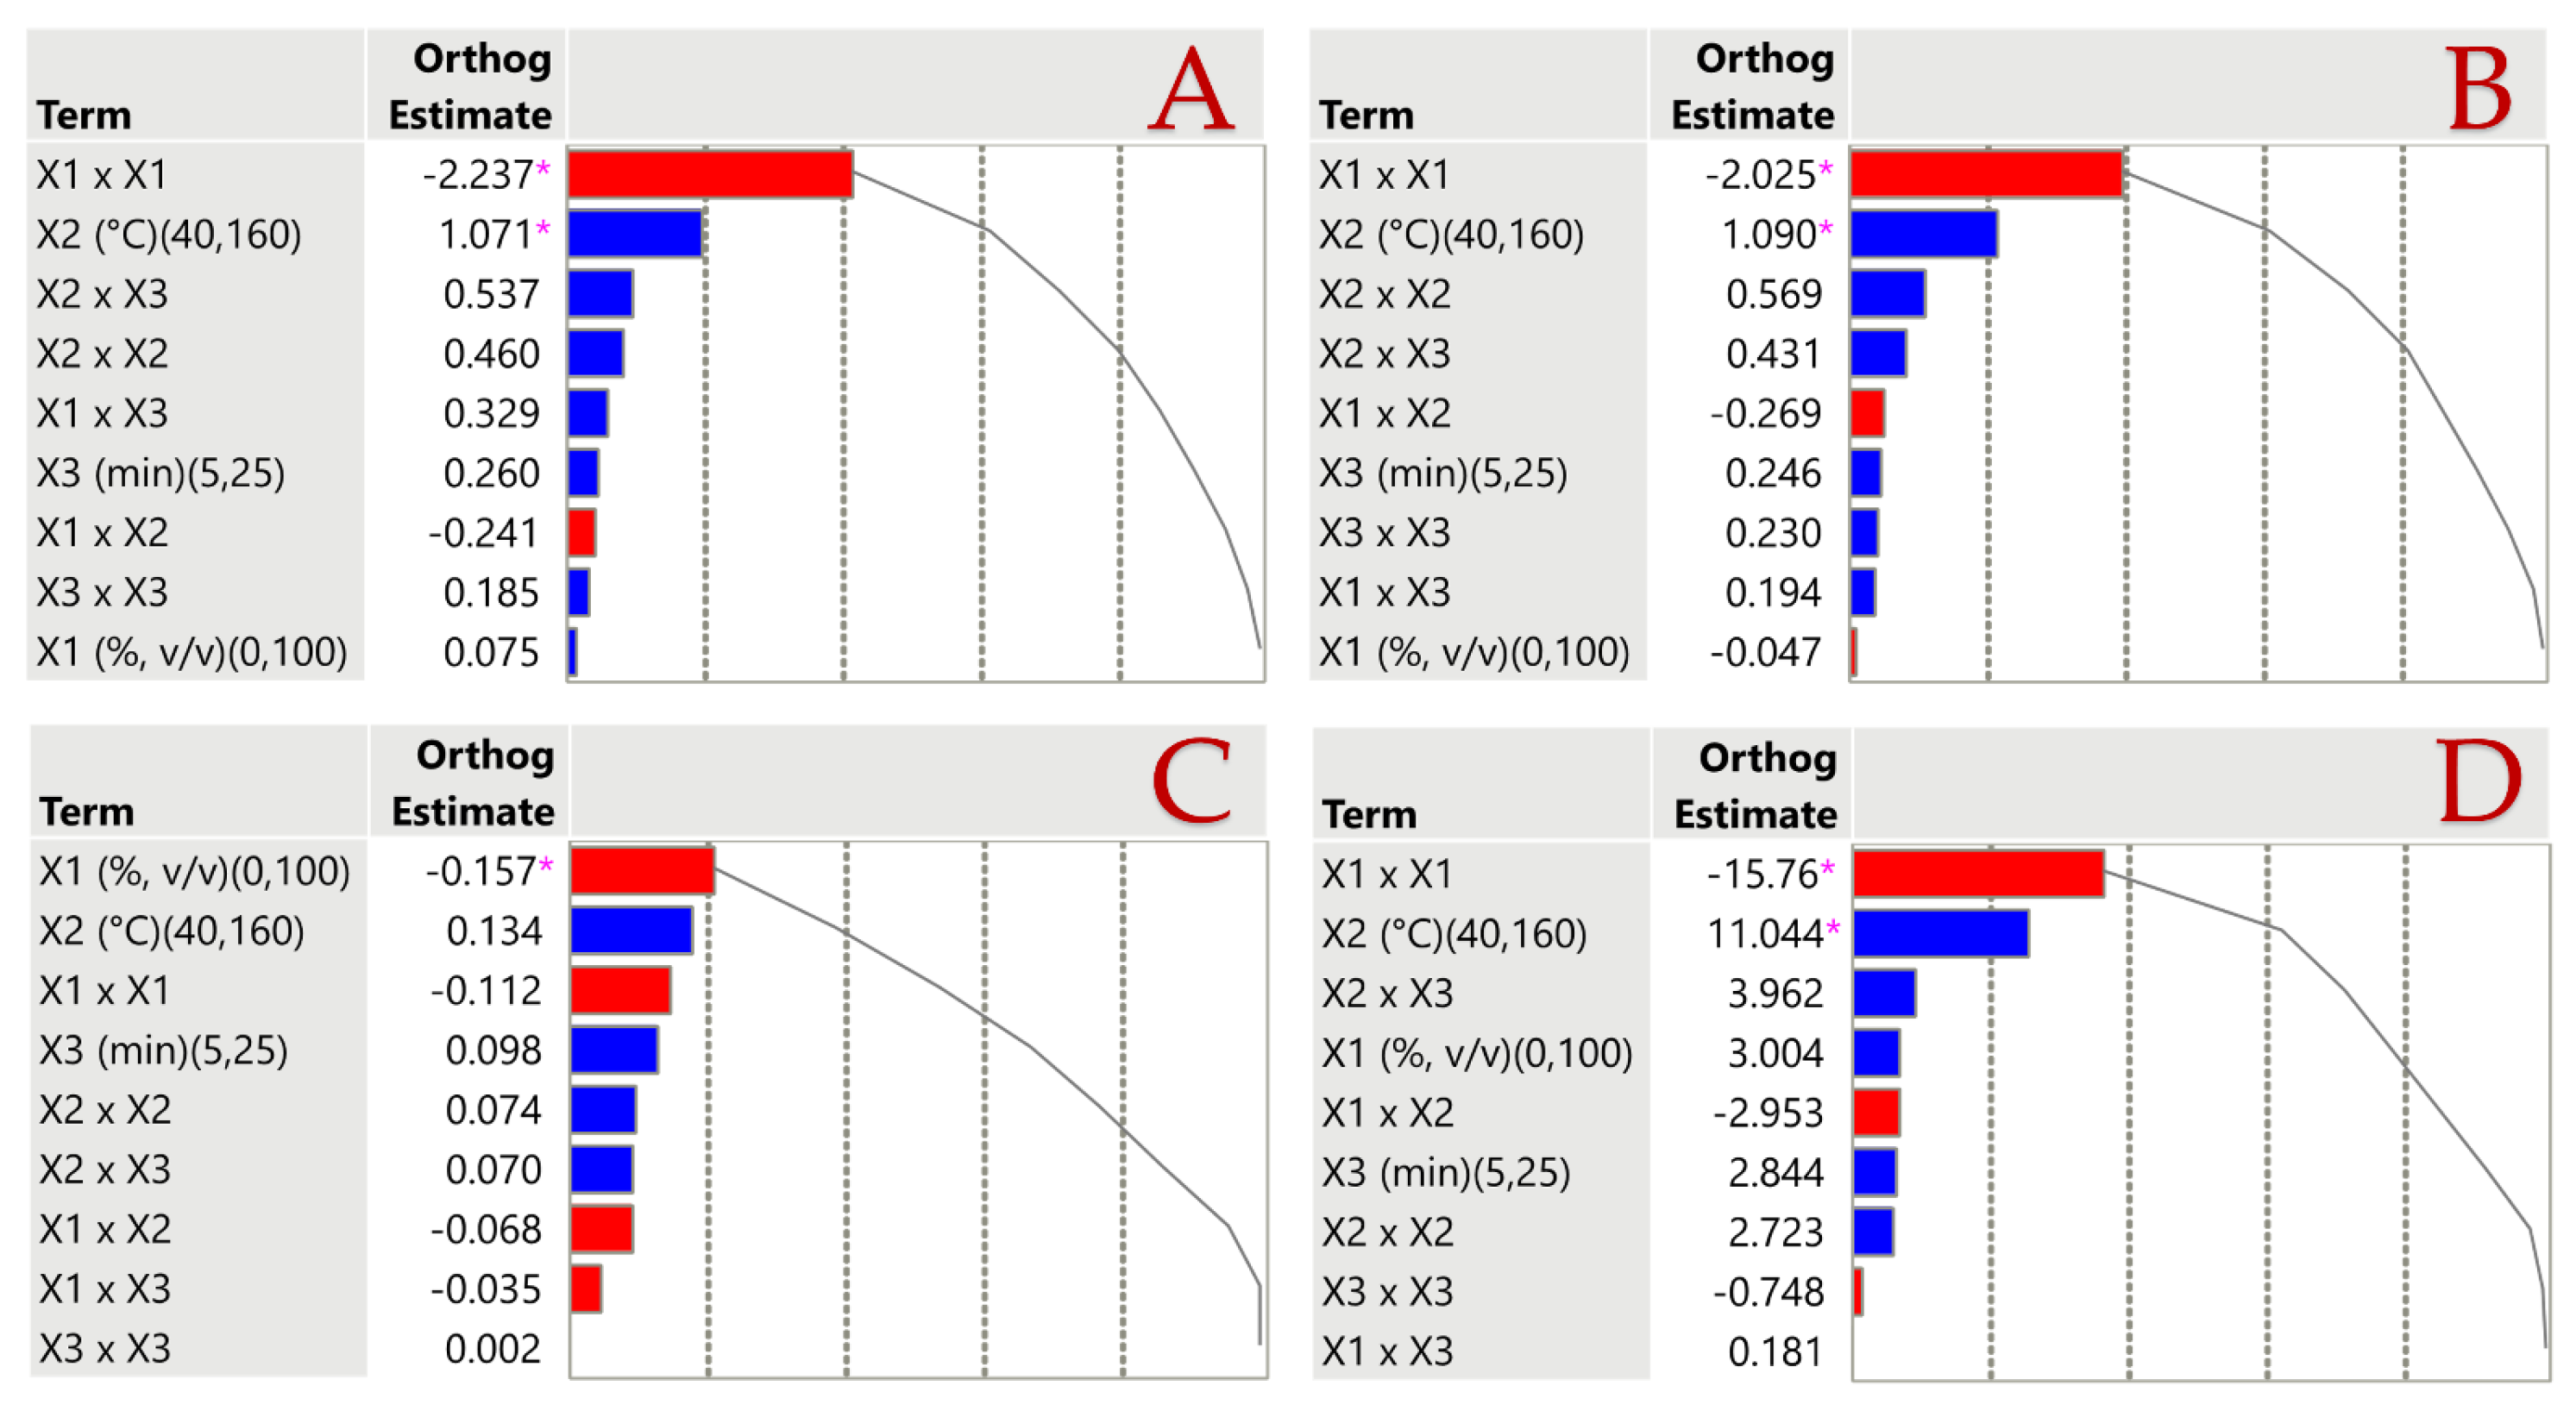
3.3. Statistical Analysis of Extraction Parameters Using Pareto Plots

The statistical evaluation of extraction parameters was conducted using Pareto plots at a significance threshold of p < 0.05. The analysis examined the effects of solvent composition (X1), extraction temperature (X2), and extraction duration (X3) on bioactive compound yield and antioxidant activity. The application of orthogonality techniques yielded orthogonal coded estimates for assessing variable interactions. The Pareto plot results (Figure 1) indicated that X1 negatively impacted all assays, likely due to the strong correlation between extracted polyphenols, caffeine content, and antioxidant properties. Additionally, the interaction of X1 × X1 suggested that higher ethanol concentrations in water hindered compound recovery, while the combination of X1 × X2 similarly influenced TIP and FRAP assays.

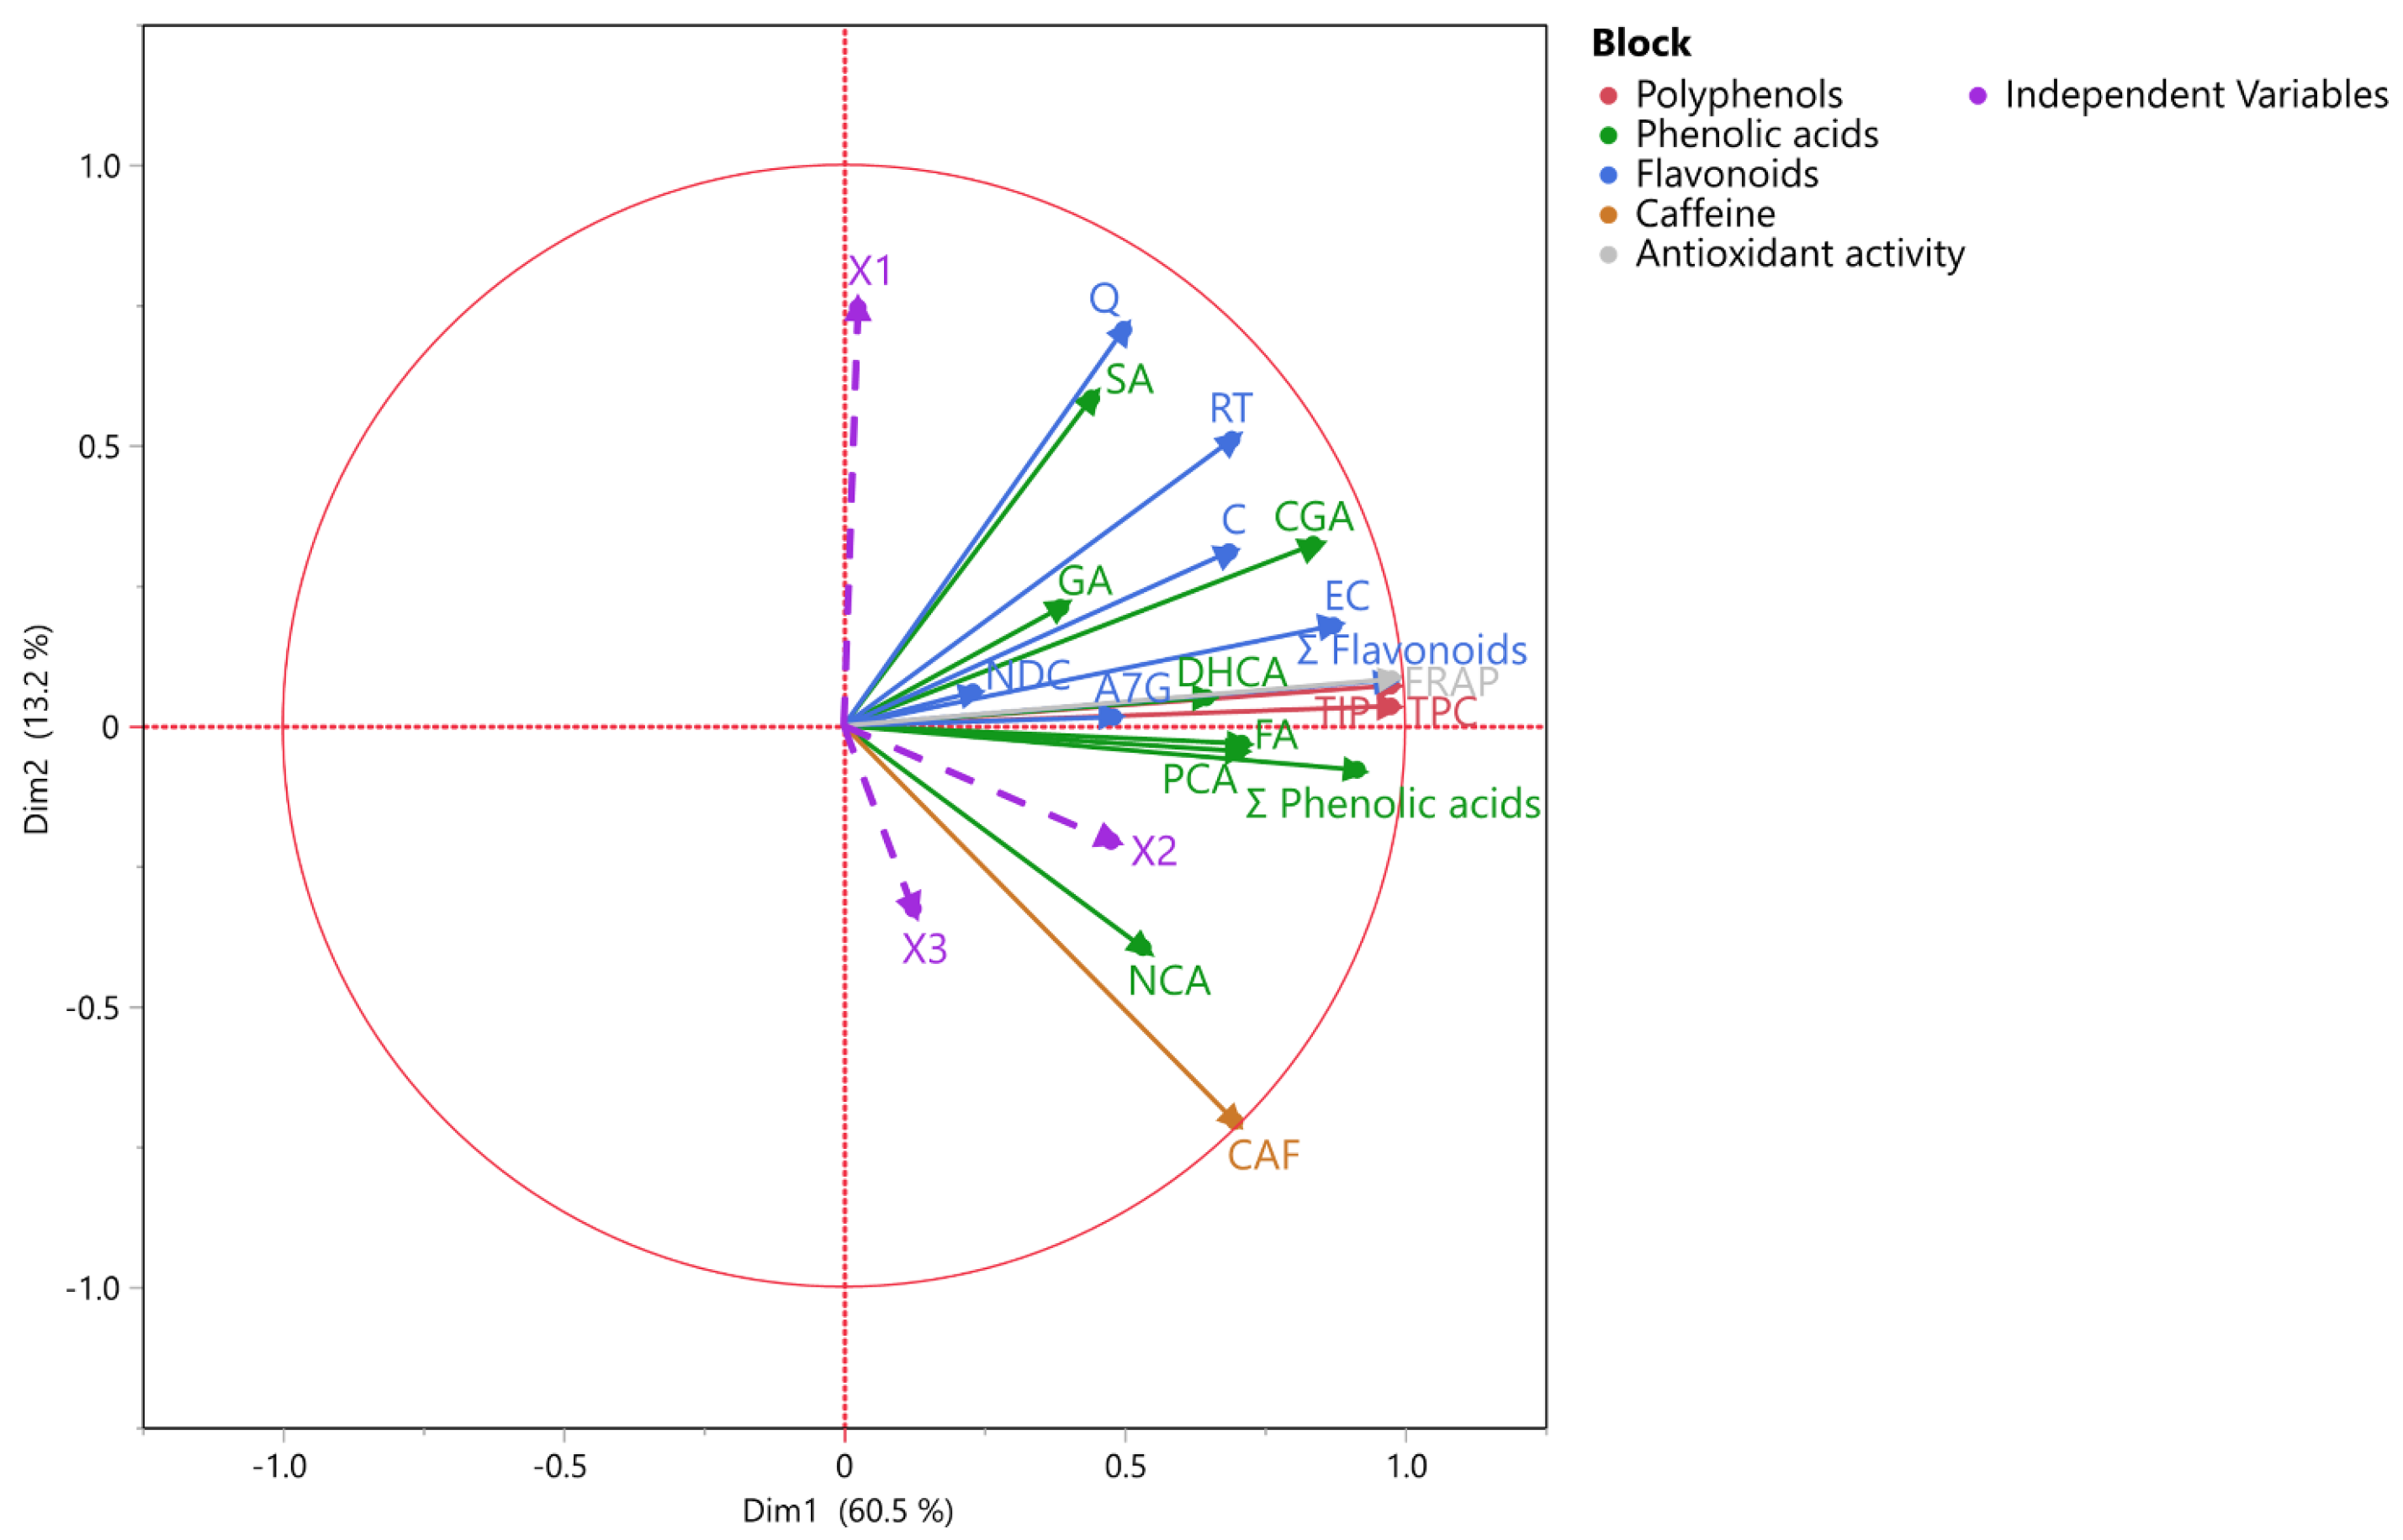
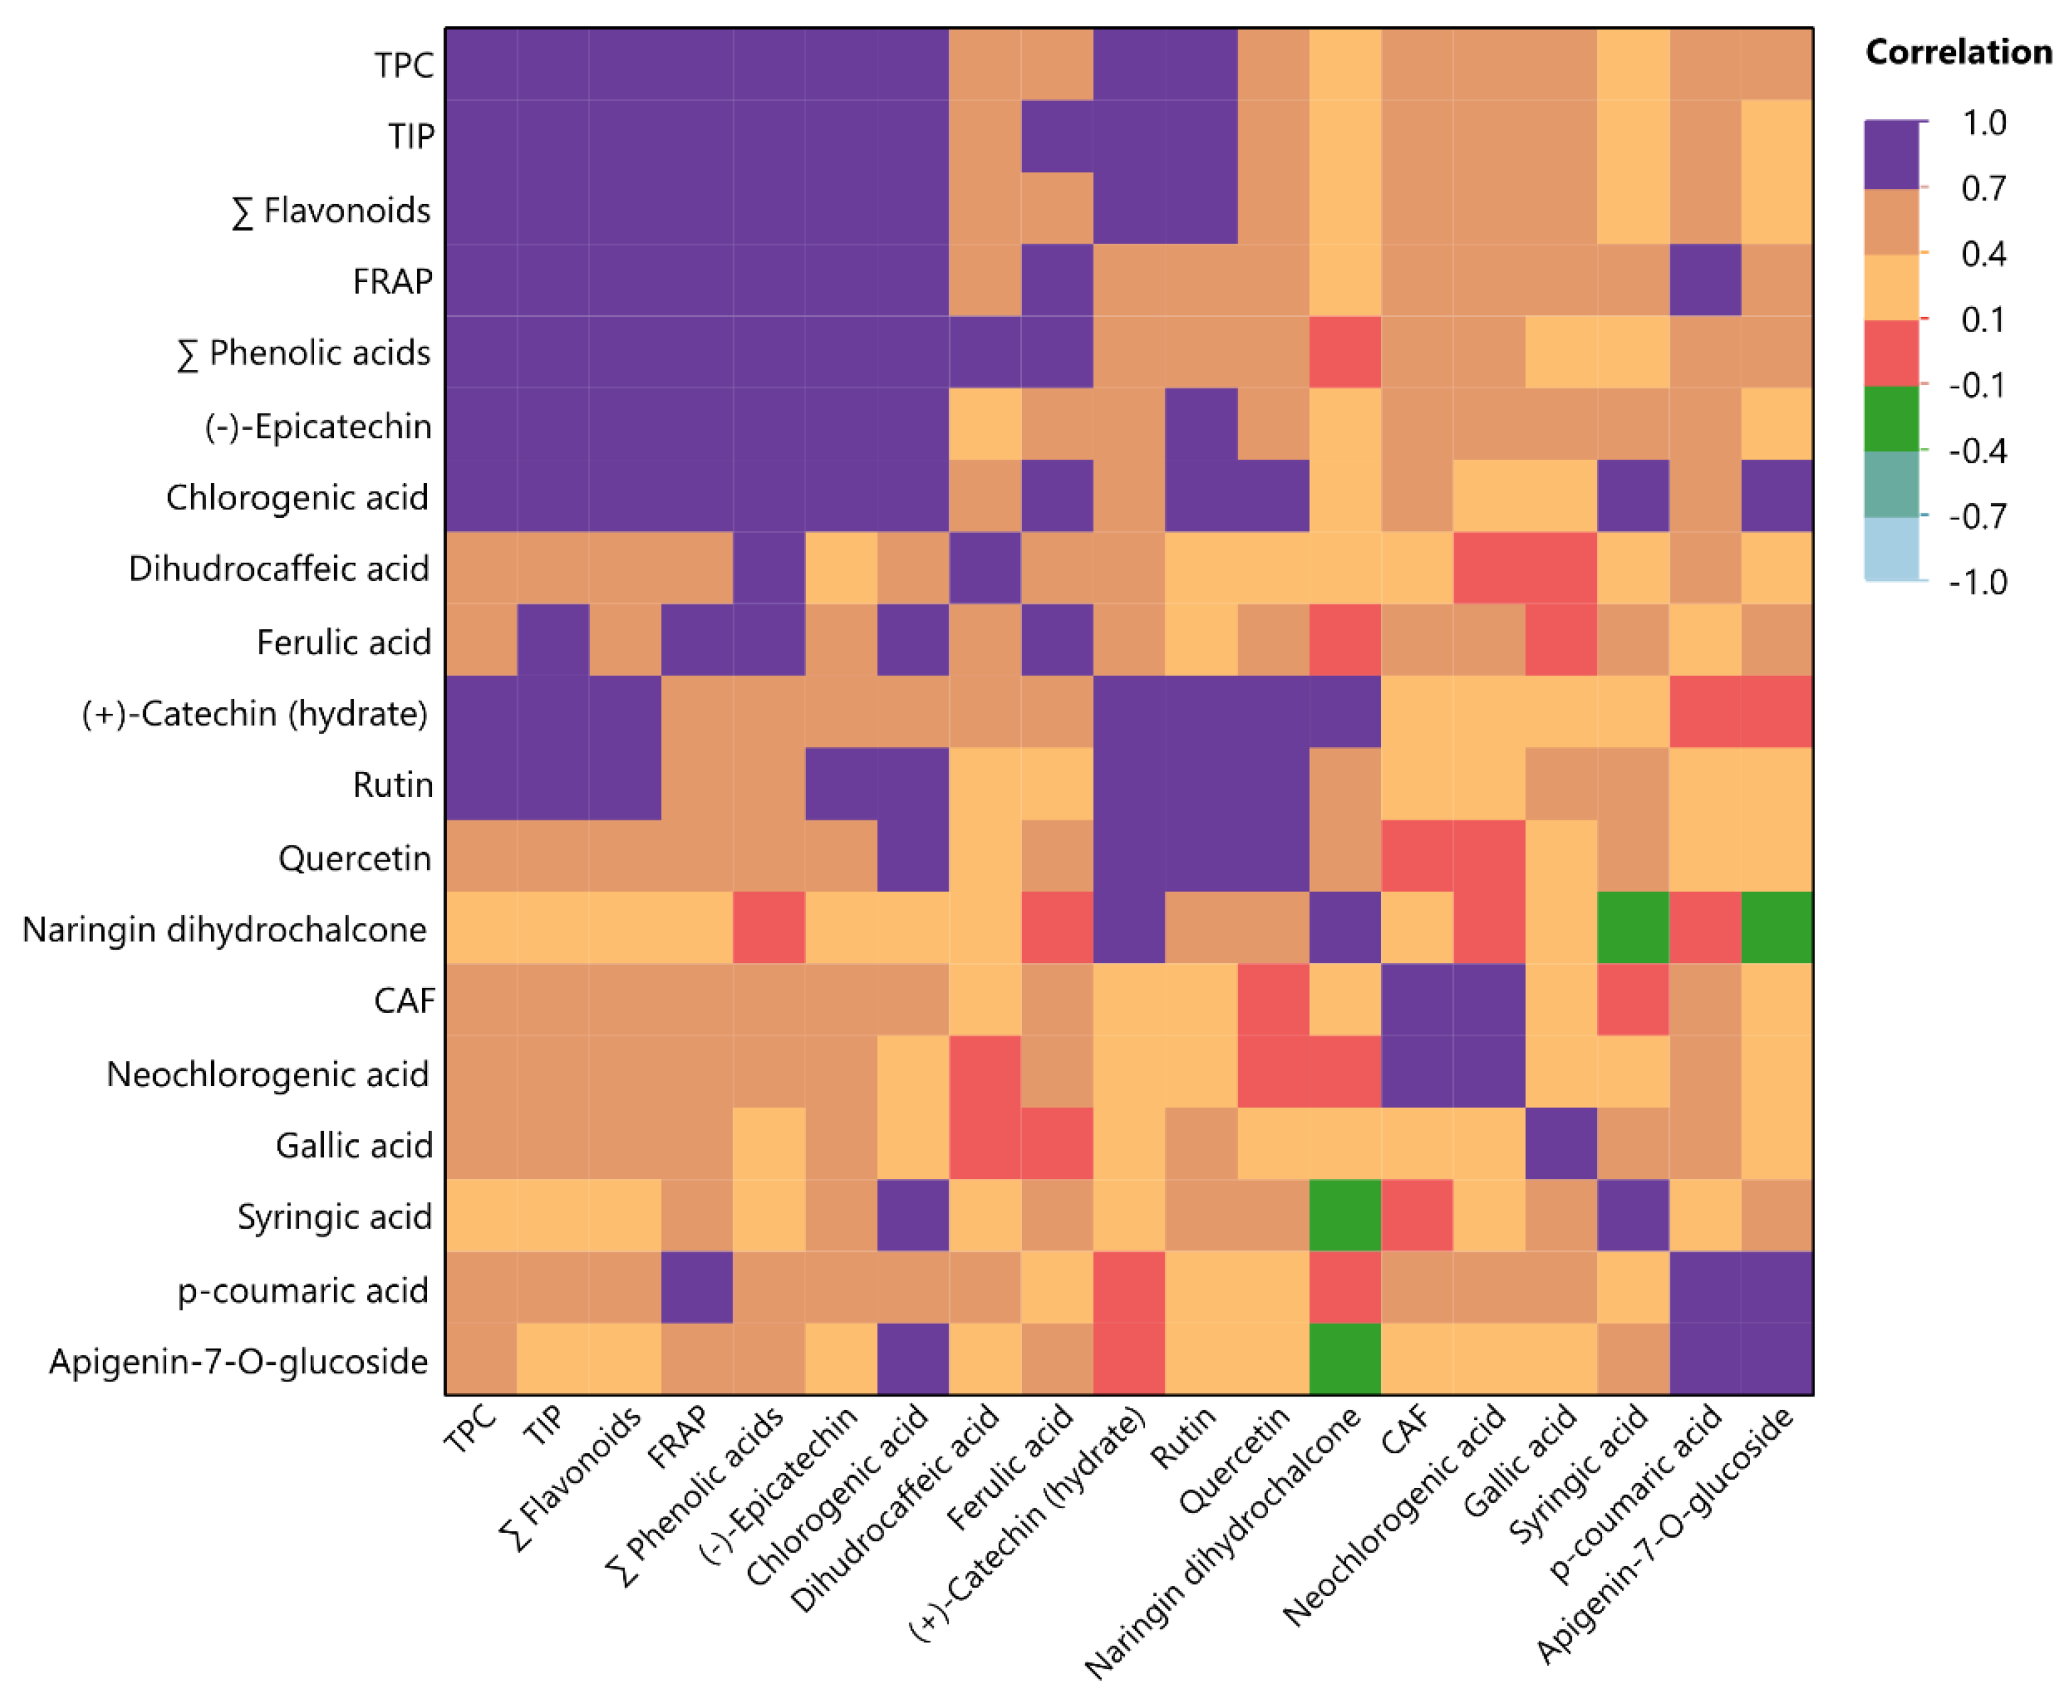
3.4. Analysis of Multiple Factors (MFA) and Multivariate Correlation (MCA)

Multiple Factor Analysis (MFA) is the study of data sets with numerous variables evaluated on the same items. This transforms the variables into orthogonal factors, facilitating the comparison of points of view across many participants. These elements draw attention to the parallels and differences among the objects based on the opinions of the participants. Therefore, the measured variables were examined through MFA, and the results are depicted in Figure 2. The factor scores of each measurement variable on the initial two dimensions account for 60.5% and 13.2% of the total variance, respectively. The graphic additionally incorporates analyzed variables (X1X3), which are indicated based on their levels. Additionally, blocks of similar items are shown, based on how close they are to each other in the factor space. From the results of the MFA, it is clear that all the parameters under investigation have a positive correlation with one another.
As a multivariate extension of the Pearson correlation coefficient, the RV coefficient assesses the linear relationship between two sets of matrices. Within Table 4, a centroid is the mean position of all the points in a data point cluster, therefore indicating the central place within that cluster. The centroid helps in MFA to identify the central tendency of data points connected to a given group.
Multivariate Correlation Analysis (MCA) was applied to further understand the relationships developed between the different parameters, and the results are presented in Figure 3. All assays exhibited a significant positive correlation with each other, as well as caffeine with neochlorogenic acid and chlorogenic acid with ferulic acid. A negative correlation was observed between naringin dihydrochalcone and syringic acid and between naringin dihydrochalcone and apigenin-7-O-glucoside. This is probably due to the different polarity of these compounds, as naringin dihydrochalcone is a more polar compound than the other two. It is also worth noting that the extraction of phenolic acids has no interaction with the extraction of caffeine. This outcome is reasonable, as caffeine is more soluble in water than in ethanol, while the reverse applies for phenolic acids [35].

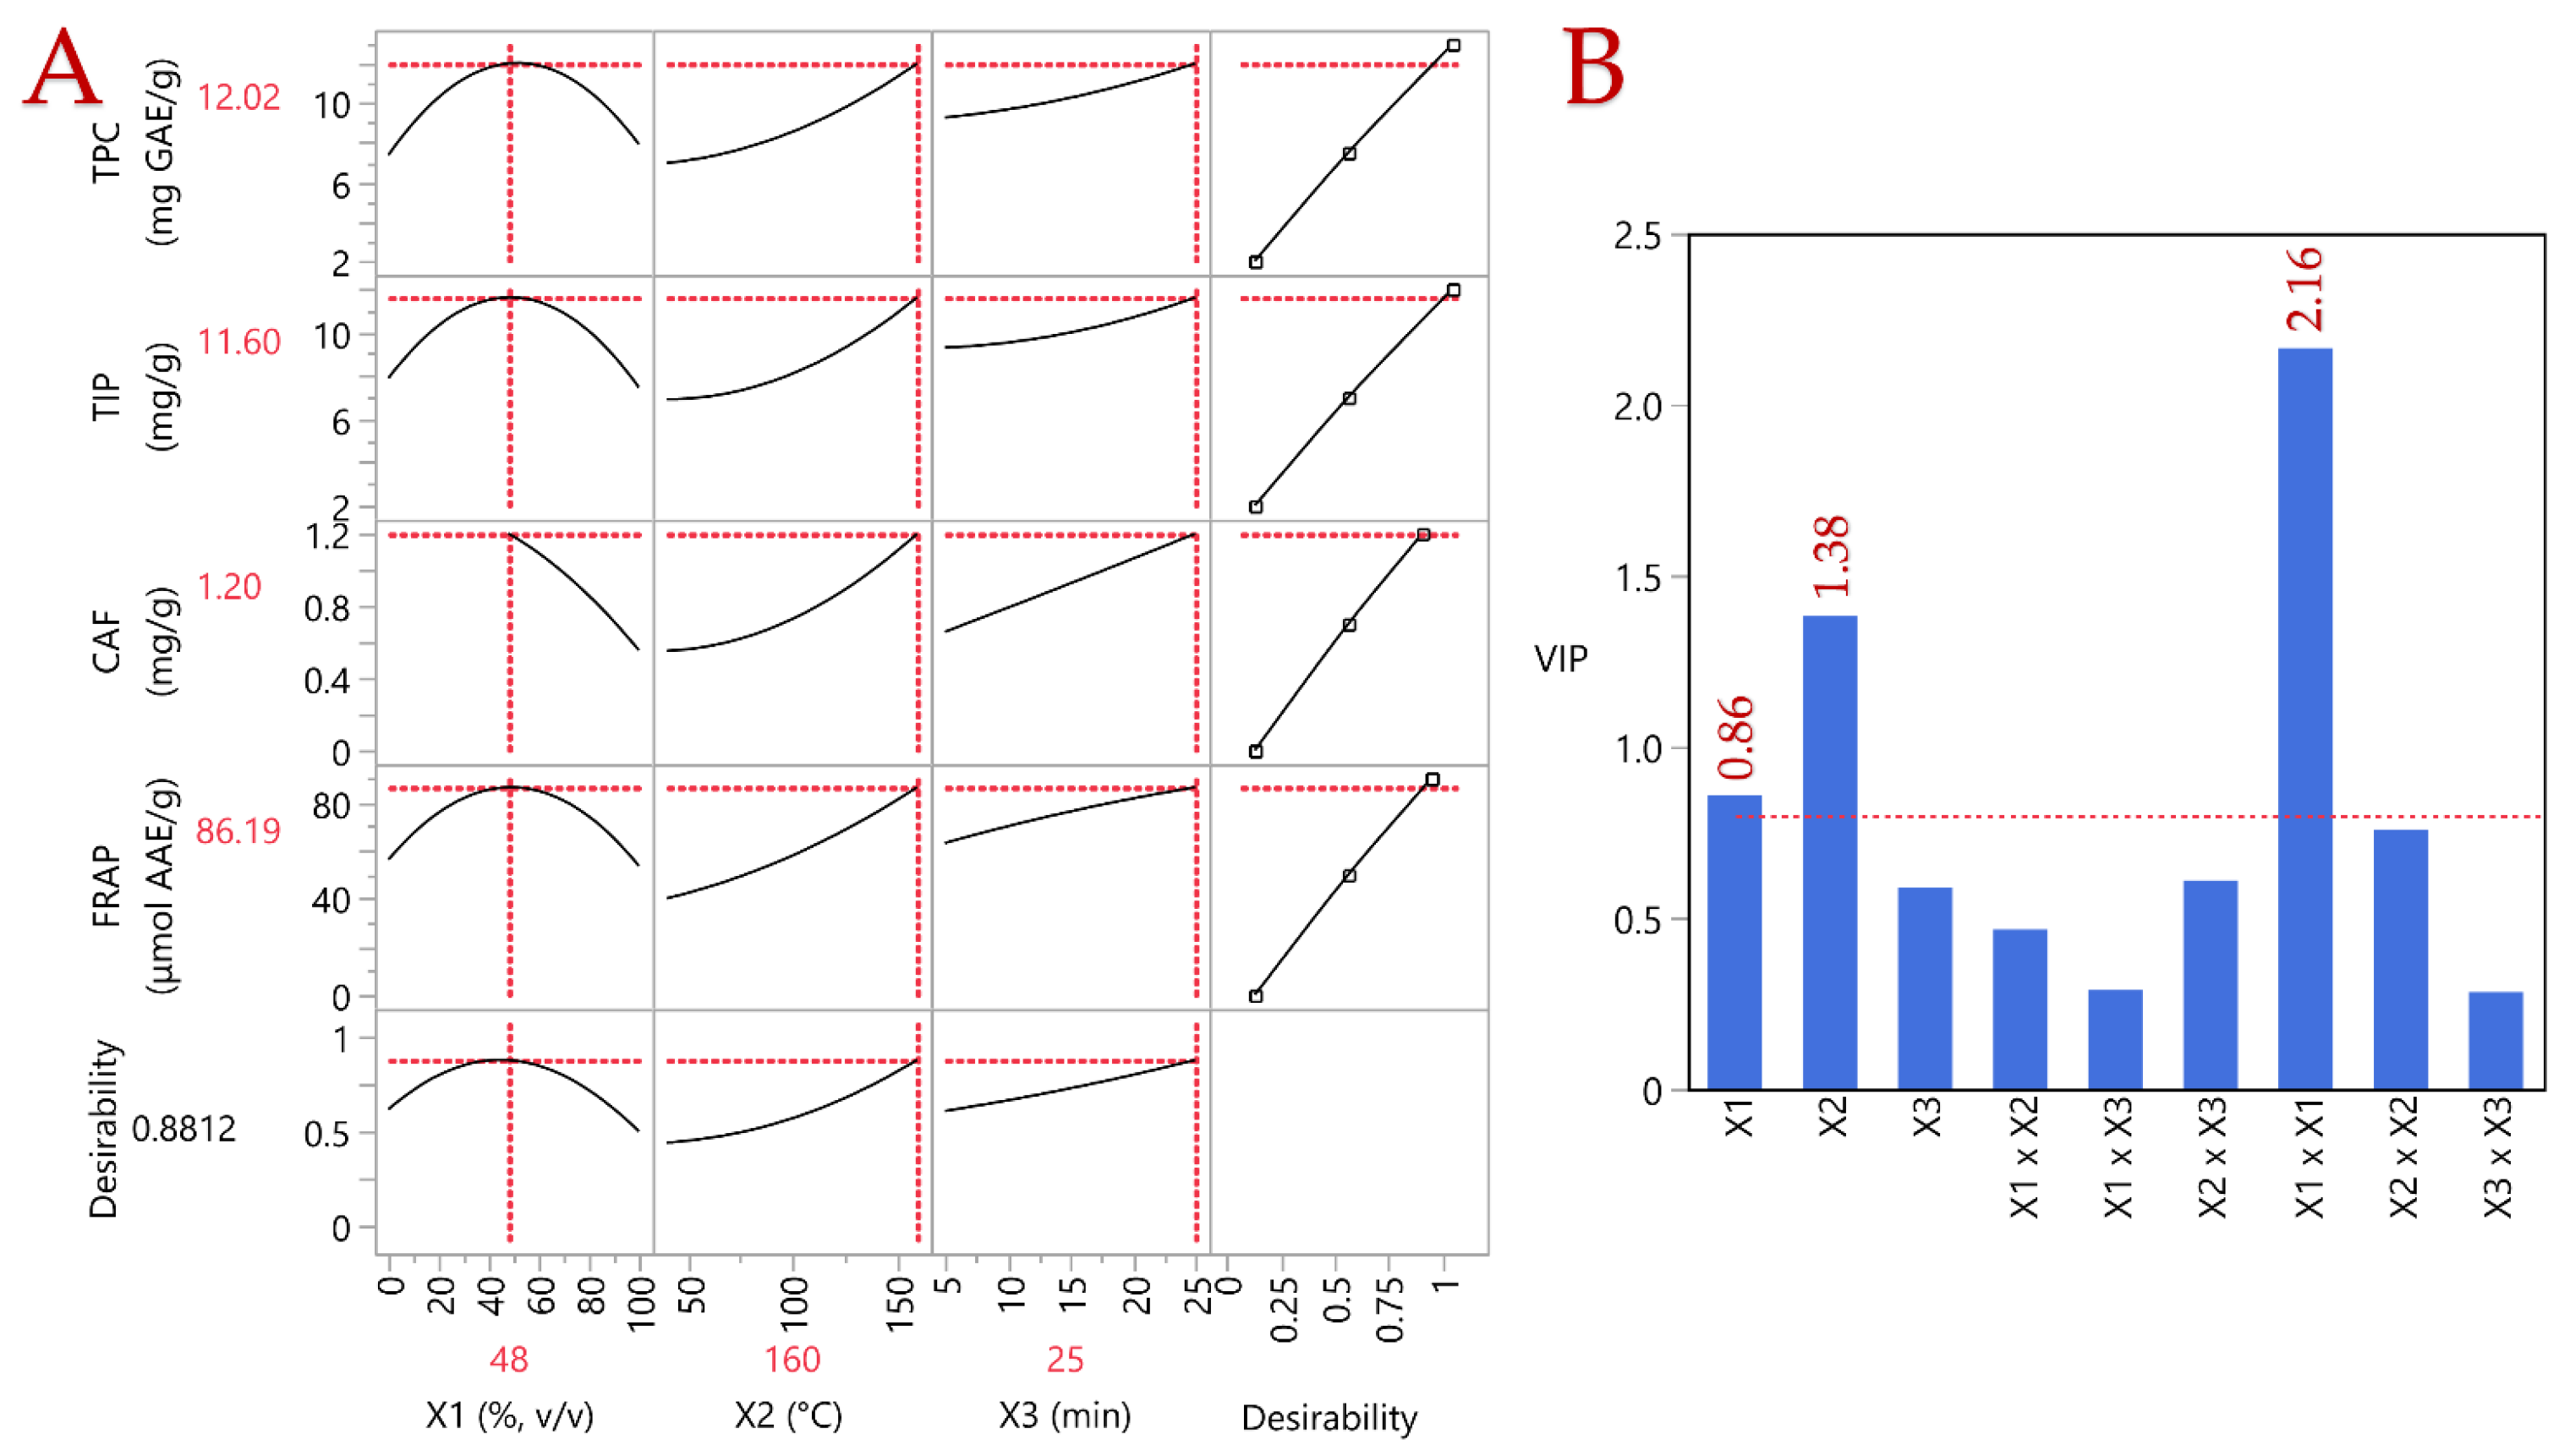
3.5. Partial Least Squares (PLS) Analysis

The influence of the three extraction factors was evaluated using a PLS model. Figure 4A depicts the PLS model employed to generate a correlation loading plot that visually represents the influence of extraction conditions on SCGs. The desirability function indicates a greater contribution from the designated variable when it is greater than 0.8. In Figure 4B a variance importance plot is depicted, in which the significance of parameters X1, X2, and X1 × X2 is highlighted. According to the PLS results, all parameters seem to follow a similar pattern in terms of their maximum returns. Therefore, the optimal extraction conditions were established as follows: 48% v/v aqueous ethanol and extraction at 160 °C for 25 min. Under these conditions, the optimal extraction recoveries through PLE were experimentally found. For comparison, a simple extraction with stirring (STE in a magnetic stirrer manufactured by Heidolph Instruments GmbH & Co. KG, Schwabach, Germany) was also performed, the optimization of which was carried out in another study [36]. The optimal conditions for STE were 48% v/v aqueous ethanol at 80 °C for 120 min. The results of both are shown in Table 5 and Table 6.
The strong correlation coefficient of 0.9985 and the notable coefficient of determination (R2) of 0.997 demonstrate the robust concordance between the experimental and the predicted outcomes of the PLS model. This indicates a reliable explanation of the variations in extraction efficiency and bioactive compound yield. The correlation coefficient elucidates the strength of the relationship between an independent and a dependent variable, whereas R2 (coefficient of determination) delineates the degree to which the variation of one variable accounts for the variance of the other variable. The variation between the actual and predicted values is considered statistically insignificant when the p-value is less than 0.0001, indicating a high level of model accuracy.
Table 5 shows the optimal performances of all assays through PLE and STE. TPC and FRAP showed no significant differences (p > 0.05), while CAF and TIP had a statistically significant difference (p < 0.05), with STE being superior in both cases. The amount of caffeine recovered through PLE is quite satisfactory. For instance, Ramón-Gonçalves et al. [11] reported that only 9 mg/g of caffeine was recovered from SCGs (Arabica coffee) via stirring. Panusa et al. [37] also reported a TPC value of 11.83 mg GAE/g on 100% Arabica decaffeinated SCGs through stirring utilizing 60% v/v aqueous ethanol.
Figure A5 presents a representative chromatograph of polyphenolic compounds and caffeine from the optimal extracts of PLE and STE. This chromatographic profile provides a visual reference for the determined polyphenolic composition. The selection of specific polyphenolic compounds for quantification was based on their presence in the extracts and the availability of reference standards within our research group. To ensure precise determination of polyphenolic concentrations, Table 6 lists the individual phenolic acids and flavonoids identified through HPLC-DAD, while Table 7 provides essential calibration data for each identified compound, including the equation of the calibration curve, the coefficient of determination (R2), retention time, and maximum UV absorption (UVmax). The optimal values of both PLE and STE are provided, and it is observed that both phenolic acids and flavonoids differ significantly from each other. It is noteworthy that while caffeic acid is not found throughout the PLE, it is found in the STE. Mass content of gallic acid, neochlorogenic acid, dihydrocaffeic acid, and ferulic acid also showed significant differences (p < 0.05). As for flavonoids, significant differences (p < 0.05) are observed in (+)-catechin, (−)-epicatechin, and quercetin. Gallic acid, chlorogenic acid, and neochlorogenic acid are all favored by PLE, while dihydrocaffeic acid, ferulic acid, catechin, epicatechin, and quercetin are favored by STE. Noteworthy is the absence of caffeic acid from PLE extracts, which may be attributed to the degradation of the compound under the combination of high pressure and temperature. Previous research has indicated that high pressure itself does not contribute to the degradation of bioactive compounds due to their small molecular size. Instead, it enhances extraction efficiency by facilitating their release from plant matrices [38,39]. Degradation is more likely attributable to prolonged exposure to elevated temperatures during extraction and solvent retention. The differences observed in STE can be explained by the extended duration of compound exposure within the solvent, albeit under moderate temperatures compared with PLE. This likely accounts for the presence of certain compounds in the STE extract that are absent in the PLE extract. Furthermore, while the shorter processing time of PLE offers an economic advantage, it is important to consider the energy required to maintain high pressure and temperature conditions. Evaluating these factors is crucial in assessing the feasibility and cost-effectiveness of the extraction method. The results obtained in the present study are consistent with Ramón-Gonçalves et al. [40], who also identified the same compounds in SCGs through HPLC. Al-Dhabi et al. [41] performed ultrasonication on SCGs utilizing ethanol as a solvent, and they determined 1.43 mg/g of chlorogenic acid in their optimal extract. In our study, this amount was slightly lower than the one determined through aqueous ethanol PLE extraction. Unfortunately, no value for neochlorogenic acid was reported in that study.

4. Conclusions

The present work explored the optimization of SCG extraction conditions via PLE. The optimal results showed that PLE is indeed an ideal extraction method for this by-product because it leads to a recovery in a much shorter period of time that is not significantly different from that of the STE, thus necessitating less energy consumption. The optimal results were TPC ~16 mg GAE/g, TIP ~10 mg/g, caffeine content ~1.2 mg/g, and antioxidant activity through FRAP ~86 μmol AAE/g. Enhanced revenues would be an additional benefit of prolonging the coffee service lifespan if the soluble and instant coffee sectors could further transform SCGs into value-added food products, utilizing biorefinery and circular economy principles. Moreover, these findings may serve as a foundation for the incorporation of this type of bioactive chemical recovery in the food and pharmaceutical sectors. Products obtained from SCGs now have limited usage, but this might shift if novel approaches are applied to extract, fractionate, and purify compounds from SCGs. Additionally, the caffeine included in SCGs might be extracted and utilized to manufacture new beverages, including energy drinks. Furthermore, bioactive compounds in SCGs could be exploited to create beverages or enriched products with health-promoting properties. Pharmaceutical and cosmetic sectors could also utilize the phenolic acids and flavonoids present in SCGs to produce new products from natural sources with high antioxidant activity. Bioactive compounds found in SCGs also have other beneficial and health-promoting properties that could be utilized in those sectors. It is worth noting that this study focused on a single coffee type to streamline experimental conditions and reduce variability. While this approach allowed for consistent and reproducible results, we acknowledge the potential variability associated with other coffee types, which we aim to explore in future studies. Finally, the solid residue left over from the use of SCGs can be reused to create pellets and organic textiles, thus promoting the circular economy and providing a sustainable solution for reducing environmental pollution.

Author Contributions

Conceptualization, V.A. and S.I.L.; methodology, V.A.; software, V.A.; validation, V.A.; formal analysis, M.M. and V.A.; investigation, A.C. and M.M.; resources, S.I.L.; data curation, M.M.; writing—original draft preparation, M.M.; writing—review and editing, V.A., M.M. and S.I.L.; visualization, M.M.; supervision, V.A. and S.I.L.; project administration, S.I.L.; funding acquisition, S.I.L. All authors have read and agreed to the published version of the manuscript.

Funding

This research received no external funding.

Data Availability Statement

The original contributions presented in the study are included in the article; further inquiries can be directed to the corresponding author.

Acknowledgments

The authors would like to acknowledge the MACE coffee store, located in Karditsa (Greece), for providing spent coffee grounds material.

Conflicts of Interest

The authors declare no conflict of interest.

Appendix A

Table A1. The coded and actual values of the three independent variables were assessed in conjunction with the experimental concentration of phenolic acids, expressed in mg/g dry weight.
Design PointIndependent VariablesResponses∑ Phenolic Acids
X1
(C, %)
X2
(T, °C)
X3
(t, min)
GANCADHCACGASAPCAFA
10 (50)0 (100)0 (15)0.150.250.78nd0.560.310.152.20
2−1 (0)0 (100)1 (25)0.080.330.520.240.230.170.131.70
3−1 (0)−1 (40)0 (15)0.150.230.510.420.240.150.091.80
41 (100)0 (100)1 (25)0.12nd0.590.710.520.180.162.27
5−1 (0)0 (100)−1 (5)nd0.270.580.410.350.120.131.86
60 (50)1 (160)−1 (5)nd0.321.041.090.600.270.183.49
70 (50)0 (100)0 (15)0.090.280.990.830.520.140.213.06
81 (100)−1 (40)0 (15)ndnd0.27nd0.690.10nd1.06
90 (50)−1 (40)1 (25)0.180.300.740.680.300.150.142.48
100 (50)1 (160)1 (25)0.210.520.741.170.760.320.183.91
110 (50)−1 (40)−1 (5)0.080.310.651.180.310.19nd2.72
12−1 (0)1 (160)0 (15)nd0.620.630.880.45nd0.222.80
131 (100)0 (100)−1 (5)ndnd0.54nd0.770.17nd1.48
140 (50)0 (100)0 (15)nd0.300.811.180.670.250.193.40
151 (100)1 (160)0 (15)ndnd0.380.600.450.200.141.77
nd: not detected. GA: Gallic acid; NCA: Neochlorogenic acid; DHCA: Dihydrocaffeic acid; CGA: Chlorogenic acid; SA: Syringic acid; PCA: p-Coumaric acid; FA: Ferulic acid.
Table A2. The coded and actual values of the three independent variables were assessed in conjunction with the experimental concentration of flavonoids, expressed in mg/g dry weight.
Design PointIndependent VariablesResponses∑ Flavonoids
X1
(C, %)
X2
(T, °C)
X3
(t, min)
CECRTA7GNDCQ
10 (50)0 (100)0 (15)0.560.750.480.180.680.413.06
2−1 (0)0 (100)1 (25)0.280.260.190.05nd0.160.94
3−1 (0)−1 (40)0 (15)0.630.62ndndndnd1.25
41 (100)0 (100)1 (25)0.72nd0.64nd0.510.562.42
5−1 (0)0 (100)−1 (5)0.440.440.370.020.330.231.82
60 (50)1 (160)−1 (5)0.862.041.260.08nd0.785.02
70 (50)0 (100)0 (15)0.951.641.110.070.690.805.26
81 (100)−1 (40)0 (15)0.66nd0.80ndndnd1.46
90 (50)−1 (40)1 (25)1.141.811.140.011.10nd5.20
100 (50)1 (160)1 (25)0.923.701.720.150.630.807.92
110 (50)−1 (40)−1 (5)0.922.001.24ndnd0.834.99
12−1 (0)1 (160)0 (15)0.892.570.800.10nd0.424.78
131 (100)0 (100)−1 (5)0.74nd1.22ndnd0.802.76
140 (50)0 (100)0 (15)0.712.620.980.09nd0.504.90
151 (100)1 (160)0 (15)0.62nd1.130.010.790.643.20
nd: not detected. C: (+)-Catechin (hydrate); EC: (−)-Epicatechin; RT: Rutin; A7G: Apigenin-7-O-glucoside; NDC: Naringin dihydrochalcone; Q: Quercetin.
Figure A1. The effects of the process variables on the response, specifically the total polyphenol content (TPC, mg GAE/g), are illustrated by 3D graphs that show the optimal extraction of the SCG. In plot (A), X1 (ethanol concentration; C, % v/v) and X2 (extraction temperature; T, °C) are covariant; in plot (B), X1 and X3 (extraction time; t, min) are covariant; in plot (C), X2 and X3 are covariant.
Beverages 11 00074 g0a1
Figure A2. The effects of the process variables on the response, specifically the total identified polyphenols (TIP, mg/g), are illustrated by 3D graphs that show the optimal extraction of the SCG. In plot (A), X1 (ethanol concentration; C, % v/v) and X2 (extraction temperature; T, °C) are covariant; in plot (B), X1 and X3 (extraction time; t, min) are covariant; in plot (C), X2 and X3 are covariant.
Beverages 11 00074 g0a2
Figure A3. The effects of the process variables on the response, specifically the caffeine content (CAF, mg/g), are illustrated by 3D graphs that show the optimal extraction of the SCG. In plot (A), X1 (ethanol concentration; C, % v/v) and X2 (extraction temperature; T, °C) are covariant; in plot (B), X1 and X3 (extraction time; t, min) are covariant; in plot (C), X2 and X3 are covariant.
Beverages 11 00074 g0a3
Figure A4. The effects of the process variables on the response, specifically the ferric-reducing antioxidant power (FRAP, μmol AAE/g), are illustrated by 3D graphs that show the optimal extraction of the SCG. In plot (A), X1 (ethanol concentration; C, % v/v) and X2 (extraction temperature; T, °C) are covariant; in plot (B), X1 and X3 (extraction time; t, min) are covariant; in plot (C), X2 and X3 are covariant.
Beverages 11 00074 g0a4
Figure A5. Representative chromatograph of polyphenolic compounds obtained from the optimal extracts of PLE and STE. It includes two plots: (A), depicting phenolic acids and caffeine measured at 320 nm, and (B), depicting flavonoids at 320 nm. 1: gallic acid; 2: neochlorogenic acid; 3: dihydrocaffeic acid; 4: caffeine; 5: chlorogenic acid; 6: caffeic acid; 7: syringic acid; 8: p-coumaric acid; 9: ferulic acid; 10: (+)-catechin (hydrate); 11: (−)-epicatechin; 12: rutin; 13: apigenin-7-O-glucoside; 14: naringin dihydrochalcone; 15: quercetin.
Beverages 11 00074 g0a5

References

  1. Badr, A.N.; El-Attar, M.M.; Ali, H.S.; Elkhadragy, M.F.; Yehia, H.M.; Farouk, A. Spent Coffee Grounds Valorization as Bioactive Phenolic Source Acquired Antifungal, Anti-Mycotoxigenic, and Anti-Cytotoxic Activities. Toxins 2022, 14, 109. [Google Scholar] [CrossRef] [PubMed]
  2. Dattatraya Saratale, G.; Bhosale, R.; Shobana, S.; Banu, J.R.; Pugazhendhi, A.; Mahmoud, E.; Sirohi, R.; Kant Bhatia, S.; Atabani, A.E.; Mulone, V.; et al. A review on valorization of spent coffee grounds (SCG) towards biopolymers and biocatalysts production. Bioresour. Technol. 2020, 314, 123800. [Google Scholar] [CrossRef] [PubMed]
  3. Okur, I.; Soyler, B.; Sezer, P.; Oztop, M.H.; Alpas, H. Improving the Recovery of Phenolic Compounds from Spent Coffee Grounds (SCG) by Environmentally Friendly Extraction Techniques. Molecules 2021, 26, 613. [Google Scholar] [CrossRef]
  4. International Coffee Organization. International Coffee Organization. Coffee Report and Outlook—December 2023; ICO: London, UK, 2023; Available online: https://icocoffee.org/documents/cy2023-24/Coffee_Report_and_Outlook_December_2023_ICO.pdf (accessed on 16 December 2024).
  5. Efthymiopoulos, I.; Hellier, P.; Ladommatos, N.; Kay, A.; Mills-Lamptey, B. Effect of Solvent Extraction Parameters on the Recovery of Oil from Spent Coffee Grounds for Biofuel Production. Waste Biomass Valor. 2019, 10, 253–264. [Google Scholar] [CrossRef] [PubMed]
  6. Wu, C.-T.; Agrawal, D.C.; Huang, W.-Y.; Hsu, H.-C.; Yang, S.-J.; Huang, S.-L.; Lin, Y.-S. Functionality Analysis of Spent Coffee Ground Extracts Obtained by the Hydrothermal Method. J. Chem. 2019, 2019, 4671438. [Google Scholar] [CrossRef]
  7. Franca, A.S.; Oliveira, L.S. Potential Uses of Spent Coffee Grounds in the Food Industry. Foods 2022, 11, 2064. [Google Scholar] [CrossRef]
  8. Mitraka, G.-C.; Kontogiannopoulos, K.N.; Batsioula, M.; Banias, G.F.; Assimopoulou, A.N. Spent Coffee Grounds’ Valorization towards the Recovery of Caffeine and Chlorogenic Acid: A Response Surface Methodology Approach. Sustainability 2021, 13, 8818. [Google Scholar] [CrossRef]
  9. Gigliobianco, M.R.; Campisi, B.; Vargas Peregrina, D.; Censi, R.; Khamitova, G.; Angeloni, S.; Caprioli, G.; Zannotti, M.; Ferraro, S.; Giovannetti, R.; et al. Optimization of the Extraction from Spent Coffee Grounds Using the Desirability Approach. Antioxidants 2020, 9, 370. [Google Scholar] [CrossRef]
  10. Massaya, J.; Prates Pereira, A.; Mills-Lamptey, B.; Benjamin, J.; Chuck, C.J. Conceptualization of a spent coffee grounds biorefinery: A review of existing valorisation approaches. Food Bioprod. Process. 2019, 118, 149–166. [Google Scholar] [CrossRef]
  11. Ramón-Gonçalves, M.; Gómez-Mejía, E.; Rosales-Conrado, N.; León-González, M.E.; Madrid, Y. Extraction, identification and quantification of polyphenols from spent coffee grounds by chromatographic methods and chemometric analyses. Waste Manag. 2019, 96, 15–24. [Google Scholar] [CrossRef]
  12. Solomakou, N.; Loukri, A.; Tsafrakidou, P.; Michaelidou, A.-M.; Mourtzinos, I.; Goula, A.M. Recovery of phenolic compounds from spent coffee grounds through optimized extraction processes. Sustain. Chem. Pharm. 2022, 25, 100592. [Google Scholar] [CrossRef]
  13. Haile, M. Integrated volarization of spent coffee grounds to biofuels. Biofuels Res. J. 2014, 2, 65–69. [Google Scholar] [CrossRef]
  14. Bae, J.-H.; Park, J.-H.; Im, S.-S.; Song, D.-K. Coffee and health. Integr. Med. Res. 2014, 3, 189–191. [Google Scholar] [CrossRef]
  15. Costabile, A.; Sarnsamak, K.; Hauge-Evans, A.C. Coffee, type 2 diabetes and pancreatic islet function—A mini-review. J. Funct. Foods 2018, 45, 409–416. [Google Scholar] [CrossRef]
  16. Montenegro, J.; dos Santos, L.S.; de Souza, R.G.G.; Lima, L.G.B.; Mattos, D.S.; Viana, B.P.P.B.; da Fonseca Bastos, A.C.S.; Muzzi, L.; Conte-Júnior, C.A.; Gimba, E.R.P.; et al. Bioactive compounds, antioxidant activity and antiproliferative effects in prostate cancer cells of green and roasted coffee extracts obtained by microwave-assisted extraction (MAE). Food Res. Int. 2021, 140, 110014. [Google Scholar] [CrossRef]
  17. AlAmri, O.D.; Albeltagy, R.S.; Akabawy, A.M.A.; Mahgoub, S.; Abdel-Mohsen, D.M.; Abdel Moneim, A.E.; Amin, H.K. Investigation of antioxidant and anti-inflammatory activities as well as the renal protective potential of green coffee extract in high fat-diet/streptozotocin-induced diabetes in male albino rats. J. Funct. Foods 2020, 71, 103996. [Google Scholar] [CrossRef]
  18. Sedaghat, G.; Mirshekar, M.A.; Amirpour, M.; Montazerifar, F.; Miri, S.; Shourestani, S. Sub-chronic administration of brewed coffee on rat behavior and cognition and oxidative stress Alzheimer’s disease model. Clin. Nutr. Exp. 2019, 28, 62–73. [Google Scholar] [CrossRef]
  19. Grzelczyk, J.; Budryn, G.; Peña-García, J.; Szwajgier, D.; Gałązka-Czarnecka, I.; Oracz, J.; Pérez-Sánchez, H. Evaluation of the inhibition of monoamine oxidase A by bioactive coffee compounds protecting serotonin degradation. Food Chem. 2021, 348, 129108. [Google Scholar] [CrossRef]
  20. Zhu, M.; Jatoi, A. Colorectal Cancer, Crohn-Like Lymphoid Reactions, Survival—And the Power of a Good Cup of Coffee! Mayo Clin. Proc. 2022, 97, 15–17. [Google Scholar] [CrossRef]
  21. LIczbiński, P.; Bukowska, B. Tea and coffee polyphenols and their biological properties based on the latest in vitro investigations. Ind. Crops Prod. 2022, 175, 114265. [Google Scholar] [CrossRef]
  22. Lara-Guzmán, O.J.; Álvarez, R.; Muñoz-Durango, K. Changes in the plasma lipidome of healthy subjects after coffee consumption reveal potential cardiovascular benefits: A randomized controlled trial. Free Radic. Biol. Med. 2021, 176, 345–355. [Google Scholar] [CrossRef] [PubMed]
  23. Açıkalın, B.; Sanlier, N. Coffee and its effects on the immune system. Trends Food Sci. Technol. 2021, 114, 625–632. [Google Scholar] [CrossRef]
  24. Lefebvre, T.; Destandau, E.; Lesellier, E. Selective extraction of bioactive compounds from plants using recent extraction techniques: A review. J. Chromatogr. A 2021, 1635, 461770. [Google Scholar] [CrossRef]
  25. Martinez, A.S.; Lanaridi, O.; Stagel, K.; Halbwirth, H.; Schnürch, M.; Bica-Schröder, K. Extraction techniques for bioactive compounds of cannabis. Nat. Prod. Rep. 2023, 40, 676–717. [Google Scholar] [CrossRef] [PubMed]
  26. Picot-Allain, C.; Mahomoodally, M.F.; Ak, G.; Zengin, G. Conventional versus green extraction techniques—A comparative perspective. Curr. Opin. Food Sci. 2021, 40, 144–156. [Google Scholar] [CrossRef]
  27. Araujo, M.N.; dos Santos, K.C.; do Carmo Diniz, N.; de Carvalho, J.C.; Corazza, M.L. A biorefinery approach for spent coffee grounds valorization using pressurized fluid extraction to produce oil and bioproducts: A systematic review. Bioresour. Technol. Rep. 2022, 18, 101013. [Google Scholar] [CrossRef]
  28. Shang, Y.-F.; Xu, J.-L.; Lee, W.-J.; Um, B.-H. Antioxidative polyphenolics obtained from spent coffee grounds by pressurized liquid extraction. S. Afr. J. Bot. 2017, 109, 75–80. [Google Scholar] [CrossRef]
  29. Mariotti-Celis, M.S.; Martínez-Cifuentes, M.; Huamán-Castilla, N.; Vargas-González, M.; Pedreschi, F.; Pérez-Correa, J.R. The Antioxidant and Safety Properties of Spent Coffee Ground Extracts Impacted by the Combined Hot Pressurized Liquid Extraction–Resin Purification Process. Molecules 2018, 23, 21. [Google Scholar] [CrossRef]
  30. Bitencourt, R.G.; Mello, F.M.P.A.; Cabral, F.A.; Meirelles, A.J.A. High-pressure fractionation of spent coffee grounds oil using green solvents. J. Supercrit. Fluids 2020, 157, 104689. [Google Scholar] [CrossRef]
  31. Kalompatsios, D.; Athanasiadis, V.; Mantiniotou, M.; Lalas, S.I. Optimization of Ultrasonication Probe-Assisted Extraction Parameters for Bioactive Compounds from Opuntia macrorhiza Using Taguchi Design and Assessment of Antioxidant Properties. Appl. Sci. 2024, 14, 10460. [Google Scholar] [CrossRef]
  32. Thoo, Y.; Ng, S.Y.; Khoo, M.; Mustapha, W.; Ho, C. A binary solvent extraction system for phenolic antioxidants and its application to the estimation of antioxidant capacity in Andrographis paniculata extracts. Int. Food Res. J. 2013, 20, 1103–1111. [Google Scholar]
  33. Athanasiadis, V.; Chatzimitakos, T.; Makrygiannis, I.; Kalompatsios, D.; Bozinou, E.; Lalas, S.I. Antioxidant-Rich Extracts from Lemon Verbena (Aloysia citrodora L.) Leaves through Response Surface Methodology. Oxygen 2024, 4, 1–19. [Google Scholar] [CrossRef]
  34. Chemat, F.; Rombaut, N.; Meullemiestre, A.; Turk, M.; Perino, S.; Fabiano-Tixier, A.-S.; Abert-Vian, M. Review of Green Food Processing techniques. Preservation, transformation, and extraction. Innov. Food Sci. Emerg. Technol. 2017, 41, 357–377. [Google Scholar] [CrossRef]
  35. Zhong, J.; Tang, N.; Asadzadeh, B.; Yan, W. Measurement and Correlation of Solubility of Theobromine, Theophylline, and Caffeine in Water and Organic Solvents at Various Temperatures. J. Chem. Eng. Data 2017, 62, 2570–2577. [Google Scholar] [CrossRef]
  36. Chatzimitakos, T.; Athanasiadis, V.; Kotsou, K.; Palaiogiannis, D.; Bozinou, E.; Lalas, S.I. Optimized Isolation Procedure for the Extraction of Bioactive Compounds from Spent Coffee Grounds. Appl. Sci. 2023, 13, 2819. [Google Scholar] [CrossRef]
  37. Panusa, A.; Zuorro, A.; Lavecchia, R.; Marrosu, G.; Petrucci, R. Recovery of Natural Antioxidants from Spent Coffee Grounds. J. Agric. Food Chem. 2013, 61, 4162–4168. [Google Scholar] [CrossRef]
  38. Khan, S.A.; Aslam, R.; Makroo, H.A. High pressure extraction and its application in the extraction of bio-active compounds: A review. J. Food Process Eng. 2019, 42, e12896. [Google Scholar] [CrossRef]
  39. Xi, J. Ultrahigh pressure extraction of bioactive compounds from plants—A review. Crit. Rev. Food Sci. Nutr. 2017, 57, 1097–1106. [Google Scholar] [CrossRef]
  40. Ramón-Gonçalves, M.; Alcaraz, L.; Pérez-Ferreras, S.; León-González, M.E.; Rosales-Conrado, N.; López, F.A. Extraction of polyphenols and synthesis of new activated carbon from spent coffee grounds. Sci. Rep. 2019, 9, 17706. [Google Scholar] [CrossRef]
  41. Al-Dhabi, N.A.; Ponmurugan, K.; Maran Jeganathan, P. Development and validation of ultrasound-assisted solid-liquid extraction of phenolic compounds from waste spent coffee grounds. Ultrason. Sonochem. 2017, 34, 206–213. [Google Scholar] [CrossRef]
Figure 1. Pareto plots illustrate the significance of each parameter estimate in the pressurized liquid extraction (PLE) technique for TPC (A), TIP (B), CAF (C), and FRAP assays (D). A pink asterisk marks the significance level (p < 0.05) on the plot. Red bars indicate negative values, and blue bars indicate positive values.
Beverages 11 00074 g001
Figure 2. Multiple factor analysis (MFA) for the measured parameters is organized into blocks, with each X variable displayed in the plot. The Polyphenols block includes TPC (total polyphenol content) and TIP (total identified polyphenols). The phenolic acids block encompasses the sum of phenolic acids (GA: gallic acid; NCA: neochlorogenic acid; DHCA: dihydrocaffeic acid; CGA: chlorogenic acid; SA: syringic acid; PCA: p-coumaric acid; FA: ferulic acid). The Flavonoids block contains the sum of flavonoids (C: (+)-Catechin (hydrate); EC: (−)-Epicatechin; RT: Rutin; A7G: Apigenin-7-O-glucoside; NDC: Naringin dihydrochalcone; Q: Quercetin). The caffeine block represents the caffeine content (CAF), and the antioxidant activity block measures the ferric-reducing antioxidant power (FRAP).
Beverages 11 00074 g002
Figure 3. Multivariate correlation analysis of measured variables. TPC, total polyphenol content; TIP, total identified polyphenols; CAF, caffeine content; FRAP, ferric reducing antioxidant power.
Beverages 11 00074 g003
Figure 4. Plot (A) presents the optimization process for the PLE technique using SCG extract. It utilizes a desirability function that integrates extrapolation control with a partial least squares (PLS) prediction profiler to enhance extraction efficiency. The significance of predictor variables in the PLE technique was assessed using a Variable Importance Plot (VIP) displayed in Plot (B), where a red dashed line marks the 0.8 significance level.
Beverages 11 00074 g004
Table 1. Experimental results detailing the impact of three independent variables on the responses of the dependent variables in the pressurized liquid extraction (PLE) technique.
Design PointIndependent VariablesResponses
X1 (C, %)X2 (T, °C)X3 (t, min)TPC
(mg GAE/g)
TIP
(mg/g)
CAF
(mg/g)
FRAP
(μmol AAE/g)
10 (50)0 (100)0 (15)6.325.270.5151.09
2−1 (0)0 (100)1 (25)2.112.640.7712.44
3−1 (0)−1 (40)0 (15)2.963.050.3210.35
41 (100)0 (100)1 (25)5.314.700.3033.28
5−1 (0)0 (100)−1 (5)3.633.680.3013.07
60 (50)1 (160)−1 (5)8.498.520.5458.86
70 (50)0 (100)0 (15)8.318.310.4847.57
81 (100)−1 (40)0 (15)2.382.520.0618.10
90 (50)−1 (40)1 (25)7.787.680.6544.80
100 (50)1 (160)1 (25)12.2411.831.0189.71
110 (50)−1 (40)−1 (5)8.197.710.7244.64
12−1 (0)1 (160)0 (15)7.387.581.2352.71
131 (100)0 (100)−1 (5)4.284.240.1032.51
140 (50)0 (100)0 (15)8.928.300.7468.30
151 (100)1 (160)0 (15)4.934.970.4437.59
TPC, total polyphenol content; TIP, total identified polyphenols; CAF, caffeine content; FRAP, ferric reducing antioxidant power.
Table 2. ANOVA for the quadratic polynomial model of the response surface for the pressurized liquid extraction (PLE) technique.
FactorTPCTIPCAFFRAP
Least squares regression
Intercept7.850 *7.293 *0.577 *55.653 *
X1—solvent concentration0.102−0.065−0.215 *4.114
X2—temperature1.466 *1.493 *0.18415.123 *
X3—extraction time0.3560.3380.1343.894
X1X2−0.47−0.520−0.133−5.718
X1X30.6370.375−0.0680.350
X2X31.040.8350.1357.673
X12−4.390 *−3.942 *−0.213−31.32 *
X220.9531.1780.1495.356
X320.3730.4630.004−1.507
ANOVA
F-value (model)4.7873.9653.0445.385
F-value (lack of fit)1.5080.7082.9851.094
p-Value (model)0.0497 *0.0718 ns0.1165 ns0.0392 *
p-Value (lack of fit)0.4226 ns0.6305 ns0.2610 ns0.5102 ns
R20.8960.8770.8460.906
Adjusted R20.7090.6560.5680.738
RMSE1.5531.5910.21111.401
PRESS142.09118.132.9907015.5
CV46.3044.7158.8054.34
DF (total)14141414
* The observed differences were statistically meaningful at a 95% confidence level (p < 0.05). TPC, total polyphenol content; TIP, total identified polyphenols; CAF, caffeine content; FRAP, ferric reducing antioxidant power; ns, non-significant; F-value, test for comparing model variance with residual (error) variance; p-value, probability of seeing the observed F-value if the null hypothesis is true; RMSE, root mean square error; PRESS, predicted residual error sum of squares; CV, coefficient of variation; DF, degrees of freedom.
Table 3. Optimum extraction conditions and maximum predicted responses for the dependent variables.
ParametersX1
(C, %)
X2
(T, °C)
X3
(t, min)
DesirabilityLeast Squares Regression
TPC (mg GAE/g)50160250.896912.04 ± 3.46
TIP (mg/g)50160250.943211.6 ± 3.54
CAF (mg/g)21160230.90451.29 ± 0.45
FRAP (μmol AAE/g)50160250.847486.19 ± 25.38
Table 4. The similarity between the two sets of parameters is measured by RV correlations.
ParameterPolyphenolsPhenolic AcidsFlavonoidsCaffeineAntioxidant ActivityCentroid
Polyphenols-0.7480.7080.4080.8930.921
Phenolic acids -0.5950.3800.8270.877
Flavonoids -0.2030.6570.781
Caffeine -0.3680.572
Antioxidant activity -0.920
Centroid -
Table 5. The Pressurized Liquid Extraction (PLE) technique’s maximum desirability for each variable under each optimal condition was determined by the Partial Least Squares (PLS) prediction profiler. The research contrasted the PLE conditions (X1: 48% v/v, X2: 160 °C, X3: 25 min) with the Stirring Extraction (STE) conditions (X1: 48% v/v, X2: 80 °C, X3: 120 min).
ParametersPartial Least Squares (PLS) Regression for PLEPLE Experimental ValuesSTE
TPC (mg GAE/g)12.0215.99 ± 0.7216.69 ± 0.52
TIP (mg/g)11.6010.46 ± 0.5612.75 ± 0.60 *
CAF (mg/g)1.201.15 ± 0.071.60 ± 0.06 *
FRAP (μmol AAE/g)86.19101.87 ± 3.16102.70 ± 3.49
* Values lower than 0.05 in each row are regarded as statistically significant.
Table 6. The SCG extracts’ individual polyphenolic compounds were identified using HPLC-DAD. The PLE and stirring extraction (STE) techniques were contrasted in the study.
Polyphenolic Compounds (mg/g)PLESTE
Phenolic acids
Gallic acid0.12 ± 0.01 *0.09 ± 0
Neochlorogenic acid0.25 ± 0.01 *0.14 ± 0.01
Dihydrocaffeic acid0.68 ± 0.05 0.97 ± 0.02 *
Chlorogenic acid1.53 ± 0.10 1.37 ± 0.09
Caffeic acidnd0.62 ± 0.02 *
Syringic acid0.79 ± 0.04 0.84 ± 0.02
p-Coumaric acid0.40 ± 0.03 0.44 ± 0.02
Ferulic acid0.16 ± 0.01 0.20 ± 0.01 *
∑ Phenolic acids3.92 ± 0.16 4.66 ± 0.28 *
Flavonoids
(+)-Catechin (hydrate)0.82 ± 0.05 1.06 ± 0.04 *
(−)-Epicatechin2.27 ± 0.06 2.94 ± 0.11 *
Rutin1.32 ± 0.05 1.33 ± 0.08
Apigenin-7-O-glucoside0.40 ± 0.01 0.39 ± 0.03
Naringin dihydrochalcone0.90 ± 0.05 0.94 ± 0.03
Quercetin0.83 ± 0.04 1.43 ± 0.05 *
∑ Flavonoids6.54 ± 0.40 8.09 ± 0.32 *
Total Identified Polyphenols10.46 ± 0.56 12.75 ± 0.60 *
* Values lower than 0.05 in each row are regarded as statistically significant; nd: not detected.
Table 7. Equation of calibration curves for each compound identified through HPLC-DAD.
Polyphenolic Compounds (Standards)EquationR2Retention Time (min)UVmax
Gallic acidy = 406,13.93x + 241,534.740.9935.627270
Neochlorogenic acidy = 33,340.37x − 35,090.940.99711.405324
Dihydrocaffeic acidy = 145,111.50x + 68,055.570.99816.937280
Chlorogenic acidy = 47,940.59x + 729,821.300.99218.679323
Caffeic acidy = 836,011.57x + 606,104.540.99424.281327
Syringic acidy = 172,124.17x + 1,804,823.190.98824.578320
p-Coumaric acidy = 54,706.25x + 346,333.790.99325.235312
Ferulic acidy = 233,188.64x + 1,666,648.360.99127.120310
(+)-Catechin (hydrate)y = 81,185.19x + 811,110.110.9965.934310
(−)-Epicatechiny = 15,754.99x + 177,996.050.9926.317278
Rutiny = 35,025.67x + 191,393.190.9936.381352
Apigenin-7-O-glucosidey = 52,641.52x − 43,026.570.9967.271336
Naringin dihydrochalconey = 35,117.47x + 362,530.330.9947.556281
Quercetiny = 85,950.46x + 943,732.120.99310.989360
Disclaimer/Publisher’s Note: The statements, opinions and data contained in all publications are solely those of the individual author(s) and contributor(s) and not of MDPI and/or the editor(s). MDPI and/or the editor(s) disclaim responsibility for any injury to people or property resulting from any ideas, methods, instructions or products referred to in the content.

