Article

Selection and Use of Wild Lachancea thermotolerans Strains from Rioja AOC with Bioacidificant Capacity as Strategy to Mitigate Climate Change Effects in Wine Industry

1
VITEC, Wine Technology Centre, Microbiology Department, 43730 Falset, Tarragona, Spain
2
IRTA, Institute of Agrifood Research and Technology, Mas Bové, 43120 Constantí, Tarragona, Spain
*
Author to whom correspondence should be addressed.
Beverages 2025, 11(3), 70; https://doi.org/10.3390/beverages11030070
Submission received: 28 February 2025 / Revised: 24 April 2025 / Accepted: 27 April 2025 / Published: 12 May 2025
(This article belongs to the Section Wine, Spirits and Oenological Products)

Abstract

:
Lachancea thermotolerans help increase the acidity of wines by producing L-lactic acid, which can serve as a strategy to mitigate the decrease in total acidity in wines promoted by climate change. The aim of the present paper is to test the capability of wine bioacidification of wild strains isolated from Rioja AOC. For this purpose, L. thermotolerans strains isolated from musts were used in mixed fermentation (co-inoculation and sequential inoculation) with Saccharomyces cerevisiae to determine the fermentation performance and L-lactic acid production, in both laboratory scale and pilot scale. Fermentation kinetics was evaluated, in addition to the final wine chemical composition and organoleptical properties. The results indicated that the isolated strains produced L-lactic acid; these effects were dependent on the strain and the inoculation strategy, being higher the effect in sequential inoculation (9.20 g/L) than in co-inoculation. This L-lactic acid production capacity was maintained at a pilot scale (4.65 g/L), in which the acidity increase was perceptible in the sensorial analysis, and an ethanol concentration decrease was also reported. The wine acidification depends on the appropriate selection of the strains, the inoculation procedure, the yeast adaptation to media, and competence with other yeast species present in the fermentation broth. The wild L. thermotolerans Lt97 strain could be used as a bioacidification tool for wines affected by climate change.

1. Introduction

Wine is an alcoholic product that has been produced worldwide for the last millennia with very few changes in its production process until the last century. During the last decades, grapevines have been suffering from current climate change effects as multiple climacteric crops, and thus the grape must and final wine composition are changing [1,2,3]. The combined effect of increased temperatures and advanced phenology affects the composition of berries, increasing sugar, decreasing organic acid concentrations, and altering secondary metabolites compositions and aroma precursors [3,4,5]. Then, the wines produced under the new climatic conditions tend to present low acidity, high alcohol content, high pH, and variation of several parameters, such as colour or phenolic compounds [5,6]. Physiological maturation and phenolic maturation are desynchronised, and optimal harvest time is difficult to determine for wine producers. This situation drives winemakers from the areas more affected by climate change to search for a series of alternative oenological strategies, in order to decrease the ethanol content and increase acidity, such as procedures and practices in the vines and also in the cellar [3,5,7,8,9,10].
It is also getting common for winemakers the use of different yeast species other than Saccharomyces cerevisiae, known as non-Saccharomyces, which have shown a potential to palliate those changes in must composition and produce quality wines with the final characteristics desired by consumers [7,11,12,13]. Metschnikowia pulcherrima and Starmerella spp. are capable of reducing ethanol content by increasing glycerol or L-lactic acid production, esters and acetates compounds [14,15,16,17]. Hanseniaspora genera are known to improve organoleptic profile, i.e., H. guillermondii increases levels of 2-phenylethyl acetate [18]; H. uvarum and H. opuntiae increase levels of esters [19,20]. In the case of Schizosaccharomyces pombe it is described as a deacidifying yeast because of L-malic acid consumption and ethanol and CO2 production by maloalcoholic fermentation [21].
Lachancea thermotolerans is one of the most promising yeasts for its bioacidification capacity because it can metabolise glucose and fructose to pyruvate to produce L-lactic acid in vinification [22]. In other yeast species as S. cerevisiae, this metabolism is more enhanced to ethanol and acetic acid production [23]. This bioacidification capacity of L. thermotolerans depends on the inoculation strategy and the strain [24,25,26]. Nowadays exist several commercial strains for vinification that can increase L-lactic production, incrementing total acidity and reducing pH [22]. In pure culture fermentations, it has been reported that in volumes of 25 mL, some strains are able to produce up to 16 g/L of L-lactic acid; however, L. thermotolerans is not able to consume the total sugars, as it is only able to ferment up to 7–10% of ethanol (v/v). For this reason, is recommended to use it in mixed culture with yeasts with a greater fermentation capacity, such as S. cerevisiae, to avoid residual sugars [27] or stuck or sluggish fermentation from antagonism effects [28,29,30]. In mixed fermentations of 2.5 L volume with other yeast as S. cerevisiae, L. thermotolerans is able to produce L-lactic acid concentration from 1–8 g/L [31]; or 1–9 g/L in a volume of 4 L when used with S. pombe [32].
As a side effect of this bioacidification, low volatile acidity can be obtained in addition to a reduction in ethanol content of 0.4% (v/v) [30] or even up to 1% (v/v) [33,34,35]. L-lactic acid production depends on survivance factors that allow L. thermotolerans to proliferate in must and to produce it. Some strains are resistant to sulphur dioxide concentration in must, differing between authors from <20 mg/L [36] to 40–60 mg/L [37] or even up to 100 mg/L [38]. Furthermore, other parameters that affect activity are tolerance to ethanol up to 7–10% v/v, optimum fermentation temperature between 25–30 °C [39], and nitrogen availability (>200 mg/L) [37,40]. Inoculation strategy is also important to ensure imposition of L. thermotolerans mainly in the first days of mixed fermentation when it coexists with other Saccharomyces and non-Saccharomyces yeasts. It has been described that in mixed fermentations with S. cerevisiae, the moment of inoculation or the concentration of inoculum of S. cerevisiae is important in determining the final bioacidification of the wine. Co-inoculation and sequential inoculation with S. cerevisiae are both strategies used in wineries for bioacidification nowadays. Several studies have stated that the strategy of sequential inoculation produces wines with higher L-lactic concentrations than the strategy of co-inoculation with more than 106 cells/mL of S. cerevisiae [25,35,41], thus resulting in greater acidity and low pH values [12,25]. This is in consonance with studies which reported that bioacidification by L. thermotolerans mostly occurs during the first days of fermentation and with a yeast population higher than 106 cfu/mL [37,42]. Thus, the lower the S. cerevisiae inoculum, the higher the prevalence and effect of L. thermotolerans [33,43]. Fermentation dynamics in addition to strain L-lactic acid production capacity are important to get the desired bioacidification in the final product.
This paper presents the potential of isolated wild L. thermotolerans strains from different vineyards in the Rioja Appellation of Origin Controlled (AOC) from Spain for its capability of bioacidificate wines. It analyses the fermentation performance of four strains under different inoculation strategies, in order to study their ability to produce high amounts of L-lactic acid and to perform suitable fermentations, as a tool for mitigating climate change effects at laboratory and pilot scale fermentations, as well as its sensorial impact in final product.

2. Materials and Methods

2.1. Strains and Media Used for Fermentation

Yeast colonies of L. thermotolerans were isolated during the 2022 harvest from different spontaneously fermented grape musts from different vineyards located in Haro (Spain) at the Rioja AOC englobed in the CDTI project LowpHWine (IDI-20210391). Briefly, at the beginning, middle, and end of the spontaneous alcoholic fermentation, samples were taken and spread on modified lysine agar media petri dishes. This media was regular lysine media from Oxoid Holdings Ltd. (Heysham, Ireland), prepared as manufacturer’s instructions, plus a 2.5% solution of bromocresol green from Panreac (Barcelona, Spain) dissolved in 3 mL of absolute ethanol from Panreac (Barcelona, Spain). Plates were incubated at 28 °C for 5 days. After, up to 24 yeast colonies from each plate with a similar morphological appearance to L. thermotolerans colonies (small and green olive coloured) were selected. All isolates were identified by PCR-RFLP analysis of 5.8S-ITS rDNA [44]. PCR products of putative L. thermotolerans strains were digested with the restriction endonucleases CfoI, HaeIII, and HinfI. The size of the products was determined by gel electrophoresis and compared with the sizes described by Esteve-Zarzoso, B. et al. 1999 [44]. L. thermotolerans isolates were typified as different strains by the Unit of Microbiology, Department of Genetics, Physiology and Microbiology, Complutense University of Madrid [45]. The strains that presented more L-lactic acid production in a previous work were selected to perform this study. Four strains were chosen to use in this research: ROD22-07, ROD22-29, ROD22-75 and ROD22-97 named in this study as Lt07, Lt29, Lt75 and Lt97, respectively.
In the case of S. cerevisiae strains, they were isolated from Grenache grape variety from different regions, Rioja and Priorat (AOC); and the same procedure described above was followed for identification except the culture media used that in this case was YPDA (2% glucose, 2% peptone, 1% yeast extract, 2% agar, w/v; Panreac, Barcelona, Spain). Moreover, colonies identified as S. cerevisiae were typified at strain level by the analysis of inter-delta regions [46]. Subsequently, screening microfermentations were performed to evaluate the fermentation characteristics of the isolates. Three strains were selected for this study to perform laboratory and pilot scale fermentations: two wild strains isolated from previous experiments in our laboratory (ScF and ScM) in addition to the commercial strain ScC Fermivin PDM (Oenobrands, Montpellier, France). All the strains of this study were stored in the laboratory and cryopreserved in glycerol at <−70 °C. When needed, they were cultivated in YPDA plates at 28 °C for 2–4 days and then conserved at 4 °C in darkness. From these cultures, inoculums were produced as described below.
For laboratory scale, microfermentations of the commercially concentrated grape must was used supplemented with 1.4 g/L of Actimax Plus from Agrovin (Ciudad Real, Spain). Must was autoclaved to sterilise and diluted to a final density of 1.100 g/cm3. In the case of pilot scale microvinifications, must was obtained from Grenache grapes harvested in the 2023 vintage. Grapes were hand-picked, put into 15 kg boxes, and transported (at 4 °C) to the experimental winery of VITEC (Wine Technology Centre, Tarragona, Spain). Grapes were then destemmed, crushed, and transferred into 50 L steel tanks. Both musts were analysed for basic chemical and microbiological parameters. Chemical composition is summarized in Table 1.

2.2. Laboratory Scale Microfermentations

Mixed microfermentations were performed by combining each one of the L. thermotolerans strains with S. cerevisiae ScF, using two inoculation strategies. Co-inoculation conditions were performed with simultaneous inoculation of L. thermotolerans at 2.0 × 10⁶ cell/mL and S. cerevisiae at 2.0 × 10⁵ cell/mL (CO105) or 2.0 × 10⁴ cell/mL (CO104). Sequential inoculation conditions were performed firstly inoculating L. thermotolerans and then S. cerevisiae at 24 h (SEQ24) or 48 h (SEQ48), both yeasts at 2.0 × 10⁶ cells/mL.
Concretely, two rounds of fermentation were performed. In the first, sequential (48 h) microfermentation was performed with each of the four strains (SEQ48). For the second round, two strains were chosen (Lt29 and Lt97) and were fermented with the rest of the inoculation strategies (CO105, CO106 and SEQ24).
Fermentations were carried out in duplicate in 500 mL Erlenmeyer flasks containing 220 mL of concentrated grape juice. Cultures of the five yeast used (ScF, Lt07, Lt29, Lt75 and Lt97) were maintained in YPDA plates at 4 °C and pre-incubated in 15 mL of yeast-peptone-dextrose medium at 25 °C in a rotatory shaker (100 rpm) for 48 h to obtain an inoculum concentration of 107–108 cells/mL. From these pre-cultures, concentrated must flasks were inoculated to obtain the yeast concentration required for each microfermentation (2.0 × 10⁶, 2.0 × 10⁵ or 2.0 × 10⁴ cells/mL) and were incubated at a controlled and constant temperature (25 °C) without agitation. Fermentations were monitored as explained in 2.3, and the basic oenological parameters of final wines were analysed as explained in 2.4.

2.3. Fermentation Monitoring

The fermentation process was monitored through density measurement until sugar concentration was lower than 2 g/L. Moreover, the yeast population was followed by counting total cells by microscopy using Thoma chamber BRAND GmbH + CO KG (Wertheim, Germany), total viable yeasts using YPDA medium and non-Saccharomyces viable yeasts by plating in Lysine agar media from Oxoid Holdings Ltd. (Heysham, Ireland) [47], a selective medium that inhibits growth of Saccharomyces spp. The population of S. cerevisiae at each point was calculated by subtracting the colonies that grew in Lysine agar from the colonies that grew in YPDA.

2.4. Oenological Parameters Analysis

The oenological parameters were measured in all wines according to the methods recommended by the Compendium of International Methods of Analysis—Organization of Vine and Wine [48]. An enzymatic technique (Y200 Biosystems, Barcelona, Spain) was used to analyse glucose-fructose, L-malic, and L-lactic acid. Wine ScanSO2 (Foss, Barcelona, Spain) was used to analyse alcohol content, pH, total acidity (TA) concentration expressed as tartaric acid, volatile acidity concentration expressed as acetic acid, and total and free sulphur dioxide. Density was measured by an electronic densimeter (Excellence D5, Mettler Toledo, Barcelona, Spain). The ratio of yield of sugar transformation into ethanol in each condition was calculated by dividing the % of ethanol in the final wine by the concentration of glucose-fructose consumed.

2.5. Pilot Scale Microvinification

From previous laboratory scale experimentation results, L. thermotolerans Lt97 was selected to perform pilot scale microvinification. It was studied in mixed sequential inoculation (Lt97 + ScM) with a wild S. cerevisiae strain ScM inoculated after 24 h of the beginning of the fermentation and compared with a pure inoculation (ScM) of the wild S. cerevisiae strain ScM and with a pure inoculation (ScC) of the commercial strain of S. cerevisiae Fermivin PDM. Yeast cultures (maintained in YPDA plates at 4 °C), were inoculated in YPD media and incubated at 25 °C (in 1 L Pyrex bottles, room humidity and darkness in a rotatory shaker at 100 rpm) for 48 h to obtain an inoculum concentration of 107–108 cells/mL. Yeasts were inoculated to must for performing fermentation at 106 cells/mL. Microvinifications were performed by duplicate at a controlled and constant temperature (25 °C). Wines were bottled and kept in storage conditions until tasting in the same month. The fermentations were monitored as described in Section 2.3, and the basic oenological parameters of final wines were analysed as explained in Section 2.4. Moreover, for the final wines also were determined the wine aroma compounds in Section 2.6. and the organoleptic characteristics in Section 2.7. Must was supplemented at different moments during alcoholic fermentation: Actimax Varietal™ (Agrovin, Spain) was added at 30 g/hL at the beginning, Actimax Plus™ (Agrovin, Spain) at 20 g/hL when density arrived at 1.040 g/cm3 and SB Evolution™ (Agrovin, Spain) at 10 g/hL when density arrived at 1.020 g/cm3.

2.6. Determination of Wine Aroma Compounds

The volatile aroma compounds of all pilot scale microvinifications were analysed by gas-chromatography GC 7890A (Agilent Technologies, Santa Clara, CA, USA) coupled to a 5975C MSD inert mass spectrometry 5975C MSD (Electronic Shock Source Triple Axis Detector) (Agilent Technologies, Santa Clara, CA, USA) [49]. Briefly, the volatile compounds of base wines were extracted using SPME (DVB/CAR/PDMS). Samples (10 mL) were placed in 20 mL headspace vials together with 2.7 g NaCl (Sigma-Aldrich Corporation, Saint Louis, MS, USA) and 100 μL of 2-octanol (Sigma-Aldrich Corporation Saint Louis, MS, USA) (1.000 ppm) as internal standard. The column was a DB-WAX UI (60 m × 0.25 mm × 0.25 μm, Agilent Technologies, Santa Clara, CA, USA). A constant flow of 2.1 mL/min of helium was used as carrier gas. The results of the volatile compounds were semi-quantitative data in relation to the response provided by the internal standard (2-octanol). All analyses were performed in triplicate. In order to evaluate the contribution of the aromatic compounds to the aroma of the wine, the odorant activity value (OAV) was calculated for each one of them. This parameter is calculated as the ratio between the concentration of each compound and its corresponding perception threshold [50,51]. If the calculated OAV for a certain compound results greater than the unity, this compound can be considered as an active aroma [49,52].

2.7. Organoleptic Evaluation

The quantitative descriptive analysis (QDA) was performed by a trained tasting panel following the normative ISO 8586:2023 [53]. Thus, a total of three wines (ScM, Lt97 + ScM and ScC) were tasted blind with a gender balance of 5 judges in the normalized ISO 8589:2007 [54] room of VITEC. Wine sensory evaluation was classified into different attributes, including colour (intensity and evolution), aroma (intensity and profile), flavour (sourness, unctuosity, bitterness, persistence, burning, and reduction), and global punctuation. Among the aroma profile, fruity aromas (tropical, citric, red fruit, black fruit and candied fruit aromas), spicy, floral, chemical, and vegetal were considered as interesting attributes. Panellists were required to rate the intensity of the wine parameters using a five-point scale (0 = absence, 5 = maximum intensity). Data was collected with tablets using Compusense® Cloud software (Version 25.0.30595, Compusense Inc., Guelph, ON, Canada). Informed consent for participation was obtained from all subjects involved in the study.

2.8. Statistical Analysis in XLSTAT

The data were subjected to a one-way analysis of variance (ANOVA) and Tukey’s post-hoc test to evaluate the effect of each fermentation. The results were considered statistically significant at a p-value less than 0.05 XLSTAT (Addinsoft, New York, NY, USA). Principal Component Analysis (PCA) was performed to visualize a 2D plot of the first two principal components (PCs) using XLSTAT Version 2016.01.26717 (Addinsoft, New York, NY, USA). Normality and homogeneity were assumed for the data used in these analyses.

3. Results

3.1. Isolation of L. thermotolerans Strains

Within the framework of the LowpHWine project, a total of 118 isolates of L. thermotolerans were obtained from original must samples, from which 28 were identified as different strains. The chosen strains were isolated from the second day of different spontaneous fermentations from Grenache and Graciano grape varieties from three different terroirs. From the total isolates, 21.2% corresponded to Lt07, 1.7% corresponded to Lt75, 1.7% corresponded to Lt97 and 1.0% corresponded to Lt29.

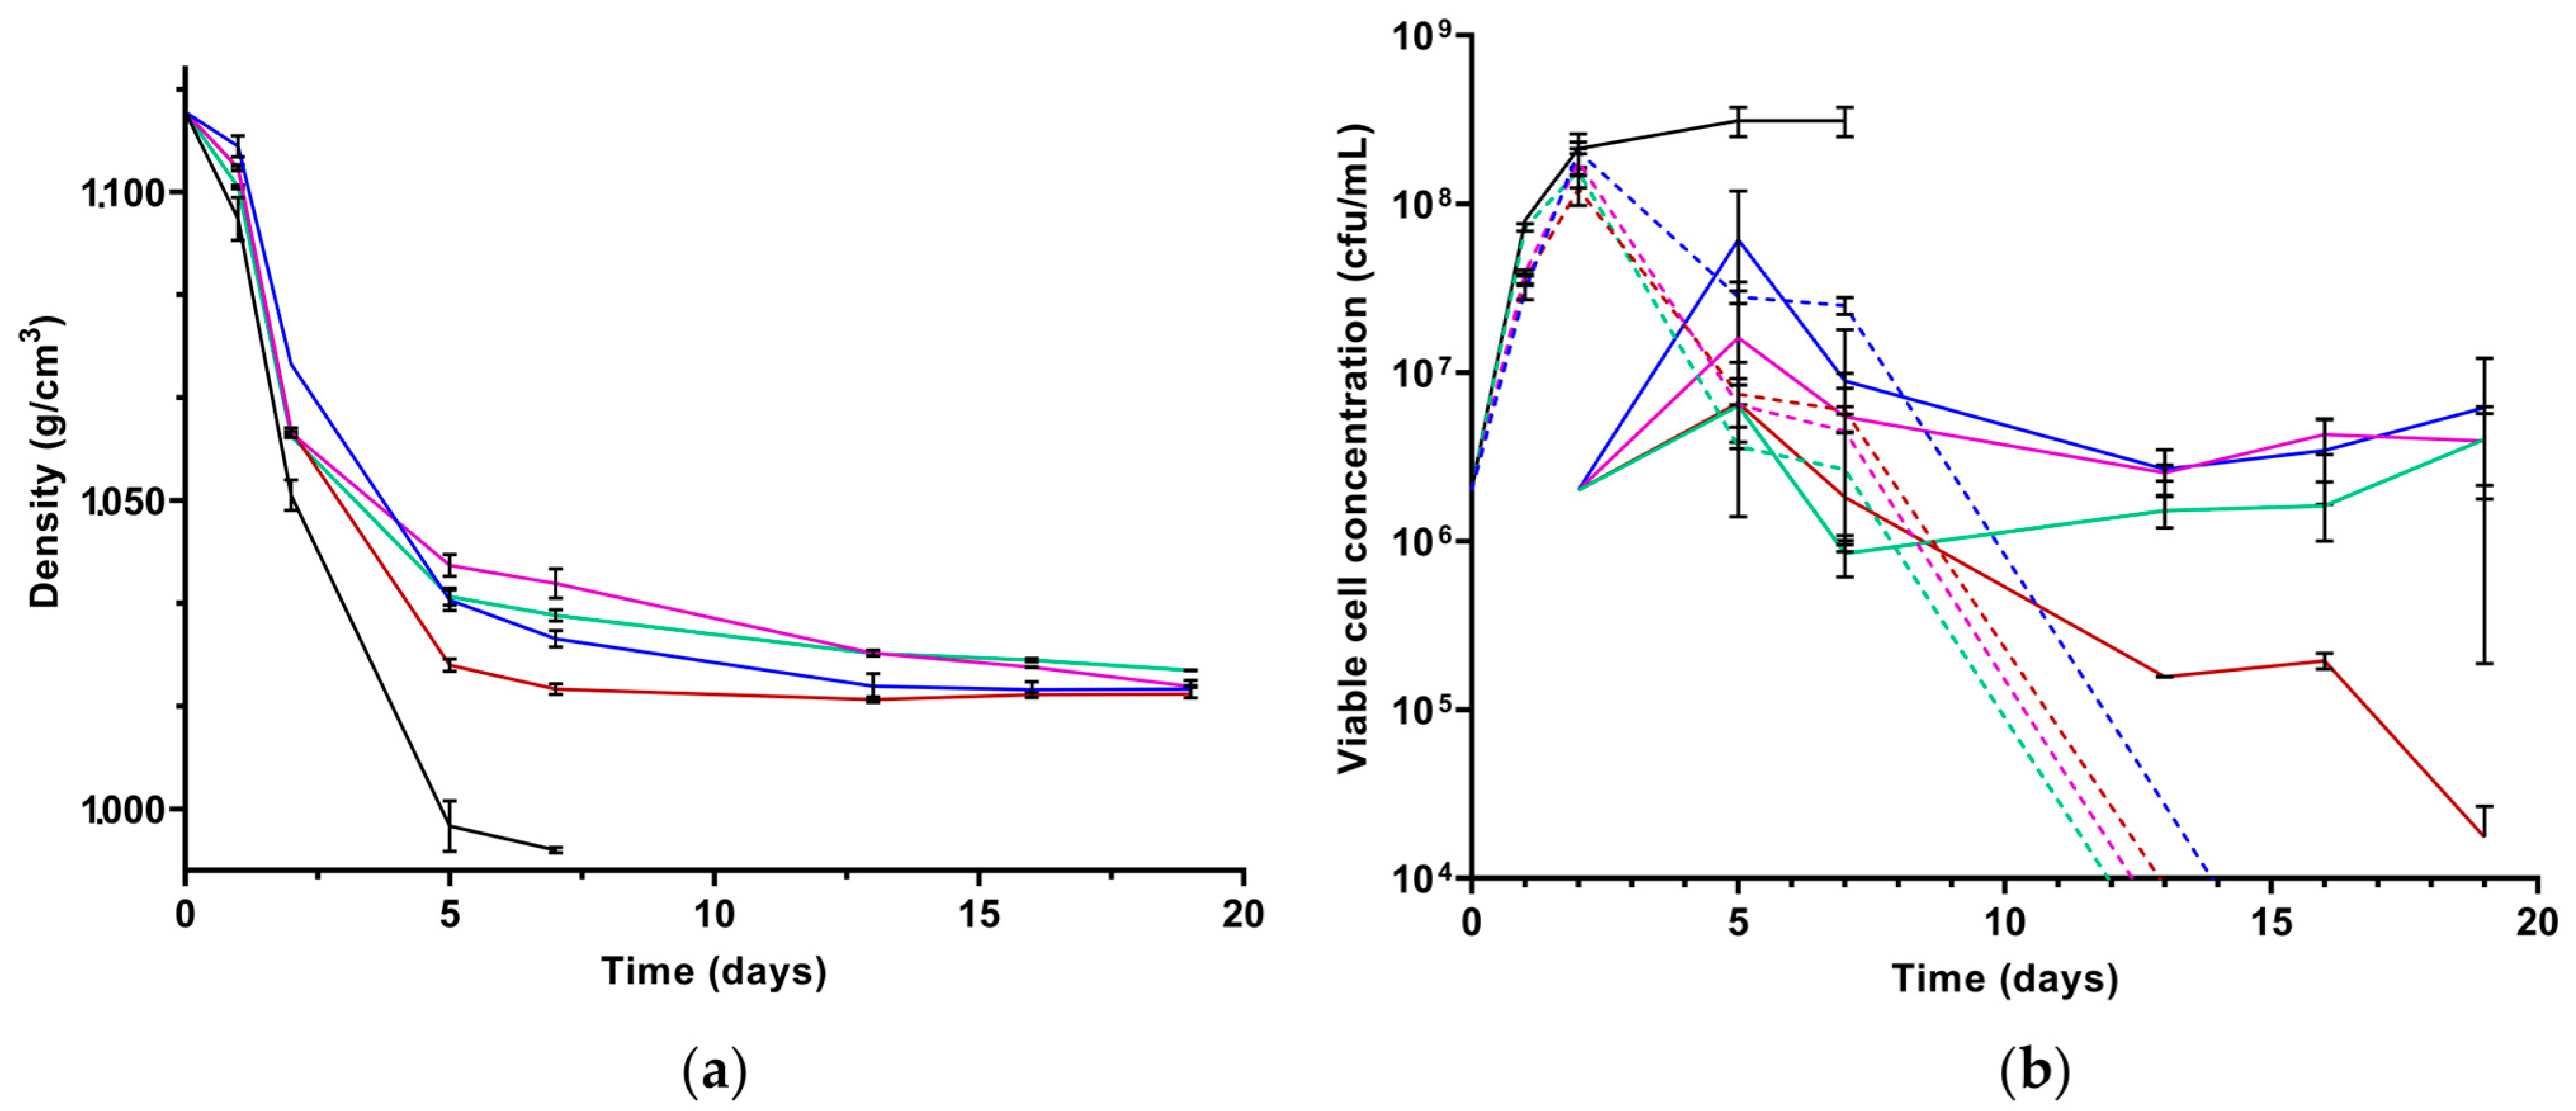
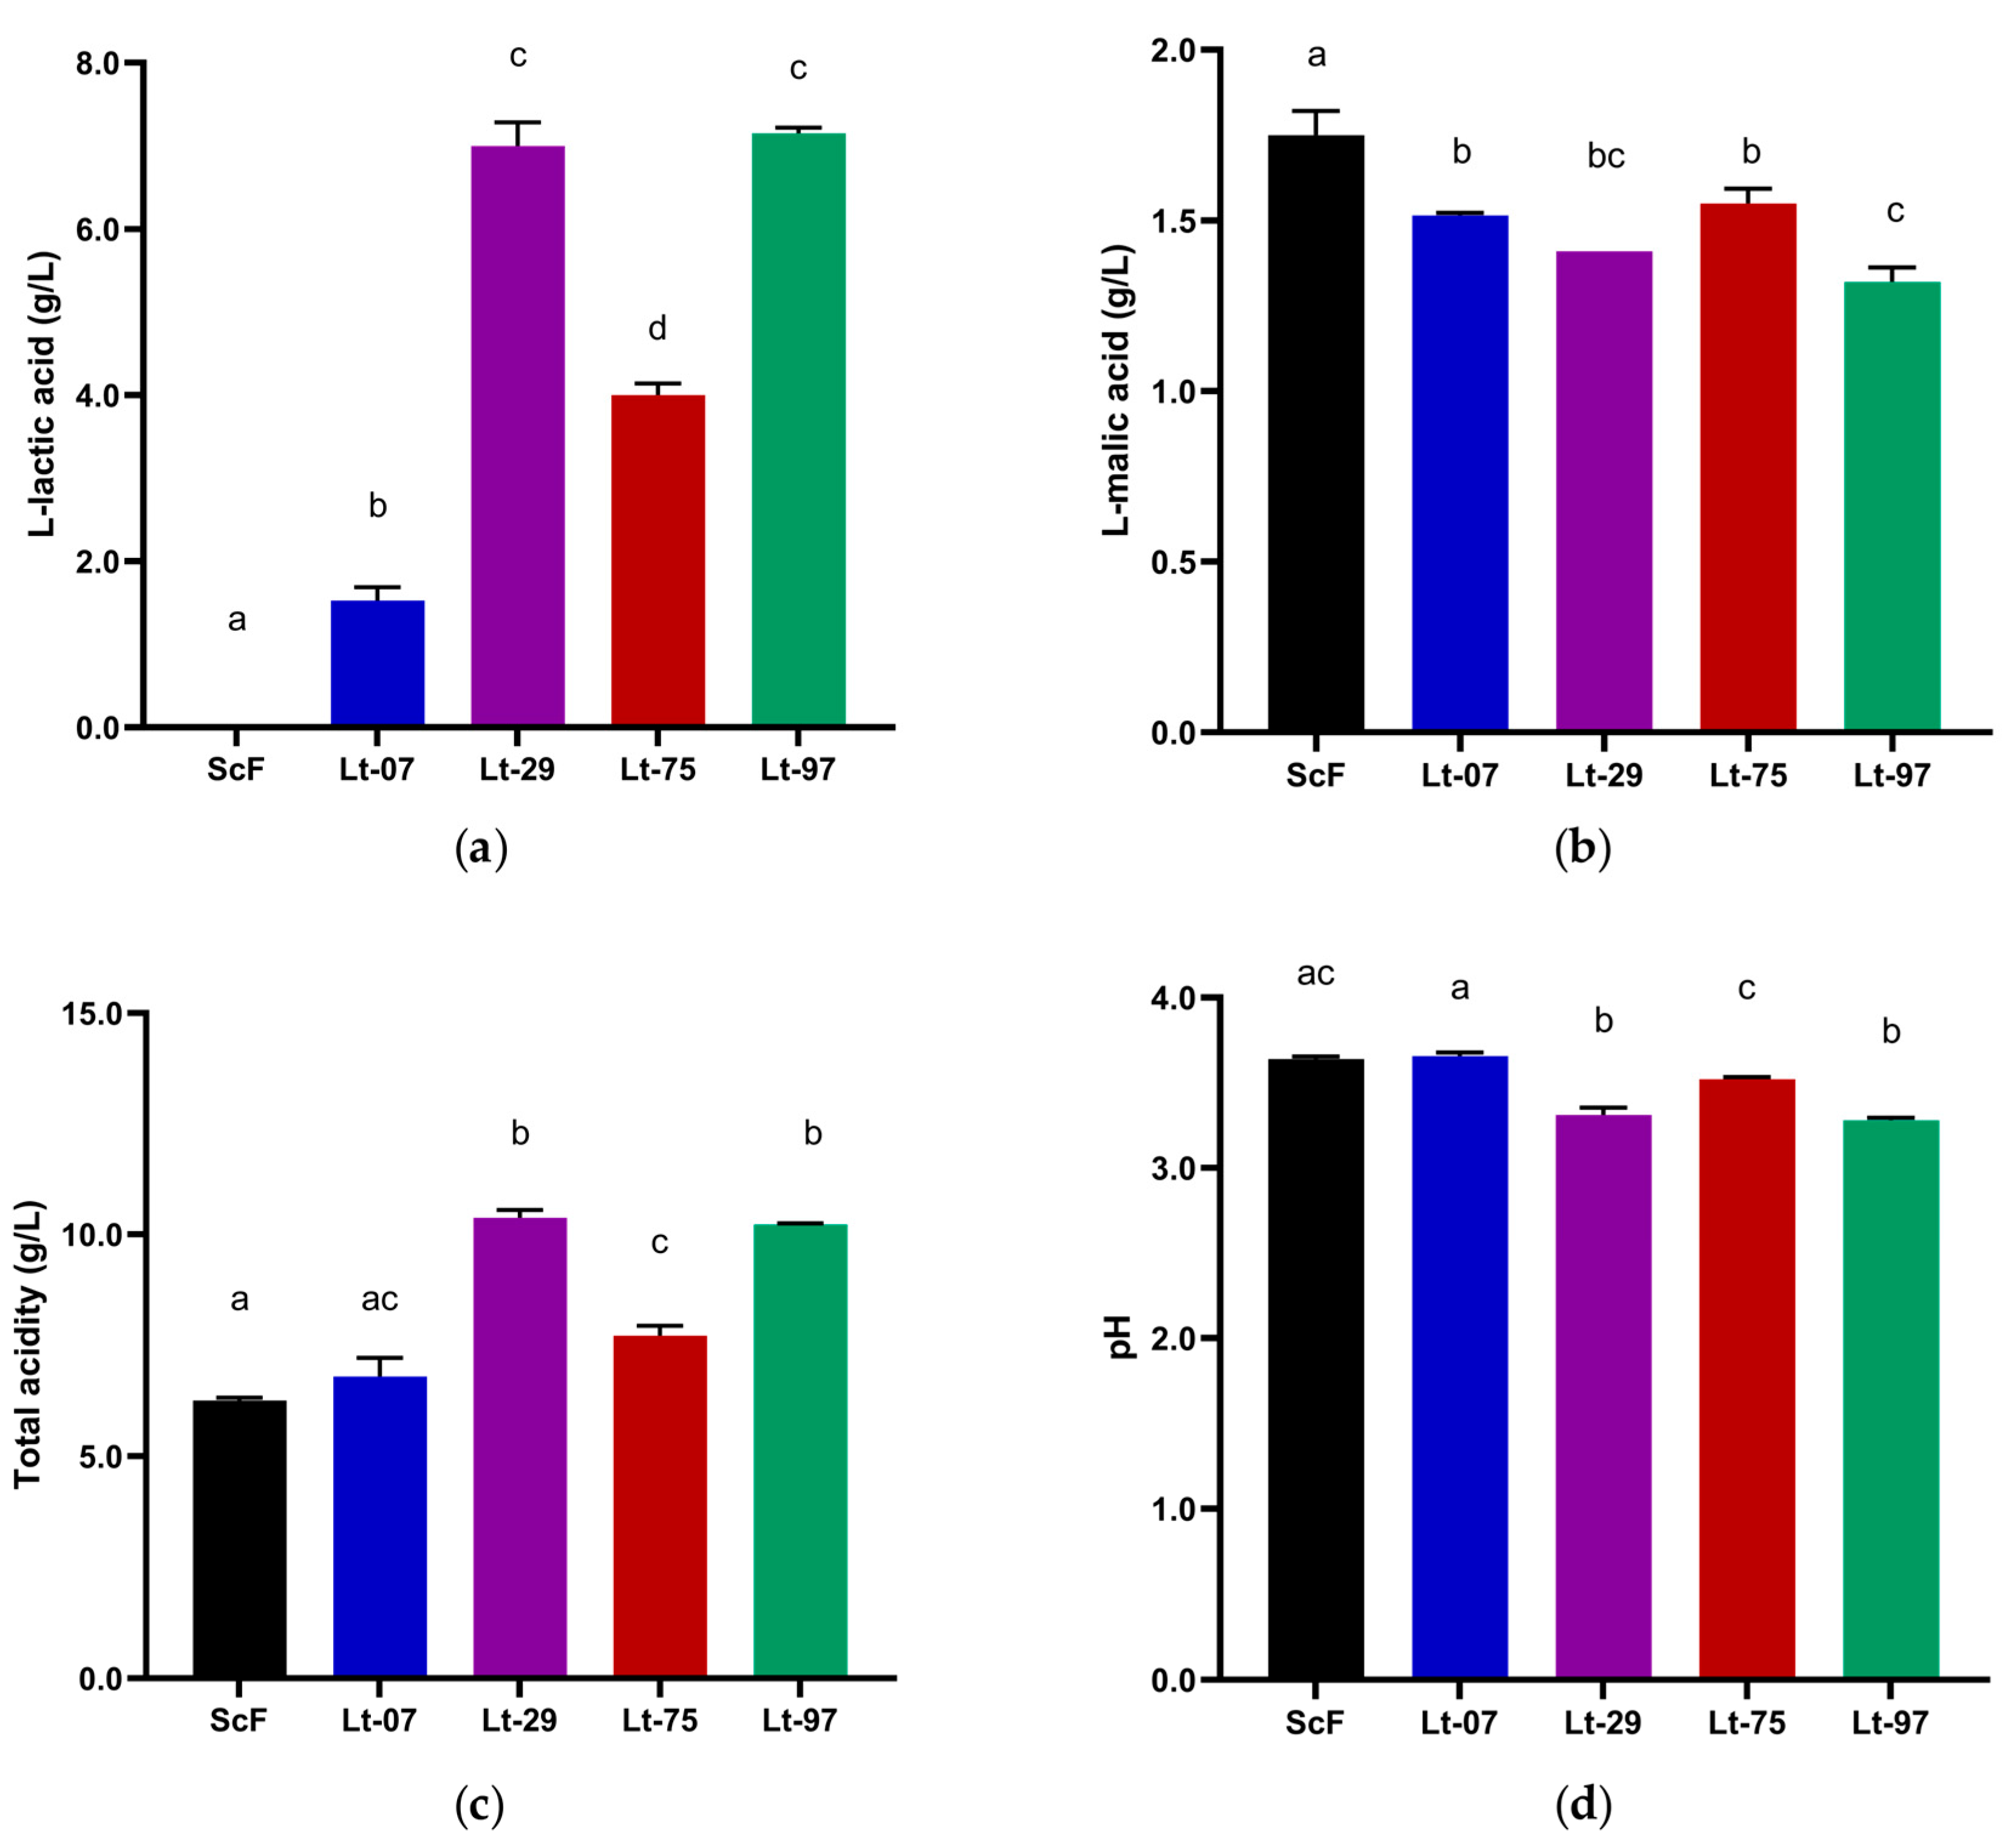
3.2. Laboratory Scale Microfermentations with Four Strains

The fermentation performance of four strains (Lt07, Lt29, Lt75 and Lt97) in sequential microfermentation with inoculation of S. cerevisiae at 48 h (SEQ48) was tested (Figure 1). This strategy was tested in the first place because it was reported in other studies [25,33,35,41], that the sequential inoculation was the condition that produced more L-lactic acid. Indeed, in our study, all the mixed fermentations produced more L-lactic acid than the single fermentation with S. cerevisiae (Figure 2). However, in terms of dynamics, all were stuck at densities between 1.010–1.020 g/cm3 after 22 days of fermentation (Figure 1).
S. cerevisiae imposed to L. thermotolerans in all the fermentations, as can be seen in Figure 1: the non-Saccharomyces yeasts reached a peak of 108 cfu/mL at the early stages of the fermentation and decreased after S. cerevisiae inoculation. However, the populations of S. cerevisiae did not reach 108 cfu/mL; they were maintained between 1.9 × 10⁶–1.0 × 10⁷ cfu/mL, with the exception of Lt75, which decreased until 1.0 × 10⁴ cfu/mL. Furthermore, the microfermentation with Lt75 was the fastest one in the first stages. The decrease in the population of L. thermotolerans in the presence of S. cerevisiae observed in this study is reported in several other articles [33,35,55]. Indeed, other authors [29] reported that several factors are involved in the death of L. thermotolerans in mixed culture with S. cerevisiae, and both cell-cell contact and the production of antimicrobial peptides by S. cerevisiae play a role in fermentation dynamics and sluggish fermentations. Previous works [56] highlight that cell-to-cell contact with S. cerevisiae activates the stress response in L. thermotolerans.
However, this work is reported also an inhibition of S. cerevisiae growth in the musts with 48 h of L. thermotolerans presence, which caused a stuck fermentation. The contribution of other microorganisms in this effect can be discarded, as at the moment of inoculation they must have <10 cfu/mL of yeast and acetic acid bacteria population. This effect is also described in other studies [41], mostly in sequential inoculation. This could be caused either by direct cell-to-cell interactions between yeasts or by indirect interactions, such as competition for nutrients or the production of antimicrobial compounds. Indeed, in our study the microfermentation with Lt75 was the one that decreased the density faster and the one in which S. cerevisiae was more affected, suggesting that Lt75 could be the strain that has the most antagonistic relation with S. cerevisiae.
The strains that produced more L-lactic acid were Lt29 and Lt97, with productions of 7.0 g/L and 7.15 g/L, respectively (Figure 2). Subsequently, there was strain Lt75, with a production of 4.0 g/L and Lt07, with 1.5 g/L of L-lactic acid. Compared to the control ScF, Lt29 and Lt97 had significantly lower pH (decrease of 0.36 units with Lt97) and higher TA (increase of 4.13 g/L with Lt29). Moreover, in the fermentations with all the strains of L. thermotolerans a decrease of 0.2–0.4 g/L of L-malic acid was reported, an effect that was exacerbated in Lt29 and Lt97. Glycerol and volatile acidity also increased, but in a non-significant way, and less SO2 concentration was reported significantly (Appendix A Table A1).
Therefore, those fermentations reports, in line with other authors, that L-lactic acid production is strain-dependent [25,34]. It was observed that the strain that produces more L-lactic acid also increases TA while decreasing pH. This strain’s pattern agrees with those seen in other studies [25,31,34,35,41] and proves that the L-lactic acid production of the selected strains is substantial enough to have an impact on the final product. Indeed, in the case of L-malic acid, some studies in line with the present one, report a lower concentration [25,31], and others an increase of concentration [34,35]. Some strains have been described as able to degrade malate or produce L-malic acid (0.3 g/L) [43].

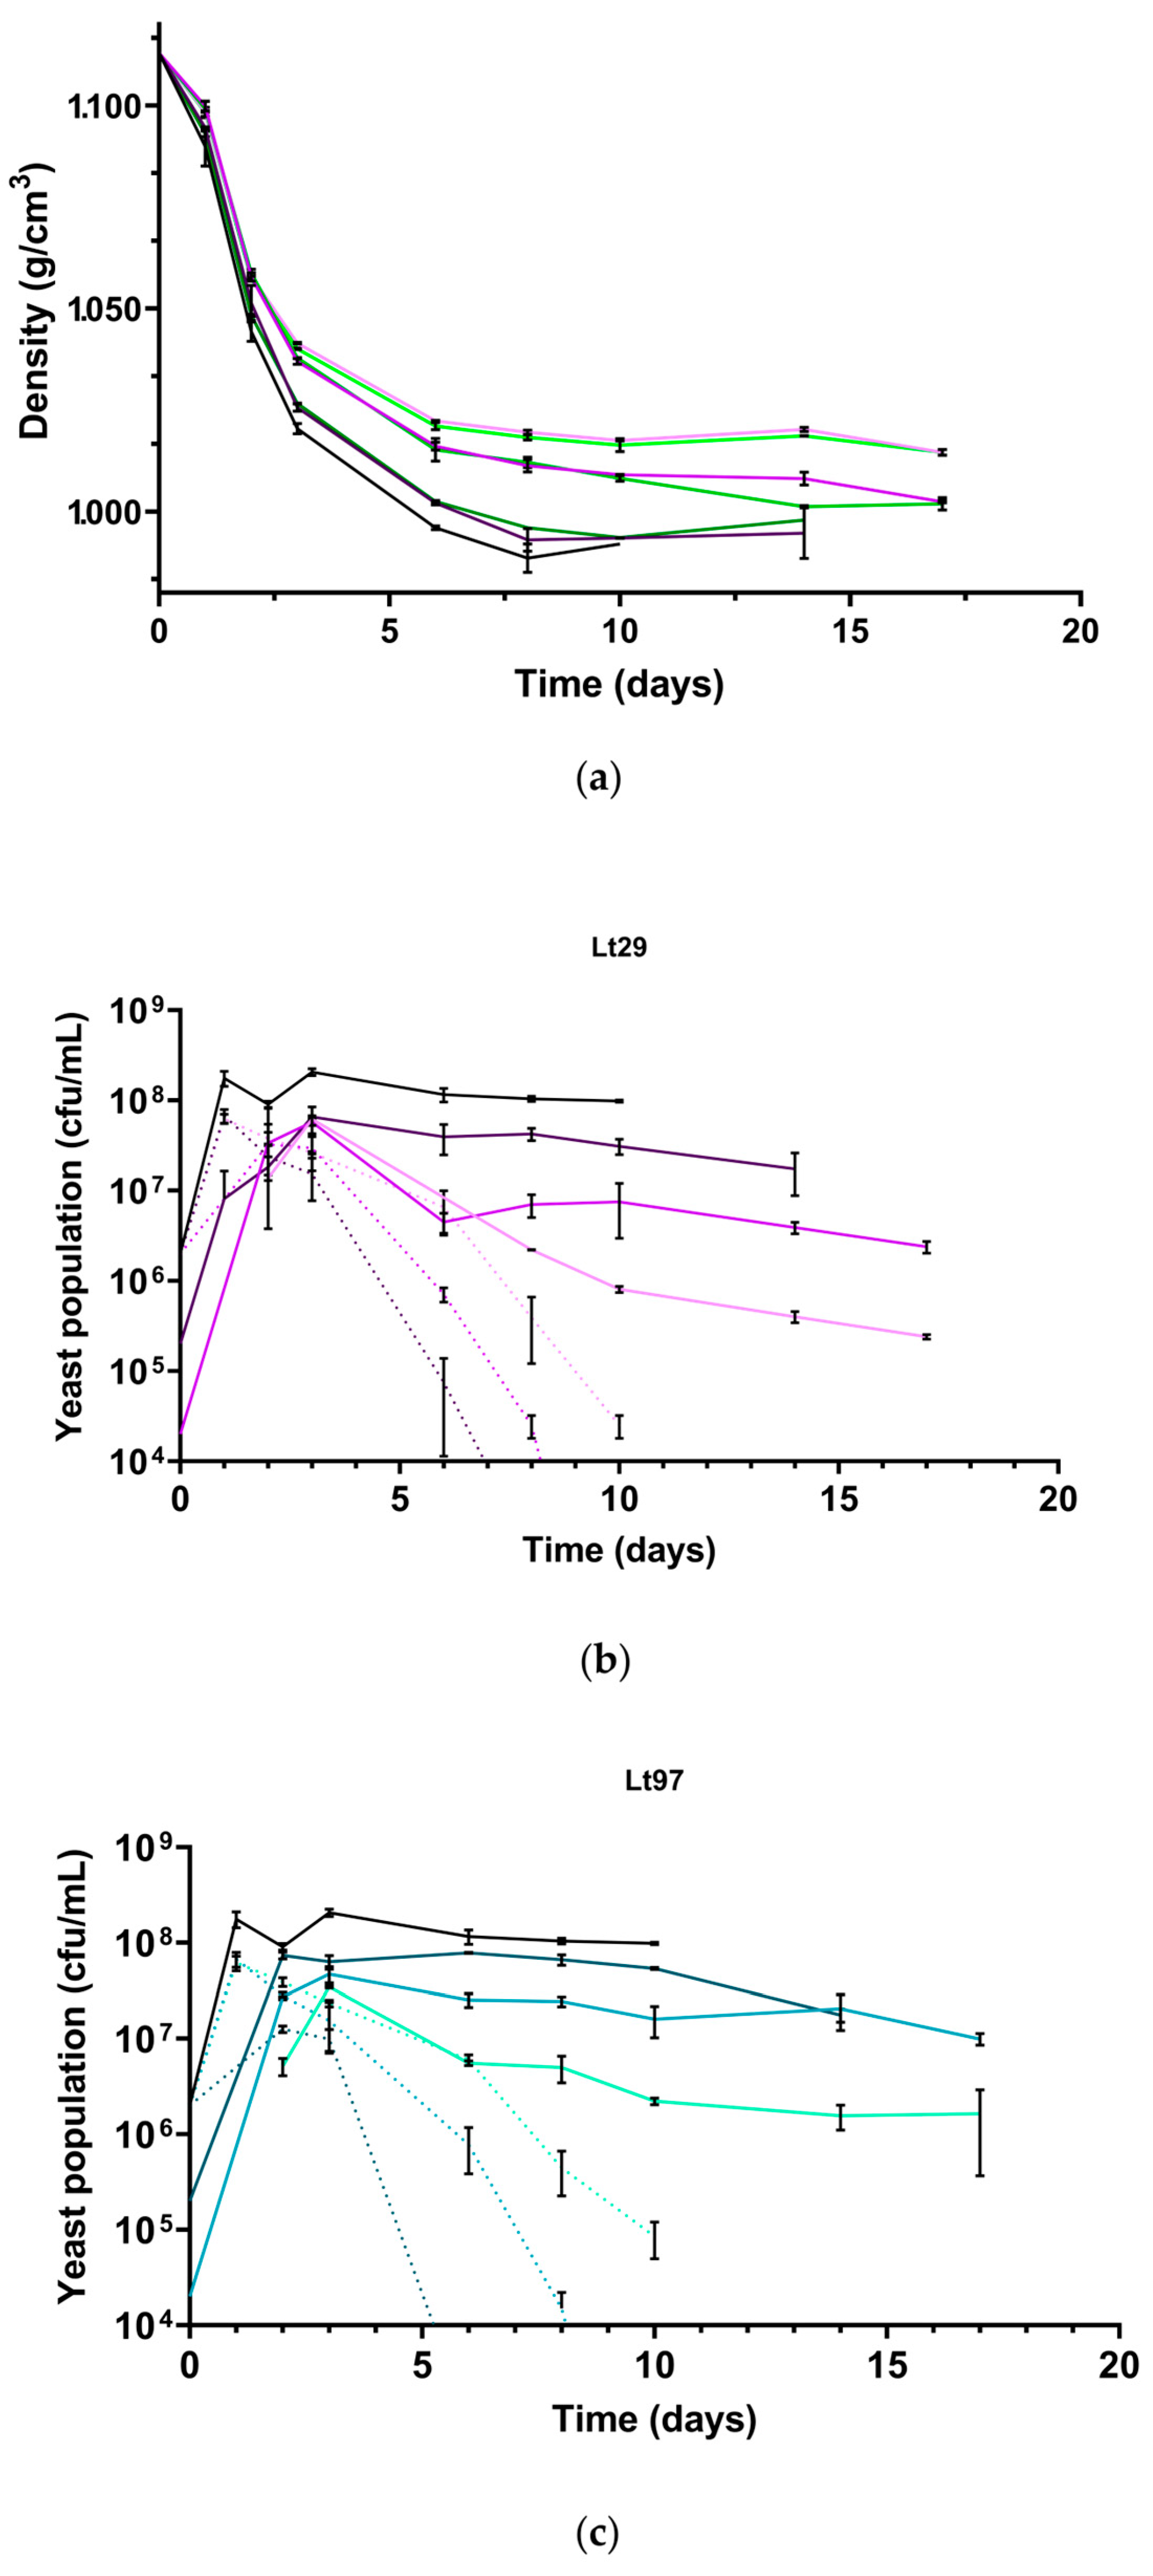
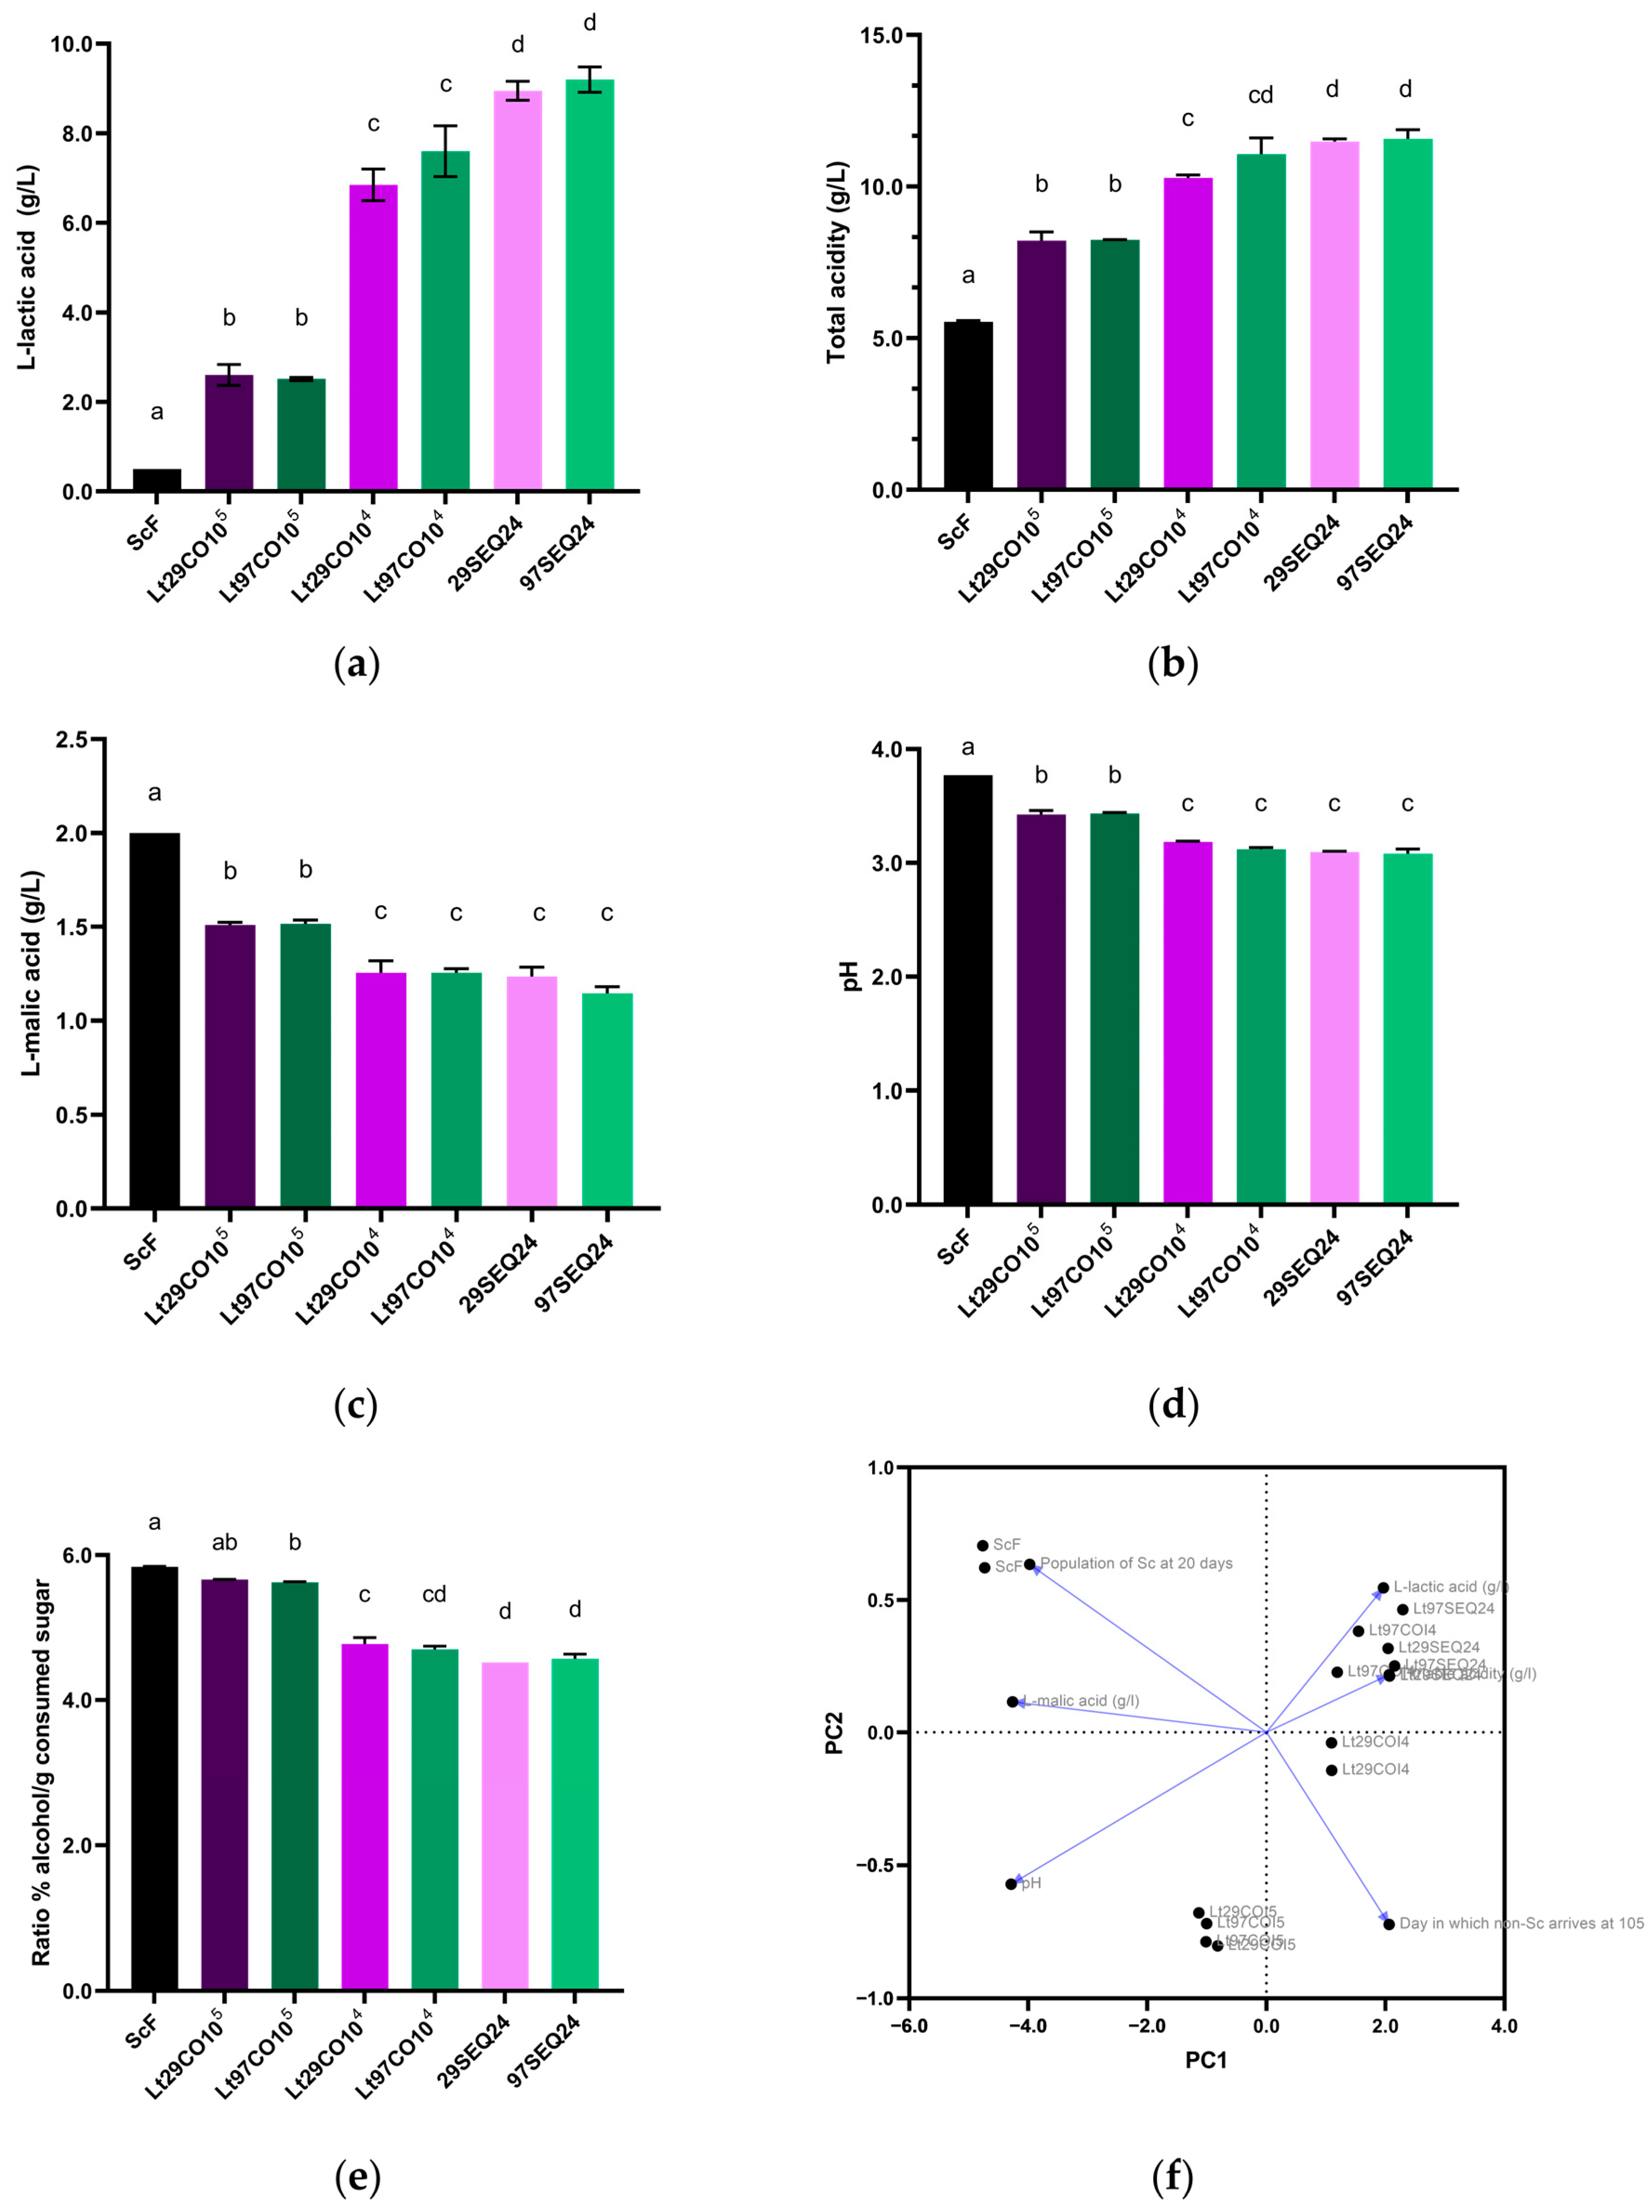
3.3. Laboratory Scale Microfermentations with Different Inoculation Strategies

From the screening results, the two strains with more production of L-lactic acid (Lt29 and Lt97) were chosen to test different inoculation strategies, in order to find the procedure that produces the highest concentration of L-lactic acid at the same time that ensures the finalization of fermentation without residual sugars. On one side, the co-inoculation was tested, as the presence of S. cerevisiae at the start can promote its adaptation to the must; so two co-inoculations were assessed: co-inoculation with 2.0 × 10⁶ cell/mL of L. thermotolerans and either 2.0 × 10⁵ (CO105) or 2.0 × 10⁴ cel/mL (CO104) of S. cerevisiae (ScF). On the other side, sequential microfermentation but inoculating S. cerevisiae earlier than in 3.2.: sequential fermentations with 2.0 × 10⁶ cells/mL of both species, inoculating S. cerevisiae after 24 h (SEQ24).
In terms of fermentation performance, the CO105 had a behaviour more similar to the control, as it was the unique that finished (Figure 3). This could be explained because the S. cerevisiae is inoculated at the beginning of the microfermentation in a higher concentration (105 cfu/mL), unlike the other ones which were inoculated in a lower concentration or after the beginning of the fermentation. Among the other mixed fermentations, all stuck with residual sugars higher than 2 g/L, CO104 had the better fermentation kinetics, followed by SEQ24. In terms of population dynamics, in all the conditions L. thermotolerans yeasts increased the population following inoculation (reaching 108 cfu/mL) but decreased fast; the CO105 were the ones that decreased faster, followed by CO104, and SEQ, reaching a population lower than 104 at 7, 8 and 11 days, respectively. In all the fermentations, S. cerevisiae achieved concentrations around 5.0 × 10⁷–1.0 × 10⁸ cfu/mL, and while the two fermentations that finished (control ScF and CO105) maintained values higher than 7.0 × 10⁷ cfu/mL, the others immediately decreased the cell concentration to values lower than 5.0 × 10⁷. Strains Lt29 and Lt97 had similar behaviours.
Therefore, a clear pattern is observed: as L. thermotolerans is the dominant species for more time, S. cerevisiae is maintained in a lower concentration and the fermentation is slower. This suggests that the presence of L. thermotolerans inhibits the fermentation capacity of S. cerevisiae. As explained before, this could be due to either competition for nutrients, for cell-cell interaction between species or for secretion of antimicrobial peptides.
In all the mixed microfermentation there was more production of L-lactic acid than in the control, being the highest SEQ24 (which increased the concentration with more than 8.0 g/L, reaching 9.2 g/L for Lt97 and 8.95 g/L for Lt29), followed by the CO104 (both strains obtaining concentrations between 6.0–8.0 g/L) (Figure 4). The condition co-inoculated with 2.0 × 10⁵ cells/mL was the one that produced less L-lactic acid but still reported a significant increase of 2.0 g/L with respect to the control. From these results it can be suggested that there is a direct correlation between the L-lactic acid production, the time L. thermotolerans strain is active in the must and a slower fermentation kinetics; indeed the conditions with more L-lactic acid production resulted in stuck fermentation. Both strains Lt29 and Lt97 had similar behaviours, which suggests that in this study there is more impact with the inoculation strategy than for the strain; which can be explained because with the results of the strains screening, the strains with more production (Lt29 and Lt97) were chosen.
All the fermentations decreased the pH in a significant way, being higher the decrease of the co-inoculated conditions with low concentration and the sequential. The same behaviour is reported in the decrease of L-malic acid, for which the differences from the control were 0.8 g/L. TA acidity was higher in the condition with more L-lactic acid concentration (Figure 4). Therefore, the pattern of increase of L-lactic acid, increase of TA and decrease of pH, which was followed by the different strains (in 3.2), is also followed by the various inoculation techniques, as reported in other studies [25,31]. In the co-inoculation with the high dose (CO105), there was a slight and non-significant decrease in the volatile acidity (a difference of 0.2 g/L from the control for the strain Lt29) and a tendency to increase the glycerol content (an increase of 1.2 g/L in the Lt97, Appendix A Table A2).
In terms of co-inoculation, when inoculated at 105 cells/mL, S. cerevisiae, was able to finish the fermentation, but it is the condition with lower L-lactic acid production, L-malic acid values, TA and decrease of pH, as co-inoculation with 104 cel/mL produced a greater increase in those parameters (Figure 4); so the smaller the inoculum of S. cerevisiae, the greater L-lactic acid production, as L. thermotolerans is present during more time. A similar tendency is also reported in Comitini et al. 2011 [55], where the coinoculation with 103 cell/mL of S. cerevisiae decreased the pH by 0.3 points and increased 2.1 g/L of TA to the control condition, while the coinoculation with 107 cel/mL of S. cerevisiae didn’t produce a significant effect on these parameters. When applying the sequential inoculation, the same effect reported by CO104 compared to CO105 is observed but exacerbated; as L. thermotolerans is alone in the must for more time, it has more potential to produce L-lactic acid; indeed, the difference in L-lactic production by the strain Lt97 between SEQ24 and CO105 was 6.68 g/L. This behaviour is in consonance with other articles, in which the difference in L-lactic production in sequential inoculation compared to co-inoculation is 2.9 [33], 4.7 [25], 4.4 [31], or even 8.1 g/L [35].
Moreover, CO105 fermentation decreased significatively the ethanol content compared with the single fermentation with S. cerevisiae: in the control condition the alcohol content was 15.39%, and in the co-inoculation, 14.93% (Appendix A Table A2). Focusing on those strategies could contribute to remediating the increase of ethanol content in wines produced by climate change as also reported by literature [34,35]. Indeed, when analysing the ratio of the percentage of ethanol produced compared to the grams of consumed sugar, a decreasing tendency can be observed as more L-lactic acid was produced. The metabolic sugar pathway from L. thermotolerans is partially diverted to produce L-lactic acid instead of ethanol [23].
The PCA (Figure 4f), shows the correlation between the different inoculation strategies with variables related to chemical composition and growth kinetics of both S. cerevisiae and L. thermotolerans. It shows a clear opposition between the group of L-lactic acid concentration and the TA opposed to the pH and the concentration of L-malic acid; on the other hand, the population of S. cerevisiae is opposed with the time L. thermotolerans is maintained in the media. When observing the distribution of the microfermentations, the PCA evidences a clear distinction between three groups: the single fermentation with S. cerevisiae, the co-inoculation at a high concentration (105 cfu/mL) and the other inoculation strategies, being the co-inoculation at 104 cfu/mL closer to the sequential. Indeed, although in main of the cases both strains are grouped, the strain Lt97 co-inoculated with the low dose of S. cerevisiae is closer to the sequential inoculation than with the Lt29CO104.
In this study, the inoculation strategy had a great impact on all the variables, mainly L-lactic acid production. However, with the screening with different strains of L. thermotolerans can be reported that within the same inoculation strategy, different strains have substantial differences in the production of L-lactic acid. Those results align with the literature, which reports that there is a high variability in the L-lactic acid production within strains [21,22,31] and that the inoculation strategy also has an important effect on this production [25].
Overall, although there was no statistical difference between the two strains, in some strategies the Lt97 strain had a slightly higher L-lactic acid production, pH decrease, TA and L-malic acid concentration. For that reason, the strain Lt97 was selected to conduct pilot-scale microvinification.

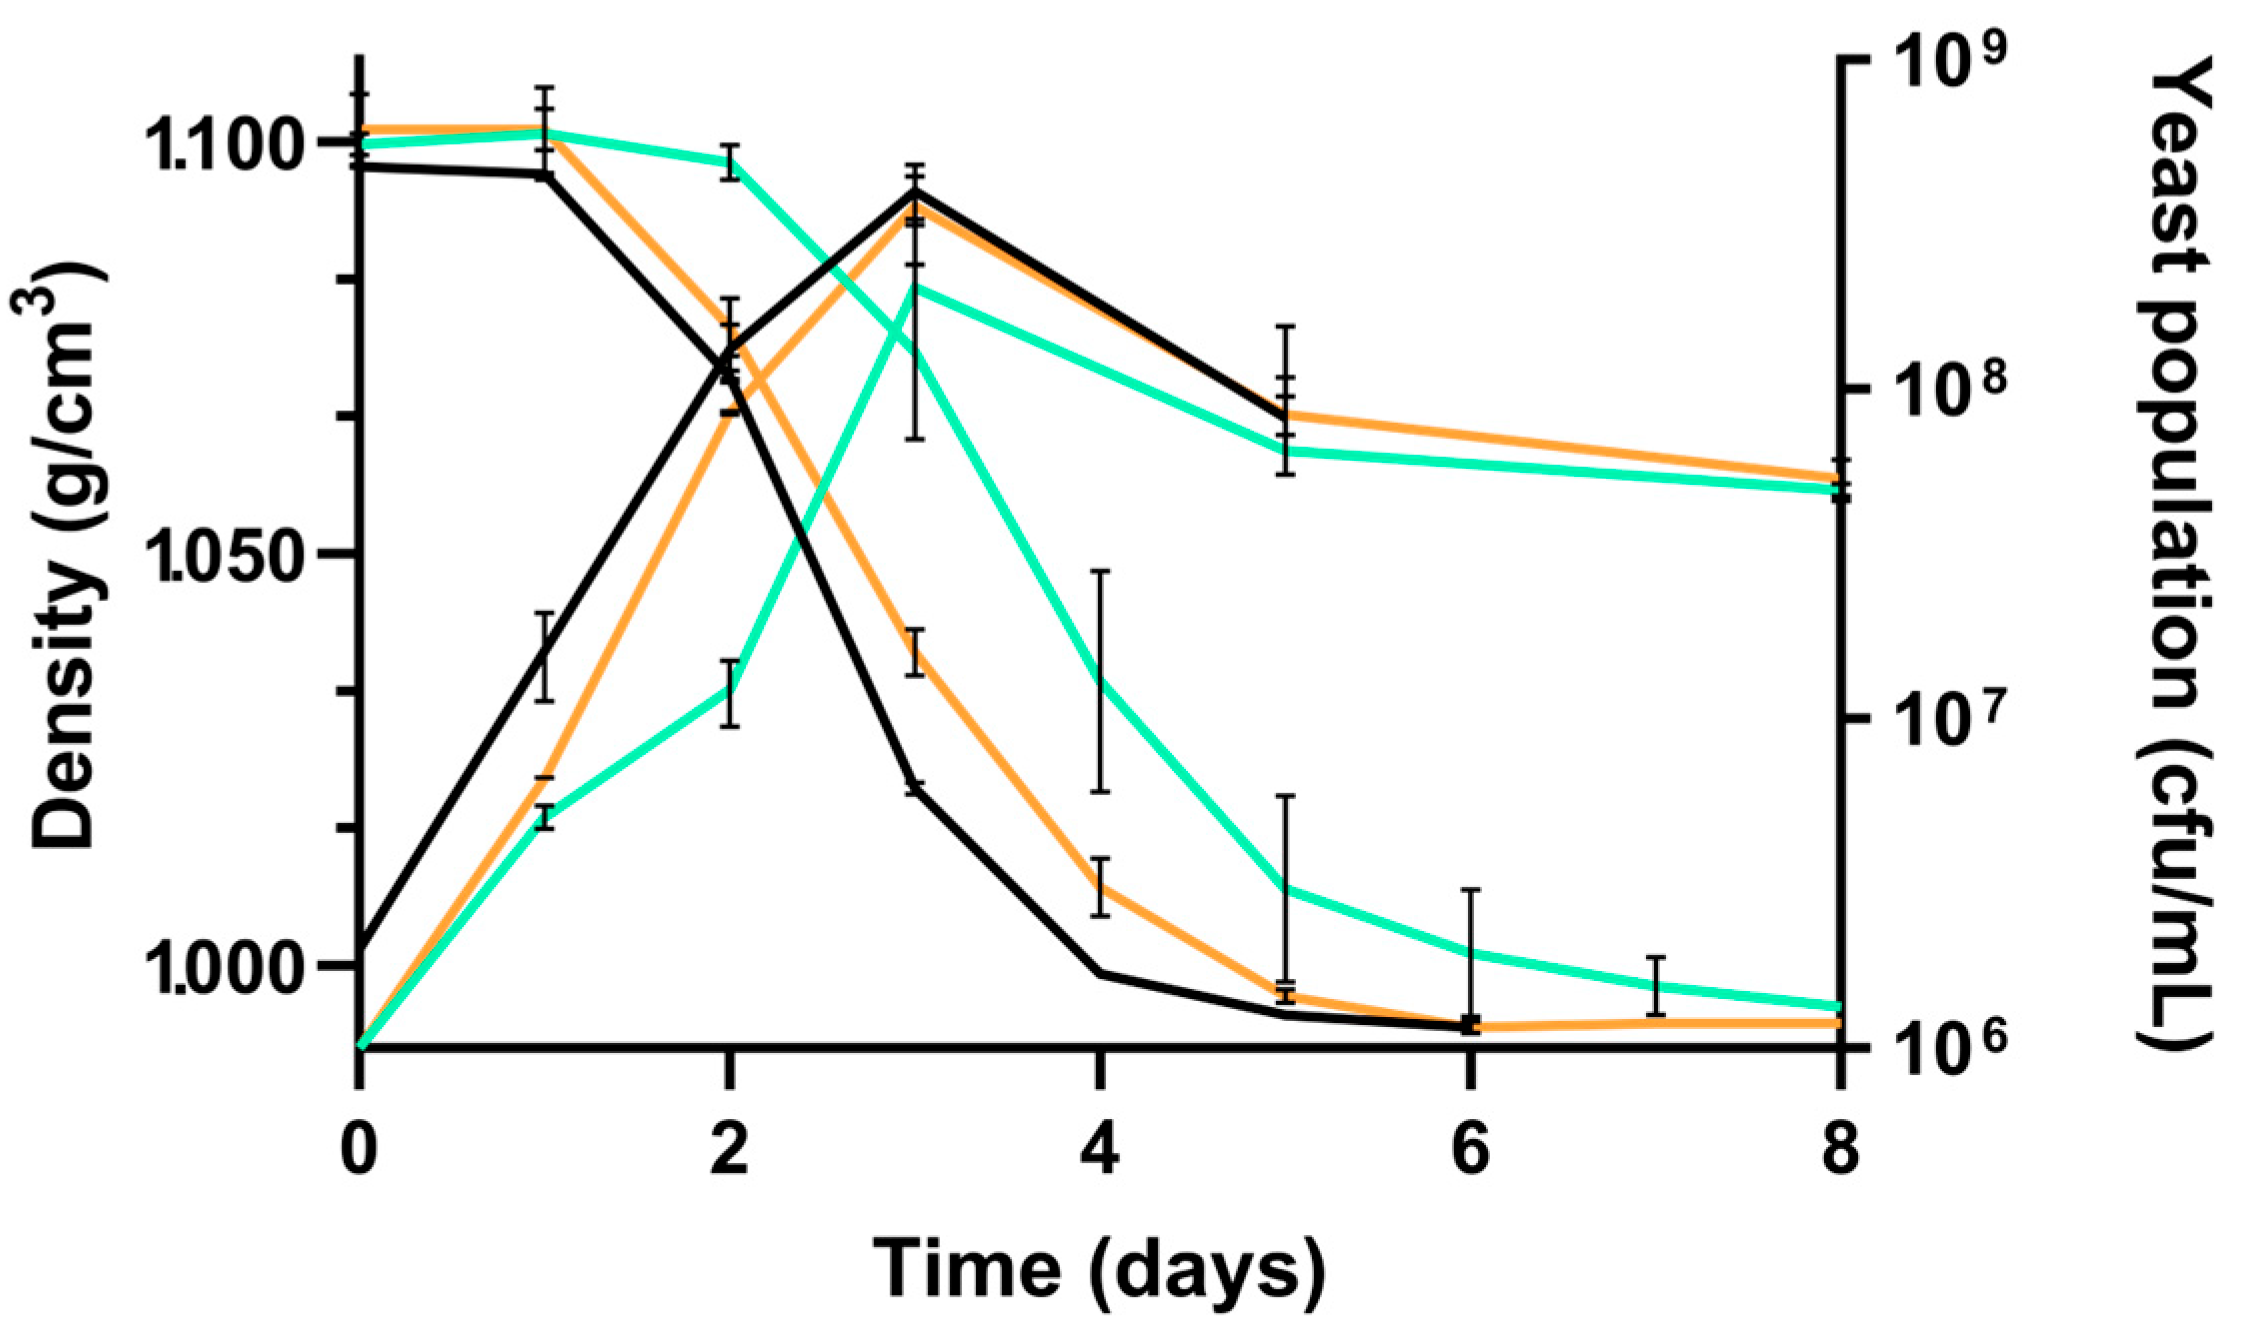
3.4. Pilot Scale Microvinifications

In the laboratory scale scenario, fermentation dynamics results for the four L. thermotolerans strains tested indicated that the best candidate to perform pilot scale microvinification with increased acidity was Lt97. Regarding to inoculation strategy it was proposed a sequential microvinification as this was the condition that produced more L-lactic acid. Therefore, a microvinification with Lt97 in sequential inoculation (24 h) with S. cerevisiae (Lt97 + ScM) was performed at a pilot scale to report the effects at a scale similar to cellar conditions. This microvinification was compared to a single condition with ScM and a microvinification with a commercial strain (ScC). Comparing microvinification kinetics of single fermentations with mixed fermentation, both ScM and ScC had a faster microvinification kinetic with a short lag-phase and finished 2 days before than mixed Lt97 + ScM (Figure 5). This delay could be due to lower sugar consumption and higher bioacidification of the must by L. thermotolerans, in comparison with S. cerevisiae inoculated in the other conditions, as described in laboratory scale fermentations. It is during the first days of microvinification that acidification of the must is produced by L. thermotolerans [43]. Determining the indigenous yeast population of the grapes and the initial must is important because a high population can spoil implantation of the inoculum used during vinification. In this experiment, initial Grenache must be used presenting low yeast populations (below 103 cfu/mL), 5 cfu/mL of lactic acid bacteria and 8.6 × 10² cfu/mL of acetic acid bacteria. These low populations at Lt97 + ScM condition have been a factor in ensuring the growth and proliferation of Lt97 for bioacidification of the final wine.
This mixed inoculated condition with Lt97 finally produced significative more L-lactic acid (4.65 ± 0.98 g/L) than the other conditions (Table 2). All fermentations finished with less than 2 g/L of residual sugars at the end of fermentation. Fermentations in 1–1.5 L volumes in the literature reported 2–3 g/L of L-lactic acid and in some cases up to 7 g/L [57,58]. Successful industrial pilot scale fermentations are more difficult to perform due to indigenous yeasts present in the must that affect inoculated yeast implantation. The volume effect of the fermentation is also relevant in final bioacidification by L. thermotolerans, so strains that produce up to 5 g/L of L-lactic acid in big volumes are desired for wine industry vinifications. In our experience, at laboratory scale, Lt97 in sequential inoculation with S. cerevisiae at 24 h produced 9.2 g/L of L-lactic acid and kept more than 4.0 g/L of production at a higher volume of 50 kg, with nutrients addition at different fermentation steps as normal vinification procedure. Some commercial starter L. thermotolerans cultures are reported to produce L-lactic acid in different concentrations. In other studies [25] one commercial strain produced, in sequential inoculation of 3 L Viogner must, up to 2.6 g/L; while the other two commercial strains produced less than 1 g/L. When the same strains were inoculated to Merlot must, they produced more L-lactic acid; from 3.5 to 4.0 g/L [31]. In similar experimentation [34], the commercial strains BlizzTM (Lallemand-ICV) or LaktiaTM (Lallemand) in 50 L of Airén must produce 2.7 and 6.9 g/L of L-lactic acid respectively in sequential fermentation with S. cerevisiae inoculated after 4 days. Nevertheless, nutrients were added to microvinification to facilitate the end of fermentation: GoFerm Sterol Flash™, Lallemand was added when S. cerevisiae was inoculated at 30 g/hL and 5 g/hL of Nutrient Vit Blanc™ (Lallemand) at the end of fermentation.
The authors could report a significant reduction in pH of 0.3 compared to wild ScM solely and commercial ScC conditions, and a significant increase in TA of 3.4 g/L compared to ScM and 3.8 g/L compared to ScC. This TA increase was directly related to L-lactic acid production by L. thermotolerans as can be seen in Table 2. In Lt97 + ScM microvinification a significative reduction in ethanol content of 0.6% (v/v) in comparison to ScC condition was reported. The same significative reduction was found in Lt97CO105 laboratory scale microvinification in comparison to the control ScF. In comparison with ScM, Lt97 + ScM reported the same reduction tendency in ethanol content. This was expected as L-lactic acid production can be described as the metabolic consumption of sugars to produce it instead of ethanol [23]. The authors also reported a non-significant increment in volatile acidity of Lt97 + ScM condition. This final production of 0.53 ± 0.13 g/L (Table 2) was not problematic in sensory analysis since this yield is below the perception threshold of acetic acid (0.7 g/L) [59] and was not detected in organoleptic analysis. Moreover, these bioacidification levels increase the chemical and microbiologic stability which could contribute to reducing the practice of addition of SO2 in the cellars. Furthermore, concentrations of L-lactic acid more than 4 g/L have been described to produce a strong inhibitory effect on FML [40].

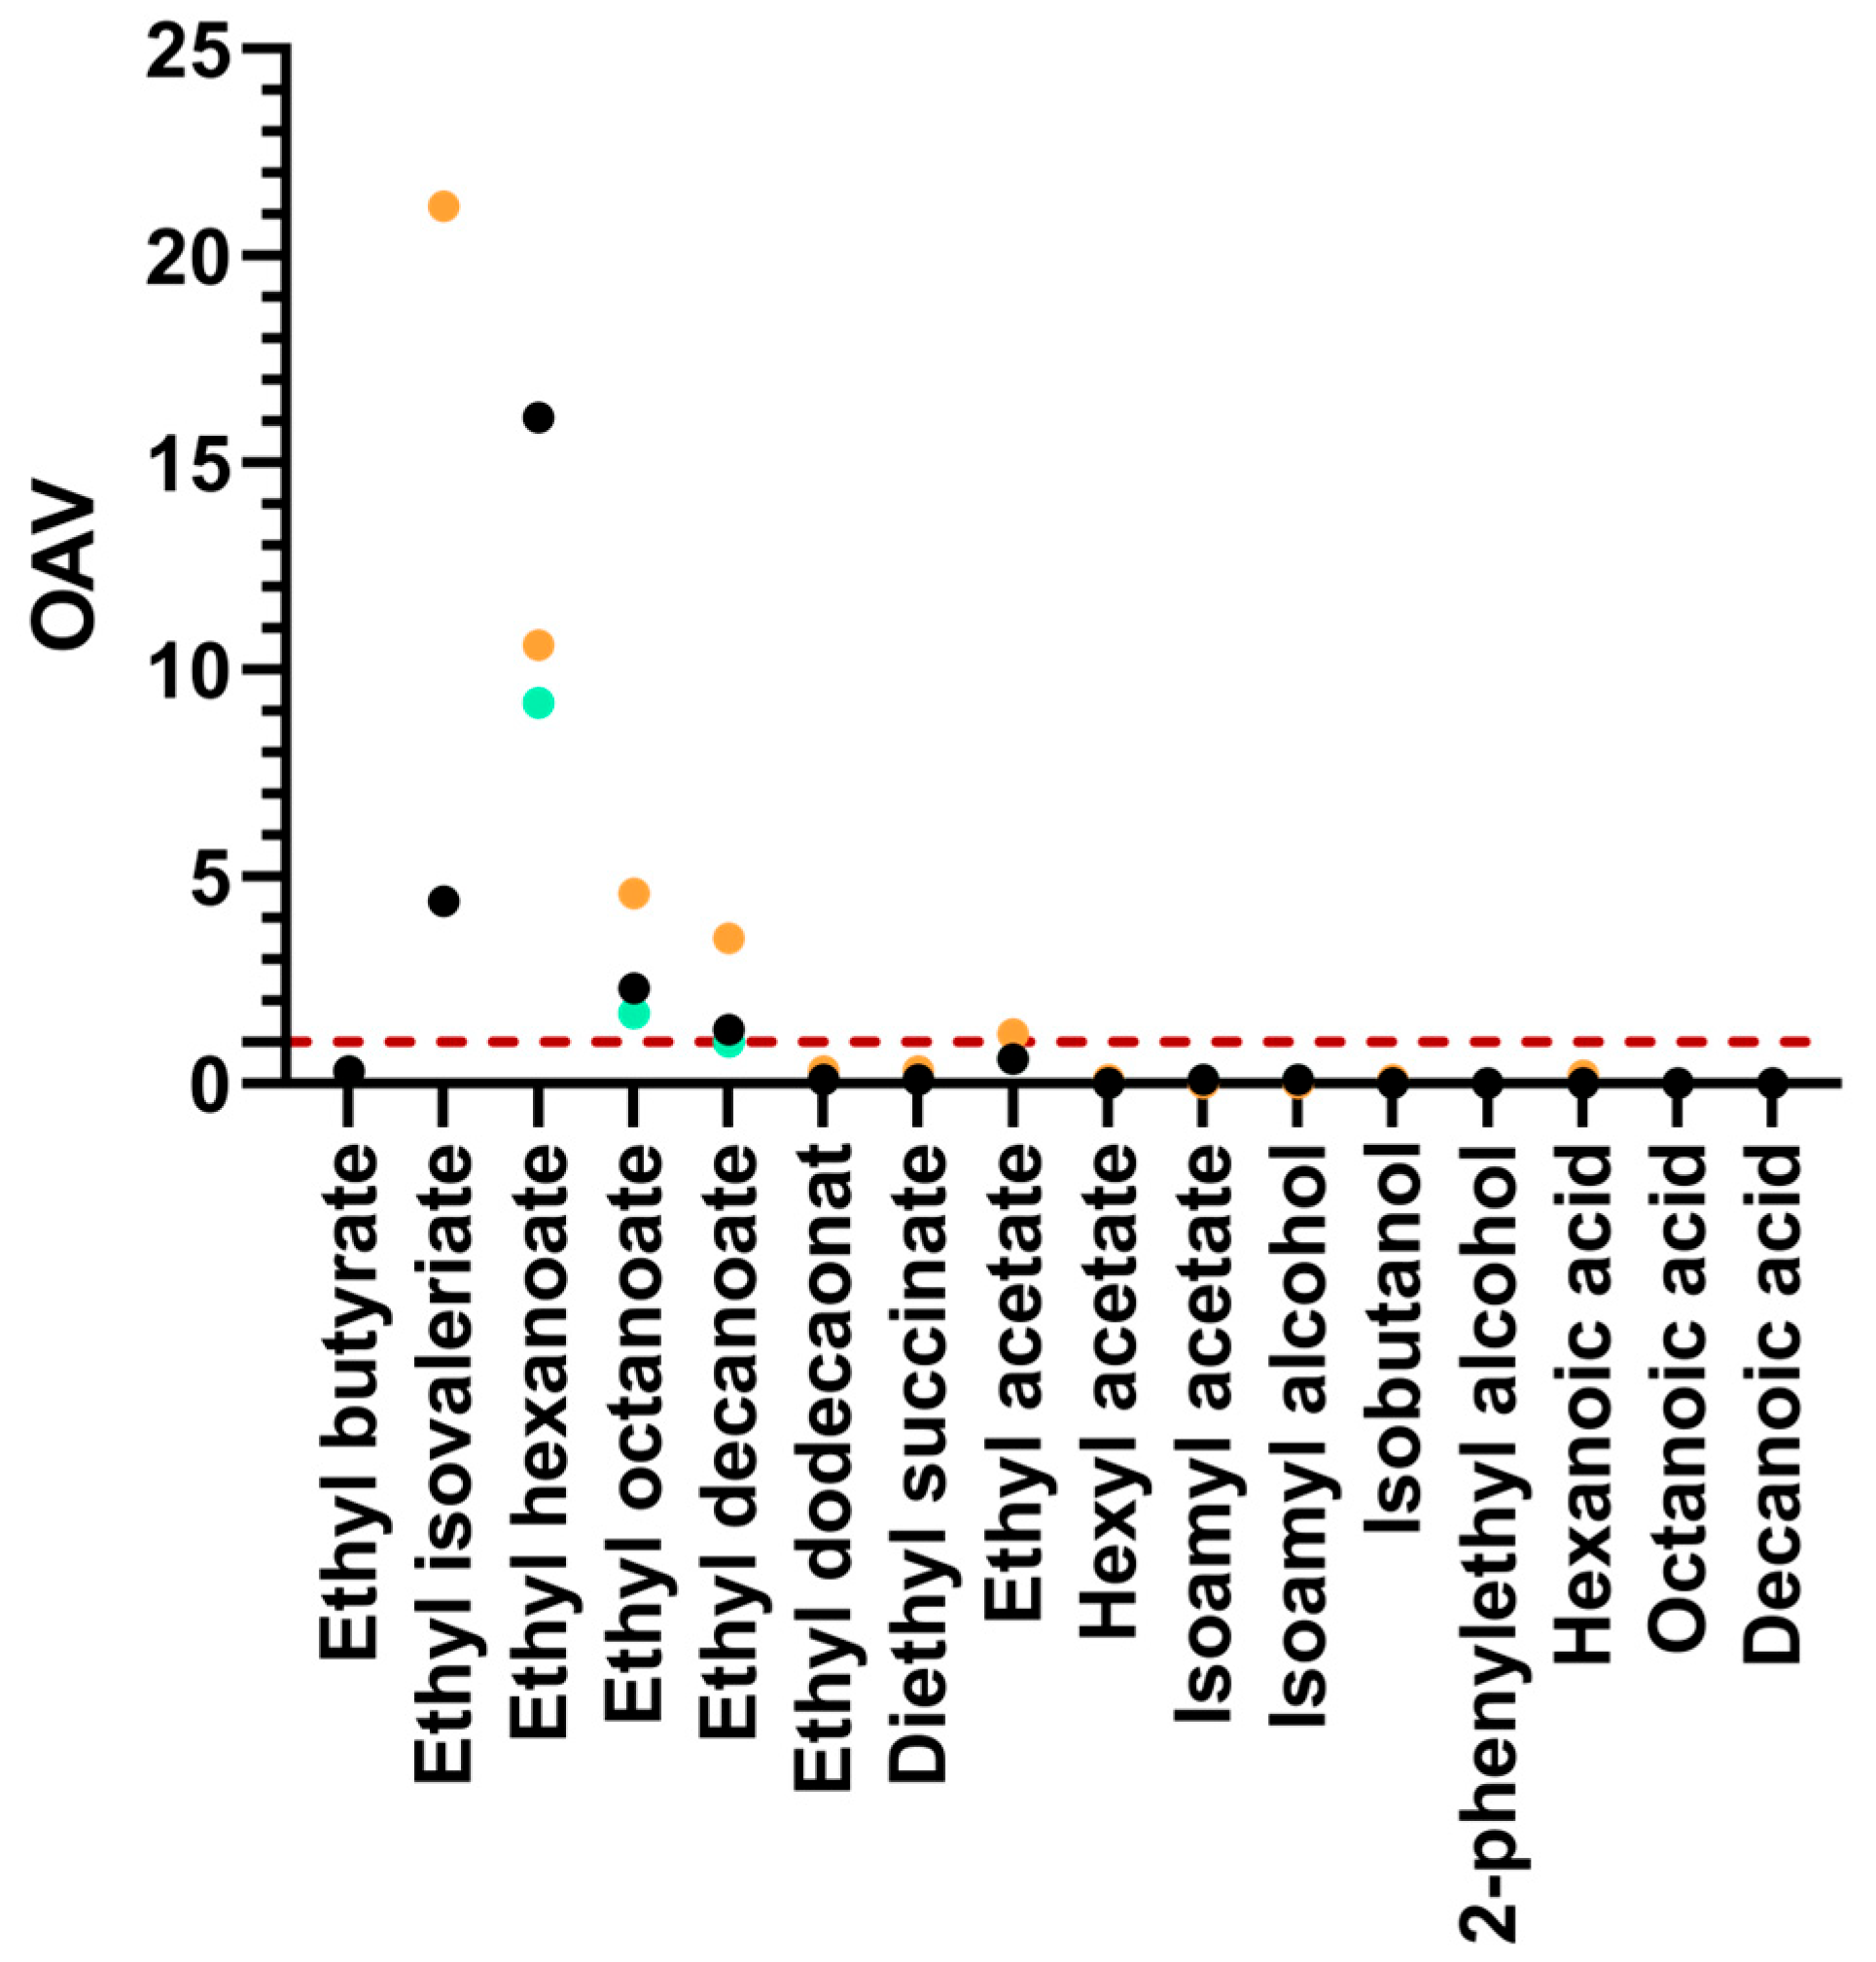
3.5. Wine Aromatic Compounds on Pilot Scale Microvinification

Aromatic compounds from microvinifications were assessed to evaluate the aromatic profile. ScC was the microvinification with a higher concentration of aromas from all four families of compounds analysed (Table 3), with significative differences in comparison with ScM and Lt97 + ScM except at Total alcohol concentration. As described by other authors [41], sequential Lt97 + ScM microvinification reported lower concentrations in ethyl ester compounds (ethyl hexanoate, ethyl octanoate and ethyl decanoate) in comparison with ScM microvinification but only in ethyl hexanoate the differences were significant. Nevertheless, it was seen in Lt97 + ScM an increasing tendency with total acetates compounds (ethyl acetate, hexyl acetate, isobutyl acetate and isoamyl acetate) in addition to an increase in total alcohols (isoamyl alcohol, isobutanol and 2-phenylethyl alcohol) in comparison with ScM. This Lt97 + ScM total family concentrations were in general significatively lower in comparison with ScC microvinification, which doubled the concentration in many compounds. This behaviour in sequential inoculation of generally lower aromatic compound productions in comparison with pure inoculation has also been reported by other authors [25,31,34].
Moreover, in medium chain fatty acids (MCFA) a non-significative lower concentration was reported in Lt97 + ScM compared to ScM agreeing with other authors [25,31]. Octanoic acid and decanoic acid were not detected in ScC microvinification. This different MCFA final composition in microvinifications could be due to the differences in metabolism of S. cerevisiae and L. thermotolerans and its release to media and condensation with other compounds such as ethanol [60].
The contribution of the volatile compounds to the aroma of the wine was evaluated for each compound through the OAV. In all microvinifications, a total of 4 compounds were detected as active aromas: ethyl isovaleriate, ethyl hexanoate, ethyl octanoate and ethyl decanoate. The greater OAV scores were found for ethyl isovaleriate that corresponds to fruity and apple descriptors [61] for ScC microvinification, followed by similar OAV for ScM and Lt97 + ScM microvinifications (Figure 6). The same behaviour applies to ethyl octanoate and ethyl decanoate with aromas corresponding to fruit, sweet and floral [62], where ScC had the higher OAV. The greater ethyl hexanoate OAV, which corresponds to green apple and anise [63], was found in microvinification with ScM and no differences were found between Lt97 + ScM and ScC.
In all three fermentations, a low aromatic wine profile counting to OAV values can be suggested, which was also described during organoleptic evaluation by tasters (Figure 7). In relation to the commercial datasheet of ScC (Fermivin PDM), this S. cerevisiae strain is a neutral yeast that maintains the grape aromatic profile. In these microvinification conditions, ScM could be described as similar to ScC strain when used alone or in mixed microvinification with L. thermotolerans since lower OAV scores were obtained, except for ethyl hexanoate. These OAV scores were contrasted with tasting panel results in order to evaluate the impact of L. thermotolerans use in mixed fermentation.

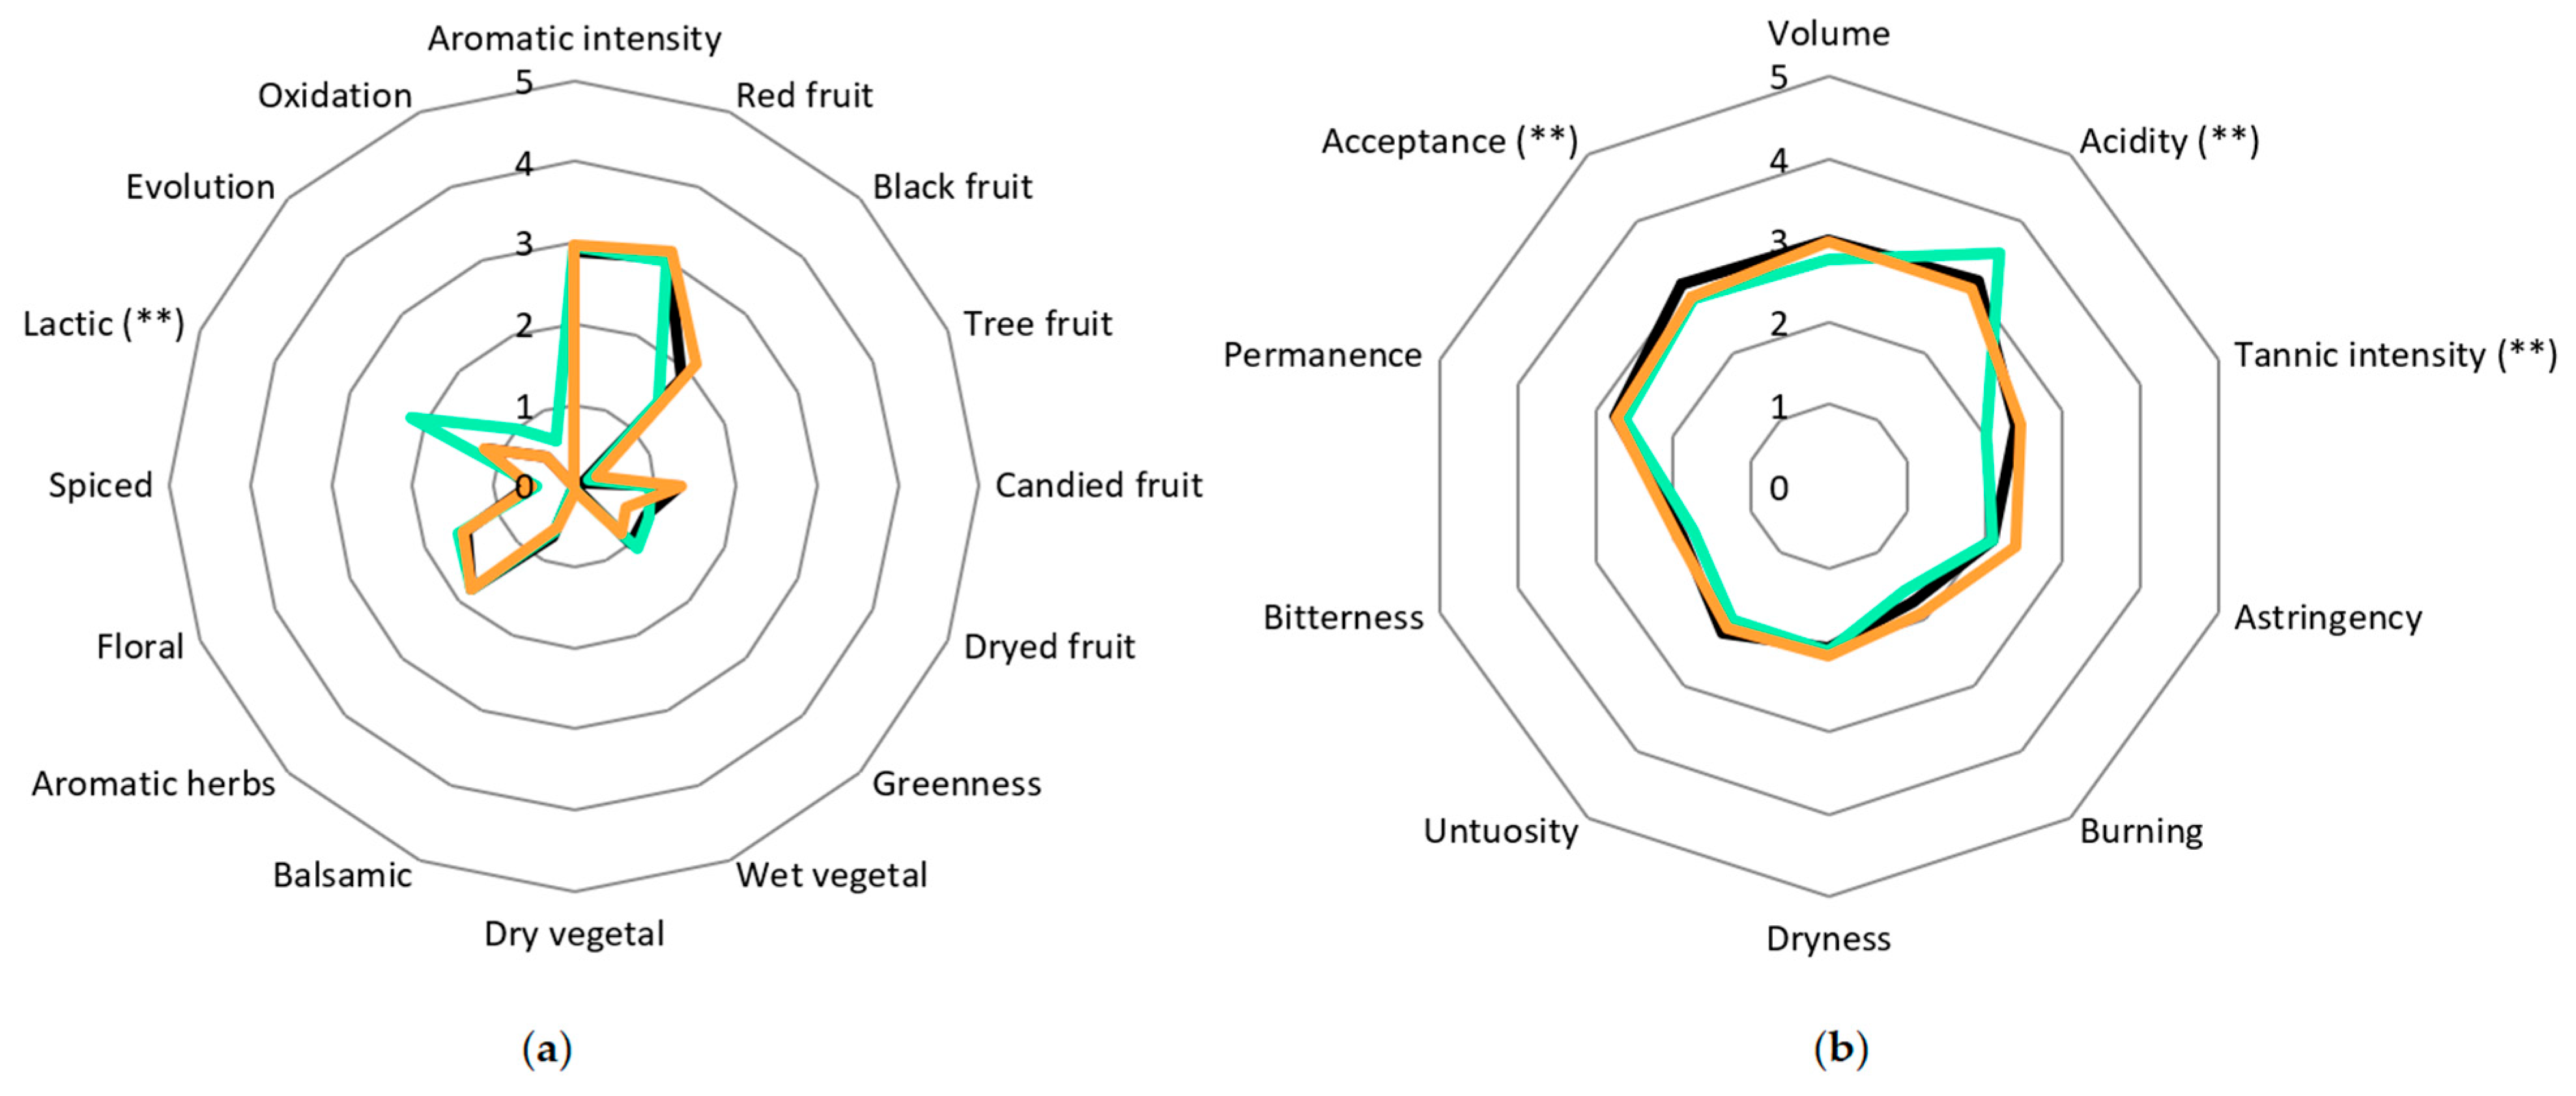
3.6. Organoleptic Evaluation

The organoleptic properties of wines produced by the three experimental conditions were described by quantitative descriptive analysis to detect the main differences between them. Regarding the aromatic profile of the studied wines, they were notably related to ethyl esters family compounds as seen previously with OAV scores (Figure 6). Aromatic herbs, floral and greenness were some of the attributes evaluated with higher scores for tasters. These compounds are related to fruity aromas, mainly apple, green apple, pear, floral and sweet [61,62,63] (Figure 7a). No significant differences between wines were observed in the sensorial evaluation of generic attributes except for lactic notes in Lt97 + ScM microvinification in comparison with S. cerevisiae microvinifications. Aromatic defects were not detected either by tasters. Wines were described as medium intensity aromatic profile with other main descriptors such as red fruit, black fruit, balsamic and aromatic herbs, agreeing with Grenache variety wine descriptors [64]. In the gustatory phase, Lt97 + ScM was described as the most acidic wine in a significative way and the one with less tannic intensity (Figure 7b). These results were expected, due to the final bioacidification of the microvinification with L. thermotolerans in comparison with ScM and ScC. Other authors also reported at sensorial analysis test a higher acid perception by the tasters due to bioacidification, also in sequential vinification [33,34,41]. This L-lactic acid production affected astringency and volume perception where ScC was described as the most astringent and Lt97 + ScM the less astringent. All wines were described as similar in aromatic intensity and permanence in mouth. Finally, global wine preference was to ScC microvinification that was significatively preferred among ScM and Lt97 + ScM microvinifications.
Other authors have similarly reported that, while the acidified vinification with L. thermotolerans was found to be pleasant, it was not the best rated in comparison to the control vinification [33,34]. Despite the use of L. thermotolerans can enhance freshness according to tasters [34], excessive bioacidification could be notably not desired by consumers. Nevertheless, this bioacidification yield is a great technological alternative to obtain commercially interesting wines under a scenario of climate change. There are different procedures used in oenology for correcting pH and TA such as the addition of grape acids, mainly tartaric acid, or ion exchangers as resins described in Morata et al. 2022 [43]. These treatments are used in wineries to modify a portion of must, in order to blend with other final vinifications and adjust final TA and pH values. In this line, L. thermotolerans bioacidification capacity can be used not only for common fermentations but for fermenting small must volumes to blend with other vinifications to correct low TA or high pH, and obtaining wines with correct TA and pH that agrees with consumer preferences.

4. Conclusions

The study provided valuable insights into the fermentation abilities of wild strains isolated from the Rioja AOC, demonstrating that the L. thermotolerans Lt97 strain exhibits a remarkable acidifying capacity even at a microvinification scale of 50 kg of Grenache grapes. The results underscore the importance of carefully selecting both the appropriate strain and inoculation strategy to achieve effective bioacidification, thereby avoiding sluggish fermentations in industrial microvinifications. Moreover, the combined use of Lt97 and ScM strains resulted in successful microvinifications with no defects detected during tasting evaluations.
A key innovation of this approach is the use of wild L. thermotolerans strains for controlled bioacidification, as they naturally enhance acidity while maintaining the sensory balance of the final product. In contrast to traditional methods or alternative methods that rely on chemical acidifiers or ion exchange resins, these wild strains offer a biological and sustainable alternative by producing L-lactic acid during fermentation. This process enables controlled pH reduction without the need for external acid additions, thereby improving the stability, freshness, and aromatic complexity of the wine.
Ultimately, the ability to produce wines with diverse aromatic profiles and varying levels of acidity represents a strategic advantage for winemakers, allowing them to develop blends that meet specific consumer preferences. These preliminary findings highlight the potential of the Lt97 strain for future applications in commercial vinification. Additionally, scaling up the use of L. thermotolerans for controlled bioacidification offers a promising pathway to sustainable winemaking, particularly in the context of climate change. As rising temperatures lead to lower natural acidity and higher pH levels in grapes, this biological alternative provides a means to enhance the resilience and sustainability of wine production.

Author Contributions

Conceptualization, D.F.-V., M.S.-F. and I.A.; formal analysis, D.F.-V. and M.S.-F.; investigation, D.F.-V. and J.V.; data curation, D.F.-V. and M.S.-F.; writing—original draft preparation, D.F.-V. and M.S.-F.; writing—review and editing, D.F.-V., M.S.-F., I.A., J.V., M.P. and E.N.; supervision, I.A.; project administration, S.d.L.; funding acquisition, S.d.L. All authors have read and agreed to the published version of the manuscript.

Funding

Funding for this research was provided by the LowpHWine Companies Consortia through the CDTI project LowpHWine (IDI-20210391). Daniel Fernández-Vázquez and Mercè Sunyer-Figueres have received a grant from Ministry of Labor and Social Economy, Spain, Investigo Program (2021-C23.I01.P03.S0020-0000008).

Institutional Review Board Statement

The organoleptic study was conducted in accordance with the official document of VITEC (PG.15 Selection, basic training and control of judges) approved by the Director of VITEC.

Informed Consent Statement

Informed consent was obtained from all subjects involved in the study.

Data Availability Statement

The original contributions presented in this study are included in the article. Further inquiries can be directed to the corresponding authors.

Acknowledgments

The authors are grateful to the Ministry of Economy and Competitiveness, Spain (Project IDI-20210391) for its financial support. Authors thank Bodegas Roda S.A. for their implication in the project; and to Unit of Microbiology, Department of Genetics, Physiology and Microbiology, Complutense University of Madrid for strain typification.

Conflicts of Interest

The authors declare that this study received funding from the LowpHWine Companies Consortia through the CDTI project LowpHWine (IDI-20210391). The funder was not involved in the study design, collection, analysis, interpretation of data, the writing of this article or the decision to submit it for publication.

Appendix A

Table A1. Raw data of the chemical parameters of final wines fermented with the strategy SEQ48 with different strains of L. thermotolerans tested. Data is expressed as mean value and SD (standard deviation) of n = 2 by ANOVA and Tukey HSD post-test (p > 0.05), and statistically significative differences are indicated by different letters (a, b, c).
ConditionsVolatile Acidity (g/L)Alcohol % (v/v)Total SO2 (mg/L)Glycerol (g/L)
ScF Control0.67 ± 0.09 a15.80 ± 0.14 a7.50 ± 0.71 a10.75 ± 0.07 a
Lt070.82 ± 0.06 a11.74 ± 0.63 b1.50 ± 0.71 b11.65 ± 0.64 a
Lt290.86 ± 0.03 a11.83 ± 0.55 bc4.00 ± 0.00 b11.10 ± 0.00 a
Lt750.63 ± 0.07 a11.42 ± 0.28 b4.00 ± 1.41 b10.55 ± 0.78 a
Lt970.78 ± 0.01 a11.14 ± 0.06 c4.50 ± 0.71 ab11.10 ± 0.14 a
Table A2. Raw data of the chemical parameters of final wines fermented different inoculation strategies (CO105 CO104 and SEQ24) and two strains of L. thermotolerans (Lt29 and Lt97). Data is expressed as mean value and SD (standard deviation) of n = 2 by ANOVA and Tukey HSD post-test (p > 0.05), and statistically significative differences are indicated by different letters (a, b, c, d).
ConditionsVolatile Acidity (g/L)Alcohol % (v/v)Residual Sugar (g/L)
ScF Control0.79 ± 0.01 ab15.40 ± 0.02 a1.00 ± 0.01 a
Lt29CO1050.59 ± 0.01 a14.94 ± 0.01 b1.00 ± 0.01 a
Lt97CO1050.63 ± 0.01 a14.83 ± 0.03 b1.00 ± 0.01 a
Lt29CO1040.83 ± 0.01 ab12.45 ± 0.28 c3.95 ± 1.10 a
Lt97CO1041.00 ± 0.23 b12.32 ± 0.04 c2.47 ± 1.74 a
Lt29SEQ240.87 ± 0.01 ab10.89 ± 0.11 d23.85 ± 2.47 b
Lt97SEQ240.87 ± 0.02 ab11.09 ± 0.09 d22.00 ± 1.56 b

References

  1. Arias, L.A.; Berli, F.; Fontana, A.; Bottini, R.; Piccoli, P. Climate Change Effects on Grapevine Physiology and Biochemistry: Benefits and Challenges of High Altitude as an Adaptation Strategy. Front. Plant Sci. 2022, 13, 835425. [Google Scholar] [CrossRef]
  2. Van Leeuwen, C.; Destrac-Irvine, A.; Dubernet, M.; Duchêne, E.; Gowdy, M.; Marguerit, E.; Pieri, P.; Parker, A.; De Rességuier, L.; Ollat, N. An Update on the Impact of Climate Change in Viticulture and Potential Adaptations. Agronomy 2019, 9, 514. [Google Scholar] [CrossRef]
  3. Gutiérrez-Gamboa, G.; Zheng, W.; Martínez De Toda, F. Current Viticultural Techniques to Mitigate the Effects of Global Warming on Grape and Wine Quality: A Comprehensive Review. Food Res. Int. 2021, 139, 109946. [Google Scholar] [CrossRef]
  4. Van Leeuwen, C.; Destrac-Irvine, A. Modified Grape Composition under Climate Change Conditions Requires Adaptations in the Vineyard. OENO One 2017, 51, 147. [Google Scholar] [CrossRef]
  5. Santos, J.A.; Fraga, H.; Malheiro, A.C.; Moutinho-Pereira, J.; Dinis, L.-T.; Correia, C.; Moriondo, M.; Leolini, L.; Dibari, C.; Costafreda-Aumedes, S.; et al. A Review of the Potential Climate Change Impacts and Adaptation Options for European Viticulture. Appl. Sci. 2020, 10, 3092. [Google Scholar] [CrossRef]
  6. Morata, A.; Bañuelos, M.A.; Vaquero, C.; Loira, I.; Cuerda, R.; Palomero, F.; González, C.; Suárez-Lepe, J.A.; Wang, J.; Han, S.; et al. Lachancea thermotolerans as a Tool to Improve pH in Red Wines from Warm Regions. Eur. Food Res. Technol. 2019, 245, 885–894. [Google Scholar] [CrossRef]
  7. Comuzzo, P.; Del Fresno, J.M.; Voce, S.; Loira, I.; Morata, A. Emerging Biotechnologies and Non-Thermal Technologies for Winemaking in a Context of Global Warming. Front. Microbiol. 2023, 14, 1273940. [Google Scholar] [CrossRef]
  8. Colibaba, L.C.; Bosoi, I.; Pușcalău, M.; Bodale, I.; Luchian, C.; Rotaru, L.; Cotea, V.V. Climatic Projections vs. Grapevine Phenology: A Regional Case Study. Not. Bot. Horti Agrobot. Cluj-Napoca 2024, 52, 13381. [Google Scholar] [CrossRef]
  9. Llanaj, C.; McGregor, G. Climate Change, Grape Phenology, and Frost Risk in Southeast England. Aust. J. Grape Wine Res. 2022, 2022, 1–16. [Google Scholar] [CrossRef]
  10. Baltazar, M.; Castro, I.; Gonçalves, B. Adaptation to Climate Change in Viticulture: The Role of Varietal Selection—A Review. Plants 2025, 14, 104. [Google Scholar] [CrossRef]
  11. Fleet, G.H. Wine Yeasts for the Future. FEMS Yeast Res. 2008, 8, 979–995. [Google Scholar] [CrossRef] [PubMed]
  12. Vejarano, R.; Gil-Calderón, A. Commercially Available Non-Saccharomyces Yeasts for Winemaking: Current Market, Advantages over Saccharomyces, Biocompatibility, and Safety. Fermentation 2021, 7, 171. [Google Scholar] [CrossRef]
  13. Berbegal, C.; Fragasso, M.; Russo, P.; Bimbo, F.; Grieco, F.; Spano, G.; Capozzi, V. Climate Changes and Food Quality: The Potential of Microbial Activities as Mitigating Strategies in the Wine Sector. Fermentation 2019, 5, 85. [Google Scholar] [CrossRef]
  14. Bourbon-Melo, N.; Palma, M.; Rocha, M.P.; Ferreira, A.; Bronze, M.R.; Elias, H.; Sá-Correia, I. Use of Hanseniaspora guilliermondii and Hanseniaspora opuntiae to Enhance the Aromatic Profile of Beer in Mixed-Culture Fermentation with Saccharomyces cerevisiae. Food Microbiol. 2021, 95, 103678. [Google Scholar] [CrossRef]
  15. Canonico, L.; Agarbati, A.; Galli, E.; Comitini, F.; Ciani, M. Metschnikowia pulcherrima as Biocontrol Agent and Wine Aroma Enhancer in Combination with a Native Saccharomyces cerevisiae. LWT 2023, 181, 114758. [Google Scholar] [CrossRef]
  16. Nadai, C.; Giacomini, A.; Corich, V. The Addition of Wine Yeast Starmerella bacillaris to Grape Skin Surface Influences Must Fermentation and Glycerol Production. OENO One 2021, 55, 47–55. [Google Scholar] [CrossRef]
  17. Canonico, L.; Gattucci, S.; Moretti, L.; Agarbati, A.; Comitini, F.; Ciani, M. Ethanol Reduction in Montepulciano Wine: Starmerella bombicola Sequential Fermentation at Pilot Scale Under Aeration Conditions. Foods 2025, 14, 618. [Google Scholar] [CrossRef]
  18. Rojas, V. Acetate Ester Formation in Wine by Mixed Cultures in Laboratory Fermentations. Int. J. Food Microbiol. 2003, 86, 181–188. [Google Scholar] [CrossRef]
  19. Andorrà, I.; Berradre, M.; Rozès, N.; Mas, A.; Guillamón, J.M.; Esteve-Zarzoso, B. Effect of Pure and Mixed Cultures of the Main Wine Yeast Species on Grape Must Fermentations. Eur. Food Res. Technol. 2010, 231, 215–224. [Google Scholar] [CrossRef]
  20. Andorrà, I.; Berradre, M.; Mas, A.; Esteve-Zarzoso, B.; Guillamón, J.M. Effect of Mixed Culture Fermentations on Yeast Populations and Aroma Profile. LWT 2012, 49, 8–13. [Google Scholar] [CrossRef]
  21. Benito, S. Combined Use of Lachancea thermotolerans and Schizosaccharomyces pombe in Winemaking: A Review. Microorganisms 2020, 8, 655. [Google Scholar] [CrossRef]
  22. Vicente, J.; Baran, Y.; Navascués, E.; Santos, A.; Calderón, F.; Marquina, D.; Rauhut, D.; Benito, S. Biological Management of Acidity in Wine Industry: A Review. Int. J. Food Microbiol. 2022, 375, 109726. [Google Scholar] [CrossRef]
  23. Sauer, M.; Porro, D.; Mattanovich, D.; Branduardi, P. 16 Years Research on Lactic Acid Production with Yeast—Ready for the Market. Biotechnol. Genet. Eng. Rev. 2010, 27, 229–256. [Google Scholar]
  24. Jolly, N.P.; Varela, C.; Pretorius, I.S. Not Your Ordinary Yeast: Non- Saccharomyces Yeasts in Wine Production Uncovered. FEMS Yeast Res. 2014, 14, 215–237. [Google Scholar] [CrossRef]
  25. Hranilovic, A.; Albertin, W.; Capone, D.L.; Gallo, A.; Grbin, P.R.; Danner, L.; Bastian, S.E.P.; Masneuf-Pomarede, I.; Coulon, J.; Bely, M.; et al. Impact of Lachancea thermotolerans on Chemical Composition and Sensory Profiles of Viognier Wines. J. Fungi 2022, 8, 474. [Google Scholar] [CrossRef]
  26. Vicente, J.; Vladic, L.; Navascués, E.; Brezina, S.; Santos, A.; Calderón, F.; Tesfaye, W.; Marquina, D.; Rauhut, D.; Benito, S. A Comparative Study of Lachancea thermotolerans Fermentative Performance under Standardized Wine Production Conditions. Food Chem. X 2024, 21, 101214. [Google Scholar] [CrossRef]
  27. Whitener, M.E.B.; Stanstrup, J.; Carlin, S.; Divol, B.; Du Toit, M.; Vrhovsek, U. Effect of Non- Saccharomyces Yeasts on the Volatile Chemical Profile of Shiraz Wine: Shiraz Wines Fermented by Non-Saccharomyces Yeasts. Aust. J. Grape Wine Res. 2017, 23, 179–192. [Google Scholar] [CrossRef]
  28. Banilas, G.; Sgouros, G.; Nisiotou, A. Development of Microsatellite Markers for Lachancea thermotolerans Typing and Population Structure of Wine-Associated Isolates. Microbiol. Res. 2016, 193, 1–10. [Google Scholar] [CrossRef]
  29. Kemsawasd, V.; Branco, P.; Almeida, M.G.; Caldeira, J.; Albergaria, H.; Arneborg, N. Cell-to-Cell Contact and Antimicrobial Peptides Play a Combined Role in the Death of Lachanchea thermotolerans during Mixed-Culture Alcoholic Fermentation with Saccharomyces cerevisiae. FEMS Microbiol. Lett. 2015, 362, fnv103. [Google Scholar]
  30. Hranilovic, A.; Gambetta, J.M.; Schmidtke, L.; Boss, P.K.; Grbin, P.R.; Masneuf-Pomarede, I.; Bely, M.; Albertin, W.; Jiranek, V. Oenological Traits of Lachancea thermotolerans Show Signs of Domestication and Allopatric Differentiation. Sci. Rep. 2018, 8, 14812. [Google Scholar] [CrossRef]
  31. Hranilovic, A.; Albertin, W.; Capone, D.L.; Gallo, A.; Grbin, P.R.; Danner, L.; Bastian, S.E.P.; Masneuf-Pomarede, I.; Coulon, J.; Bely, M.; et al. Impact of Lachancea thermotolerans on Chemical Composition and Sensory Profiles of Merlot Wines. Food Chem. 2021, 349, 129015. [Google Scholar] [CrossRef]
  32. Benito, Á.; Calderón, F.; Palomero, F.; Benito, S. Combine Use of Selected Schizosaccharomyces pombe and Lachancea thermotolerans Yeast Strains as an Alternative to theTraditional Malolactic Fermentation in Red Wine Production. Molecules 2015, 20, 9510–9523. [Google Scholar] [CrossRef]
  33. Benito, Á.; Calderón, F.; Palomero, F.; Benito, S. Quality and Composition of Airen Wines Fermented by Sequential Inoculation of Lachancea thermotolerans and Saccharomyces cerevisiae. Food Technol. Biotechnol. 2016, 54, 135–144. [Google Scholar] [CrossRef]
  34. Izquierdo-Cañas, P.M.; Del Fresno, J.M.; Malfeito-Ferreira, M.; Mena-Morales, A.; García-Romero, E.; Heras, J.M.; Loira, I.; González, C.; Morata, A. Wine Bioacidification: Fermenting Airén Grape Juices with Lachancea thermotolerans and Metschnikovia pulcherrima Followed by Sequential Saccharomyces cerevisiae Inoculation. Int. J. Food Microbiol. 2025, 427, 110977. [Google Scholar] [CrossRef]
  35. Sgouros, G.; Mallouchos, A.; Filippousi, M.-E.; Banilas, G.; Nisiotou, A. Molecular Characterization and Enological Potential of A High Lactic Acid-Producing Lachancea thermotolerans Vineyard Strain. Foods 2020, 9, 595. [Google Scholar] [CrossRef]
  36. Benito, S. The Impacts of Lachancea thermotolerans Yeast Strains on Winemaking. Appl. Microbiol. Biotechnol. 2018, 102, 6775–6790. [Google Scholar] [CrossRef]
  37. Morata, A.; Loira, I.; Tesfaye, W.; Bañuelos, M.A.; González, C.; Suárez Lepe, J.A. Lachancea thermotolerans Applications in Wine Technology. Fermentation 2018, 4, 53. [Google Scholar] [CrossRef]
  38. Aponte, M.; Blaiotta, G. Potential Role of Yeast Strains Isolated from Grapes in the Production of Taurasi DOCG. Front. Microbiol. 2016, 7, 809. [Google Scholar] [CrossRef]
  39. Vaquero, C.; Loira, I.; Bañuelos, M.A.; Heras, J.M.; Cuerda, R.; Morata, A. Industrial Performance of Several Lachancea thermotolerans Strains for pH Control in White Wines from Warm Areas. Microorganisms 2020, 8, 830. [Google Scholar] [CrossRef]
  40. Morata, A.; Bañuelos, M.A.; López, C.; Song, C.; Vejarano, R.; Loira, I.; Palomero, F.; Suarez Lepe, J.A. Use of Fumaric Acid to Control pH and Inhibit Malolactic Fermentation in Wines. Food Addit. Contam. Part A 2020, 37, 228–238. [Google Scholar] [CrossRef]
  41. Gobbi, M.; Comitini, F.; Domizio, P.; Romani, C.; Lencioni, L.; Mannazzu, I.; Ciani, M. Lachancea thermotolerans and Saccharomyces cerevisiae in Simultaneous and Sequential Co-Fermentation: A Strategy to Enhance Acidity and Improve the Overall Quality of Wine. Food Microbiol. 2013, 33, 271–281. [Google Scholar] [CrossRef]
  42. Battjes, J.; Melkonian, C.; Mendoza, S.N.; Haver, A.; Al-Nakeeb, K.; Koza, A.; Schrubbers, L.; Wagner, M.; Zeidan, A.A.; Molenaar, D.; et al. Ethanol-Lactate Transition of Lachancea thermotolerans Is Linked to Nitrogen Metabolism. Food Microbiol. 2023, 110, 104167. [Google Scholar] [CrossRef]
  43. Morata, A.; Loira, I.; González, C.; Bañuelos, M.A.; Cuerda, R.; Heras, J.M.; Vaquero, C.; Suárez-Lepe, J.A. Biological Acidification by Lachancea thermotolerans. In White Wine Technology; Elsevier: Amsterdam, The Netherlands, 2022; pp. 131–142. [Google Scholar]
  44. Esteve-Zarzoso, B.; Belloch, C.; Uruburu, F.; Querol, A. Identificationof Yeasts by RFLP Analysis of the 5.85 rRNA Gene and the Two Ribosomal Internal Transcribed Spacers. Int. J. Syst. Bacteriol. 1999, 49, 329–337. [Google Scholar] [CrossRef]
  45. Vicente, J.; Navascués, E.; Benito, S.; Marquina, D.; Santos, A. Microsatellite Typing of Lachancea thermotolerans for Wine Fermentation Monitoring. Int. J. Food Microbiol. 2023, 394, 110186. [Google Scholar] [CrossRef]
  46. Legras, J.-L.; Karst, F. Optimisation of Interdelta Analysis for Saccharomyces cerevisiae Strain Characterisation. FEMS Microbiol. Lett. 2003, 221, 249–255. [Google Scholar] [CrossRef]
  47. Morris, E.O.; Eddy, A.A. Method for the measurement of wild yeast infection in pitching yeast. J. Inst. Brew. 1957, 63, 34–35. [Google Scholar] [CrossRef]
  48. OIV. Compendium of Intenational Methods of Wine and Must Analysis, 2023rd ed.; OIV: Dijon, France, 2023; Volume 1–2. [Google Scholar]
  49. Mislata, A.M.; Puxeu, M.; Tomás, E.; Nart, E.; Ferrer-Gallego, R. Influence of the Oxidation in the Aromatic Composition and Sensory Profile of Rioja Red Aged Wines. Eur. Food Res. Technol. 2020, 246, 1167–1181. [Google Scholar] [CrossRef]
  50. Vilanova, M.; Martínez, C. First Study of Determination of Aromatic Compounds of Red Wine from Vitis vinifera Cv. Castañal Grown in Galicia (NW Spain). Eur. Food Res. Technol. 2007, 224, 431–436. [Google Scholar] [CrossRef]
  51. Vilanova, M.; Genisheva, Z.; Graña, M.; Oliveira, J.M. Determination of Odorants in Varietal Wines from International Grape Cultivars (Vitis vinifera) Grown in NW Spain. S. Afr. J. Enol. Vitic. 2016, 34, 212–222. [Google Scholar] [CrossRef]
  52. Guth, H. Quantitation and Sensory Studies of Character Impact Odorants of Different White Wine Varieties. J. Agric. Food Chem. 1997, 45, 3027–3032. [Google Scholar] [CrossRef]
  53. ISO 8586:2023; Sensory Analysis—Selection and Training of Sensory Assessors (3rd ed.). International Organization for Standarization (ISO): Geneva, Switzerland, 2023.
  54. ISO 8589:2007; Sensory Analysis—General Guidance for the Design of Test Rooms (2nd ed.). International Organization for Standarization (ISO): Brussels, Belgique, 2007.
  55. Comitini, F.; Gobbi, M.; Domizio, P.; Romani, C.; Lencioni, L.; Mannazzu, I.; Ciani, M. Selected Non-Saccharomyces Wine Yeasts in Controlled Multistarter Fermentations with Saccharomyces cerevisiae. Food Microbiol. 2011, 28, 873–882. [Google Scholar] [CrossRef]
  56. Luyt, N.A.; De Witt, R.N.; Divol, B.; Patterton, H.G.; Setati, M.E.; Taillandier, P.; Bauer, F.F. Physical Cell-Cell Contact Elicits Specific Transcriptomic Responses in Wine Yeast Species. Microbiol. Spectr. 2024, 12, e00572-23. [Google Scholar] [CrossRef]
  57. Fairbairn, S.; Engelbrecht, L.; Setati, M.E.; Du Toit, M.; Bauer, F.F.; Divol, B.; Rossouw, D. Combinatorial Analysis of Population Dynamics, Metabolite Levels and Malolactic Fermentation in Saccharomyces cerevisiae/Lachancea thermotolerans Mixed Fermentations. Food Microbiol. 2021, 96, 103712. [Google Scholar] [CrossRef]
  58. Vicente, J.; Navascués, E.; Calderón, F.; Santos, A.; Marquina, D.; Benito, S. An Integrative View of the Role of Lachancea thermotolerans in Wine Technology. Foods 2021, 10, 2878. [Google Scholar] [CrossRef]
  59. Ribéreau-Gayon, P.; Dubourdieu, D.; Donèche, B.; Lonvaud, A. Handbook of Enology: The Microbiology of Wine and Vinifications, 1st ed.; Wiley: Chichester, UK, 2005. [Google Scholar]
  60. Waterhouse, A.L.; Sacks, G.L.; Jeffery, D.W. Understanding Wine Chemistry; Wiley: Chichester, UK, 2016. [Google Scholar]
  61. Francis, I.L.; Newton, J.L. Determining Wine Aroma from Compositional Data. Aust. J. Grape Wine Res. 2005, 11, 114–126. [Google Scholar] [CrossRef]
  62. Peinado, R.A.; Moreno, J.; Bueno, J.E.; Moreno, J.A.; Mauricio, J.C. Comparative Study of Aromatic Compounds in Two Young White Wines Subjected to Pre-Fermentative Cryomaceration. Food Chem. 2004, 84, 585–590. [Google Scholar] [CrossRef]
  63. Ferreira, V.; Ortega, L.; Escudero, A.; Cacho, J.F. A Comparative Study of the Ability of Different Solvents and Adsorbents to Extract Aroma Compounds from Alcoholic Beverages. J. Chromatogr. Sci. 2000, 38, 469–476. [Google Scholar] [CrossRef]
  64. López, R.; Ezpeleta, E.; Sánchez, I.; Cacho, J.; Ferreira, V. Analysis of the Aroma Intensities of Volatile Compounds Released from Mild Acid Hydrolysates of Odourless Precursors Extracted from Tempranillo and Grenache Grapes Using Gas Chromatography-Olfactometry. Food Chem. 2004, 88, 95–103. [Google Scholar] [CrossRef]
Figure 1. Fermentation kinetics of the microfermentations, showing in: (a) density and (b) population of S. cerevisiae (continuous lines) and non-Saccharomyces (discontinuous lines). Each colour represents a fermentation: black for the single with ScF, and the others for the SEQ48 with different L. thermotolerans (blue for Lt07, purple for Lt29, red for Lt75 and green for Lt97). Data is expressed as mean value and SD (standard deviation) of n = 2.
Beverages 11 00070 g001
Figure 2. Chemical parameters of final wines fermented with the strategy SEQ48 with different strains of L. thermotolerans. The parameters are L-lactic acid concentration (g/L) (a), L-malic acid concentration (g/L) (b), Total acidity (g/L) (c) and pH value (d). Data is expressed as mean value and SD (standard deviation) of n = 2, by ANOVA and Tukey HSD post-test (p > 0.05), and statistically significative differences are indicated by different letters (a, b, c, d).
Beverages 11 00070 g002
Figure 3. Fermentation kinetics of the microfermentations. Each colour represents a strain: black for the single fermentation with ScF, and purple and green for mixed fermentation with strains Lt29 and Lt97, respectively; the inoculation strategies are represented by different tonalities, being the darker for CO105, the middle for CO104, and the lighter for SEQ24. Density is represented in graph (a) and the population of S. cerevisiae (continuous lines) and non-Saccharomyces (discontinuous lines) in graphs (b) for the strain Lt29 and (c) for the strain Lt97. Data is expressed as mean value and SD (standard deviation) of n = 2.
Beverages 11 00070 g003
Figure 4. Chemical parameters of final wines fermented with different inoculation strategies CO105, CO104, SEQ24, and two strains of L. thermotolerans (Lt29 and Lt97). Representation of (a) L-lactic acid concentration (g/L), (b) Total acidity (g/L), (c) L-malic acid concentration (g/L) and (d) pH value. (e) represents the ratio of the percentage of alcohol produced by the grams of sugar consumed and (f), the principal component analysis of different chemical and microbiological parameters of the microfermentations. Data is expressed as mean value and SD (standard deviation) of n = 2 by ANOVA and Tukey HSD post-test (p > 0.05), and statistically significative differences are indicated by different letters (a, b, c, d).
Beverages 11 00070 g004
Figure 5. Kinetic of alcoholic microvinification with evolution of density and viable yeast population (cfu/mL) in pilot scale microvinification from ScM (black), Lt97 + ScM (green) and control ScC (orange). Data is expressed as mean value and SD (standard deviation) of n = 2.
Beverages 11 00070 g005
Figure 6. Odorant active values (OAV) of the volatile aroma compounds of wines obtained at pilot scale microvinification. Different conditions are represented in different colours: ScM (black), Lt97 + ScM (green) and control ScC (orange). Red dot line indicates the normalised threshold for each compound.
Beverages 11 00070 g006
Figure 7. Radar chart of aromatic profiles (a) and test aspects and acceptance (b) of the wines obtained in pilot scale microvinifications. Different conditions are represented in different colours: ScM (black), Lt97 + ScM (green) and control ScC (orange). The asterisks symbol indicates statistically significant differences between different wines by ANOVA and Tukey HSD post-test (p > 0.05).
Beverages 11 00070 g007
Table 1. Resume of chemical parameter composition of musts used for both scale experimentations. Data is expressed as mean value and SD (standard deviation) of n = 2.
MustDensity (g/cm3)Total Sugar (g/L)NFA (mg/L)pHTotal Acidity (g/L)
Laboratory scale1.112 ± 0.001264.70 ± 8.30211.76 ± 5.863.85 ± 0.023.18 ± 0.20
Pilot scale1.098 ± 0.001231.72 ± 5.23185.76 ± 7.093.46 ± 0.013.57 ± 0.10
Table 2. Resume of chemical yields in final wines fermented in different conditions at pilot scale microvinifications. Different pilot scale microvinification: ScM (black), Lt97 + ScM (green) and control ScC (orange). Data is expressed as mean value and SD (standard deviation) of n=2 by ANOVA and Tukey HSD post-test (p > 0.05), and statistically significative differences are indicated by different letters (a, b).
ConditionsL-Malic Acid (g/L)L-Lactic Acid (g/L)Total Acidity (g/L)Volatile Acidity (g/L)pHAlcohol % (v/v)
ScM0.54 ± 0.11 a0.92 ± 0.01 a5.49 ± 0.01 a0.40 ± 0.01 a3.55 ± 0.01 a14.13 ± 0.03 ab
Lt97 + ScM0.63 ± 0.02 a4.65 ± 0.98 b8.86 ± 1.07 b0.53 ± 0.13 a3.29 ± 0.07 b13.78 ± 0.23 b
ScC0.73 ± 0.11 a0.97 ± 0.03 a5.03 ± 0.04 a0.33 ± 0.01 a3.60 ± 0.01 a14.75 ± 0.28 a
Table 3. Composition of aromatic compounds in pilot scale final wines by ScM, Lt97 + ScM and ScC experimental conditions. Different letters indicate significant differences between microvinifications for each studied parameter expressed as mean value and SD (standard deviation) of n = 2 by ANOVA and Tukey HSD post-test (p > 0.05), and statistically significative differences are indicated by different letters (a, b, c). No detected concentration indicated as n.d. in the table.
Concentration (µg/L)ScMLt97 + ScMScC
Ethyl butyrate133.1 ± 9.5 a105.2 ± 9.1 a135.6 ± 33.9 a
Ethyl isovaleriate13.1 ± 1.2 a13.1 ± 1.8 a63.7 ± 55.2 a
Ethyl hexanoate1285.7 ± 193.7 b736.6 ± 117.3 a849.2 ± 113.2 b
Ethyl octanoate1341.3 ± 648.1 a1012.7 ± 180.2 a2650.4 ± 119.0 b
Ethyl decanoate674.8 ± 73.6 a515.4 ± 120.9 a1772.1 ± 119 b
Ethyl dodecanoate162.6 ± 17.7 a116.2 ± 21.2 a394.4 ± 47.4 b
Diethyl succinate112.4 ± 23.7 a111.0 ± 34.3 a349.2 ± 39.2 b
Total ethyl esters3723.1 ± 541.2 a2610.2 ± 453 b6214.6 ± 281.8 c
Ethyl acetate4249.9 ± 320.5 a4799.4 ± 1193.5 a8805.4 ± 613.2 b
Hexyl acetate28.8 ± 0.7 a32.8 ± 4.6 a54.7 ± 30.6 a
Isobutyl acetate334.9 ± 17.2 a445.6 ± 55.5 a591.2 ± 517.4 a
Isoamyl acetate16.7 ± 3.2 a19.9 ± 4.4 an.d.
Total acetates
Isoamyl alcohol
4630.3 ± 338.2 a
4427.2 ± 338.2 a
5297.7 ± 1248.8 a
4192.3 ± 578.5 a
9451.4 ± 953.2 b
1048.2 ± 305.5 b
Isobutanol397.8 ± 58.4 a425.2 ± 53.3 a6372.1 ± 828.2 b
2-phenylethyl alcohol
Total alcohols
1148.0 ± 283 a
5972.9 ± 819.9 a
898.4 ± 234.3 a
5516.9 ± 863.6 a
59.1 ± 55.2 b
7479.5 ± 982.7 a
Hexanoic acid12.8 ± 2.4 a10.3 ± 1.7 a592.6 ± 49.0 b
Octanoic acid106.0 ± 8.4 a61.6 ± 9.6 bn.d.
Decanoic acid57.2 ± 3.3 a48.3 ± 9.5 an.d.
Total fatty acids176.0 ± 12.3 a120.3 ± 20.7 a592.6 ± 49.0 b
Disclaimer/Publisher’s Note: The statements, opinions and data contained in all publications are solely those of the individual author(s) and contributor(s) and not of MDPI and/or the editor(s). MDPI and/or the editor(s) disclaim responsibility for any injury to people or property resulting from any ideas, methods, instructions or products referred to in the content.

