
Chemical Quality and Characterization of Essential Oils in Postharvest Hop cv. Cascade: Ventilated Room Temperature as a Sustainable Alternative to Hot-Stove and Freeze-Drying Processes

 , ,
, ,  , ,
, ,  , and
, and
Abstract
: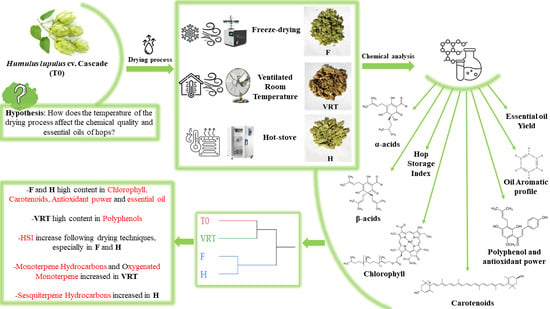
1. Introduction
2. Materials and Methods
2.1. Raw Material and Experimental Setup
2.2. Chemical Analysis of Hop
2.2.1. Chlorophyll and Carotenoids
2.2.2. Total Polyphenols and Antioxidant Activity
2.2.3. α-Acids, β-Acids and Hop Storage Index
2.2.4. Determination of Yield and Aromatic Composition of Essential Oils
2.3. Color Detrmination
2.4. Statistical Analysis
3. Results and Discussion
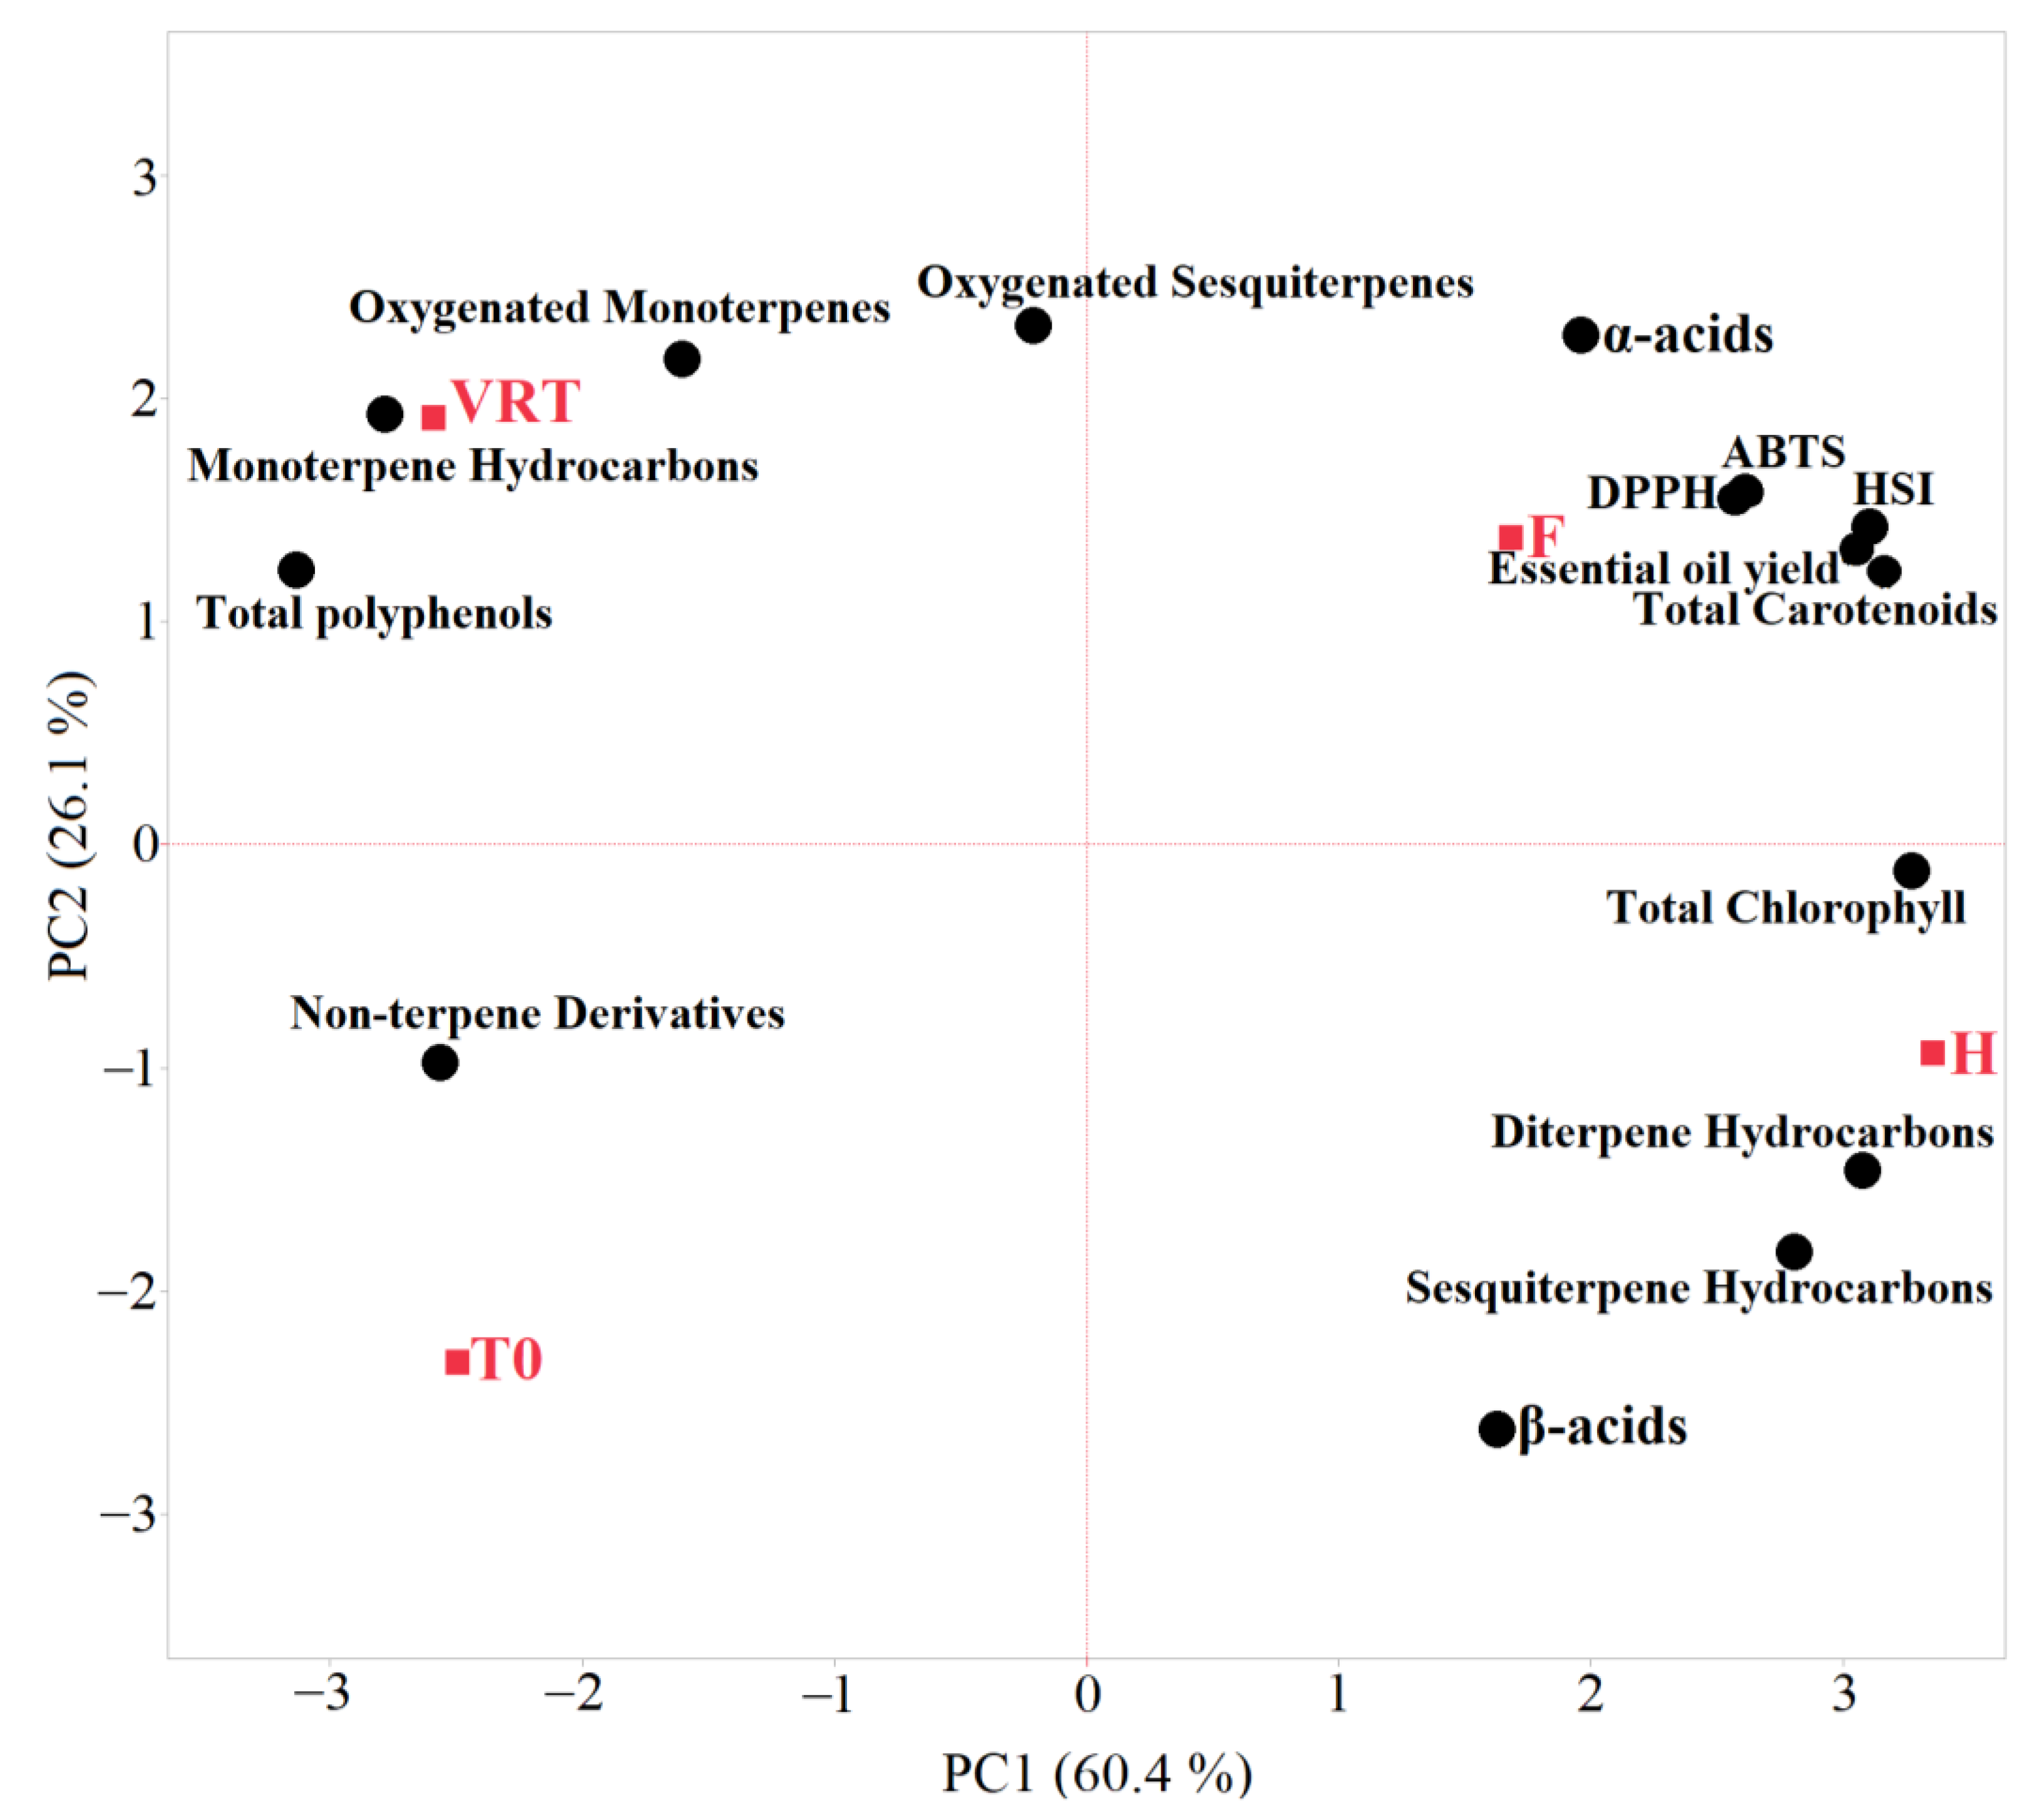
3.1. Chemical Characterization
3.2. Essential Oils Characterization
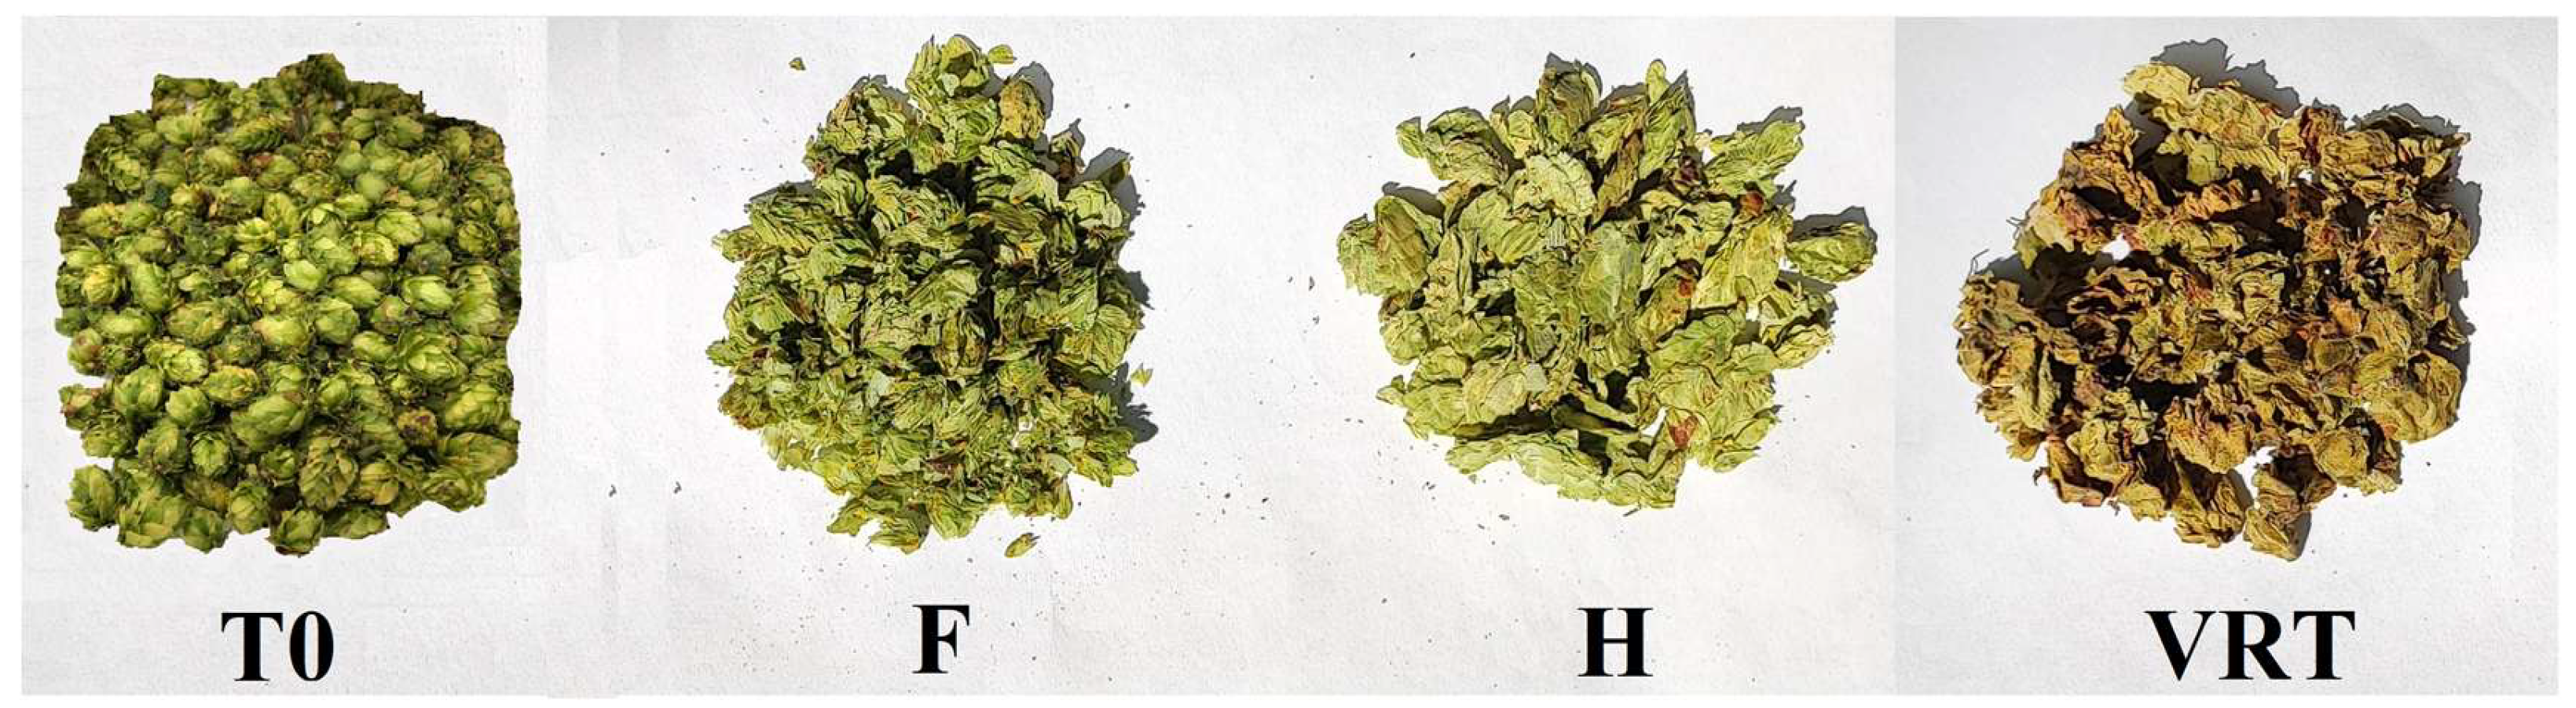
3.3. Color
4. Conclusions
Author Contributions
Funding
Institutional Review Board Statement
Informed Consent Statement
Data Availability Statement
Acknowledgments
Conflicts of Interest
References
- Raut, S.; von Gersdorff, G.J.E.; Münsterer, J.; Kammhuber, K.; Hensel, O.; Sturm, B. Influence of pre-drying storage time on essential oil components in dried hops (Humulus lupulus L.). J. Sci. Food Agric. 2021, 101, 2247–2255. [Google Scholar] [CrossRef]
- Heřmánek, P.; Rybka, A.; Honzík, I. Determination of moisture ratio in parts of the hop cone during the drying process in belt dryer. Agron. Res. 2018, 16, 723–727. [Google Scholar] [CrossRef]
- Steinhaus, M.; Schieberle, P. Comparison of the Most Odor-Active Compounds in Fresh and Dried Hop Cones (Humulus lupulus L. Variety Spalter Select) Based on GC−Olfactometry and Odor Dilution Techniques. J. Agric. Food Chem. 2000, 48, 1776–1783. [Google Scholar] [CrossRef]
- Korpelainen, H.; Pietiläinen, M. Hop (Humulus lupulus L.): Traditional and Present Use, and Future Potential. Econ. Bot. 2021, 75, 302–322. [Google Scholar] [CrossRef]
- Sun, S.; Wang, X.; Yuan, A.; Liu, J.; Li, Z.; Xie, D.; Zhang, H.; Luo, W.; Xu, H.; Liu, J.; et al. Chemical constituents and bioactivities of hops (Humulus lupulus L.) and their effects on beer-related microorganisms. Food Energy Secur. 2022, 11, e367. [Google Scholar] [CrossRef]
- Verzele, M.; De Keukeleire, D. Chemistry and Analysis of Hop and Beer Bitter Acids; Elsevier Science: Amsterdam, The Netherlands, 1991; ISBN 9780444416889. [Google Scholar]
- Jastrombek, J.M.; Faguerazzi, M.M.; de Cássio Pierezan, H.; Rufato, L.; Sato, A.J.; da Silva Ricce, W.; Marques, V.V.; Leles, N.R.; Roberto, S.R. Hop: An Emerging Crop in Subtropical Areas in Brazil. Horticulturae 2022, 8, 393. [Google Scholar] [CrossRef]
- Acosta-Rangel, A.; Rechcigl, J.; Bollin, S.; Deng, Z.; Agehara, S. Hop (Humulus lupulus L.) phenology, growth, and yield under subtropical climatic conditions: Effects of cultivars and crop management. Aust. J. Crop Sci. 2021, 15, 764–772. [Google Scholar] [CrossRef]
- Rybacek, V. Hop Production; Rybacek, V., Ed.; Elsevier Science: Amsterdam, The Netherlands, 2012; ISBN 0444598456. [Google Scholar]
- Neve, R.A. Hops; Springer Science & Business Media: New York, NY, USA, 2012; ISBN 978-94-011-3106-3. [Google Scholar]
- Rybka, A.; Krofta, K.; Heřmánek, P.; Honzík, I.; Pokorný, J. Effect of drying temperature on the content and composition of hop oils. Plant Soil Environ. 2018, 64, 512–516. [Google Scholar] [CrossRef]
- Bélanger Harbour, K. A Free Exhaustive Literature Review on Hops (Humulus lupulus L.). J. Am. Soc. Brew. Chem. 2023, 81, 504. [Google Scholar] [CrossRef]
- Rybka, A.; Heřmánek, P.; Honzík, I. Effect of drying temperature in hop dryer on hop quality. Res. Agric. Eng. 2021, 67, 1–7. [Google Scholar] [CrossRef]
- Rossini, F.; Virga, G.; Loreti, P.; Iacuzzi, N.; Ruggeri, R.; Provenzano, M.E. Hops (Humulus lupulus L.) as a Novel Multipurpose Crop for the Mediterranean Region of Europe: Challenges and Opportunities of Their Cultivation. Agriculture 2021, 11, 484. [Google Scholar] [CrossRef]
- Rutnik, K.; Ocvirk, M.; Košir, I.J. The Stability of Hop (Humulus lupulus L.) Resins during Long-Period Storage. Plants 2023, 12, 936. [Google Scholar] [CrossRef]
- Hodges, D.M.; Lester, G.E.; Munro, K.D.; Toivonen, P.M.A. Oxidative Stress: Importance for Postharvest Quality. HortScience 2004, 39, 924–929. [Google Scholar] [CrossRef]
- Raut, S.; von Gersdorff, G.J.E.; Münsterer, J.; Kammhuber, K.; Hensel, O.; Sturm, B. Impact of Process Parameters and Bulk Properties on Quality of Dried Hops. Processes 2020, 8, 1507. [Google Scholar] [CrossRef]
- Macchioni, V.; Picchi, V.; Carbone, K. Hop Leaves as an Alternative Source of Health-Active Compounds: Effect of Genotype and Drying Conditions. Plants 2022, 11, 99. [Google Scholar] [CrossRef]
- Sturm, B.; Münsterer, J.; Kammhuber, K.; Crichton, S. Impact of bulk weight on drying behaviour and hop quality after drying. In Proceedings of the International Conference on Agricultural Engineering, CIGR—AgEng, Aarhus, Denmark, 26–29 June 2016; pp. 26–29. [Google Scholar]
- ElGamal, R.; Song, C.; Rayan, A.M.; Liu, C.; Al-Rejaie, S.; ElMasry, G. Thermal Degradation of Bioactive Compounds during Drying Process of Horticultural and Agronomic Products: A Comprehensive Overview. Agronomy 2023, 13, 1580. [Google Scholar] [CrossRef]
- Rutnik, K.; Knez Hrnčič, M.; Jože Košir, I. Hop Essential Oil: Chemical Composition, Extraction, Analysis, and Applications. Food Rev. Int. 2022, 38, 529–551. [Google Scholar] [CrossRef]
- Eyres, G.; Dufour, J.-P. 22—Hop Essential Oil: Analysis, Chemical Composition and Odor Characteristics. In Beer in Health and Disease Prevention; Preedy, V.R., Ed.; Academic Press: San Diego, CA, USA, 2009; pp. 239–254. ISBN 978-0-12-373891-2. [Google Scholar]
- Su, X.; Hurley, K.; Xu, Z.; Xu, Y.; Rutto, L.; O’Keefe, S.; Scoggins, H.; Yin, Y. Performance of alternative drying techniques on hop (Humulus lupulus L.) aroma quality: An HS-SPME-GC-MS-O and chemometrics combined approach. Food Chem. 2022, 381, 132289. [Google Scholar] [CrossRef]
- Radojčin, M.; Pavkov, I.; Bursać Kovačević, D.; Putnik, P.; Wiktor, A.; Stamenković, Z.; Kešelj, K.; Gere, A. Effect of Selected Drying Methods and Emerging Drying Intensification Technologies on the Quality of Dried Fruit: A Review. Processes 2021, 9, 132. [Google Scholar] [CrossRef]
- Liang, Y. Different drying methods ’ effects on the nutritional components and flavor of fruits. J. Food Drug Saf. Res. 2024, 1. [Google Scholar] [CrossRef]
- Gong, X.; Huang, J.; Xu, Y.; Li, Z.; Li, L.; Li, D.; Belwal, T.; Jeandet, P.; Luo, Z.; Xu, Y. Deterioration of plant volatile organic compounds in food: Consequence, mechanism, detection, and control. Trends Food Sci. Technol. 2023, 131, 61–76. [Google Scholar] [CrossRef]
- Ferenczi, S.; Molnár, H.; Adányi, N.; Cserhalmi, Z. Comparison of Microwave Vacuum-, Freeze- and Hot-Air Drying by Energy Efficiency and Aroma Composition of Dried Hop (Humulus lupulus). Int. J. Food Eng. 2018, 4, 136–139. [Google Scholar] [CrossRef]
- Addo, P.W.; Taylor, N.; MacPherson, S.; Raghavan, V.; Orsat, V.; Lefsrud, M. Impact of pre-freezing and microwaves on drying behavior and terpenes in hops (Humulus lupulus). J. Appl. Res. Med. Aromat. Plants 2022, 31, 100436. [Google Scholar] [CrossRef]
- Tatasciore, S.; Santarelli, V.; Neri, L.; González Ortega, R.; Faieta, M.; Di Mattia, C.D.; Di Michele, A.; Pittia, P. Freeze-Drying Microencapsulation of Hop Extract: Effect of Carrier Composition on Physical, Techno-Functional, and Stability Properties. Antioxidants 2023, 12, 442. [Google Scholar] [CrossRef]
- Carbone, K.; Macchioni, V.; Petrella, G.; Cicero, D.O. Exploring the potential of microwaves and ultrasounds in the green extraction of bioactive compounds from Humulus lupulus for the food and pharmaceutical industry. Ind. Crops Prod. 2020, 156, 112888. [Google Scholar] [CrossRef]
- Mencarelli, F.; Bellincontro, A. Technology and Management of Postharvest Dehydration. In Sweet, Reinforced and Fortified Wines: Grape Biochemistry, Technology and Vinification; John Wiley & Sons, Ltd.: London, UK, 2013; pp. 51–75. [Google Scholar] [CrossRef]
- Santini, G.; Bianchi, A.; Pettinelli, S.; Modesti, M.; Cerreta, R.; Bellincontro, A. Air speed and plastic crate vent-holes for wine grape quality during postharvest dehydration: Commercial and laboratory studies. J. Sci. Food Agric. 2023, 103, 7293–7301. [Google Scholar] [CrossRef]
- Sanmartin, C.; Modesti, M.; Venturi, F.; Brizzolara, S.; Mencarelli, F.; Bellincontro, A. Postharvest water loss of wine grape: When, what and why. Metabolites 2021, 11, 318. [Google Scholar] [CrossRef]
- Sanmartin, C.; Taglieri, I.; Bianchi, A.; Parichanon, P.; Puccinelli, M.; Pardossi, A.; Venturi, F. Effects of Temperature and Packaging Atmosphere on Shelf Life, Biochemical, and Sensory Attributes of Glasswort (Salicornia europaea L.) Grown Hydroponically at Different Salinity Levels. Foods 2024, 13, 3260. [Google Scholar] [CrossRef]
- Kobus-Cisowska, J.; Szymanowska-Powałowska, D.; Szczepaniak, O.; Kmiecik, D.; Przeor, M.; Gramza-Michałowska, A.; Cielecka-Piontek, J.; Smuga-Kogut, M.; Szulc, P. Composition and In Vitro Effects of Cultivars of Humulus lupulus L. Hops on Cholinesterase Activity and Microbial Growth. Nutrients 2019, 11, 1377. [Google Scholar] [CrossRef]
- Monacci, E.; Sanmartin, C.; Bianchi, A.; Pettinelli, S.; Taglieri, I.; Mencarelli, F. Plastic film packaging for the postharvest quality of fresh hop inflorescence (Humulus lupulus) cv. Cascade. Postharvest Biol. Technol. 2023, 206, 112575. [Google Scholar] [CrossRef]
- Bianchi, A.; Sanmartin, C.; Taglieri, I.; Macaluso, M.; Venturi, F.; Napoli, M.; Mancini, M.; Fabbri, C.; Zinnai, A. Effect of Fertilization Regime of Common Wheat (Triticum aestivum) on Flour Quality and Shelf-Life of PDO Tuscan Bread. Foods 2023, 12, 2672. [Google Scholar] [CrossRef]
- Monacci, E.; Baris, F.; Bianchi, A.; Vezzulli, F.; Pettinelli, S.; Lambri, M.; Mencarelli, F.; Chinnici, F.; Sanmartin, C. Influence of the drying process of Cascade hop and the dry-hopping technique on the chemical, aromatic and sensory quality of the beer. Food Chem. 2024, 460, 140594. [Google Scholar] [CrossRef]
- Mastrangelo, N.; Bianchi, A.; Pettinelli, S.; Santini, G.; Merlani, G.; Bellincontro, A.; Baris, F.; Chinnici, F.; Mencarelli, F. Novelty of Italian Grape Ale (IGA) beer: Influence of the addition of Gamay macerated grape must or dehydrated Aleatico grape pomace on the aromatic profile. Heliyon 2023, 9, e20422. [Google Scholar] [CrossRef]
- Rutnik, K.; Ocvirk, M.; Košir, I.J. Impact of Hop Freshness on Dry Hopped Beer Quality. Foods 2022, 11, 1310. [Google Scholar] [CrossRef]
- Van Simaeys, K.R.; Féchir, M.; Gallagher, A.; Stokholm, A.; Weaver, G.; Shellhammer, T.H. Examining Chemical and Sensory Differences of New American Aroma Hops Grown in the Willamette Valley, Oregon. J. Am. Soc. Brew. Chem. 2022, 80, 370–378. [Google Scholar] [CrossRef]
- Najar, B.; Pieracci, Y.; Fratini, F.; Pistelli, L.; Turchi, B.; Varriale, D.; Pistelli, L.; Bozzini, M.F.; Marchioni, I. Exploring the Volatile Composition and Antibacterial Activity of Edible Flower Hydrosols with Insights into Their Spontaneous Emissions and Essential Oil Chemistry. Plants 2024, 13, 1145. [Google Scholar] [CrossRef]
- NIST. NIST/EPA/NIH Mass Spectral Library; Stein, S.E., Ed.; National Institute of Standards and Technology, Mass Spectrometry Data Center: Gaithersburg, MD, USA, 2014. [Google Scholar]
- Adams, R.P. Identification of Essential Oil Components by Gas Chromatography/Mass Spectroscopy; Allured Pub. Corp: Carol Stream, IL, USA, 2007; ISBN 0-931710-42-1. [Google Scholar]
- Bianchi, A.; Capparelli, S.; Taglieri, I.; Sanmartin, C.; Pistelli, L.; Venturi, F. Salty Biscuits Enriched with Fresh and Dried Bee Pollen: Chemical, Technological, and Sensory Characterization. Foods 2025, 14, 527. [Google Scholar] [CrossRef]
- Bianchi, A.; Taglieri, I.; Macaluso, M.; Sanmartin, C.; Zinnai, A.; Venturi, F. Effect of Different Packaging Strategies on the Secondary Shelf Life of Young and Structured Red Wine. Foods 2023, 12, 2719. [Google Scholar] [CrossRef]
- Dziki, D. Recent Trends in Pretreatment of Food before Freeze-Drying. Processes 2020, 8, 1661. [Google Scholar] [CrossRef]
- Ferreira, S.S.; Monteiro, F.; Passos, C.P.; Silva, A.M.S.; Wessel, D.F.; Coimbra, M.A.; Cardoso, S.M. Blanching impact on pigments, glucosinolates, and phenolics of dehydrated broccoli by-products. Food Res. Int. 2020, 132, 109055. [Google Scholar] [CrossRef]
- Bamforth, C.W. Progress in Brewing Science and Beer Production. Annu. Rev. Chem. Biomol. Eng. 2017, 8, 161–176. [Google Scholar] [CrossRef]
- Bamforth, C.W. Brewing Materials and Processes: A practical Approach to Beer Excellence; Bamforth, C.W., Ed.; Academic Press: San Diego, CA, USA, 2016; ISBN 0128004681. [Google Scholar]
- Lewis, M.J.; Young, T.W. Hops technology. In Brewing; Lewis, M.J., Young, T.W., Eds.; Springer US: Boston, MA, USA, 2001; pp. 251–258. ISBN 978-1-4615-0729-1. [Google Scholar]
- Antony, A.; Farid, M. Effect of Temperatures on Polyphenols during Extraction. Appl. Sci. 2022, 12, 2107. [Google Scholar] [CrossRef]
- Arfaoui, L. Dietary Plant Polyphenols: Effects of Food Processing on Their Content and Bioavailability. Molecules 2021, 26, 2959. [Google Scholar] [CrossRef]
- Tan, S.; Tang, J.; Shi, W.; Wang, Z.; Xiang, Y.; Deng, T.; Gao, X.; Li, W.; Shi, S. Effects of three drying methods on polyphenol composition and antioxidant activities of Litchi chinensis Sonn. Food Sci. Biotechnol. 2020, 29, 351–358. [Google Scholar] [CrossRef]
- Roshanak, S.; Rahimmalek, M.; Goli, S.A.H. Evaluation of seven different drying treatments in respect to total flavonoid, phenolic, vitamin C content, chlorophyll, antioxidant activity and color of green tea (Camellia sinensis or C. assamica) leaves. J. Food Sci. Technol. 2016, 53, 721–729. [Google Scholar] [CrossRef]
- Song, X.-D.; Mujumdar, A.S.; Law, C.-L.; Fang, X.-M.; Peng, W.-J.; Deng, L.-Z.; Wang, J.; Xiao, H.-W. Effect of drying air temperature on drying kinetics, color, carotenoid content, antioxidant capacity and oxidation of fat for lotus pollen. Dry. Technol. 2020, 38, 1151–1164. [Google Scholar] [CrossRef]
- Wojtunik-Kulesza, K.; Oniszczuk, A.; Oniszczuk, T.; Combrzyński, M.; Nowakowska, D.; Matwijczuk, A. Influence of In Vitro Digestion on Composition, Bioaccessibility and Antioxidant Activity of Food Polyphenols—A Non-Systematic Review. Nutrients 2020, 12, 1401. [Google Scholar] [CrossRef]
- Thavasi, V.; Leong, L.P.; Bettens, R.P.A. Investigation of the Influence of Hydroxy Groups on the Radical Scavenging Ability of Polyphenols. J. Phys. Chem. A 2006, 110, 4918–4923. [Google Scholar] [CrossRef]
- Almaguer, C.; Schönberger, C.; Gastl, M.; Arendt, E.K.; Becker, T. Humulus lupulus—A story that begs to be told. A review. J. Inst. Brew. 2014, 120, 289–314. [Google Scholar] [CrossRef]
- Treml, J.; Šmejkal, K. Flavonoids as Potent Scavengers of Hydroxyl Radicals. Compr. Rev. Food Sci. Food Saf. 2016, 15, 720–738. [Google Scholar] [CrossRef]
- Vuolo, M.M.; Lima, V.S.; Maróstica, M.R. Chapter 2 Phenolic Compounds Structure, Classification, and Antioxidant Power. In Bioactive Compounds; Campos, M.R.S., Ed.; Woodhead Publishing: Sawston, UK, 2019; pp. 33–50. [Google Scholar]
- Podsędek, A.; Sosnowska, D.; Anders, B. Antioxidative capacity of tomato products. Eur. Food Res. Technol. 2003, 217, 296–300. [Google Scholar] [CrossRef]
- Xu, H.; Zhang, X.; Karangwa, E.; Xia, S. Correlating enzymatic browning inhibition and antioxidant ability of Maillard reaction products derived from different amino acids. J. Sci. Food Agric. 2017, 97, 4210–4218. [Google Scholar] [CrossRef]
- Martins, S.I.F.S.; Jongen, W.M.F.; van Boekel, M.A.J.S. A review of Maillard reaction in food and implications to kinetic modelling. Trends Food Sci. Technol. 2000, 11, 364–373. [Google Scholar] [CrossRef]
- Manzocco, L.; Calligaris, S.; Mastrocola, D.; Nicoli, M.C.; Lerici, C.R. Review of non-enzymatic browning and antioxidant capacity in processed foods. Trends Food Sci. Technol. 2000, 11, 340–346. [Google Scholar] [CrossRef]
- Morales, F.J.; Jiménez-Pérez, S. Peroxyl radical scavenging activity of melanoidins in aqueous systems. Eur. Food Res. Technol. 2004, 218, 515–520. [Google Scholar] [CrossRef]
- Piga, A.; Del Caro, A.; Corda, G. From Plums to Prunes: Influence of Drying Parameters on Polyphenols and Antioxidant Activity. J. Agric. Food Chem. 2003, 51, 3675–3681. [Google Scholar] [CrossRef]
- Bocquet, L.; Sahpaz, S.; Hilbert, J.L.; Rambaud, C.; Rivière, C. Humulus lupulus L., a very popular beer ingredient and medicinal plant: Overview of its phytochemistry, its bioactivity, and its biotechnology. Phytochem. Rev. 2018, 17, 1047–1090. [Google Scholar] [CrossRef]
- Nance, M.R.; Setzer, W.N. Volatile components of aroma hops (Humulus lupulus L.) commonly used in beer brewing. J. Brew. Distill. 2011, 2, 16–22. [Google Scholar]
- Copolovici, L.; Niinemets, Ü. Temperature dependencies of Henry’s law constants for different plant sesquiterpenes. Chemosphere 2015, 138, 751–757. [Google Scholar] [CrossRef]
- Banik, B.K.; Sahoo, B.M.; Tiwari, A. Terpenoids: Chemistry, Biochemistry, Medicinal Effects, Ethno-Pharmacology, 1st ed.; Banik, B.K., Sahoo, B.M., Tiwari, A., Eds.; CRC Press: Boca Raton, FL, USA, 2022; ISBN 9781003008682. [Google Scholar]
- Hoskovec, M.; Grygarová, D.; Cvačka, J.; Streinz, L.; Zima, J.; Verevkin, S.P.; Koutek, B. Determining the vapour pressures of plant volatiles from gas chromatographic retention data. J. Chromatogr. A 2005, 1083, 161–172. [Google Scholar] [CrossRef]
- Kosina, J.; Dewulf, J.; Viden, I.; Pokorska, O.; Van Langenhove, H. Dynamic capillary diffusion system for monoterpene and sesquiterpene calibration: Quantitative measurement and determination of physical properties. Int. J. Environ. Anal. Chem. 2013, 93, 637–649. [Google Scholar] [CrossRef]
- Barreira, L.M.F.; Ylisirniö, A.; Pullinen, I.; Buchholz, A.; Li, Z.; Lipp, H.; Junninen, H.; Hõrrak, U.; Noe, S.M.; Krasnova, A.; et al. The importance of sesquiterpene oxidation products for secondary organic aerosol formation in a springtime hemiboreal forest. Atmos. Chem. Phys. 2021, 21, 11781–11800. [Google Scholar] [CrossRef]

| Chemical Parameters | Units | T0 | F | H | VRT |
|---|---|---|---|---|---|
| Water content | % | 75.22 ± 1.52 a | 0.32 ± 0.20 c | 0.21 ± 0.11 c | 9.12 ± 0.52 b |
| Chlorophyll-a | g/kg dm | 22.77 ± 0.38 b | 27.86 ± 0.41 a | 27.99 ± 0.28 a | 12.35 ± 0.45 c |
| Chlorophyll-b | g/kg dm | 35.34 ± 0.27 b | 54.02 ± 0.60 a | 54.71 ± 0.21 a | 23.82 ± 0.39 c |
| Total chlorophyll | g/kg dm | 58.11 ± 0.33 b | 81.89 ± 0.60 a | 82.70 ± 0.39 a | 36.11 ± 0.72 c |
| Total carotenoids | g/kg dm | 16.56 ± 0.21 c | 54.02 ± 0.27 a | 54.71 ± 0.31 a | 23.82 ± 0.32 b |
| Total polyphenols | g GAE/kg dm | 524.4 ± 4.5 b | 439.61 ± 6.41 c | 348.48 ± 1.03 d | 631.11 ± 3.47 a |
| ABTS | mmol TE /kg dm | 9.33 ± 0.84 d | 35.42 ± 0.49 a | 23.52 ± 0.64 b | 14.68 ± 0.50 c |
| DPPH | mmol TE/kg dm | 5.60 ± 0.44 d | 21.25 ± 0.51 a | 14.11 ± 0.23 b | 8.81 ± 0.32 c |
| α-acids | % | 6.30 ± 0.08 c | 7.07 ± 0.09 b | 7.27 ± 0.07 a | 7.16 ± 0.11 ab |
| β-acids | % | 6.09 ± 0.06 b | 5.82 ± 0.05 c | 6.33 ± 0.04 a | 5.78 ± 0.09 c |
| Hop Storage Index (HSI) | 0.09 ± 0.03 b | 0.20 ± 0.02 a | 0.21 ± 0.01 a | 0.14 ± 0.02 b | |
| Essential oil yield | % v/w | 1.61 ± 0.12 c | 4.96 ± 0.09 a | 4.97 ± 0.11 a | 2.98 ± 0.10 b |
| Compounds | LRI 1 | Relative Abundance (%) | |||
|---|---|---|---|---|---|
| T0 | F | H | VRT | ||
| Limonene | 1029 | 0.30 ± 0.02 a | 0.30 ± 0.03 a | n.d. | 0.30 ± 0.01 a |
| Myrcene | 991 | 19.74 ± 1.17 b | 19.22 ± 1.46 b | 17.72 ± 1.05 b | 22.73 ± 1.10 a |
| β-Pinene | 977 | 0.32 ± 0.01 b | 0.42 ± 0.04 a | 0.33 ± 0.02 b | 0.47 ± 0.02 a |
| Total Monoterpene Hydrocarbons | 20.36 ± 1.20 | 19.94 ± 1.47 | 18.05 ± 1.02 | 23.50 ± 1.13 | |
| Linalool | 1101 | n.d. | 0.37 ± 0.02 a | n.d. | n.d. |
| Geranyl acetate | 1385 | 1.31 ± 0.03 a | 1.21 ± 0.04 b | 1.23 ± 0.06 ab | 1.33 ± 0.01 a |
| Methyl geranate | 1324 | 0.73 ± 0.01 b | 0.62 ± 0.04 c | 0.61 ± 0.02 c | 0.82 ± 0.04 a |
| Total Oxygenated Monoterpenes | 2.04 ± 0.04 | 2.20 ± 0.06 | 1.84 ± 0.08 | 2.15 ± 0.02 | |
| (E,E)-α-Farnesene | 1509 | 0.62 ± 0.04 a | 0.66 ± 0.06 a | 0.52 ± 0.08 ab | 0.44 ± 0.05 b |
| (E)-β-Farnesene | 1458 | 6.93 ± 0.08 ab | 6.83 ± 0.17 b | 7.43 ± 0.39 a | 6.02 ± 0.05 c |
| trans-α-Bergamotene | 1436 | 0.41 ± 0.01 a | 0.44 ± 0.03 a | 0.45 ± 0.03 a | 0.30 ± 0.01 b |
| α-Cadinene | 1537 | 0.34 ± 0.03 a | 0.32 ± 0.01 a | 0.33 ± 0.03 a | n.d. |
| α-Copaene | 1376 | n.d. | 0.11 ± 0.07 b | 0.32 ± 0.01 a | n.d. |
| α-Humulene | 1453 | 25.12 ± 0.28 a | 24.04 ± 0.59 a | 25.61 ± 1.36 a | 24.76 ± 0.36 a |
| α-Murolene | 1500 | 0.82 ± 0.05 a | 0.81 ± 0.01 a | 0.72 ± 0.09 ab | 0.74 ± 0.02 b |
| α-Selinene | 1495 | 3.28 ± 0.05 bc | 3.33 ± 0.01 b | 3.63 ± 0.02 a | 3.22 ± 0.03 c |
| β-Bisabolene | 1509 | 3.06 ± 0.07 c | 3.30 ± 0.06 b | 3.34 ± 0.12 a | 2.87 ± 0.11 c |
| β-Caryophyllene | 1419 | 10.11 ± 0.06 b | 10.52 ± 0.29 ab | 11.17 ± 0.69 a | 9.40 ± 0.14 c |
| β-Copaene | 1429 | 0.34 ± 0.02 b | 0.37 ± 0.01 b | 0.44 ± 0.03 a | 0.34 ± 0.02 b |
| β-Selinene | 1486 | 2.55 ± 0.03 bc | 2.57 ± 0.04 b | 2.82 ± 0.04 a | 2.47 ± 0.04 c |
| γ-Murolene | 1477 | 2.62 ± 0.06 b | 2.80 ± 0.01 a | 2.50 ± 0.11 cd | 2.45 ± 0.04 d |
| δ-Cadinene | 1524 | 2.63 ± 0.07 c | 3.01 ± 0.01 b | 3.23 ± 0.11 a | 2.50 ± 0.06 c |
| Total Sesquiterpene Hydrocarbons | 58.83 ± 0.59 | 59.11 ± 0.71 | 62.51 ± 1.30 | 55.51 ± 0.88 | |
| (E,E)-Farnesol | 1722 | 2.20 ± 0.14 b | 2.60 ± 0.09 a | 2.31 ± 0.11 b | 2.32 ± 0.14 b |
| Caryophyllene oxide | 1582 | 0.82 ± 0.04 b | 1.14 ± 0.08 a | 1.13 ± 0.13 a | 0.88 ± 0.11 b |
| Cubenol | 1641 | 0.40 ± 0.04 c | 0.52 ± 0.01 b | 0.44 ± 0.03 c | 0.59 ± 0.01 a |
| 1-Epi-cubenol | 1627 | 0.23 ± 0.26 c | 0.54 ± 0.02 a | 0.45 ± 0.01 b | 0.52 ± 0.04 a |
| Humulane-1-6-dien-3-ol | 1613 | 0.54 ± 0.06 a | n.d. | 0.32 ± 0.13 b | 0.63 ± 0.02 a |
| Humulene oxide II | 1608 | 1.82 ± 0.02 b | 1.92 ± 0.16 b | 2.63 ± 0.10 a | 1.74 ± 0.04 b |
| T-cadinol | 1642 | 1.14 ± 0.11 ab | 1.02 ± 0.07 b | 0.91 ± 0.08 b | 1.33 ± 0.08 a |
| Neointermedeol | 1655 | 1.72 ± 0.08 b | 1.50 ± 0.10 c | 1.40 ± 0.11 c | 2.17 ± 0.18 a |
| Total Oxygenated Sesquiterpenes | 8.87 ± 0.23 | 9.24 ± 0.16 | 9.59 ± 0.79 | 10.18 ± 0.61 | |
| m-Camphorene | 1952 | 0.63 ± 0.08 b | 0.64 ± 0.07 b | 0.82 ± 0.07 a | 0.42 ± 0.11 c |
| p-Camphorene | 1986 | 0.16 ± 0.05 c | 0.33 ± 0.07 b | 0.44 ± 0.02 a | n.d. |
| Diterpene Hydrocarbons | 0.79 ± 0.15 | 0.97 ± 0.16 | 1.26 ± 0.10 | 0.42 ± 0.11 | |
| (E,Z)-5,7-Dodecadien-1-ol acetate | 1640 | 1.94 ± 0.10 a | 1.92 ± 0.03 a | 1.92 ± 0.01 a | 1.96 ± 0.04 a |
| (Z)-2-Heptenal | 951 | 0.16 ± 0.02 c | 0.25 ± 0.05 b | 0.44 ± 0.04 a | n.d. |
| (Z)-4-Decanoic acid, methyl ester | 1290 | 0.52 ± 0.02 a | 0.37 ± 0.02 b | 0.26 ± 0.04 c | 0.45 ± 0.06 a |
| 1,8,11,14-Heptadecatetraene | 1678 | 1.84 ± 0.07 b | 1.65 ± 0.03 c | n.d. | 2.04 ± 0.04 a |
| Oleic acid | 2140 | n.d. | n.d. | n.d. | 0.32 ± 0.05 a |
| Palmitic acid | 1964 | 2.57 ± 0.52 a | 1.24 ± 0.13 b | 0.93 ± 0.14 b | 0.43 ± 0.10 c |
| Total Non-terpene Derivatives | 7.03 ± 0.87 | 5.43 ± 0.16 | 3.55 ± 0.21 | 5.20 ± 0.30 | |
| Total Identified | 97.92 ± 1.11 | 96.89 ± 1.39 | 96.80 ± 1.18 | 96.96 ± 1.07 | |
| Color Parameters | T0 | F | H | VRT |
|---|---|---|---|---|
| L* | 39.00 ± 0.51 d | 56.73 ± 0.41 a | 52.47 ± 0.34 b | 43.75 ± 0.61 c |
| a* | −11.09 ± 0.41 a | −8.44 ± 0.37 b | −6.17 ± 0.75 c | −1.82 ± 0.54 d |
| b* | 28.27 ± 0.31 ab | 28.36 ± 0.21 a | 27.70 ± 0.28 b | 25.05 ± 0.49 c |
| C* | 30.37 ± 0.31 a | 29.58 ± 0.29 b | 28.37 ± 0.31 c | 25.12 ± 0.51 d |
| h* | 111.42 ± 0.61 a | 106.58 ± 0.58 b | 102.55 ± 0.47 c | 94.14 ± 0.71 d |
Disclaimer/Publisher’s Note: The statements, opinions and data contained in all publications are solely those of the individual author(s) and contributor(s) and not of MDPI and/or the editor(s). MDPI and/or the editor(s) disclaim responsibility for any injury to people or property resulting from any ideas, methods, instructions or products referred to in the content. |
© 2025 by the authors. Licensee MDPI, Basel, Switzerland. This article is an open access article distributed under the terms and conditions of the Creative Commons Attribution (CC BY) license (https://creativecommons.org/licenses/by/4.0/).
Share and Cite
Monacci, E.; Sanmartin, C.; Bianchi, A.; Pettinelli, S.; Najar, B.; Mencarelli, F.; Taglieri, I. Chemical Quality and Characterization of Essential Oils in Postharvest Hop cv. Cascade: Ventilated Room Temperature as a Sustainable Alternative to Hot-Stove and Freeze-Drying Processes. Beverages 2025, 11, 54. https://doi.org/10.3390/beverages11020054
Monacci E, Sanmartin C, Bianchi A, Pettinelli S, Najar B, Mencarelli F, Taglieri I. Chemical Quality and Characterization of Essential Oils in Postharvest Hop cv. Cascade: Ventilated Room Temperature as a Sustainable Alternative to Hot-Stove and Freeze-Drying Processes. Beverages. 2025; 11(2):54. https://doi.org/10.3390/beverages11020054
Chicago/Turabian StyleMonacci, Edoardo, Chiara Sanmartin, Alessandro Bianchi, Stefano Pettinelli, Basma Najar, Fabio Mencarelli, and Isabella Taglieri. 2025. "Chemical Quality and Characterization of Essential Oils in Postharvest Hop cv. Cascade: Ventilated Room Temperature as a Sustainable Alternative to Hot-Stove and Freeze-Drying Processes" Beverages 11, no. 2: 54. https://doi.org/10.3390/beverages11020054
APA StyleMonacci, E., Sanmartin, C., Bianchi, A., Pettinelli, S., Najar, B., Mencarelli, F., & Taglieri, I. (2025). Chemical Quality and Characterization of Essential Oils in Postharvest Hop cv. Cascade: Ventilated Room Temperature as a Sustainable Alternative to Hot-Stove and Freeze-Drying Processes. Beverages, 11(2), 54. https://doi.org/10.3390/beverages11020054