
Environmental Factors Modulate the Role of orf21 Sigma Factor in Clavulanic Acid Production in Streptomyces Clavuligerus ATCC27064

 ,
,  , and
, and
Abstract
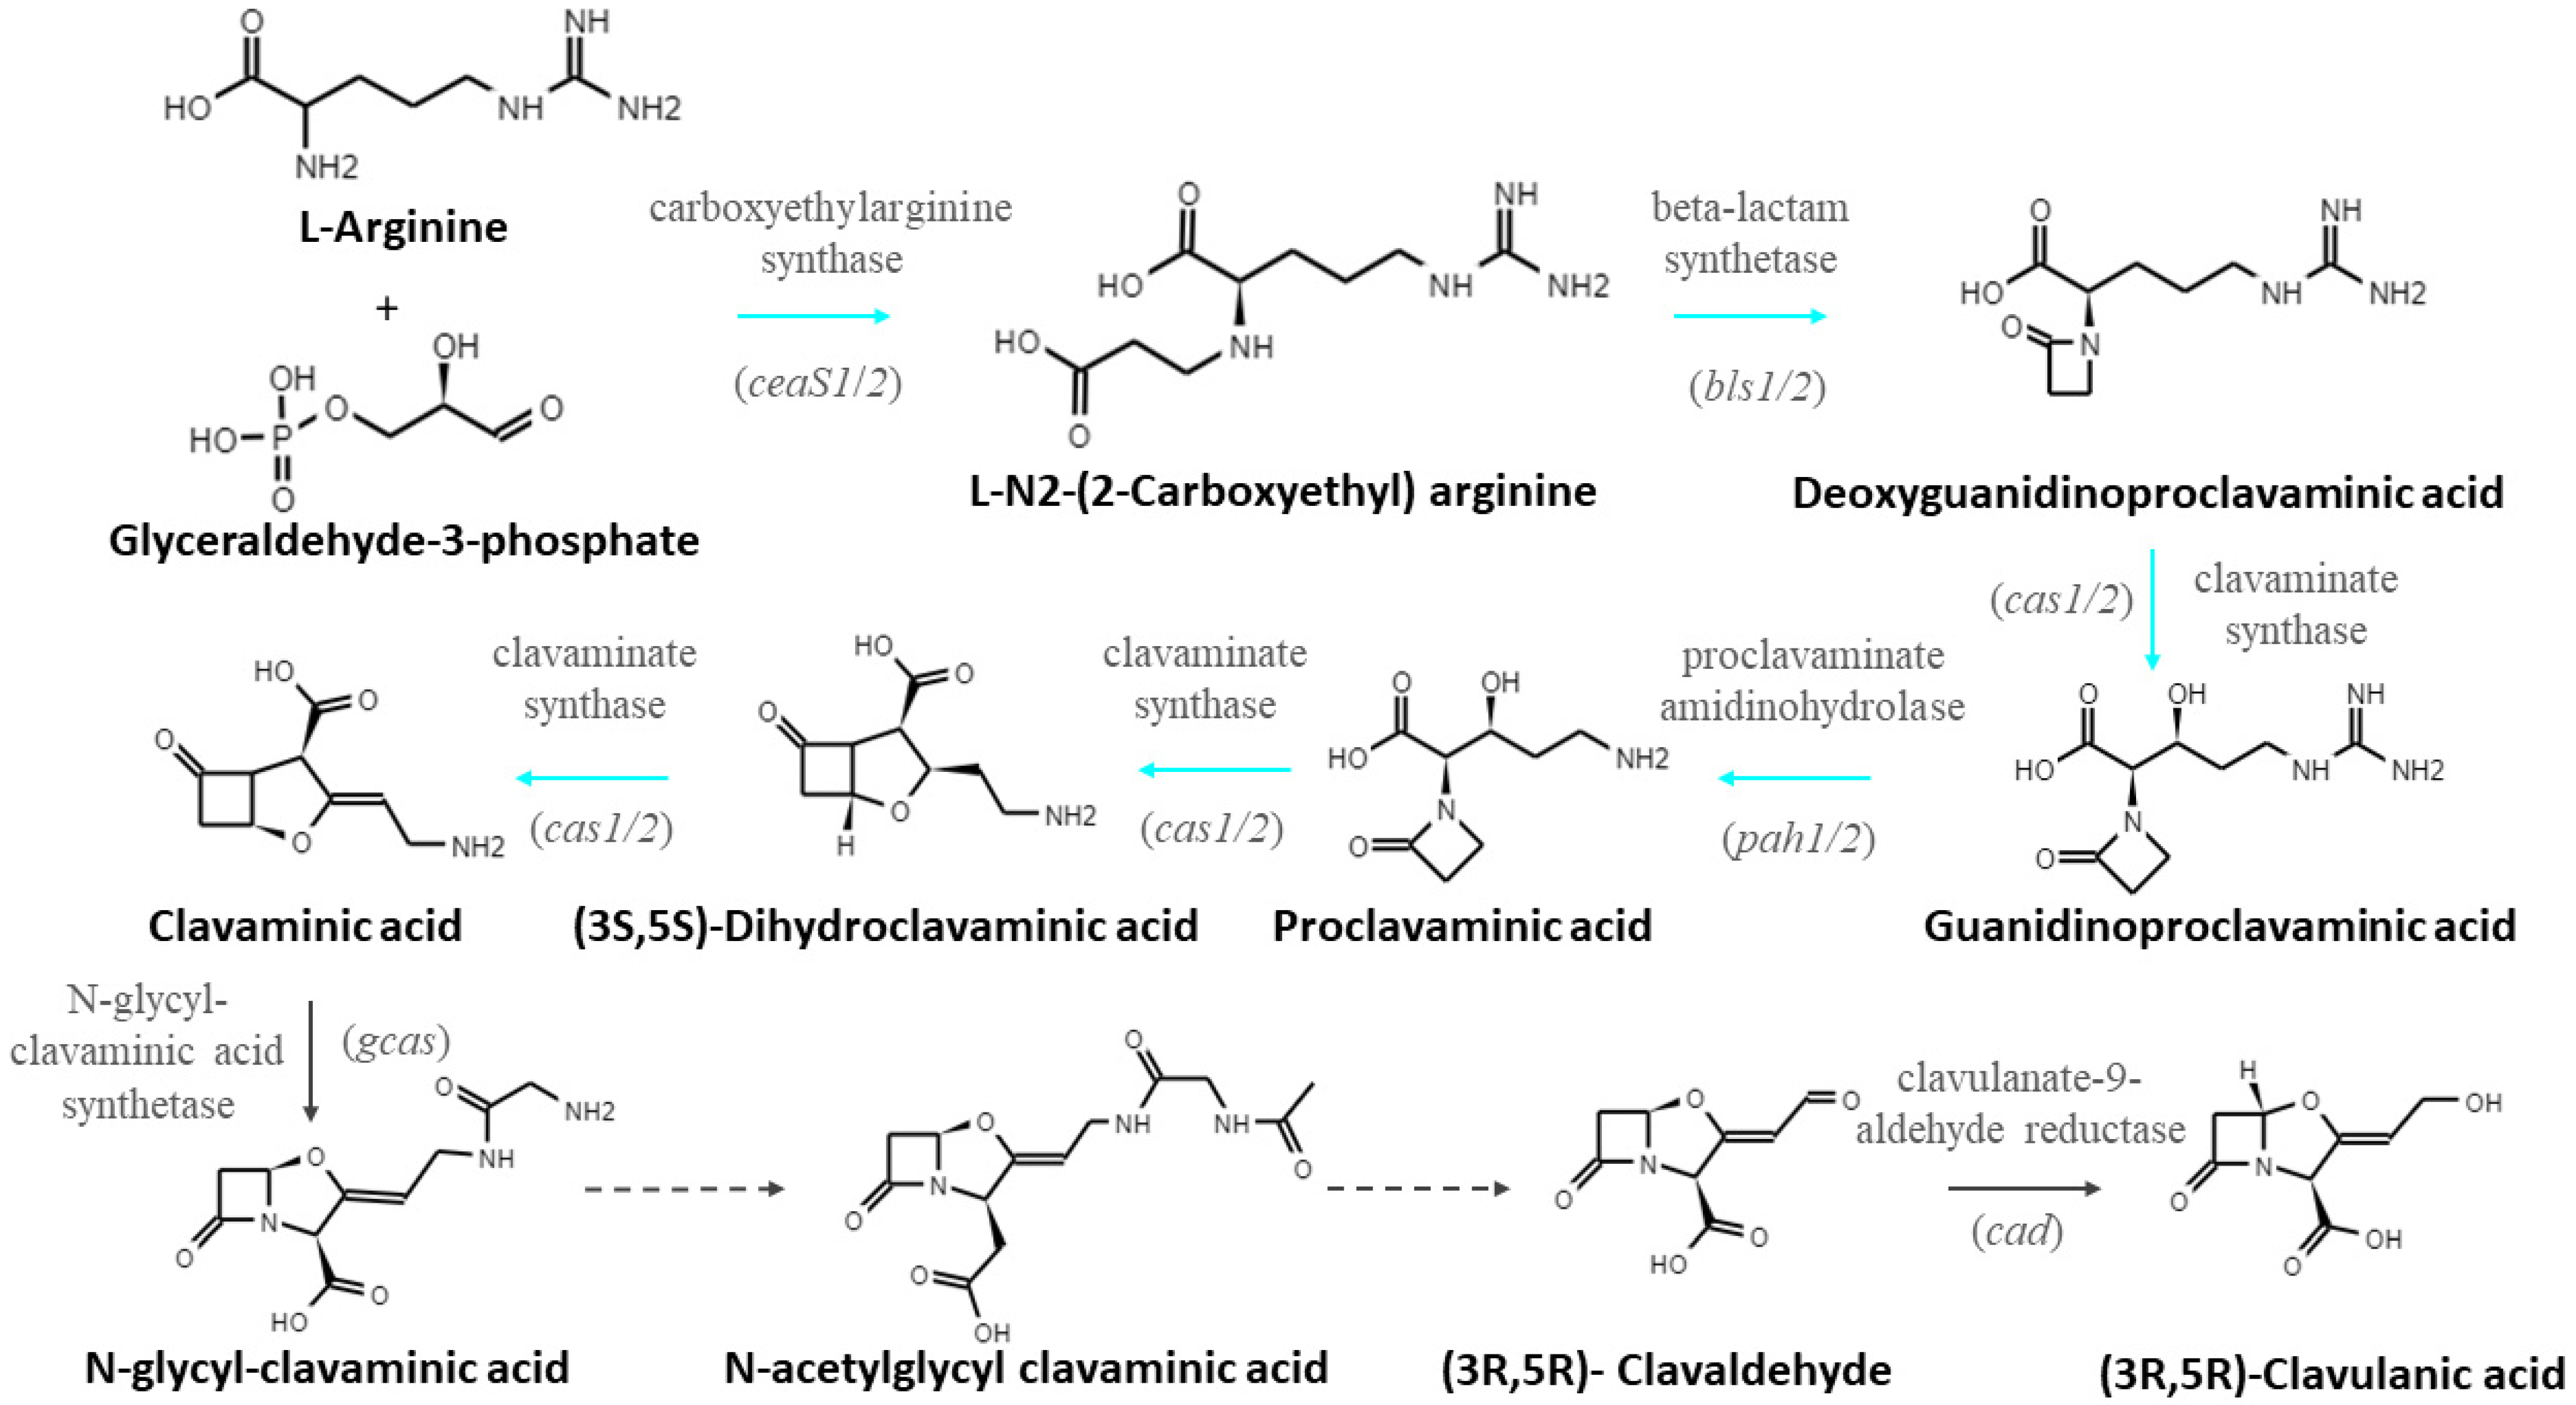
:1. Introduction
2. Materials and Methods
2.1. Bacterial Strains, Plasmids, and Culture Conditions
2.2. Construction of Recombinant Plasmids
2.3. Construction of Recombinant Plasmids and Transformation
2.4. Analytical Techniques
2.5. Statistical Analysis
2.6. RNA Extraction and RT-qPCR Analysis
2.7. Phylogenetic Analysis and Prediction of DNA Motifs Bound
3. Results
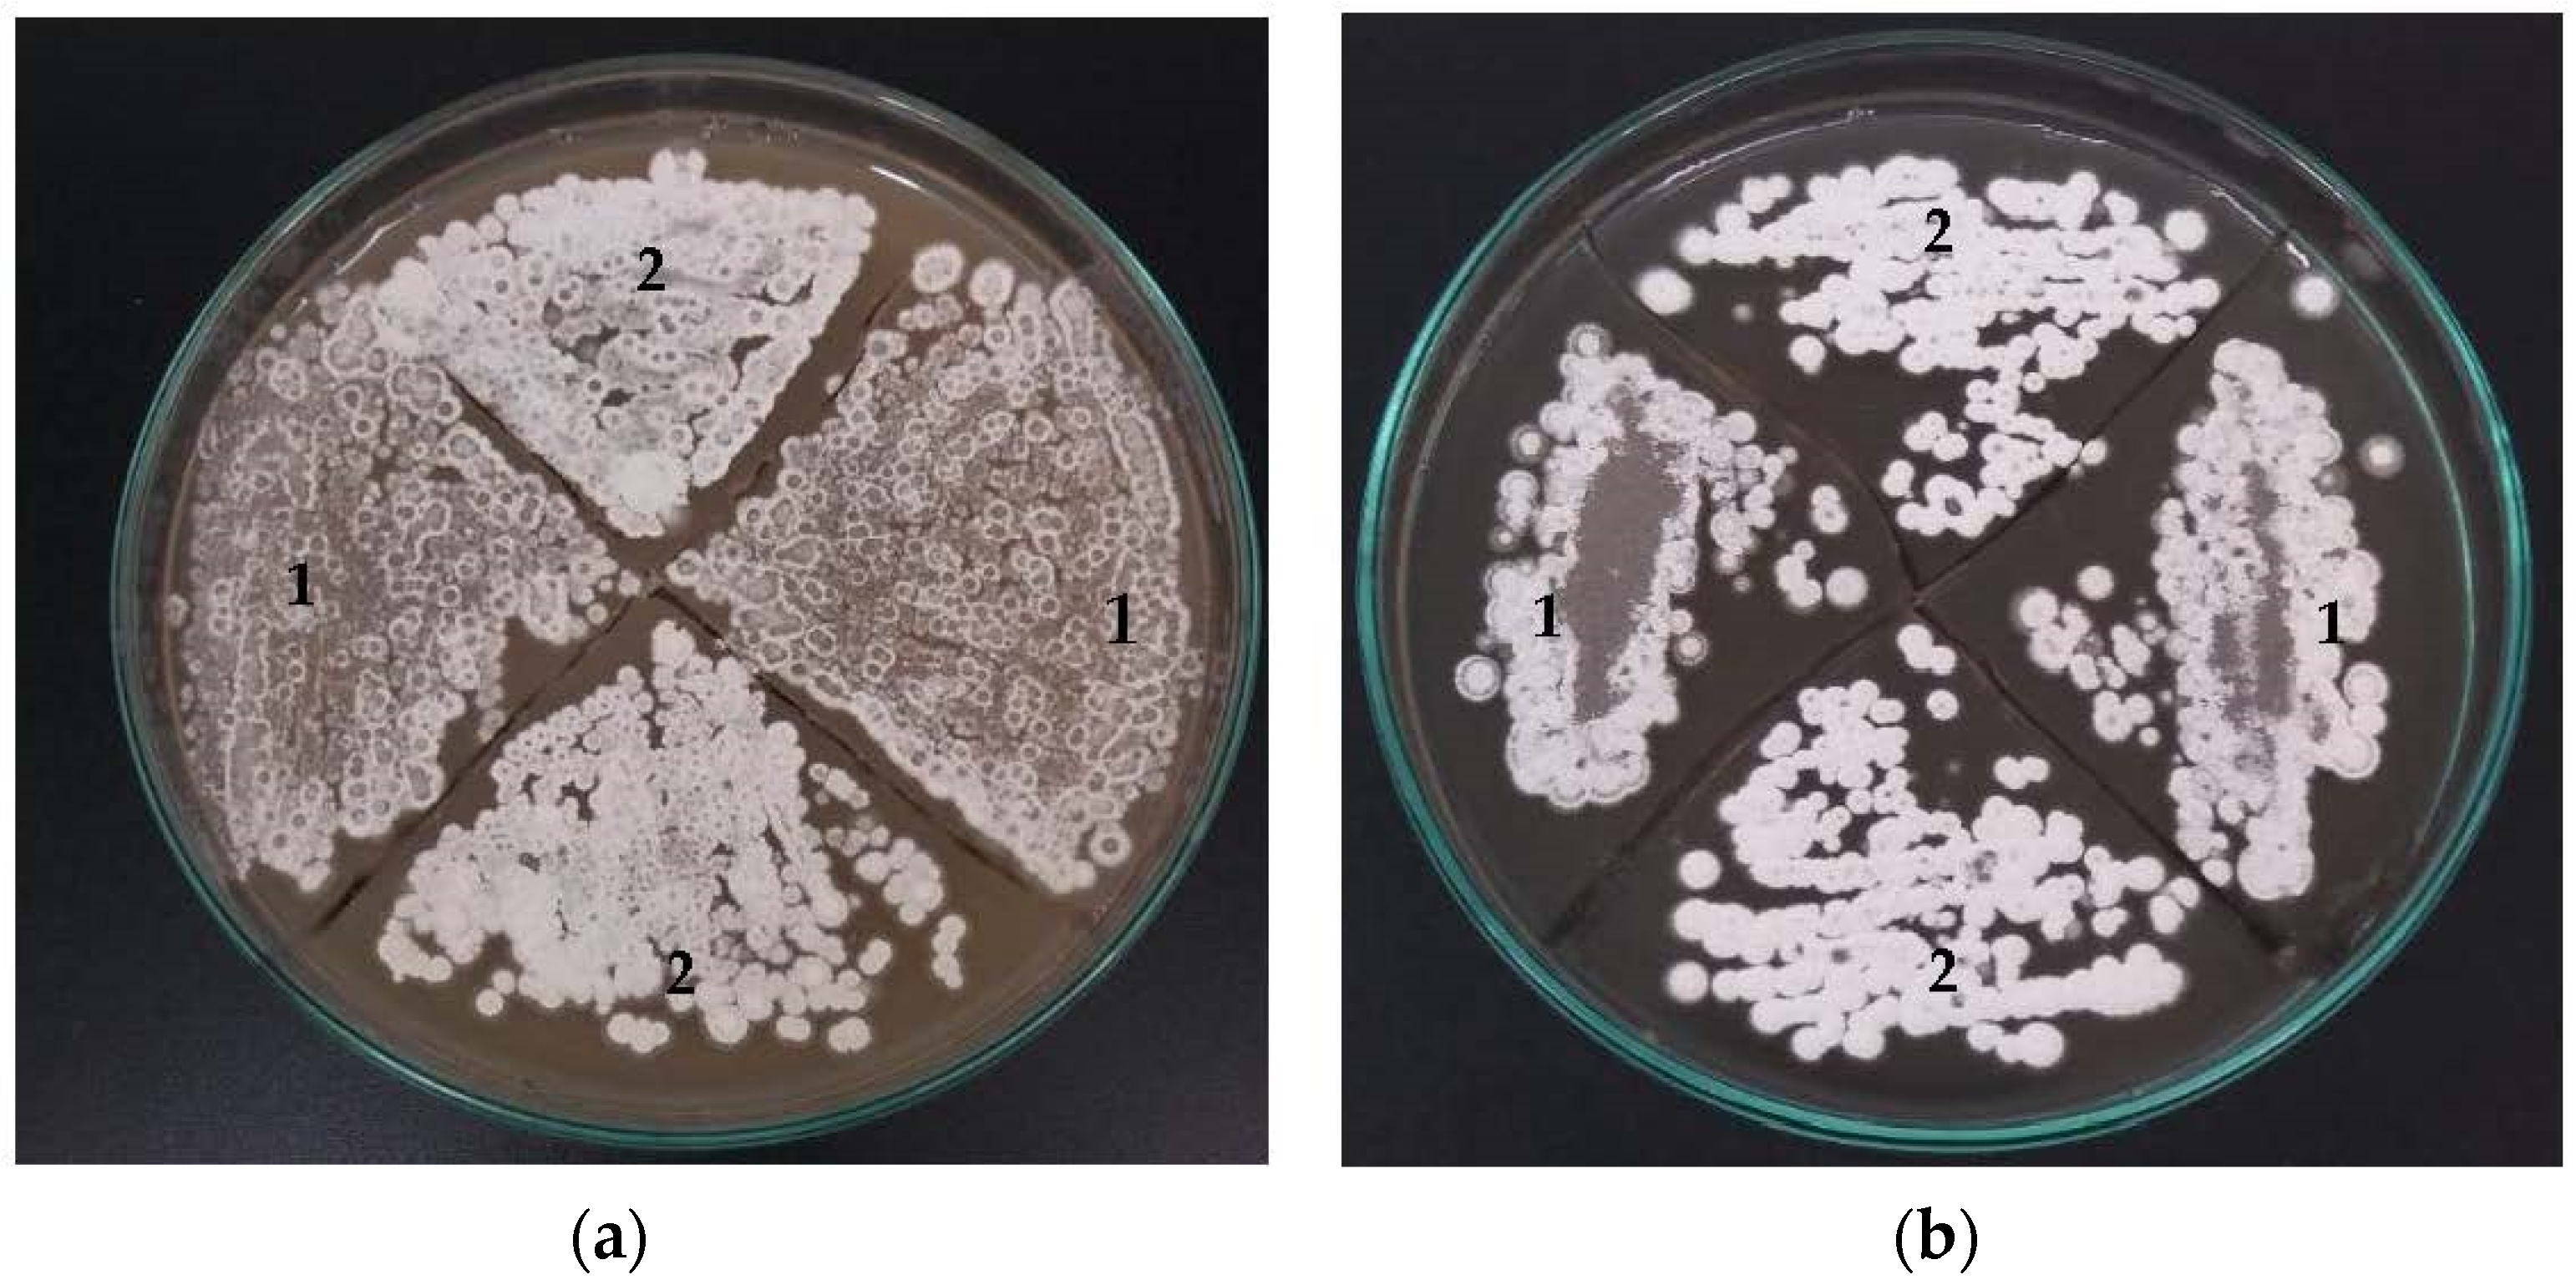
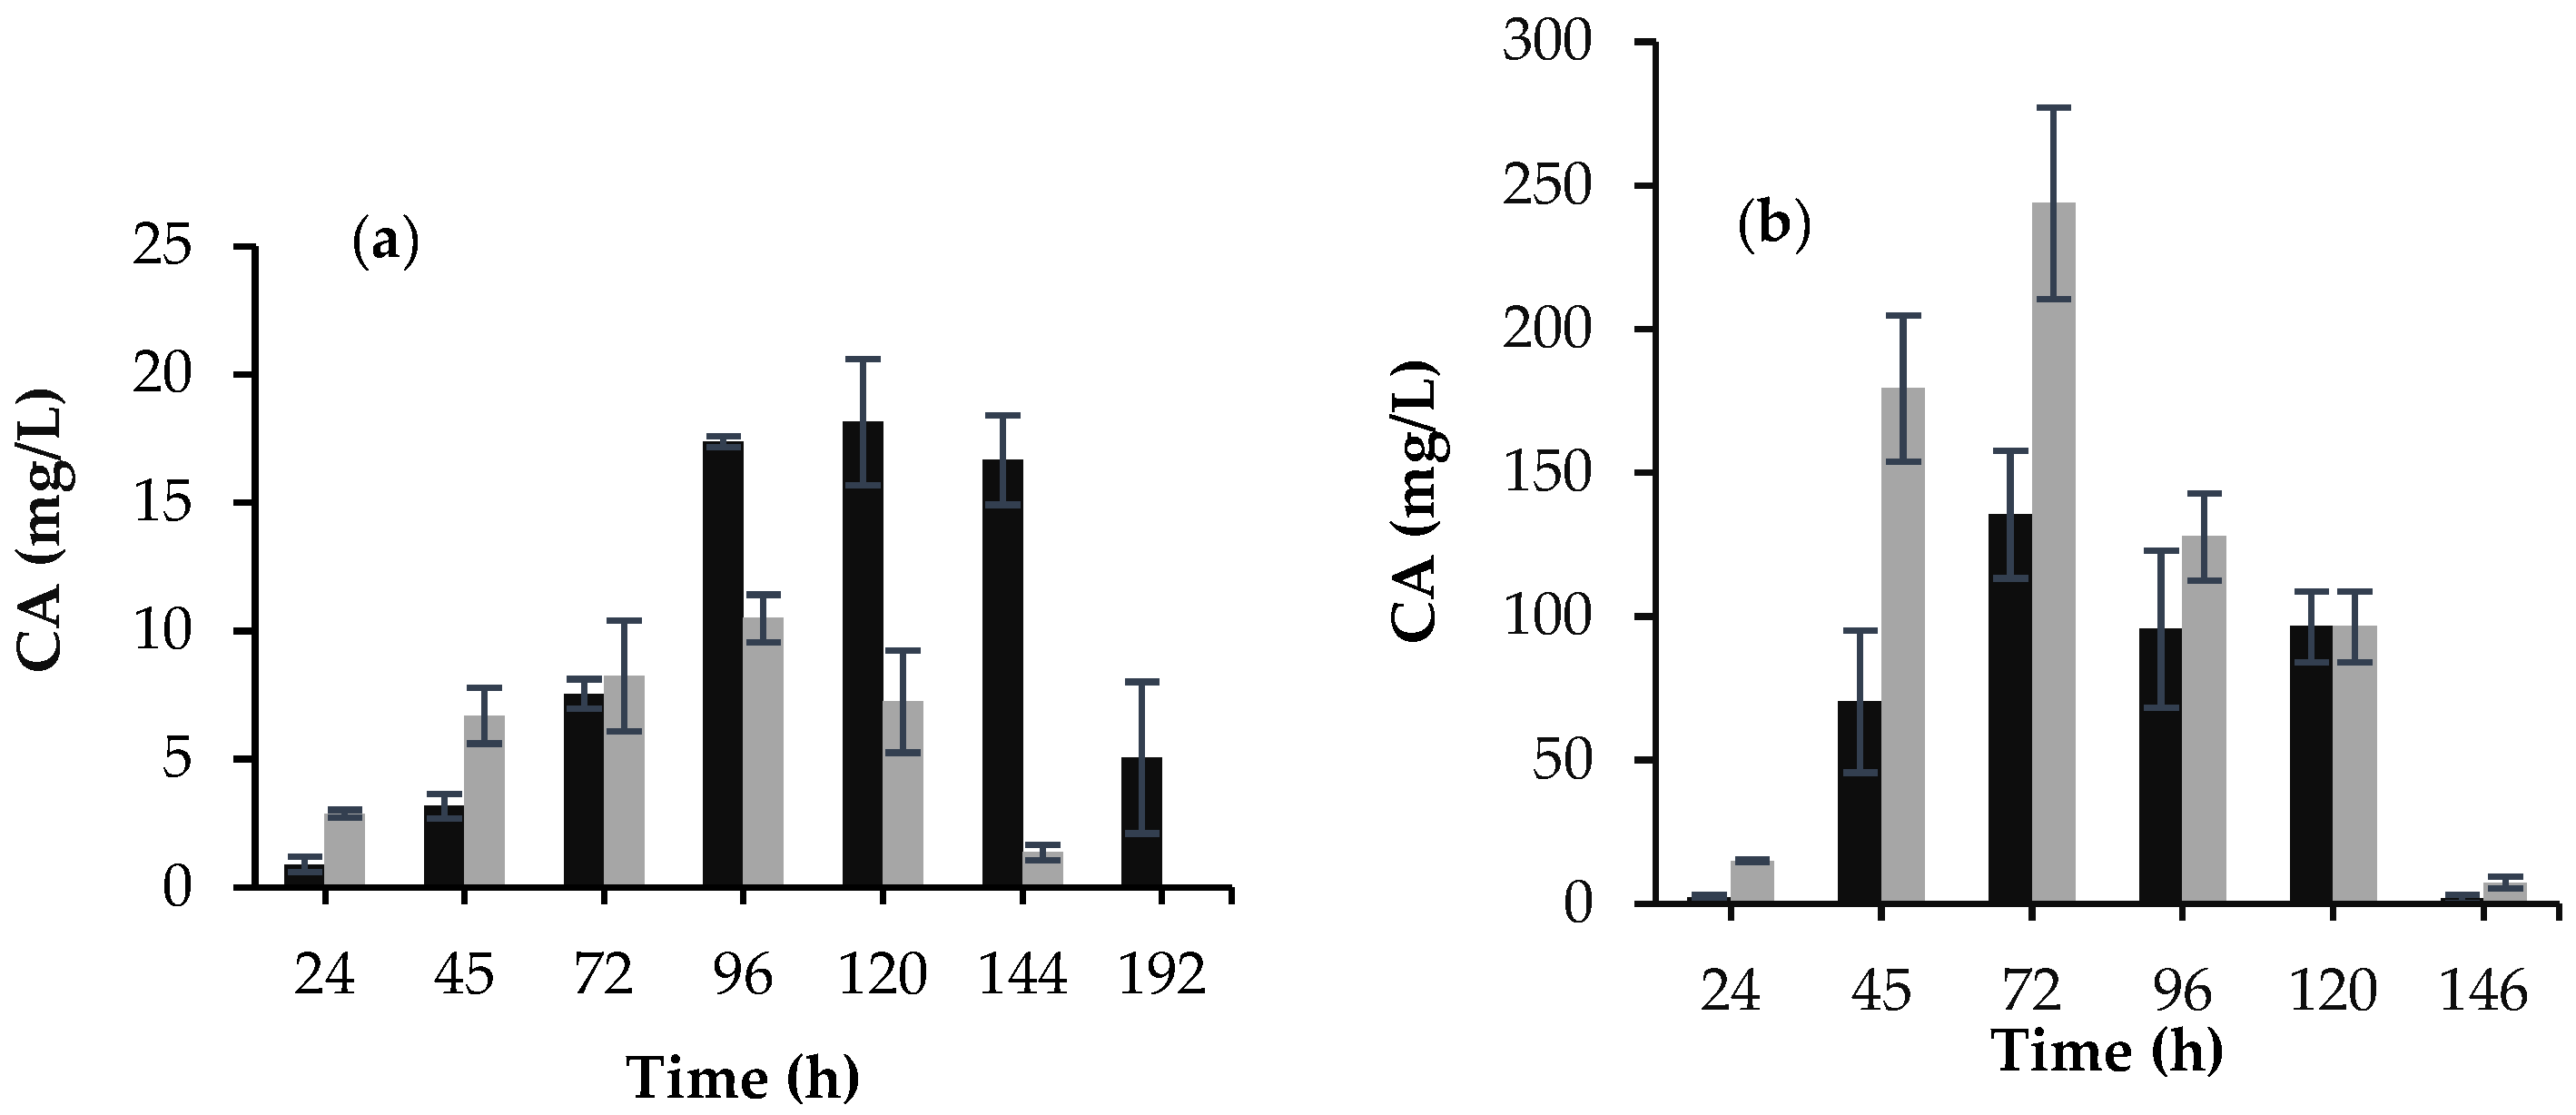
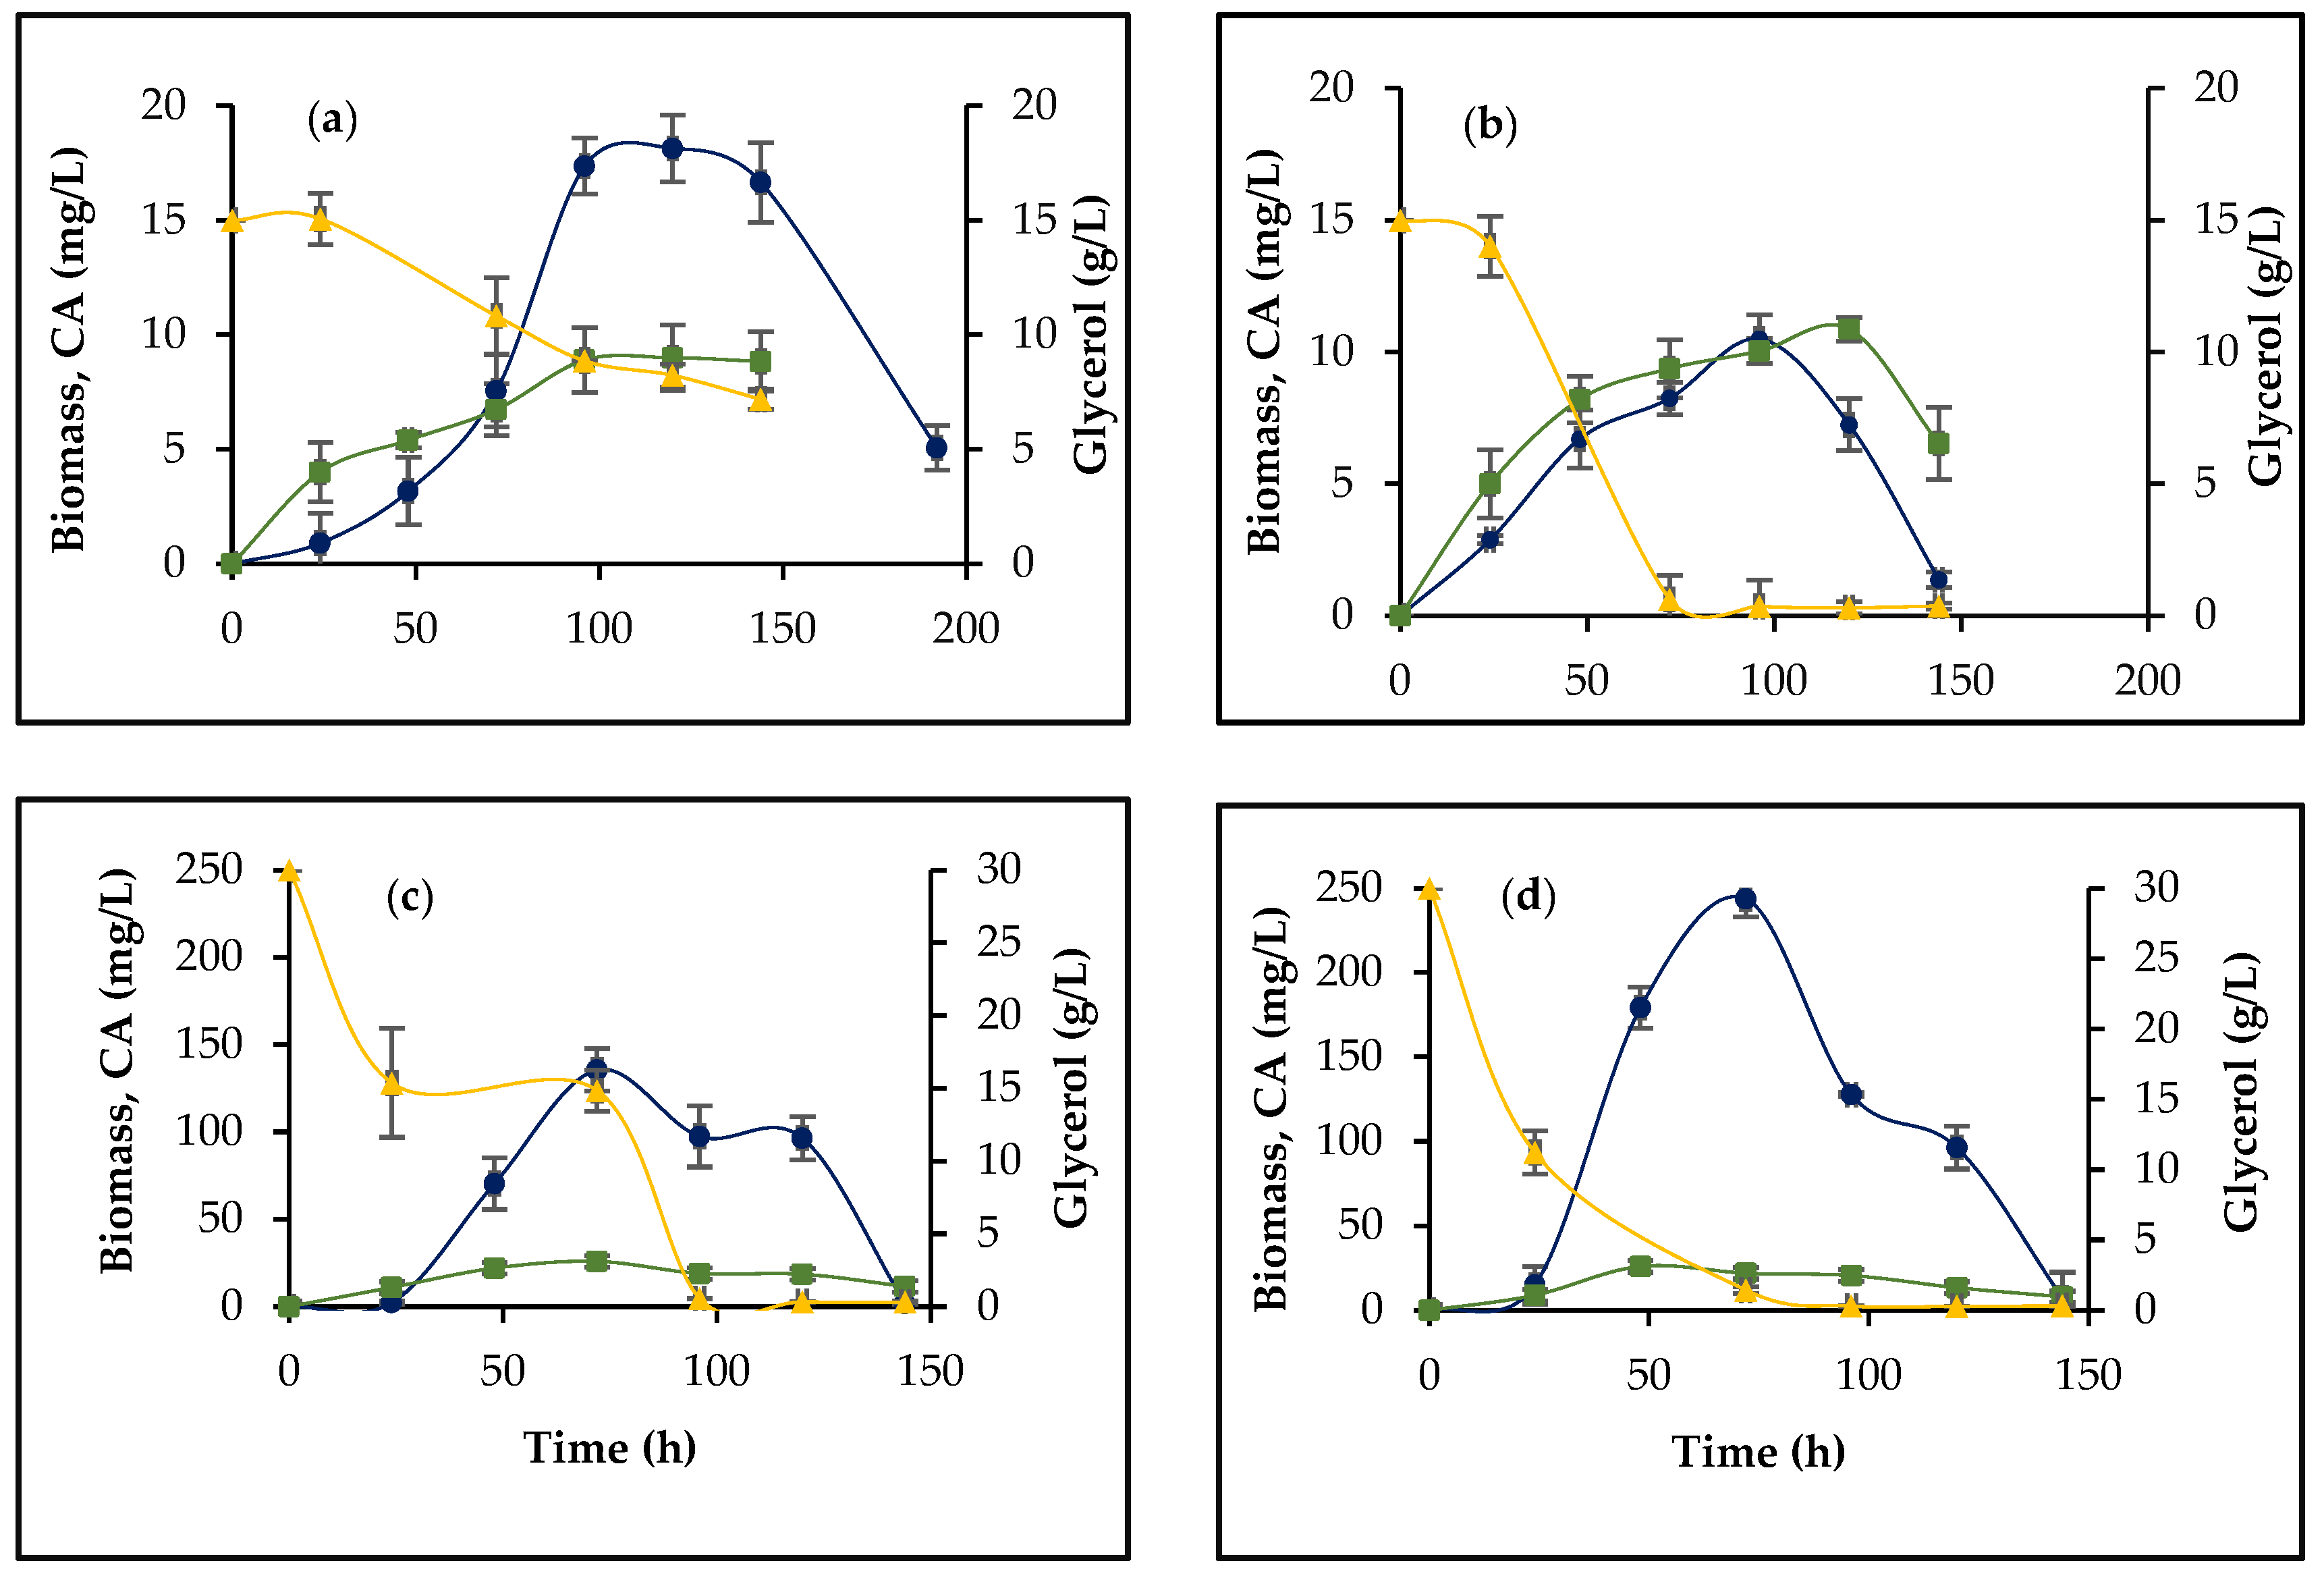
3.1. Morphology, Biomass Growth, and CA Production
3.2. The Effect of orf21 Overexpression on Glycerol Uptake and Ammonium Accumulation
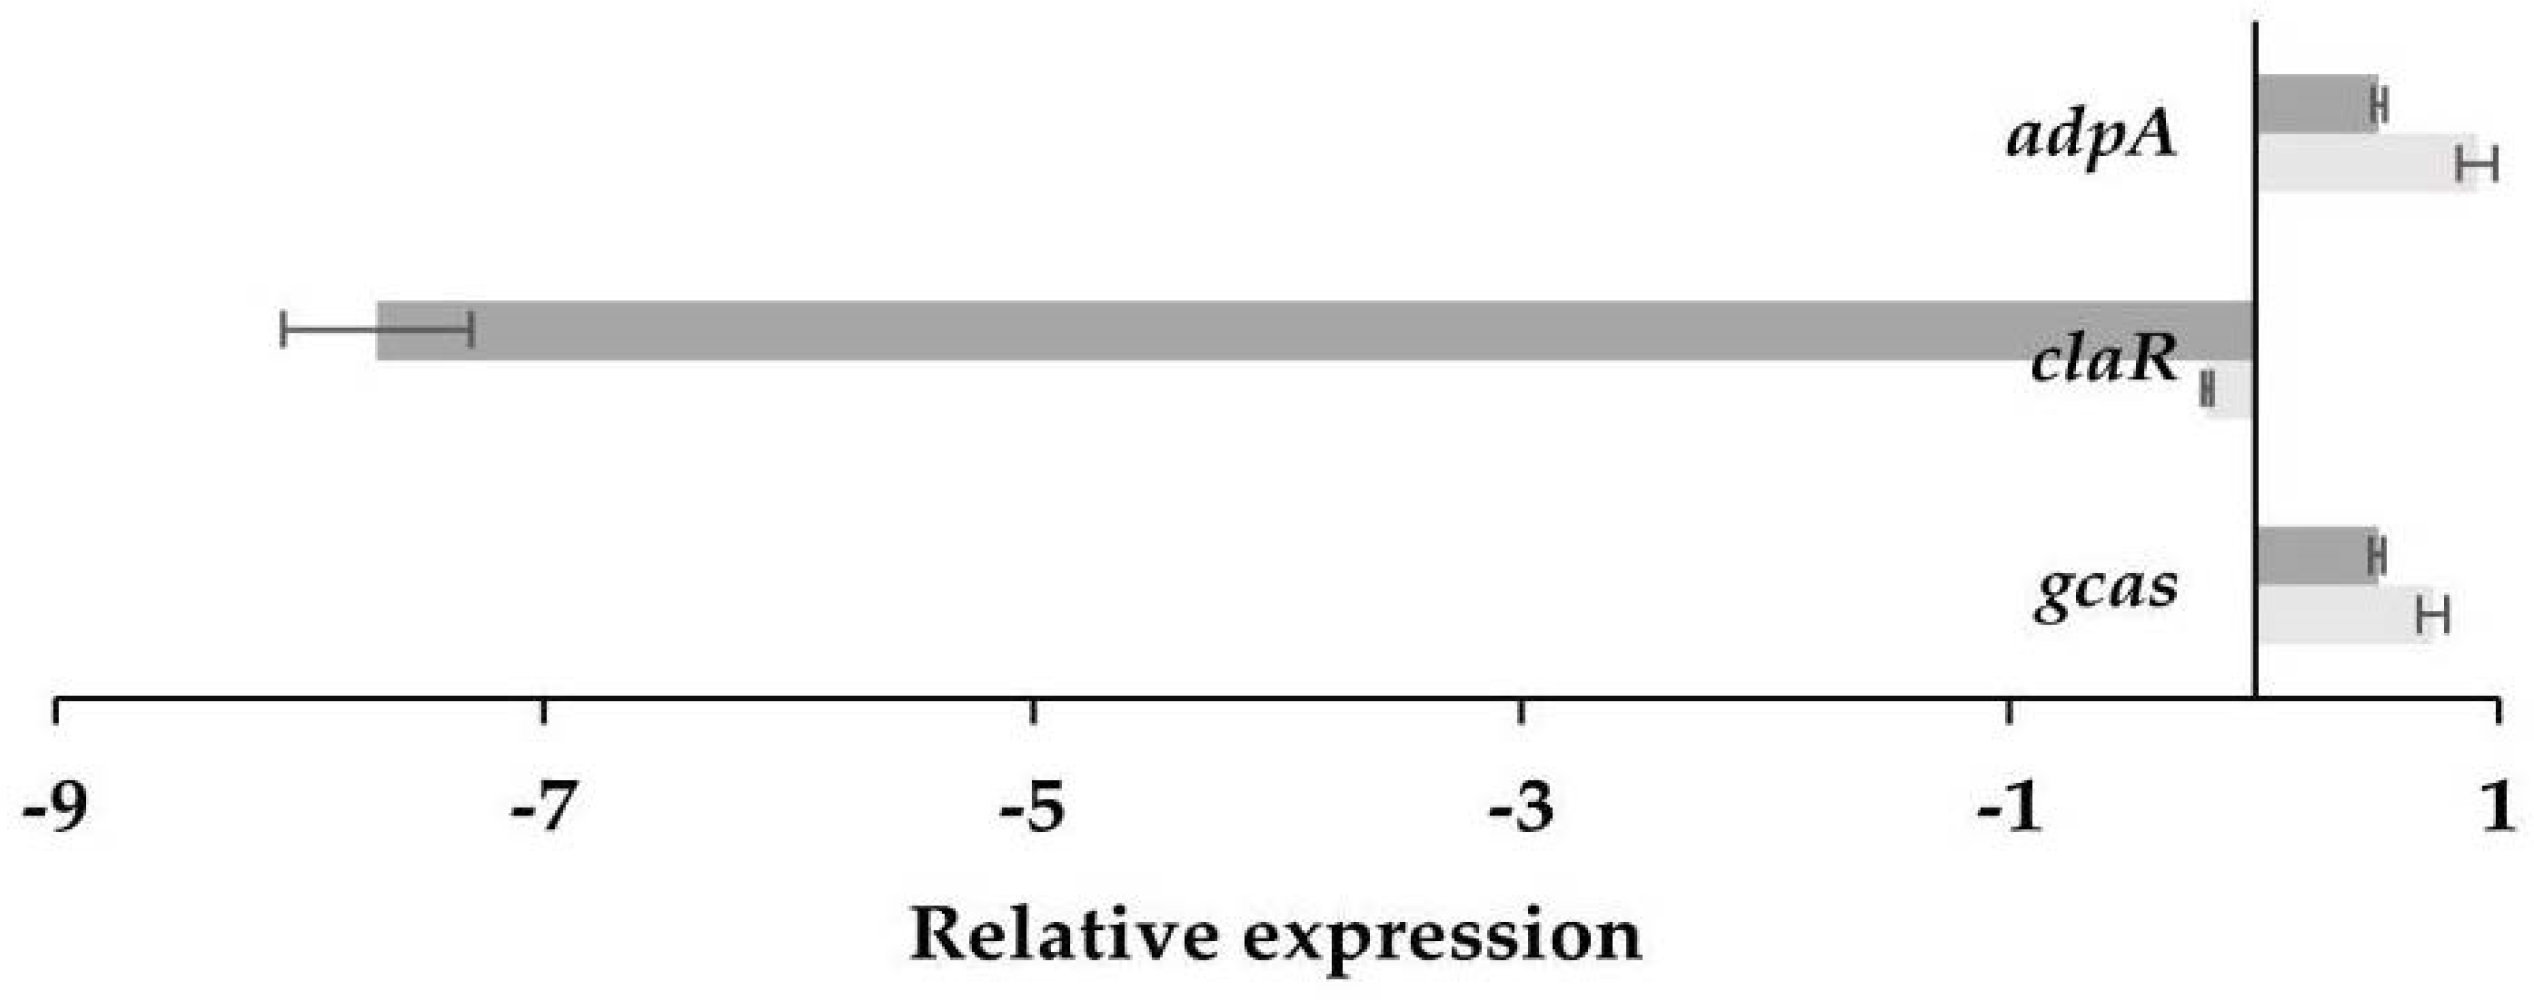
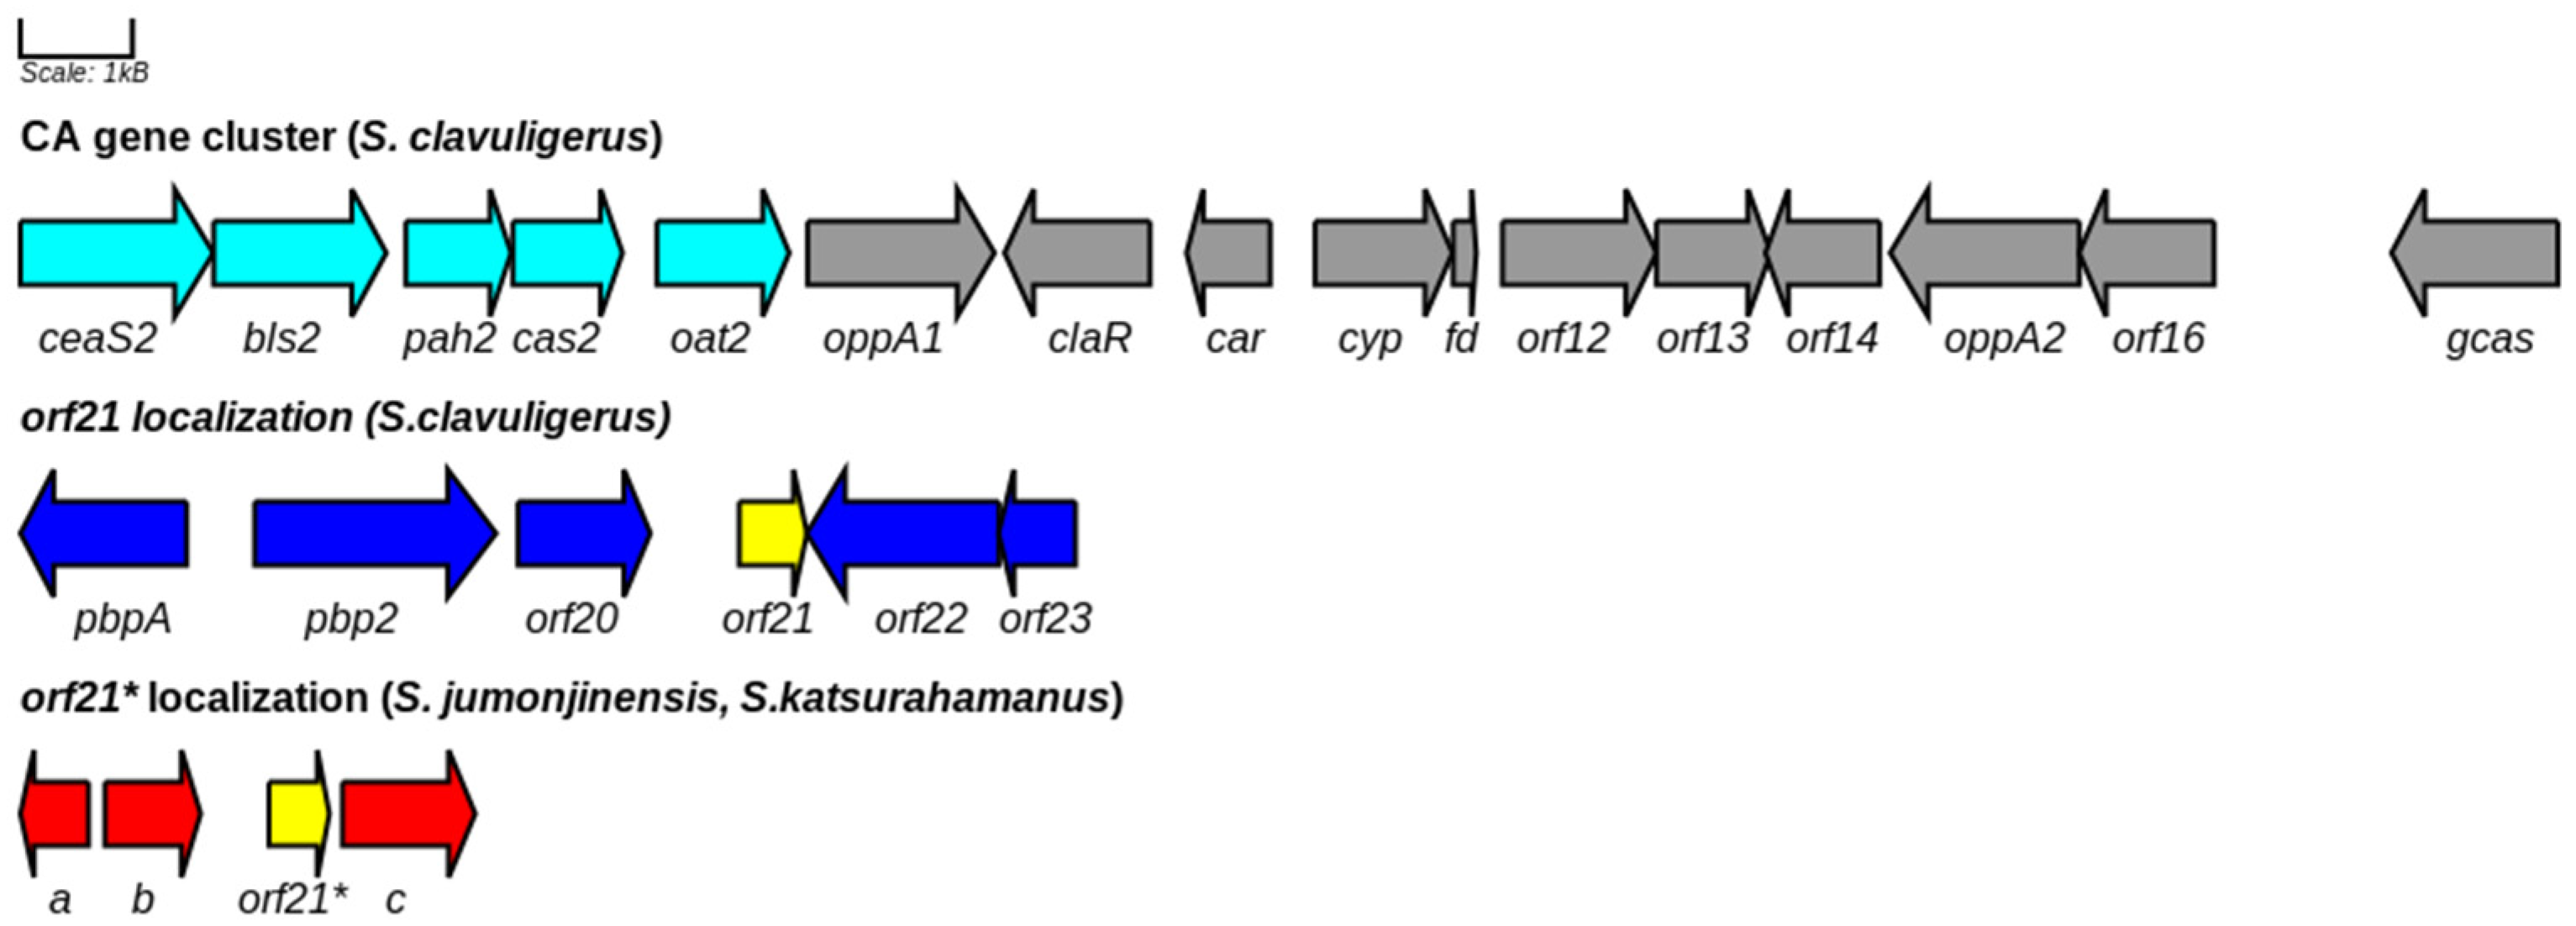
3.3. Differential Transcription Analysis of Genes Involved in CA Biosynthesis
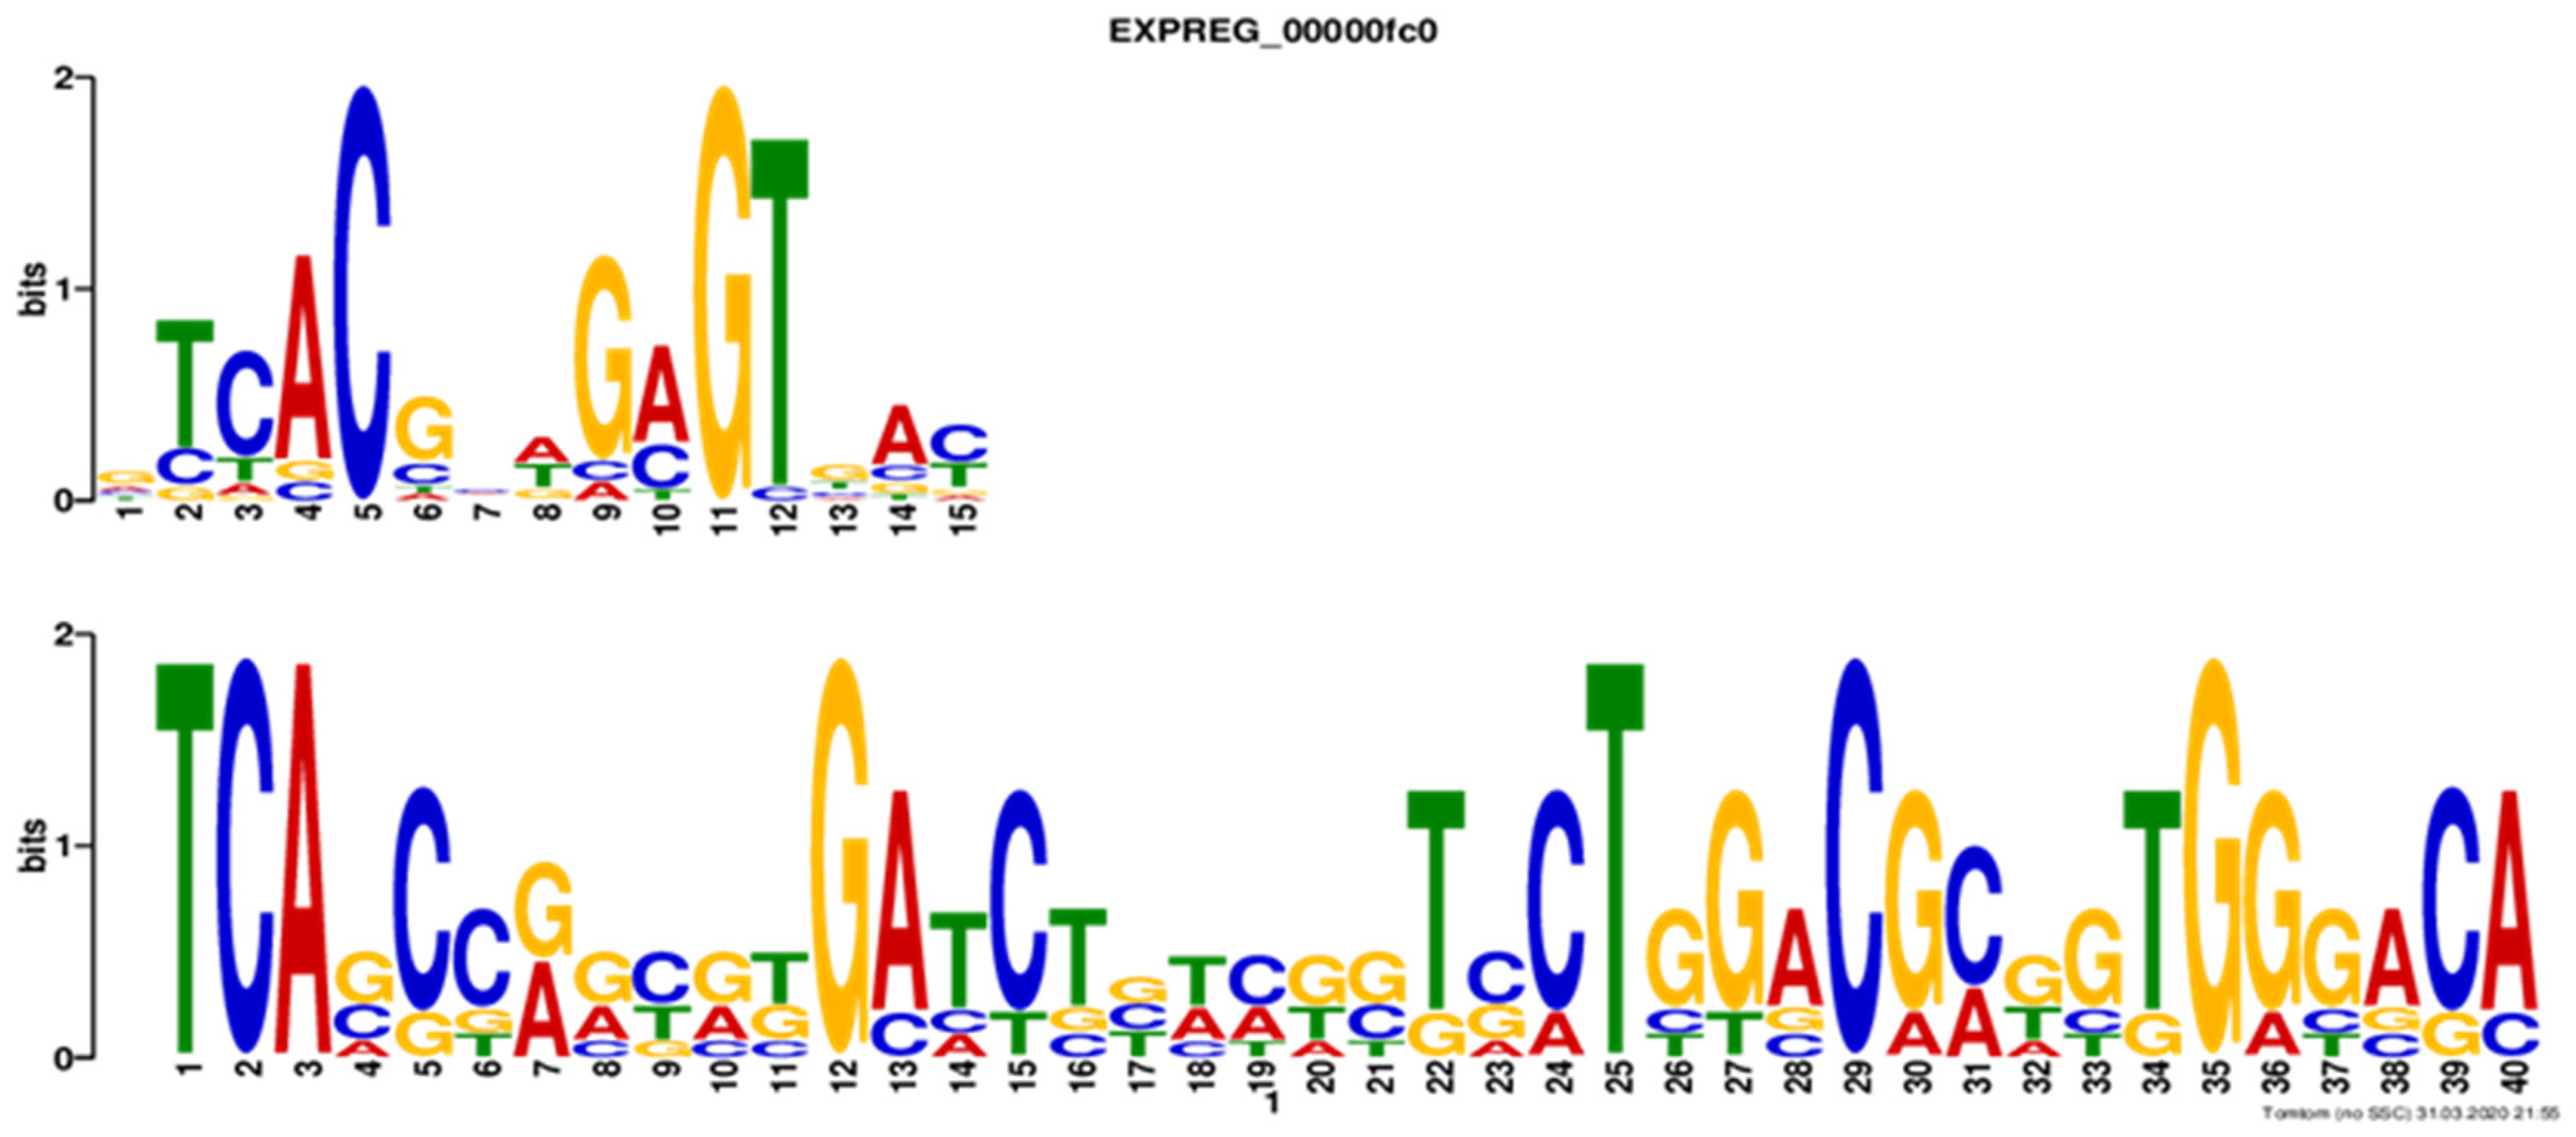
3.4. Phylogenetic Inferences and DNA-Binding Motifs Prediction
4. Discussion
5. Conclusions
Supplementary Materials
Author Contributions
Funding
Institutional Review Board Statement
Informed Consent Statement
Data Availability Statement
Acknowledgments
Conflicts of Interest
References
- Abusara, N.F.; Piercey, B.M.; Moore, M.A.; Shaikh, A.A.; Nothias, L.-F.; Srivastava, S.K.; Cruz-Morales, P.; Dorrestein, P.C.; Barona-Gómez, F.; Tahlan, K. Comparative Genomics and Metabolomics Analyses of Clavulanic Acid-Producing Streptomyces Species Provides Insight Into Specialized Metabolism. Front. Microbiol. 2019, 10, 2550. [Google Scholar] [CrossRef]
- Paradkar, A. Clavulanic acid production by Streptomyces clavuligerus: Biogenesis, regulation and strain improvement. J. Antibiot. 2013, 66, 411–420. [Google Scholar] [CrossRef] [Green Version]
- World Health Organization. Model List of Essential Medicines, 21st List. Geneva; World Health Organization: Geneva, Switzerland, 2019. [Google Scholar]
- Gómez-Cerón, S.; Galindo-Betancur, D.; Ramírez-Malule, H. Data set of in silico simulation for the production of clavulanic acid and cephamycin C by Streptomyces clavuligerus using a genome scale metabolic model. Data Brief 2019, 24, 103992. [Google Scholar] [CrossRef]
- Sánchez Henao, C.P. Análisis de Flux Metabólico en la Producción de Ácido Clavulánico a Partir de Streptomyces Clavuligerus. Universidad de Antioquia. 2013. Available online: http://aims.fao.org/aos/agrovoc/c_492 (accessed on 20 November 2021).
- Zhihan, Z.; Yanping, W. Application of lat gene disruption to increase the clavulanic acid production of Streptomyces clavuligerus. J. Mol. Catal. B Enzym. 2006, 43, 102–107. [Google Scholar] [CrossRef]
- López-Agudelo, V.A.; Gómez-Ríos, D.; Ramirez-Malule, H. Clavulanic acid production by streptomyces clavuligerus: Insights from systems biology, strain engineering, and downstream processing. Antibiotics 2021, 10, 84. [Google Scholar] [CrossRef] [PubMed]
- Álvarez-Álvarez, R.; Rodríguez-García, A.; Martínez-Burgo, Y.; Martín, J.F.; Liras, P. Transcriptional studies on a Streptomyces clavuligerus oppA2 deletion mutant: Nacetylglycyl- clavaminic acid is an intermediate of clavulanic acid biosynthesis. Appl. Environ. Microbiol. 2018, 84, e01701-18. [Google Scholar] [CrossRef] [PubMed] [Green Version]
- Santamarta, I.; Rodríguez-garcía, A.; Pérez-redondo, R.; Martín, J.F.; Liras, P. CcaR Is an Autoregulatory Protein That Binds to the ccaR and cefD-cmcI Promoters of the Cephamycin C-Clavulanic Acid Cluster in Streptomyces clavuligerus. J. Bacteriol. 2002, 184, 3106–3113. [Google Scholar] [CrossRef] [Green Version]
- López-García, M.T.; Santamarta, I.; Liras, P. Morphological differentiation and clavulanic acid formation are affected in a Streptomyces clavuligerus adpA -deleted mutant. Microbiology 2010, 156, 2354–2365. [Google Scholar] [CrossRef] [PubMed] [Green Version]
- Pinilla, L.; Toro, L.F.; Laing, E.; Alzate, J.F.; Ríos-Estepa, R. Comparative transcriptome analysis of streptomyces clavuligerus in response to favorable and restrictive nutritional conditions. Antibiotics 2019, 8, 96. [Google Scholar] [CrossRef] [Green Version]
- Song, J.Y.; Kim, E.S.; Kim, D.W.; Jensen, S.E.; Lee, K.J. A gene located downstream of the clavulanic acid gene cluster in Streptomyces clavuligerus ATCC 27064 encodes a putative response regulator that affects clavulanic acid production. J. Ind. Microbiol. Biotechnol. 2009, 36, 301–311. [Google Scholar] [CrossRef] [PubMed]
- Jnawali, H.N.; Liou, K.; Sohng, J.K. Role of σ-factor (orf21) in clavulanic acid production in Streptomyces clavuligerus NRRL3585. Microbiol. Res. 2011, 166, 369–379. [Google Scholar] [CrossRef] [PubMed]
- Shepherd, M.D.; Kharel, M.K.; Bosserman, M.A.; Rohr, J. Laboratory maintenance of streptomyces species. Curr. Protoc. Microbiol. 2010, 18, 10E.1.1–10E.1.8. [Google Scholar] [CrossRef] [Green Version]
- Sambrook, J.; Green, M.R. Molecular Cloning: A Laboratory Manual, 4th ed.; Inglis, J., Ed.; CSHL: Cold Spring Harbor, NY, USA, 2012. [Google Scholar]
- Wilkinson, C.J.; Hughes-Thomas, Z.A.; Martin, C.J.; Böhm, I.; Mironenko, T.; Deacon, M.; Wheatcroft, M.; Wirtz, G.; Staunton, J.; Leadlay, P.F. Increasing the Efficiency of Heterologous Promoters in Actinomycetes. Microb. Biotechnol. 2002, 4, 417–426. [Google Scholar]
- Garcia-Dominguez, M.; Martin, J.F.; Mahro, B.; Demain, A.L.; Liras, P. Efficient Plasmid Transformation of the beta-Lactam Producer Streptomyces clavuligerus. Appl. Environ. Microbiol. 1987, 53, 1376–1381. [Google Scholar] [CrossRef] [PubMed] [Green Version]
- Ramirez-Malule, H.; Junne, S.; López, C.; Zapata, J.; Sáez, A.; Neubauer, P.; Rios-Estepa, R. An improved HPLC-DAD method for clavulanic acid quantification in fermentation broths of Streptomyces clavuligerus. J. Pharm. Biomed. Anal. 2016, 120, 241–247. [Google Scholar] [CrossRef] [PubMed]
- Álvarez-Álvarez, R.; Rodríguez-García, A.; Santamarta, I.; Perez, R.; Prieto-Domínguez, A.; Burgo, Y.M.; Liras, P. Transcriptomic analysis of Streptomyces clavuligerus ΔccaR:: Tsr: Effects of the cephamycin C-clavulanic acid cluster regulator CcaR on global regulation. Microb. Biotechnol. 2014, 7, 221–231. [Google Scholar] [CrossRef] [PubMed]
- Merck. TRI Reagent® (Guanidine Thiocyanate & Phenol) Protocol; Merck: Darmstadt, Germany, 2021. [Google Scholar]
- Livak, K.J.; Schmittgen, T.D. Analysis of Relative Gene Expression Data Using Real- Time Quantitative PCR and the 2−ΔΔCt method. Methods 2001, 25, 402–408. [Google Scholar] [CrossRef]
- Schmittgen, T.D.; Zakrajsek, B.A. Effect of experimental treatment on housekeeping gene expression: Validation by real-time, quantitative RT-PCR. Biochem. Biophys. Methods 2000, 46, 69–81. [Google Scholar] [CrossRef]
- Ronquist, F.; Teslenko, M.; van der Mark, P.; Ayres, D.L.; Darling, A.; Höhna, S.; Larget, B.; Liu, L.; Suchard, M.A.; Huelsenbeck, J.P. Mrbayes 3.2: Efficient bayesian phylogenetic inference and model choice across a large model space. Syst. Biol. 2012, 61, 539–542. [Google Scholar] [CrossRef] [Green Version]
- Gelman, A.; Rubin, D. Inference from iterative simulation using multiple sequences. Stat. Sci. 1992, 10, 354–363. [Google Scholar] [CrossRef]
- Nei, M.; Kumar, S. Molecular Evolution and Phylogenetics; Oxford University Press: New York, NY, USA, 2000. [Google Scholar]
- Jones, D.T.; Taylor, W.R.; Thornton, J.M. The rapid generation of mutation data matrices. Bioinformatics 1992, 8, 275–282. [Google Scholar] [CrossRef] [PubMed]
- Tamura, K.; Stecher, G.; Kumar, S. MEGA11: Molecular Evolutionary Genetics Analysis Version 11. Mol. Biol. Evol. 2021, 38, 3022–3027. [Google Scholar] [CrossRef] [PubMed]
- Bailey, T.L.; Elkan, C. Fitting a mixture model by expectation maximization to discover motifs in biopolymers. Proc. Int. Conf. Intell. Syst. Mol. Biol. 1994, 2, 28–36. [Google Scholar] [PubMed]
- Gupta, S.; Stamatoyannopoulos, J.A.; Bailey, T.L.; Noble, W.S. Quantifying similarity between motifs. Genome Biol. 2007, 8, R24. [Google Scholar] [CrossRef] [Green Version]
- Helmann, J.D. The Extracytoplasmic Function (ECF) Sigma Factors. Adv. Microb. Physiol. 2002, 46, 47–110. [Google Scholar] [CrossRef]
- Romero-Rodríguez, A.; Robledo-Casados, I.; Sánchez, S. An overview on transcriptional regulators in Streptomyces. Biochim. Biophys. Acta 2015, 1849, 1017–1039. [Google Scholar] [CrossRef]
- De Bruijn, F.J. Stress and Environmental Regulation of Gene Expression and Adaptation in Bacteria. Stress and Environmental Regulation of Gene Expression and Adaptation in Bacteria; John Wiley & Sons: Hoboken, NJ, USA, 2016. [Google Scholar] [CrossRef]
- Casas-Pastor, D.; Müller, R.R.; Jaenicke, S.; Brinkrolf, K.; Becker, A.; Buttner, M.J.; Gross, C.A.; Mascher, T.; Goesmann, A.; Fritz, G. Expansion and re-classification of the extracytoplasmic function (ECF) sigma factor family. Nucleic Acids Res. 2021, 49, 986–1005. [Google Scholar] [CrossRef]
- Staroń, A.; Sofia, H.J.; Dietrich, S.; Ulrich, L.E.; Liesegang, H.; Mascher, T. The third pillar of bacterial signal transduction: Classification of the extracytoplasmic function (ECF) σ factor protein family. Mol. Microbiol. 2009, 74, 557–581. [Google Scholar] [CrossRef]
- Bellão, C.; Antonio, T.; Araujo, M.L.G.C.; Badino, A.C. Production of clavulanic acid and cephamycin c by streptomyces clavuligerus under different fed-batch conditions. Braz. J. Chem. Eng. 2013, 30, 257–266. [Google Scholar] [CrossRef] [Green Version]
- Garcia-Dominguez, M.; Martin, J.F.; Liras, P. Characterization of sugar uptake in wild-type Streptomyces clavuligerus, which is impaired in glucose uptake, and in a glucose-utilizing mutant. J. Bacteriol. 1989, 171, 6808–6814. [Google Scholar] [CrossRef] [Green Version]
- Fu, J.; Qin, R.; Zong, G.; Liu, C.; Kang, N.; Zhong, C.; Cao, G. The CagRS Two-Component System Regulates Clavulanic Acid Metabolism via Multiple Pathways in Streptomyces clavuligerus F613-1. Front. Microbiol. 2019, 10, 244. [Google Scholar] [CrossRef] [PubMed]
- Kirk, S.; Avignone-rossa, C.A.; Bushell, M.E. Growth limiting substrate affects antibiotic production and associated metabolic fluxes in Streptomyces clavuligerus. Biotechnol. Lett. 2000, 22, 1803–1809. [Google Scholar] [CrossRef]
- Yepes-García, J.; Caicedo-Montoya, C.; Pinilla, L.; Toro, L.F.; Ríos-Estepa, R. Morphological differentiation of streptomyces clavuligerus exposed to diverse environmental conditions and its relationship with clavulanic acid biosynthesis. Processes 2020, 8, 1038. [Google Scholar] [CrossRef]
- Arulanantham, H.; Kershaw, N.J.; Hewitson, K.S.; Hughes, C.E.; Thirkettle, J.E.; Schofield, C.J. ORF17 from the clavulanic acid biosynthesis gene cluster catalyzes the ATP-dependent formation of N-glycyl-clavaminic acid. J. Biol. Chem. 2006, 281, 279–287. [Google Scholar] [CrossRef] [PubMed] [Green Version]
- Den Hengst, C.D.; Tran, N.T.; Bibb, M.J.; Chandra, G.; Leskiw, B.K.; Buttner, M.J. Genes essential for morphological development and antibiotic production in Streptomyces coelicolor are targets of BldD during vegetative growth. Mol. Microbiol. 2010, 78, 361–379. [Google Scholar] [CrossRef] [PubMed] [Green Version]


| Culture Medium | Strain | YP/S (g·g−1) | YP/X (g·g−1) | Qs (g·g−1·h−1) |
|---|---|---|---|---|
| GSPG | S. clavuligerus/pIORF21 | 0.0025 | 3.44 | 0.0063 |
| S. clavuligerus/pIB139 | 0.0005 | 1.4 | 0.0142 | |
| ISP | S. clavuligerus/pIORF21 | 0.2480 | 8.9 | 0.0003 |
| S. clavuligerus/pIB139 | 0.0234 | 17.6 | 0.0062 |
Publisher’s Note: MDPI stays neutral with regard to jurisdictional claims in published maps and institutional affiliations. |
© 2022 by the authors. Licensee MDPI, Basel, Switzerland. This article is an open access article distributed under the terms and conditions of the Creative Commons Attribution (CC BY) license (https://creativecommons.org/licenses/by/4.0/).
Share and Cite
Patiño, L.F.; Aguirre-Hoyos, V.; Pinilla, L.I.; Toro, L.F.; Ríos-Estepa, R. Environmental Factors Modulate the Role of orf21 Sigma Factor in Clavulanic Acid Production in Streptomyces Clavuligerus ATCC27064. Bioengineering 2022, 9, 78. https://doi.org/10.3390/bioengineering9020078
Patiño LF, Aguirre-Hoyos V, Pinilla LI, Toro LF, Ríos-Estepa R. Environmental Factors Modulate the Role of orf21 Sigma Factor in Clavulanic Acid Production in Streptomyces Clavuligerus ATCC27064. Bioengineering. 2022; 9(2):78. https://doi.org/10.3390/bioengineering9020078
Chicago/Turabian StylePatiño, Luisa F., Vanessa Aguirre-Hoyos, Laura I. Pinilla, León F. Toro, and Rigoberto Ríos-Estepa. 2022. "Environmental Factors Modulate the Role of orf21 Sigma Factor in Clavulanic Acid Production in Streptomyces Clavuligerus ATCC27064" Bioengineering 9, no. 2: 78. https://doi.org/10.3390/bioengineering9020078
APA StylePatiño, L. F., Aguirre-Hoyos, V., Pinilla, L. I., Toro, L. F., & Ríos-Estepa, R. (2022). Environmental Factors Modulate the Role of orf21 Sigma Factor in Clavulanic Acid Production in Streptomyces Clavuligerus ATCC27064. Bioengineering, 9(2), 78. https://doi.org/10.3390/bioengineering9020078