
Influence of Rigid–Elastic Artery Wall of Carotid and Coronary Stenosis on Hemodynamics

 ,
,  , ,
, ,
Abstract
1. Introduction
2. Problem Definition and Modeling
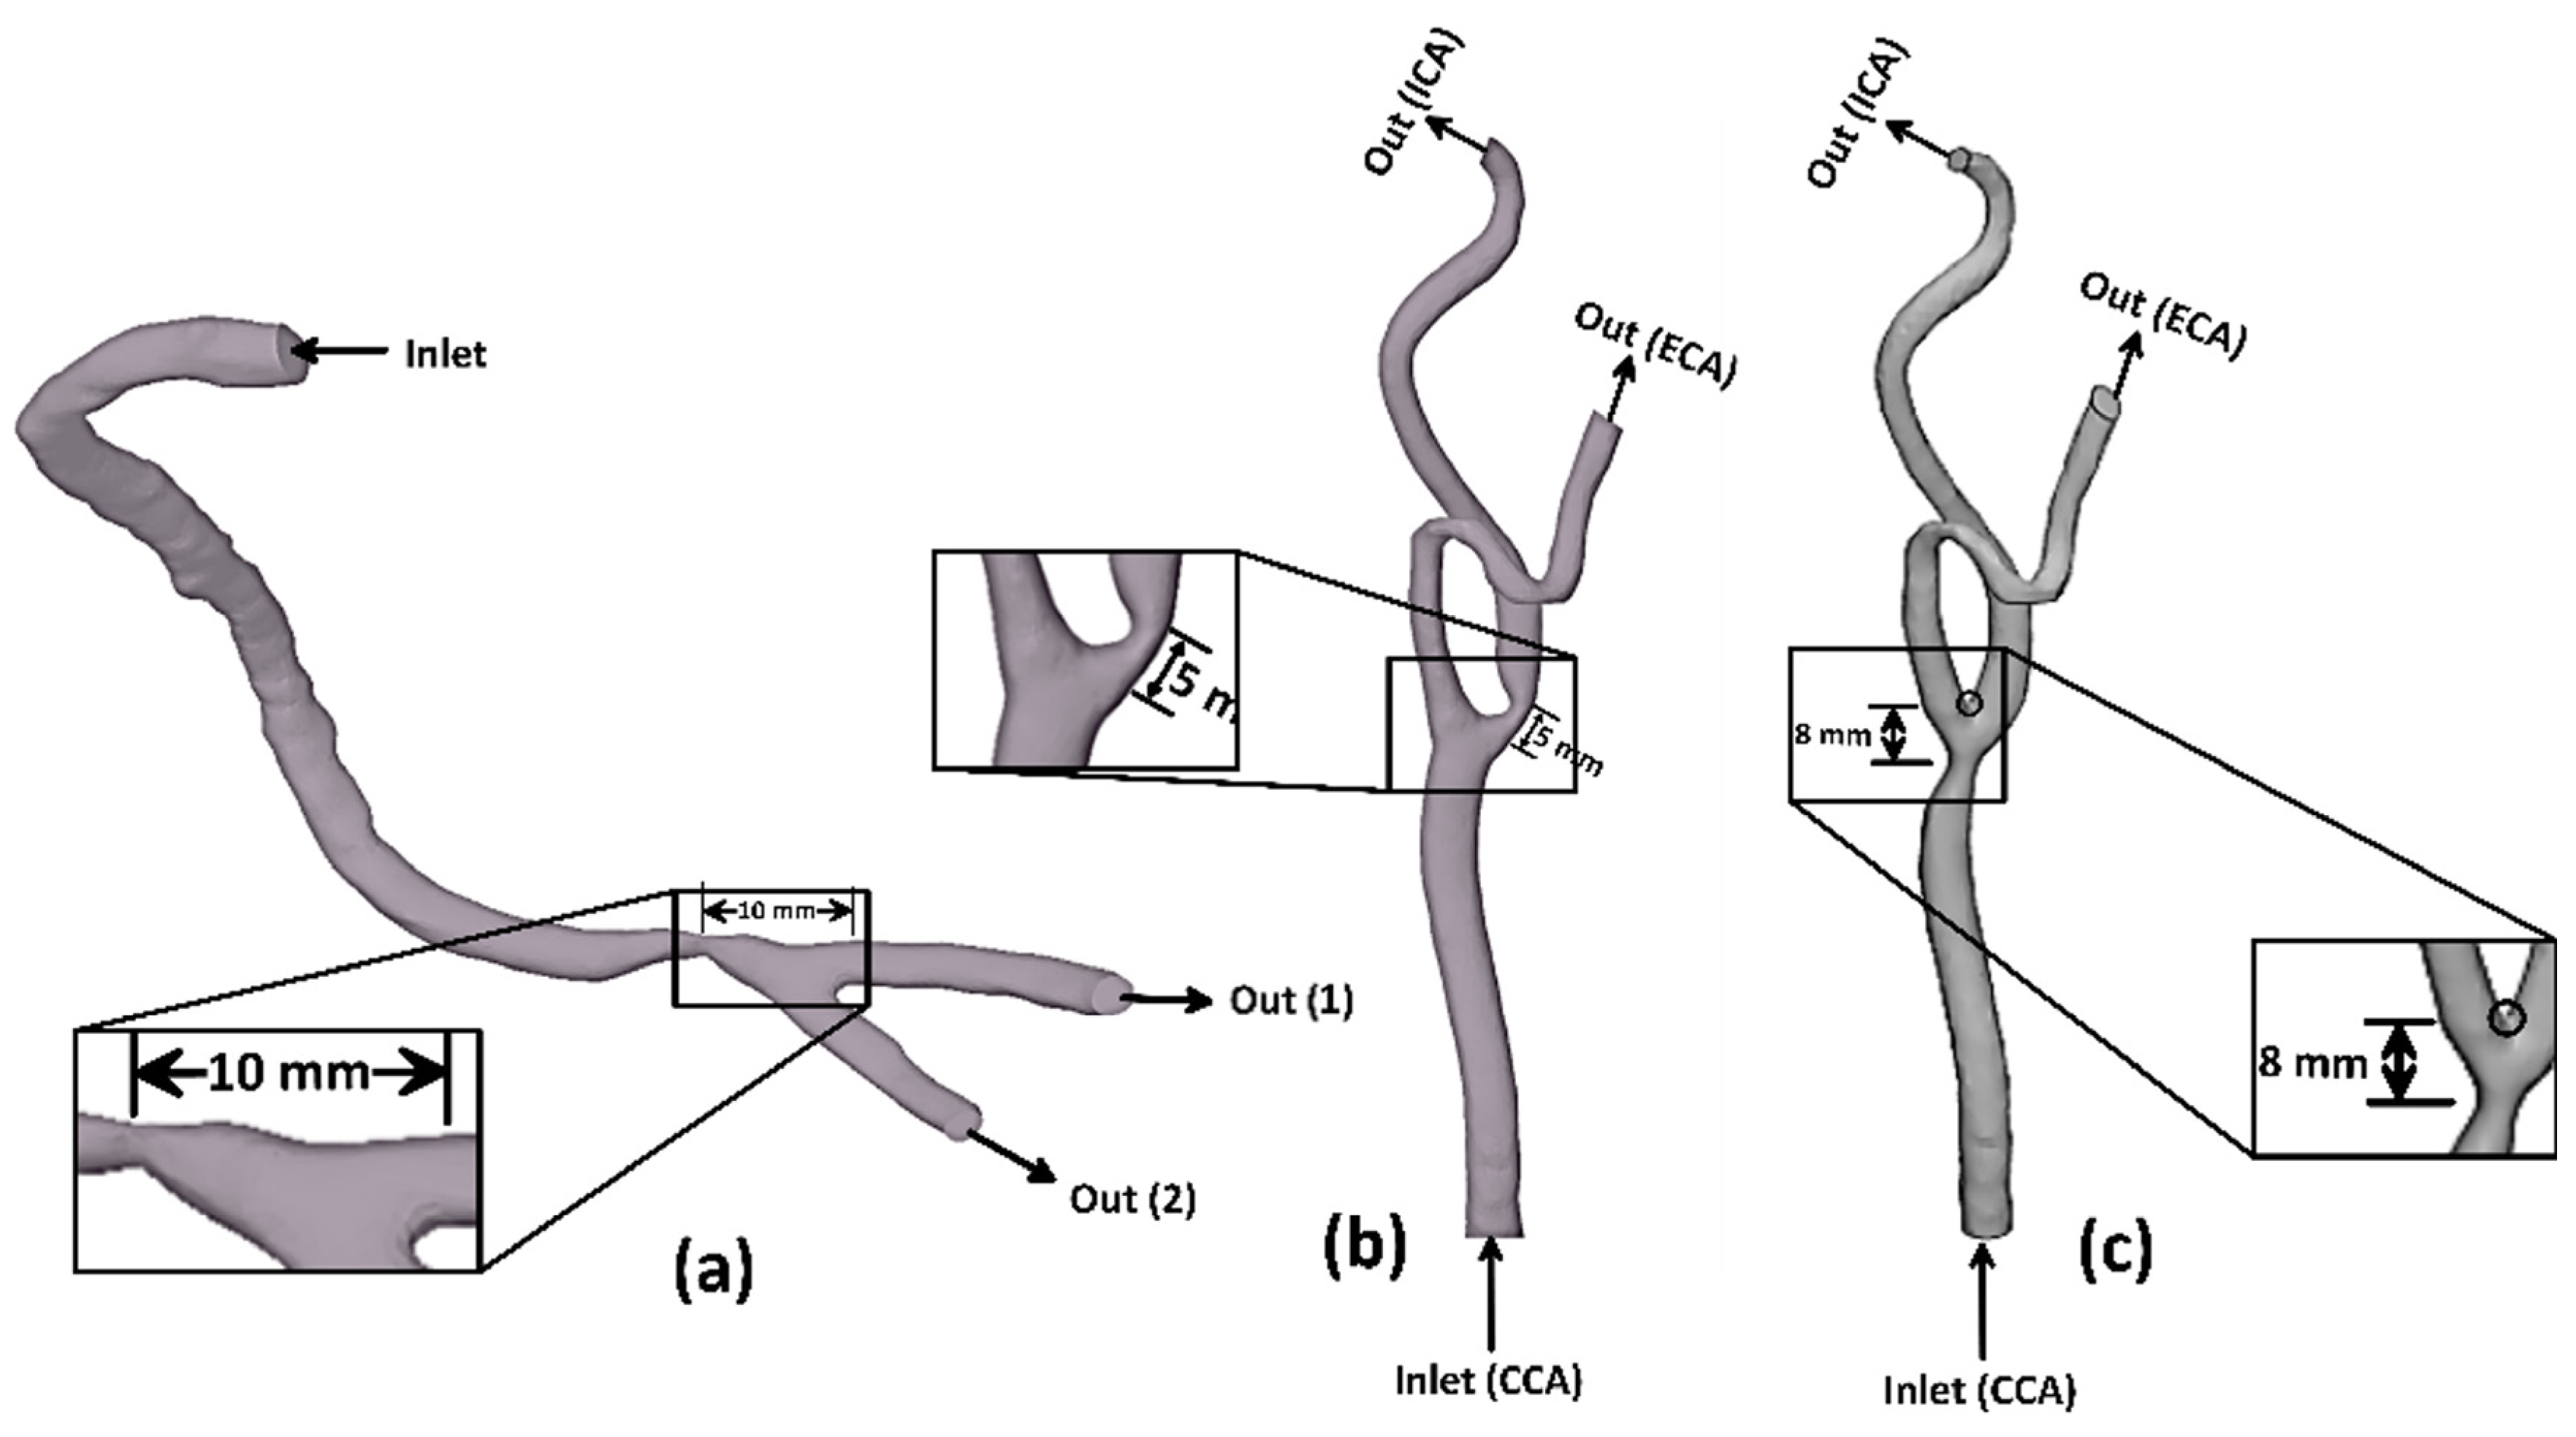
2.1. Physical Model
2.2. Theoretical Analysis
- The flow is incompressible.
- The value of the Reynolds number does not exceed 2000. Accordingly, it is reasonable to assume the flow is laminar. Such an assumption agrees with the previous study of Peacock et al. [36], which stated that the coronary arteries flow’s waveforms were unlikely to be disturbed, and the blood flow in the carotid arteries is usually laminar.
- Approximately 55% of blood is made up of plasma. As is well known, blood is a non-Newtonian fluid when red blood cells are present, even though plasma is a Newtonian fluid [37].
2.2.1. Governing Equations
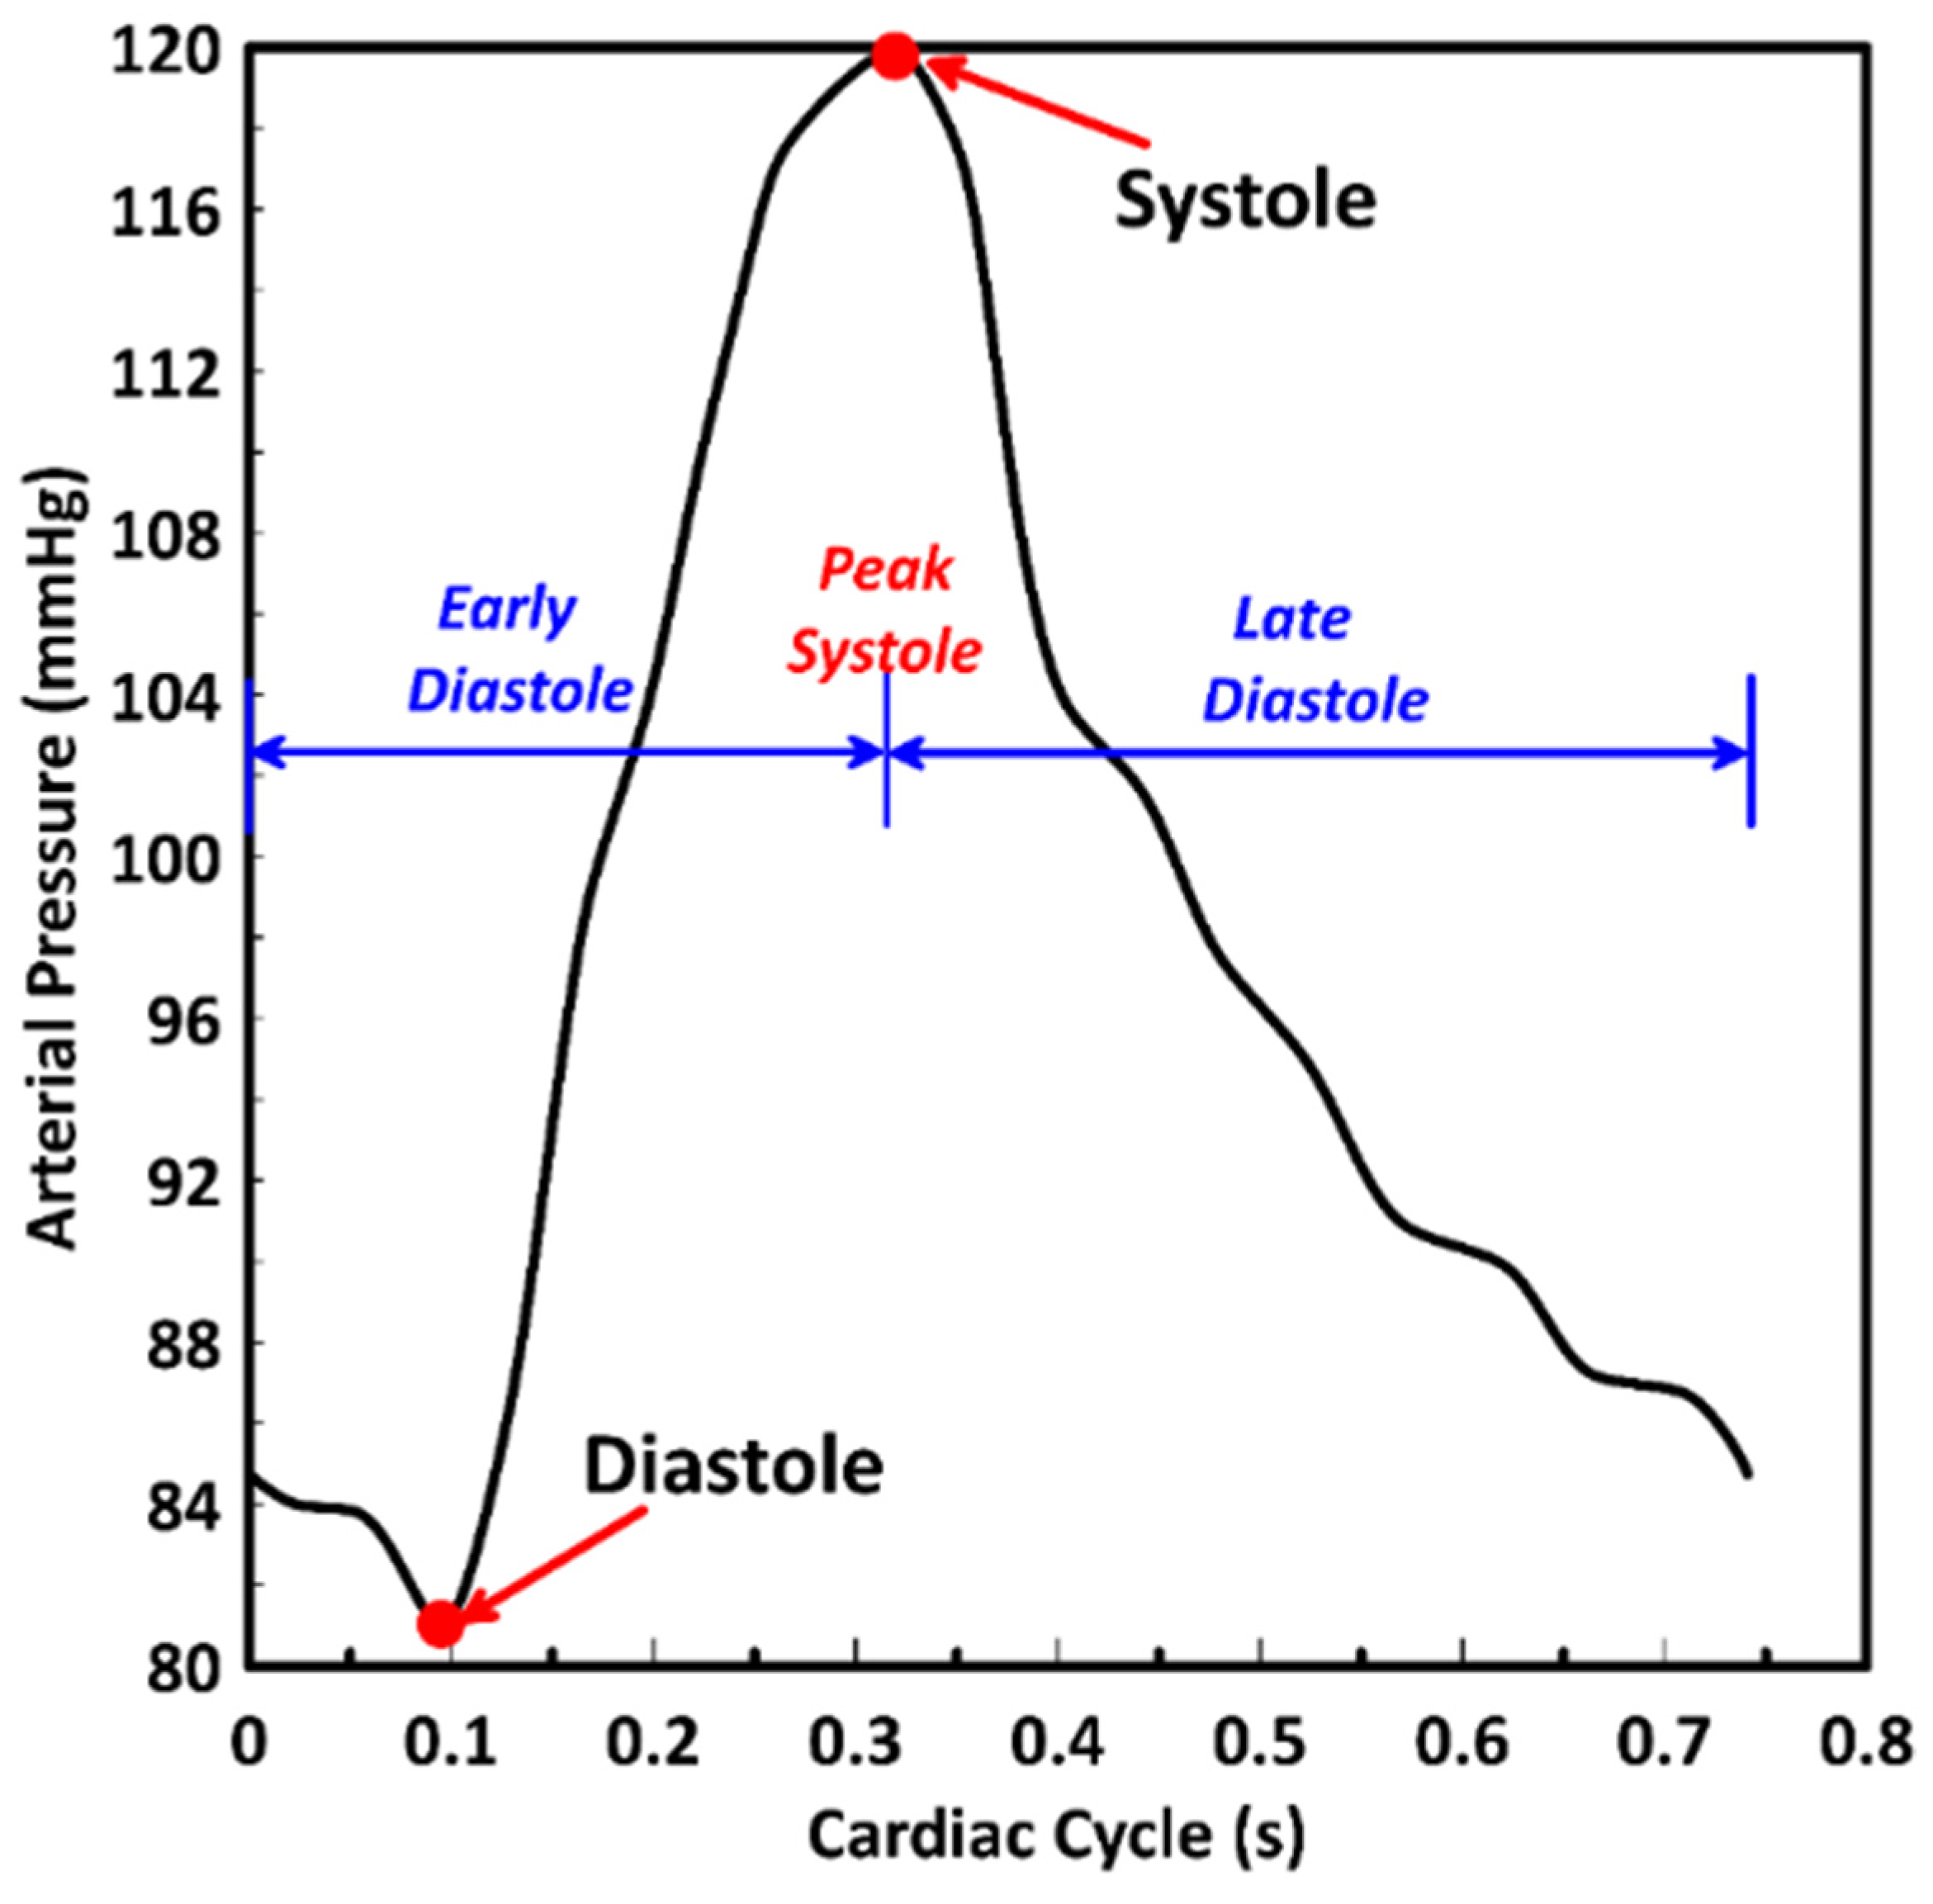
2.2.2. Boundary and Initial Conditions
2.3. Numerical Simulation
2.3.1. Grid and Time Step Independent Tests
2.3.2. Fluid–Structure Interaction (FSI)
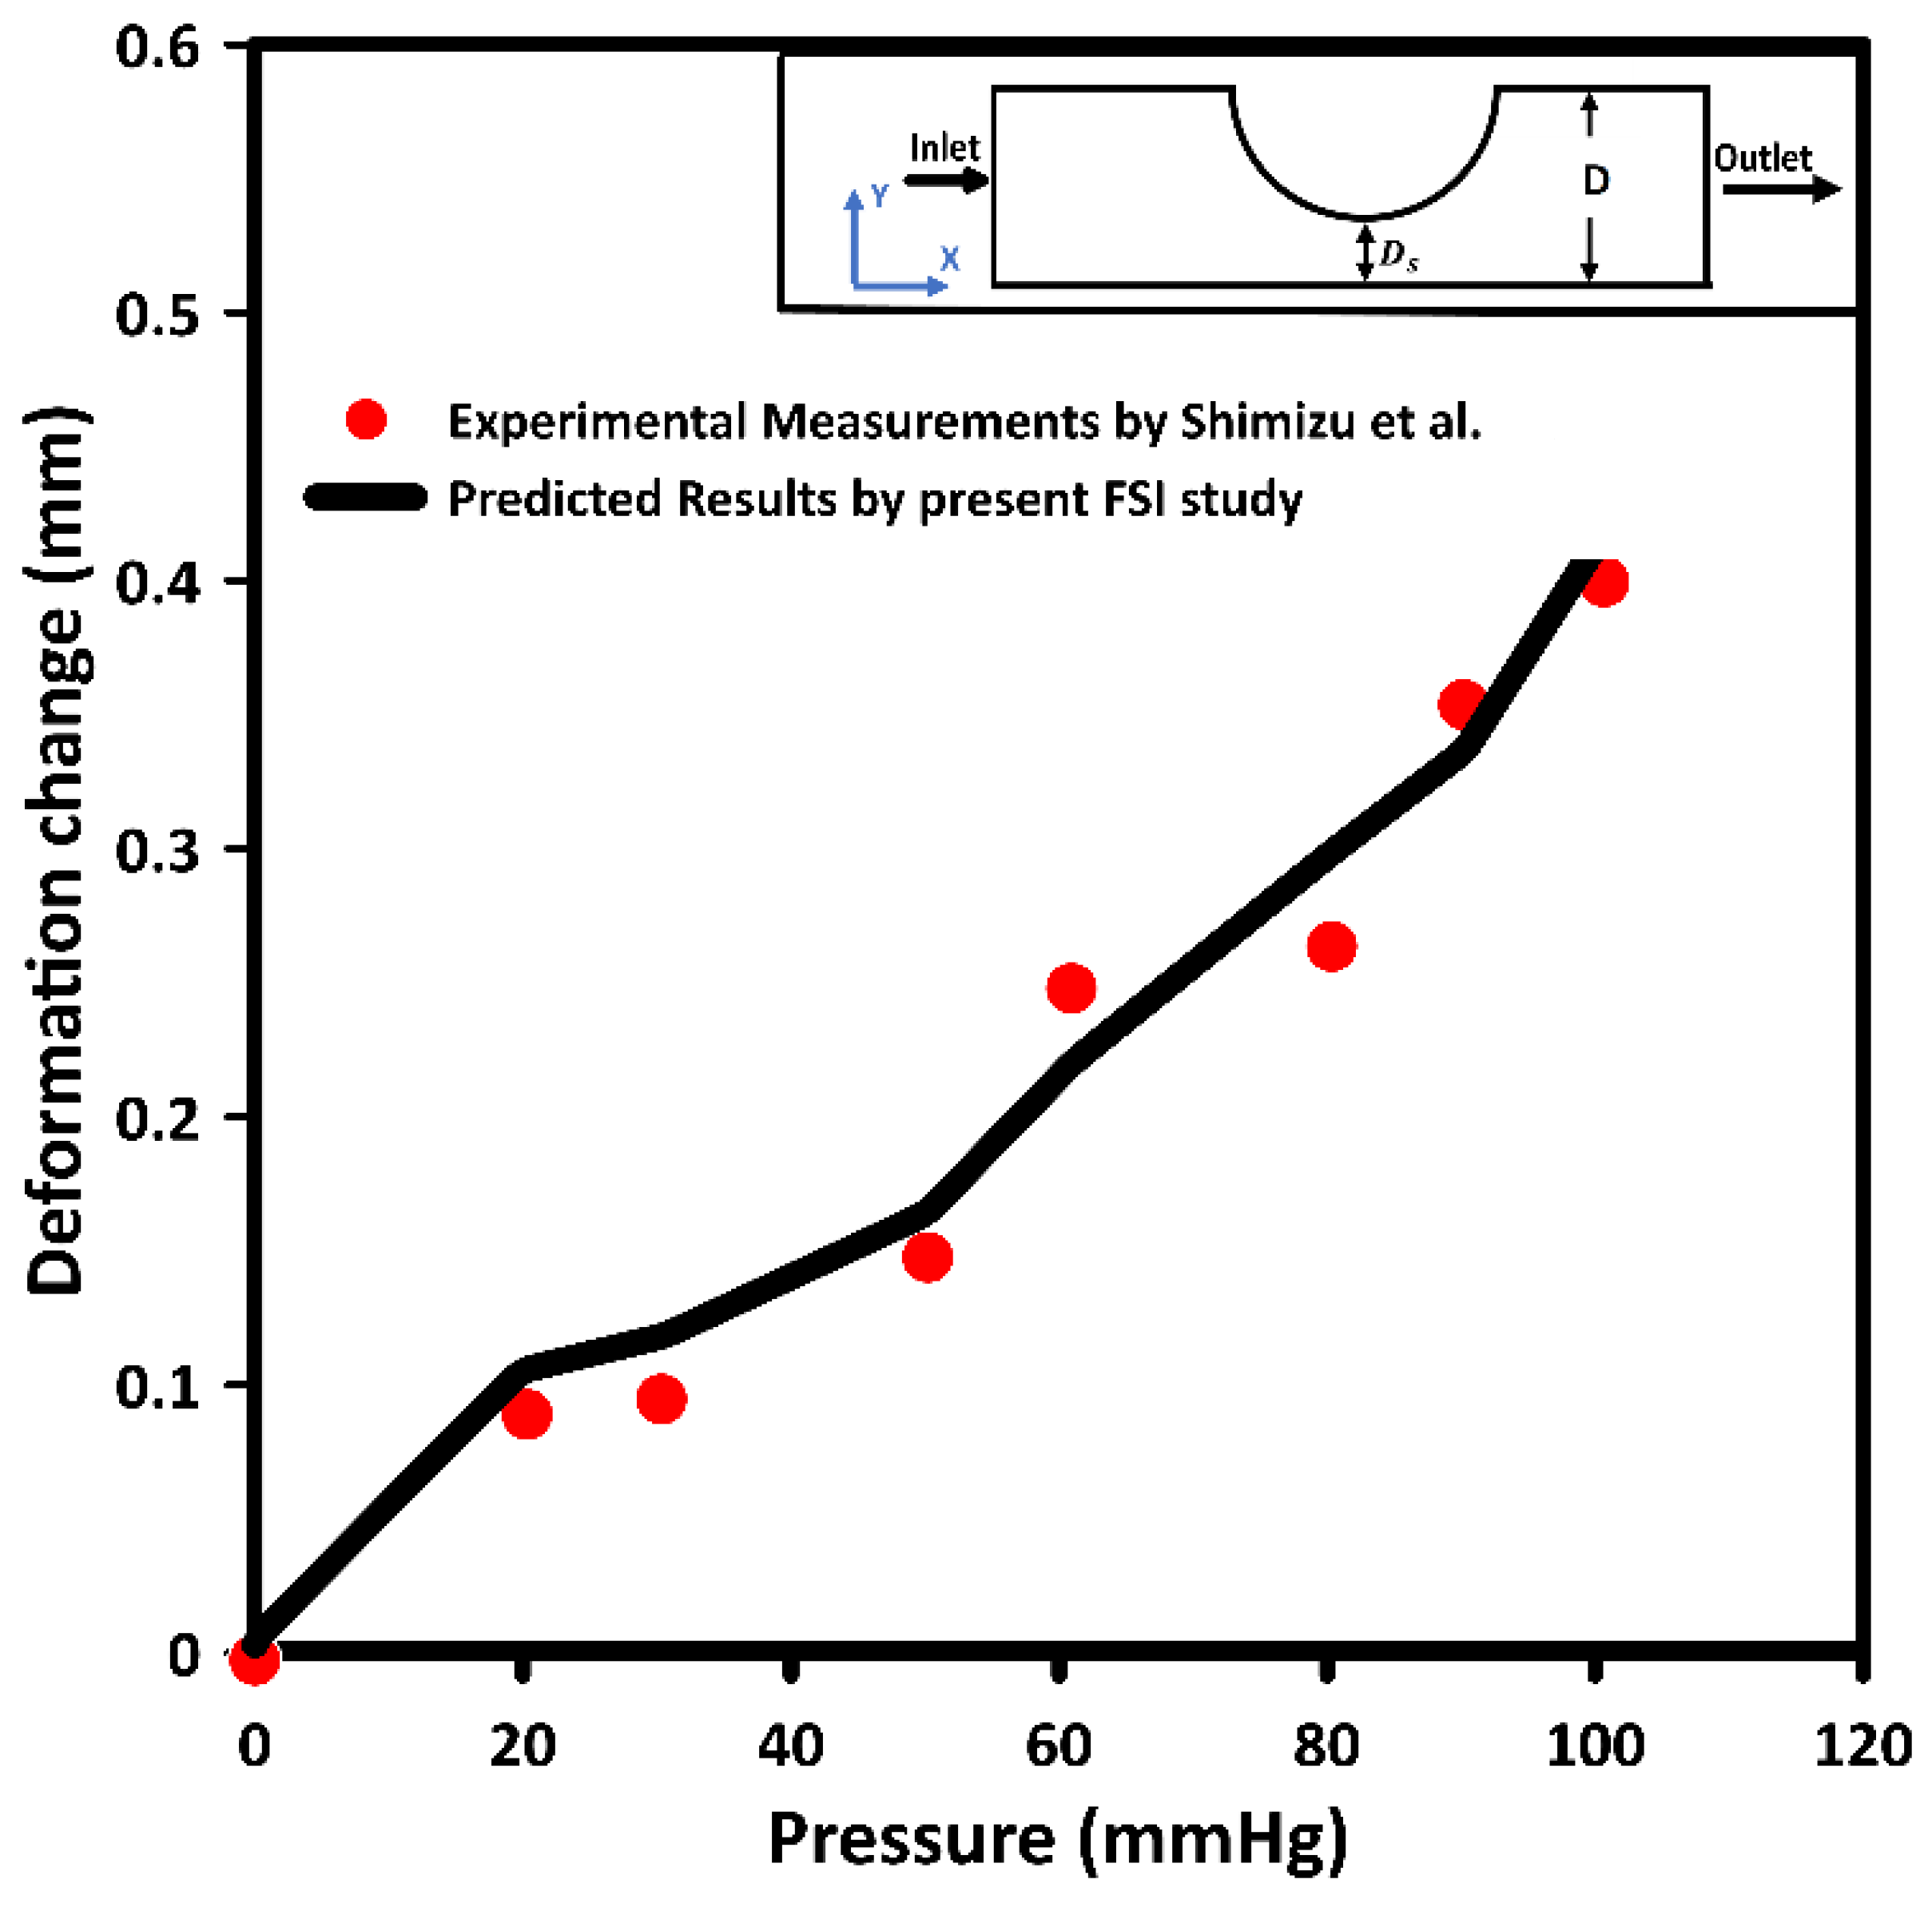
2.3.3. Model Validation
3. Results and discussion
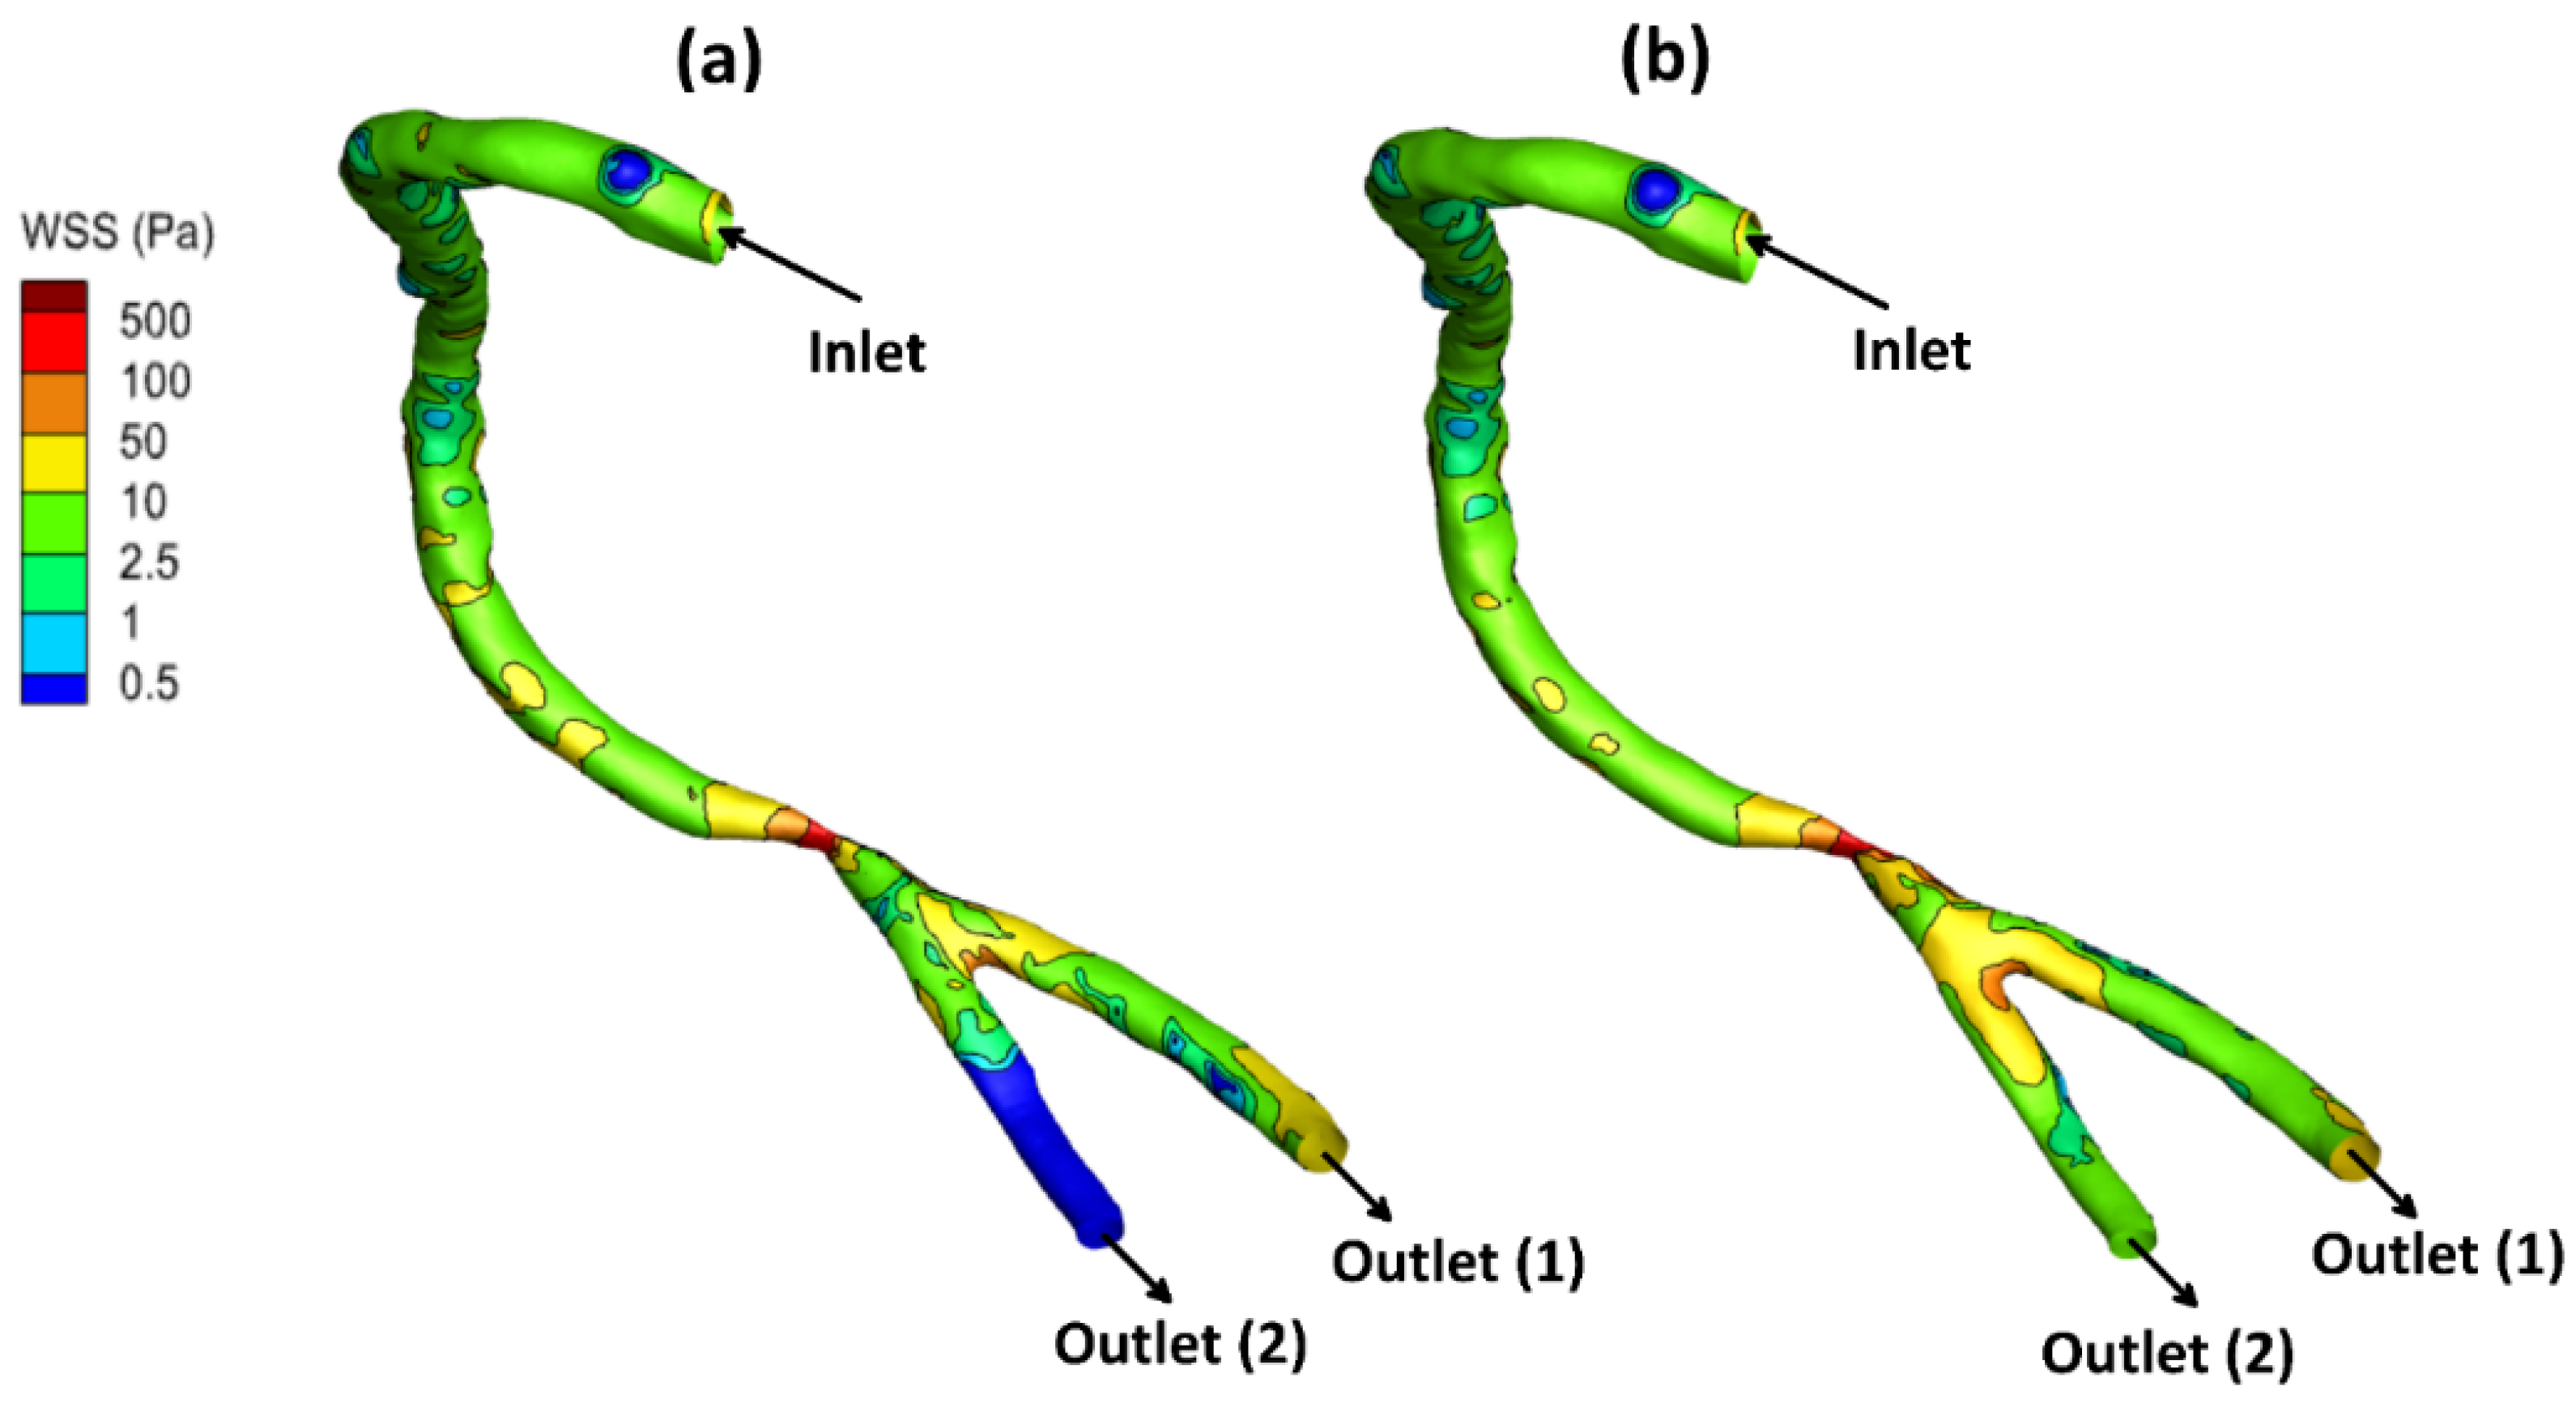
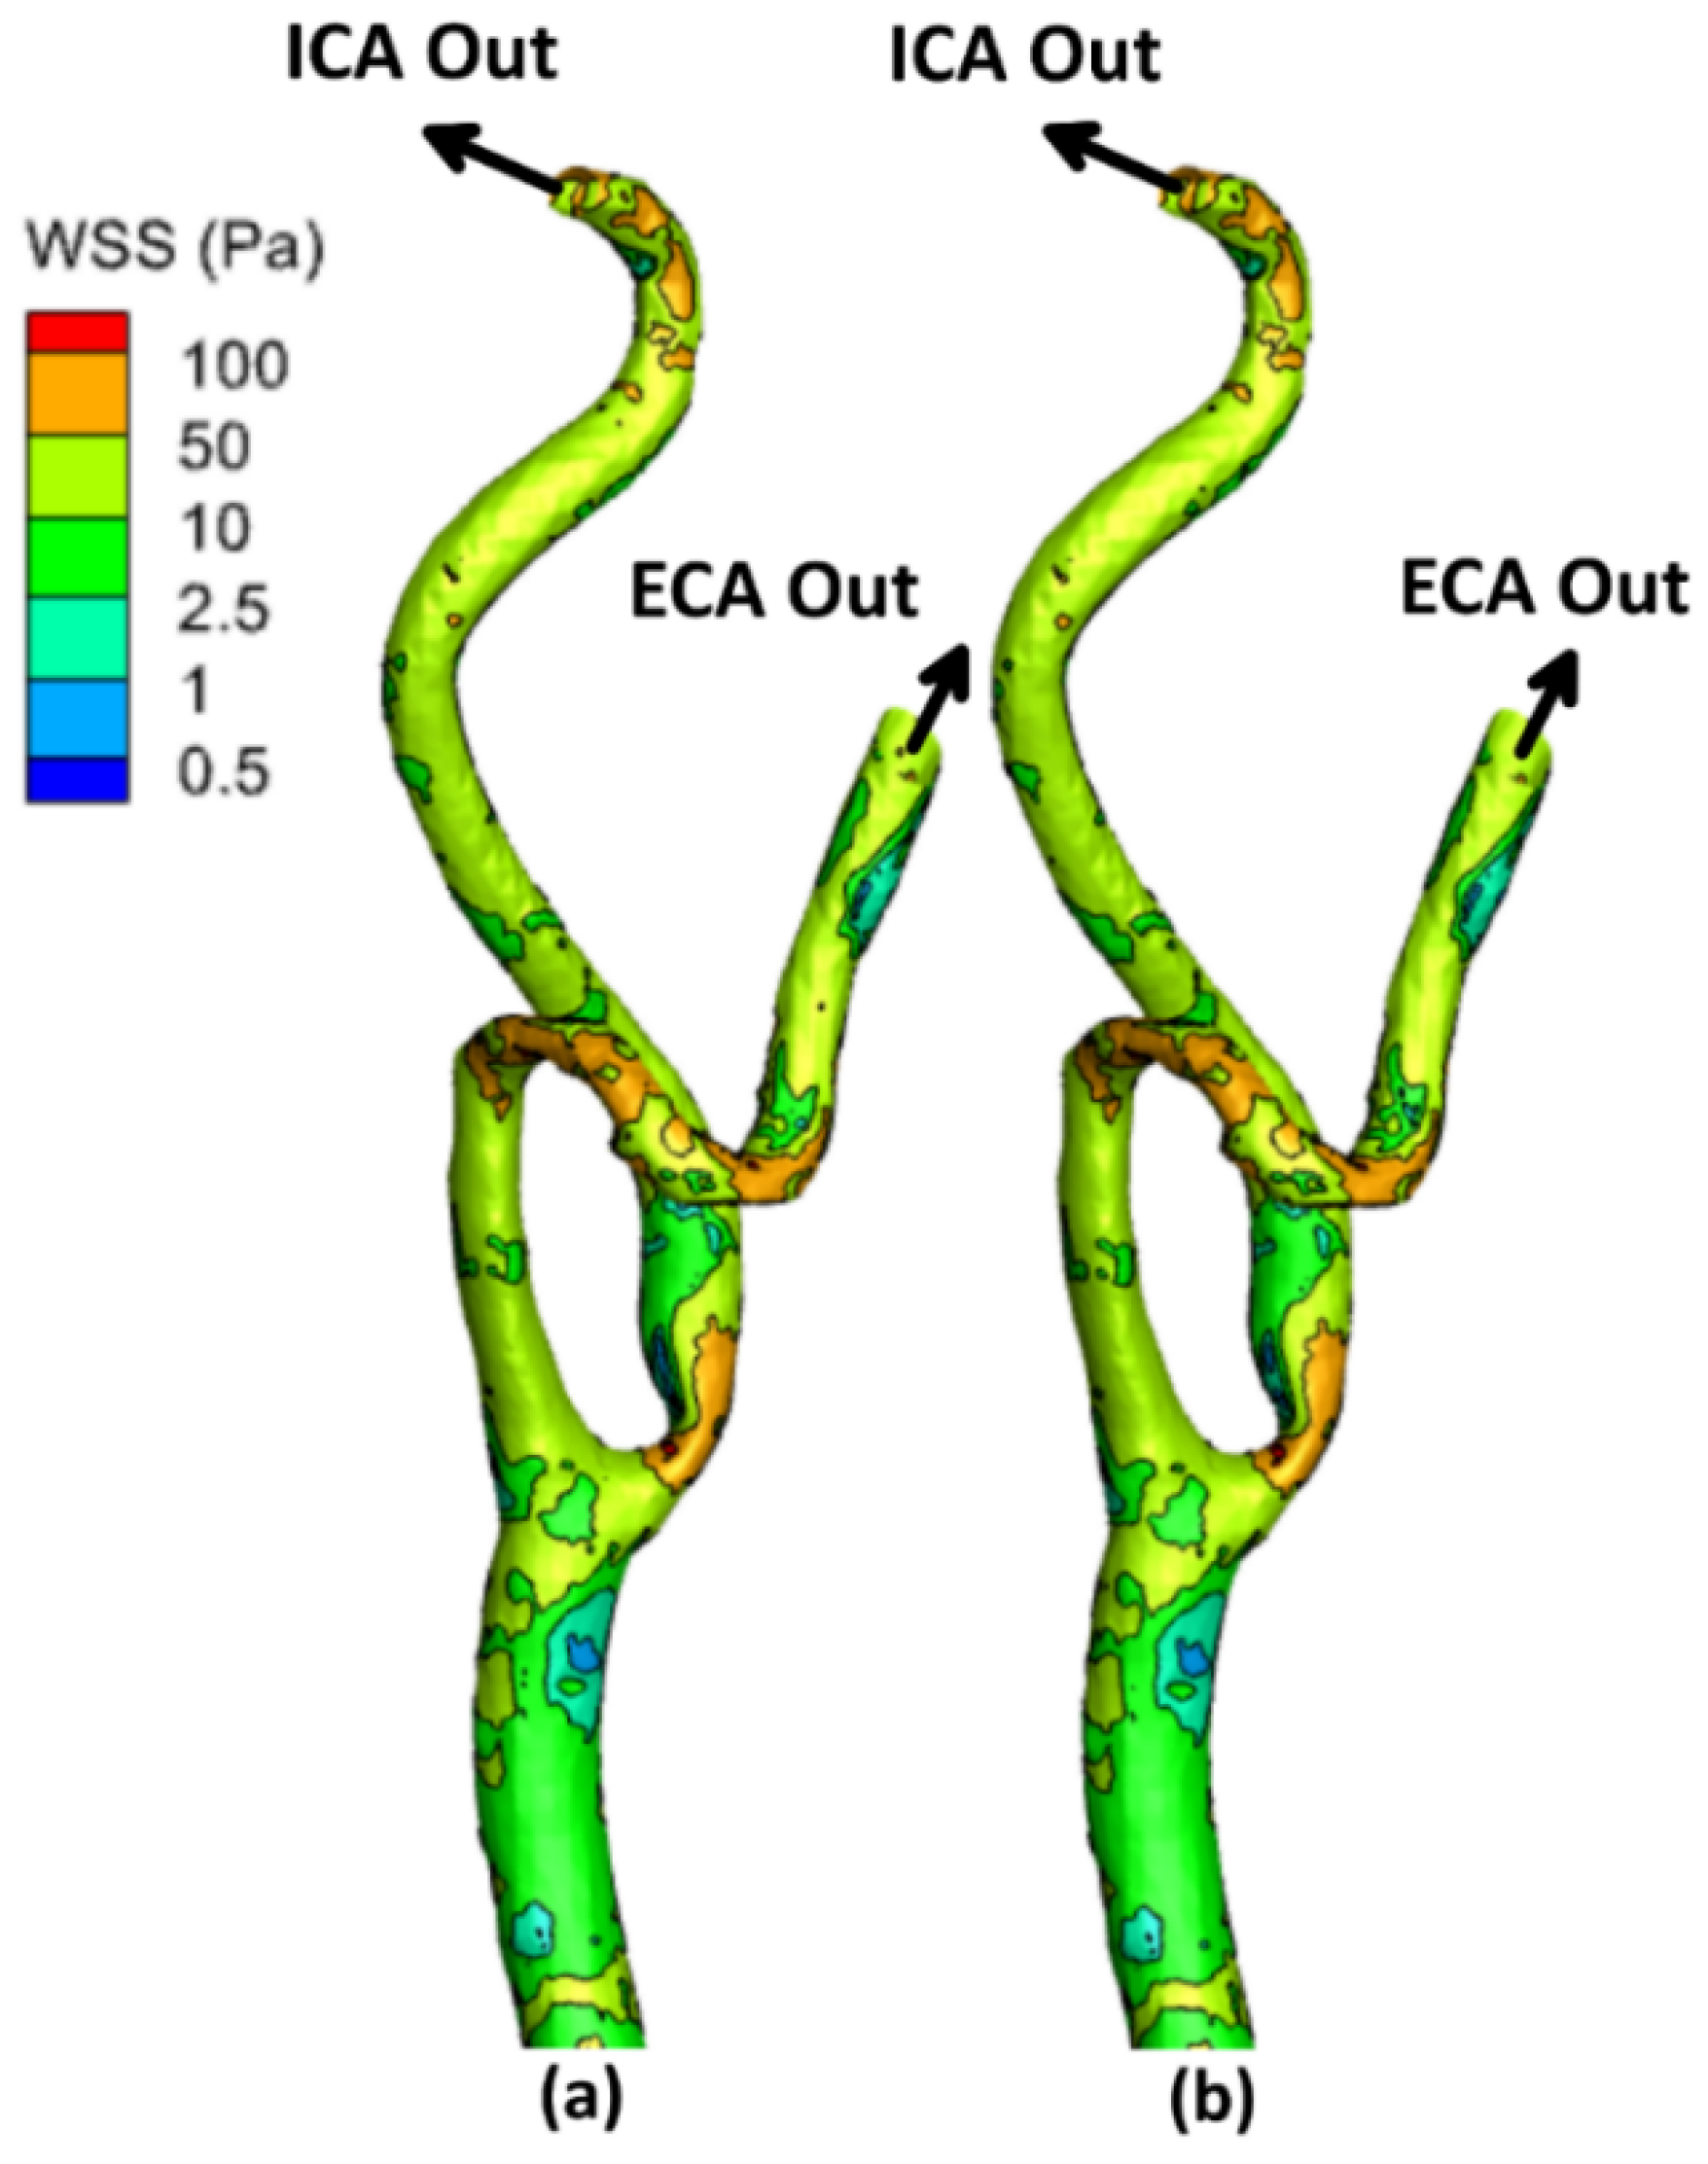
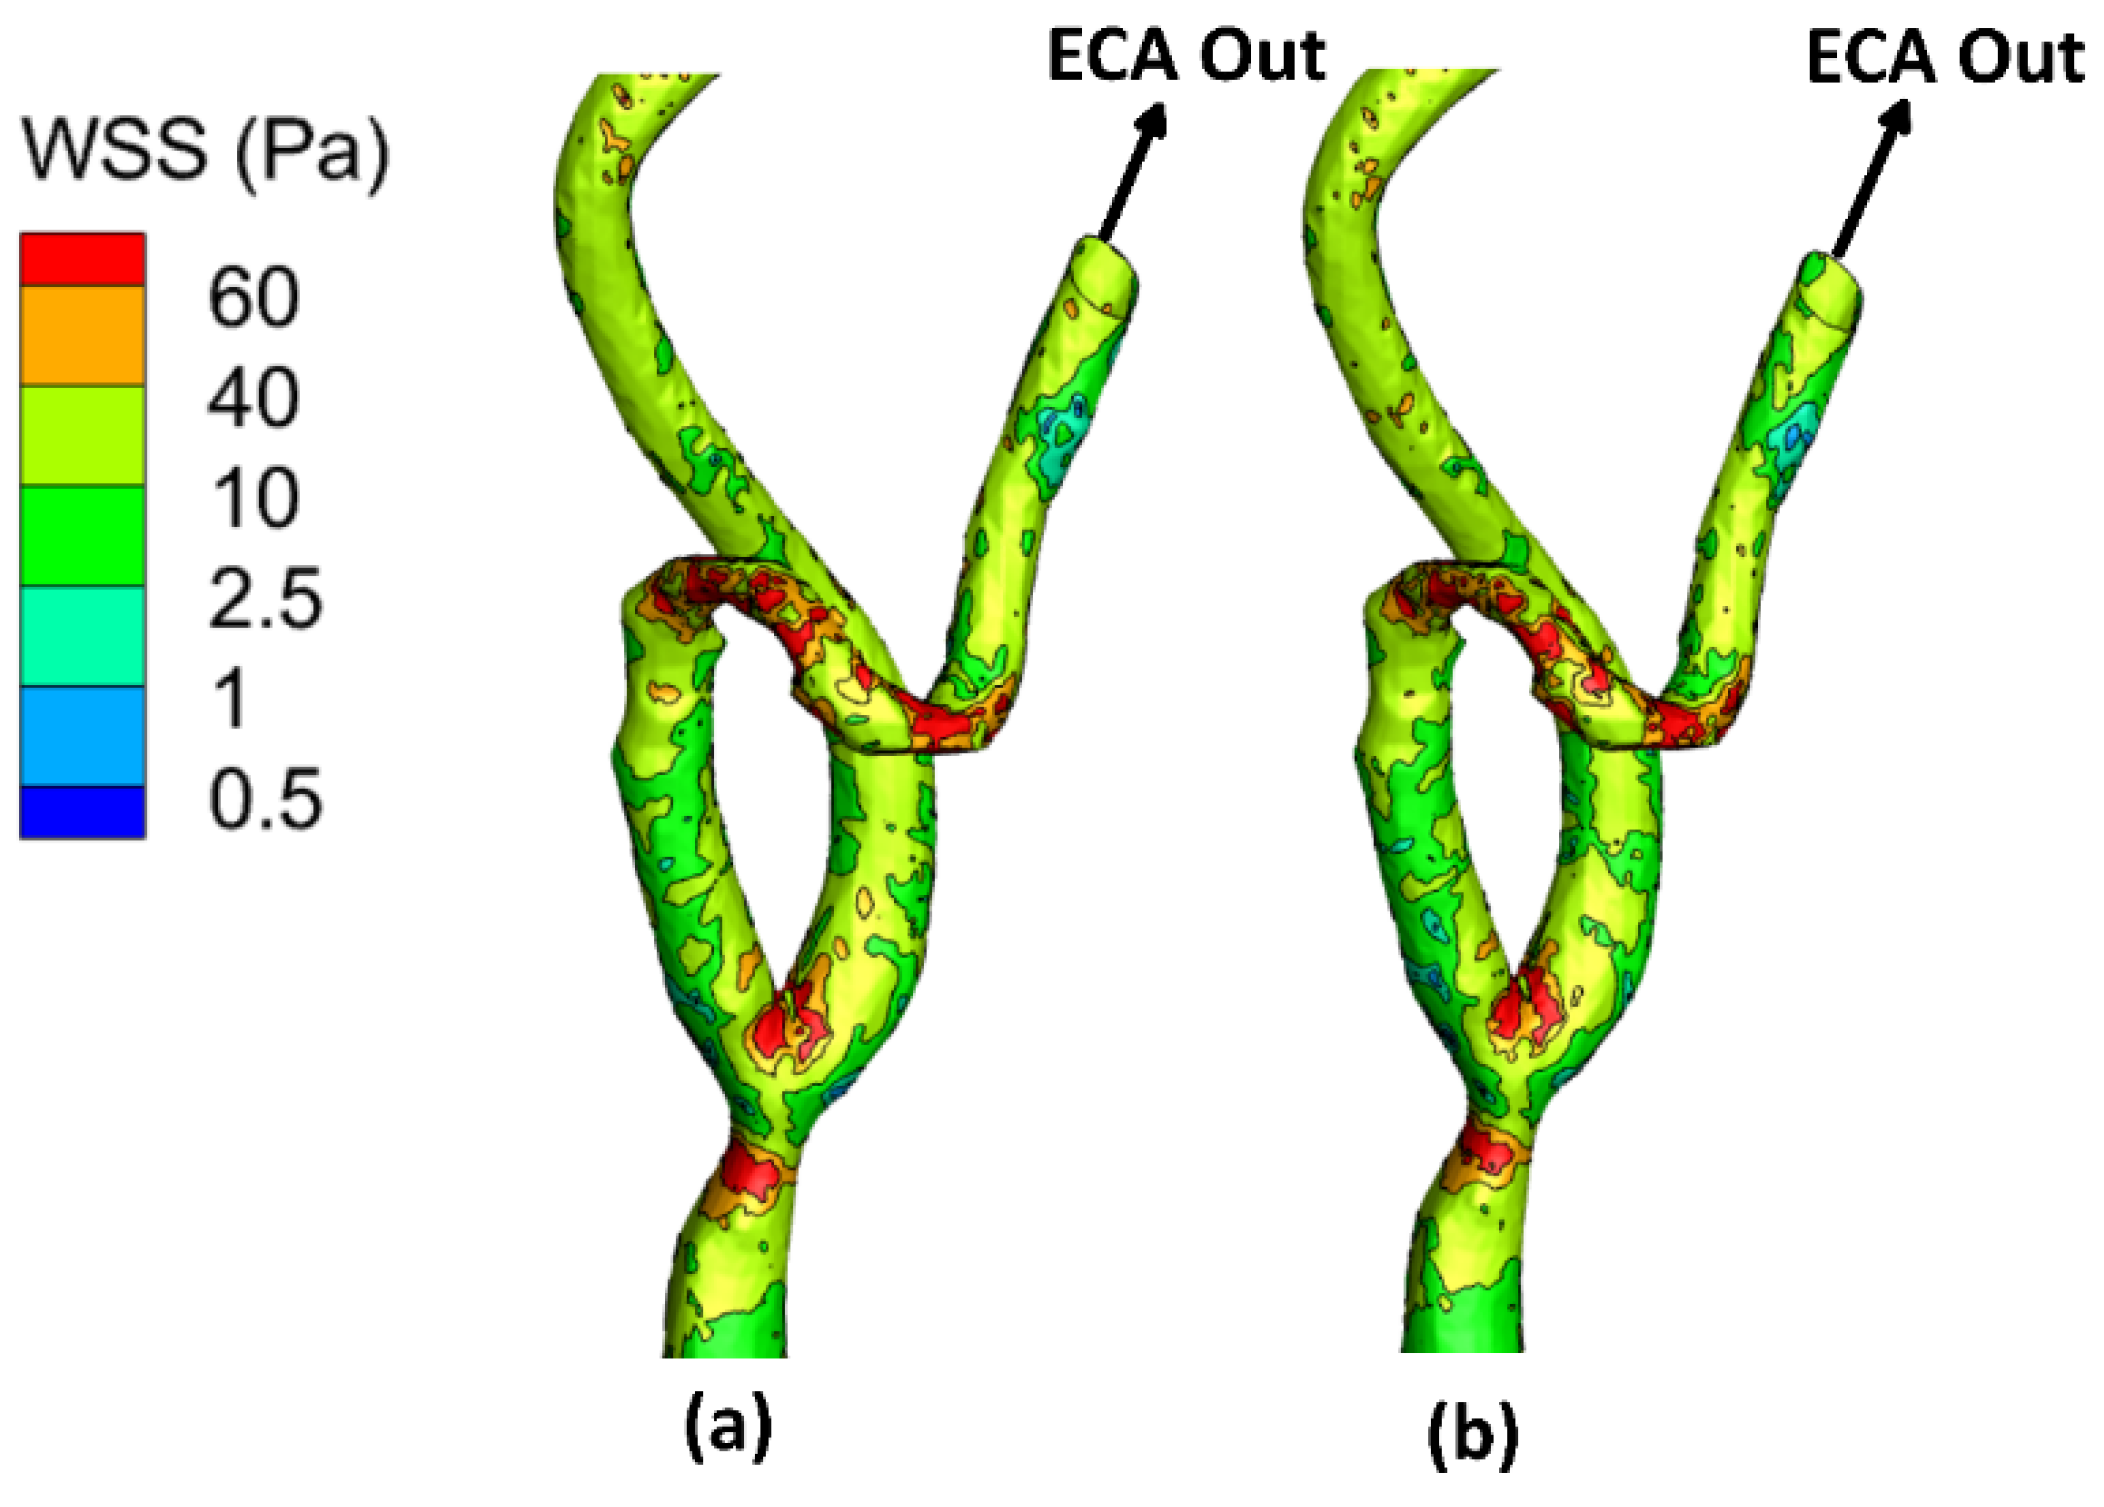
3.1. Wall Shear Stress (WSS)
3.2. Time-Averaged Wall Shear Stress (TAWSS)
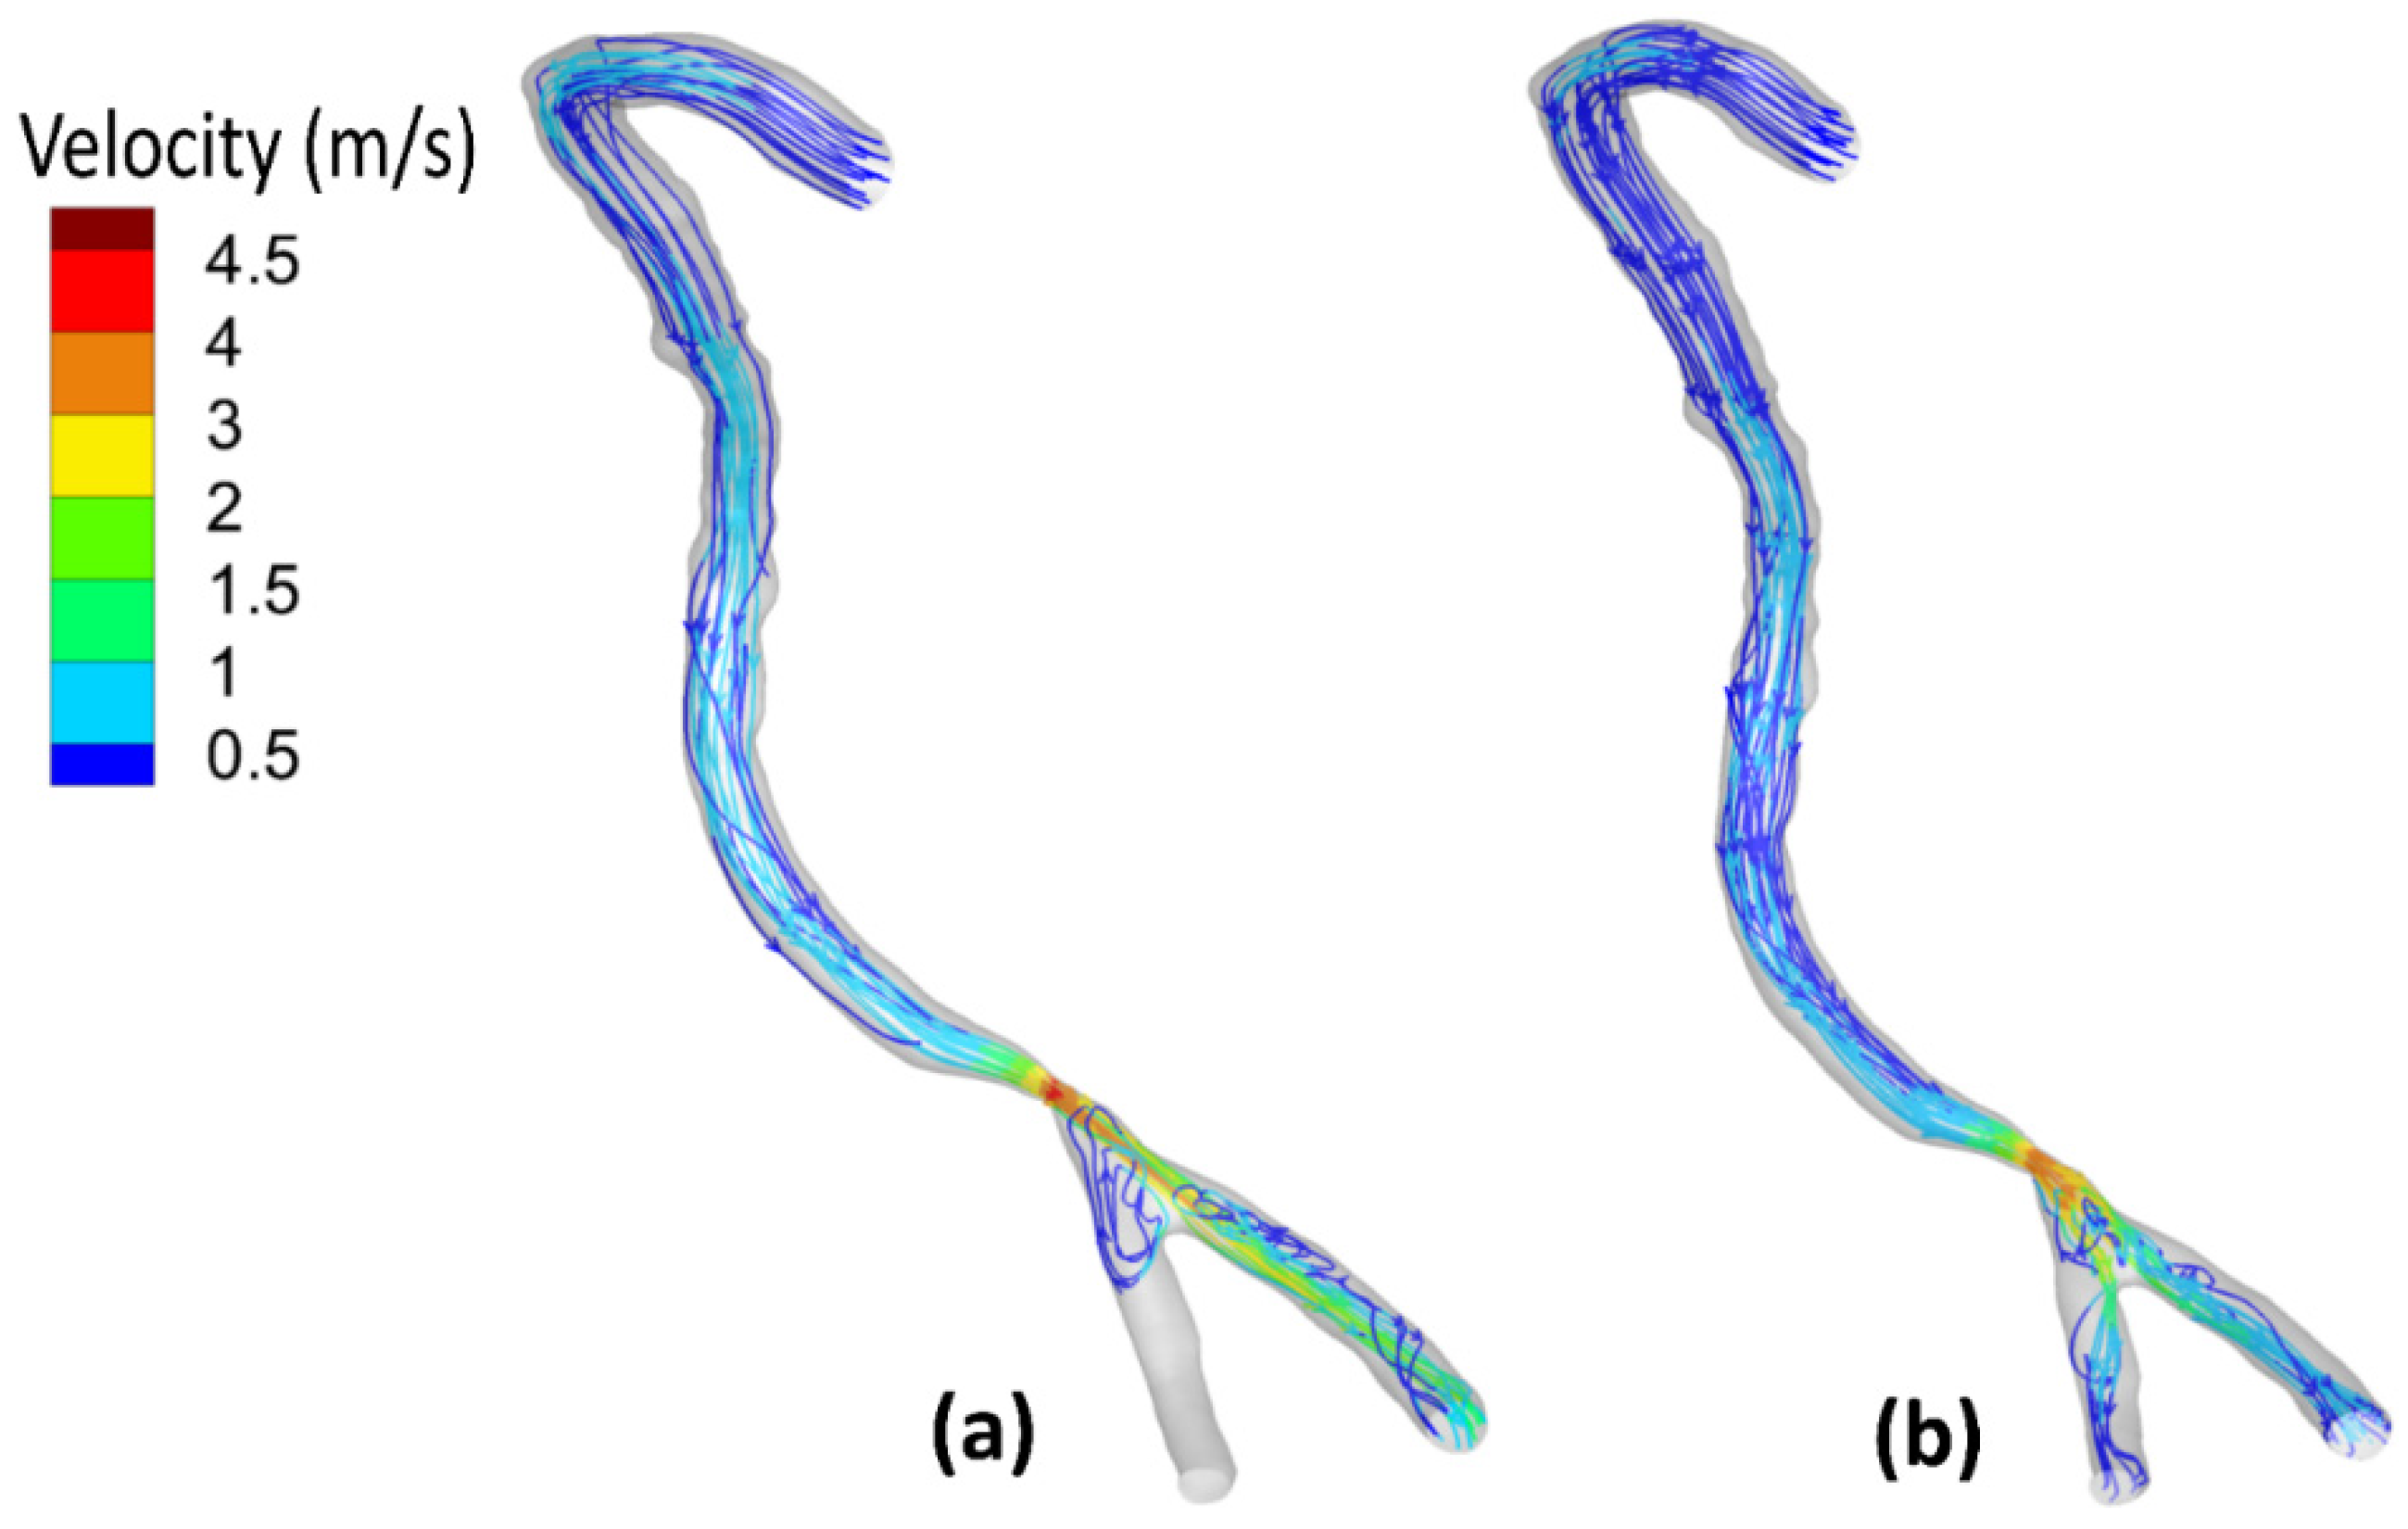
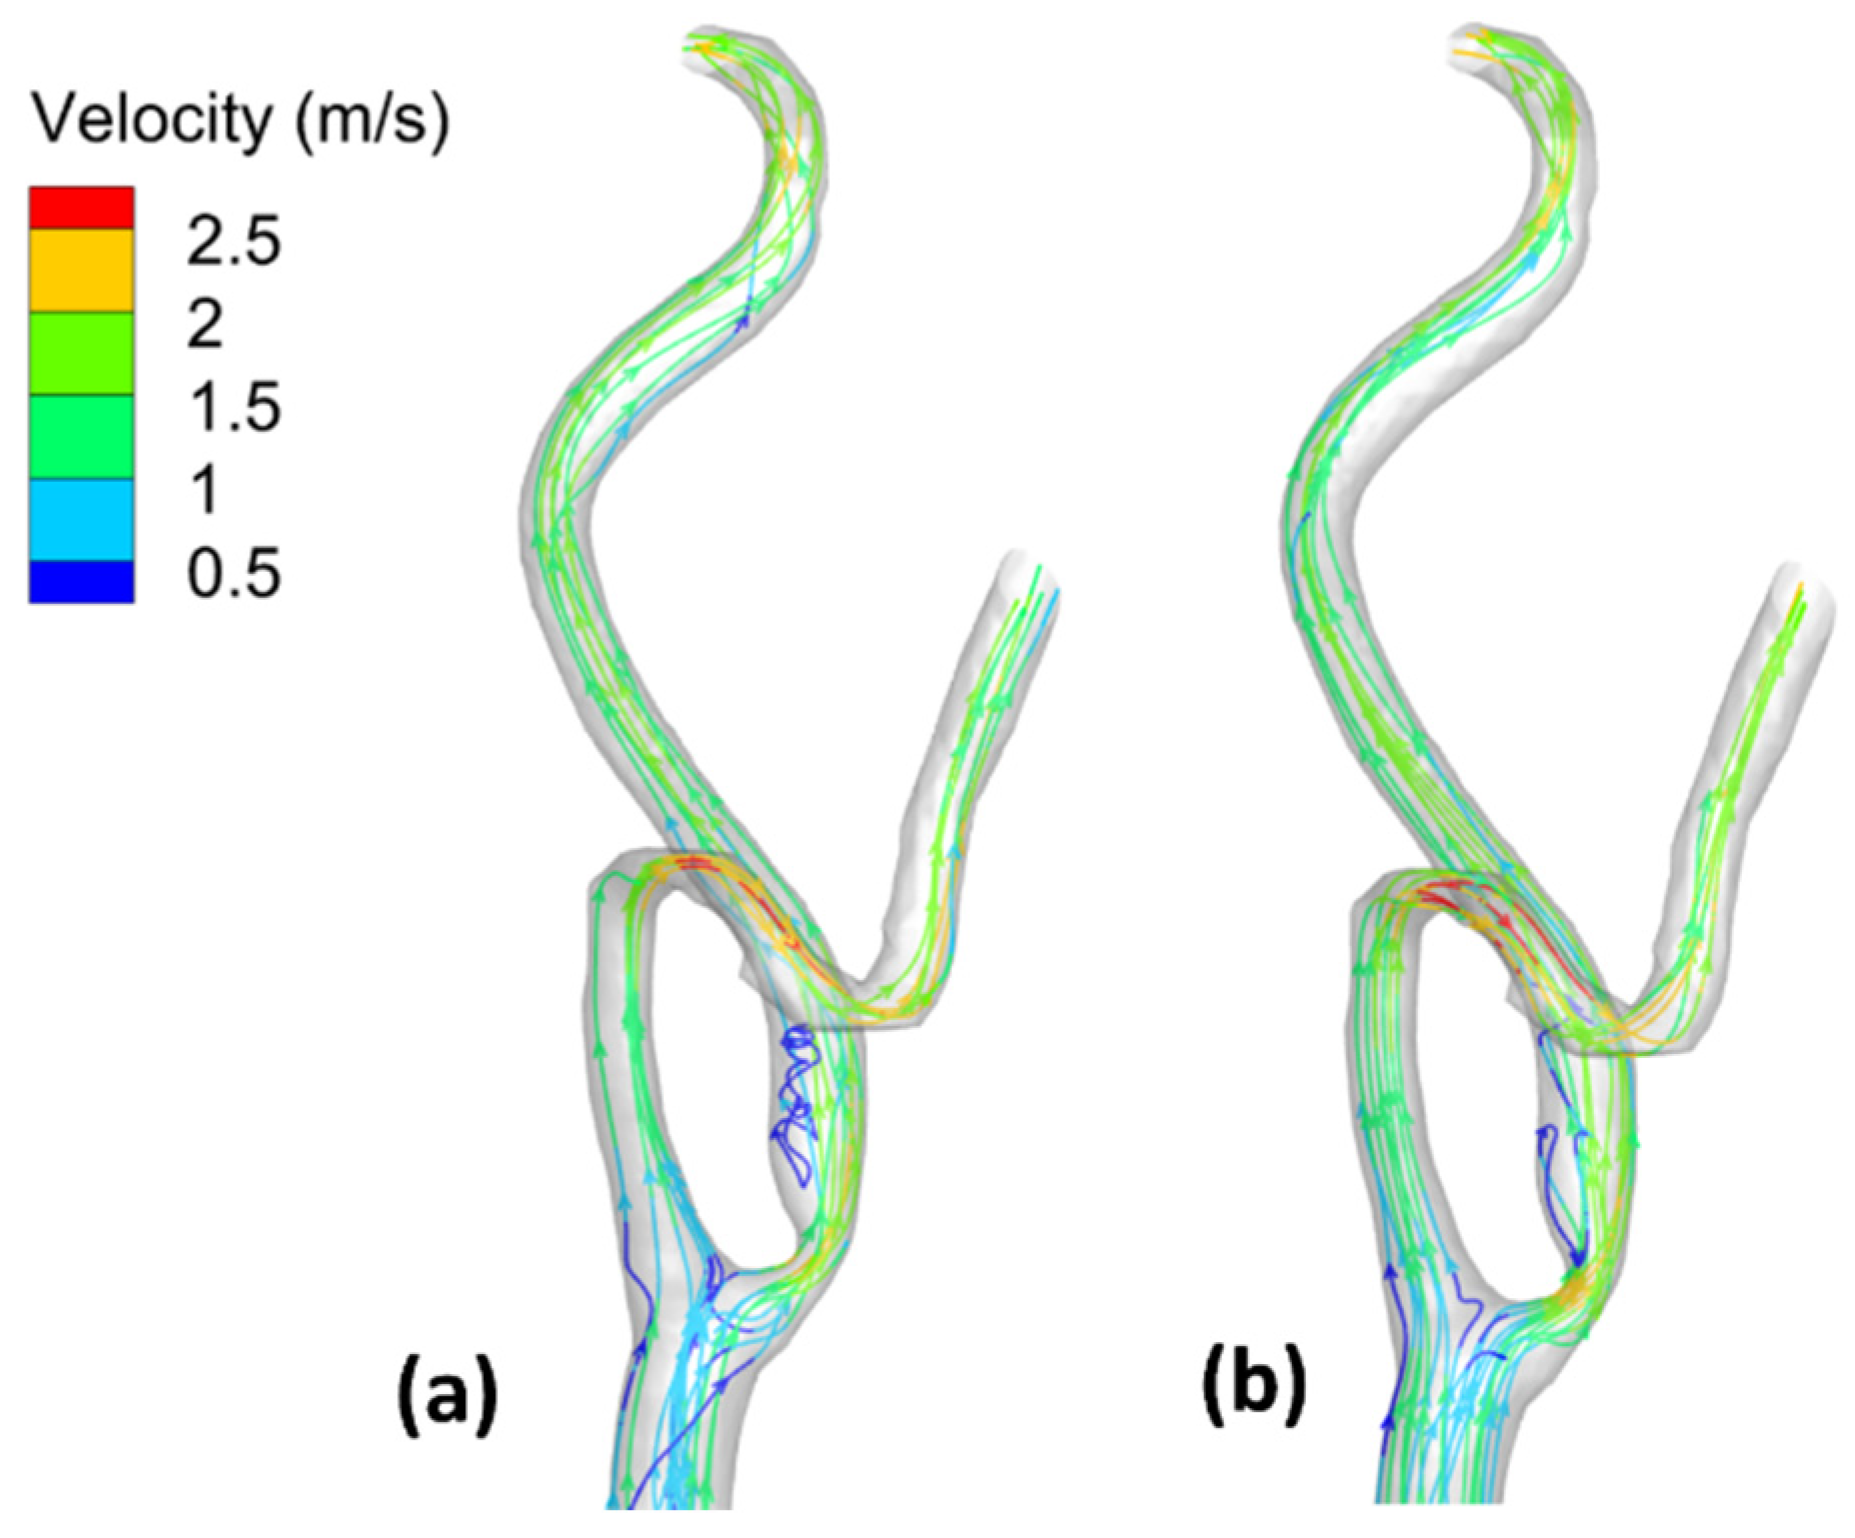
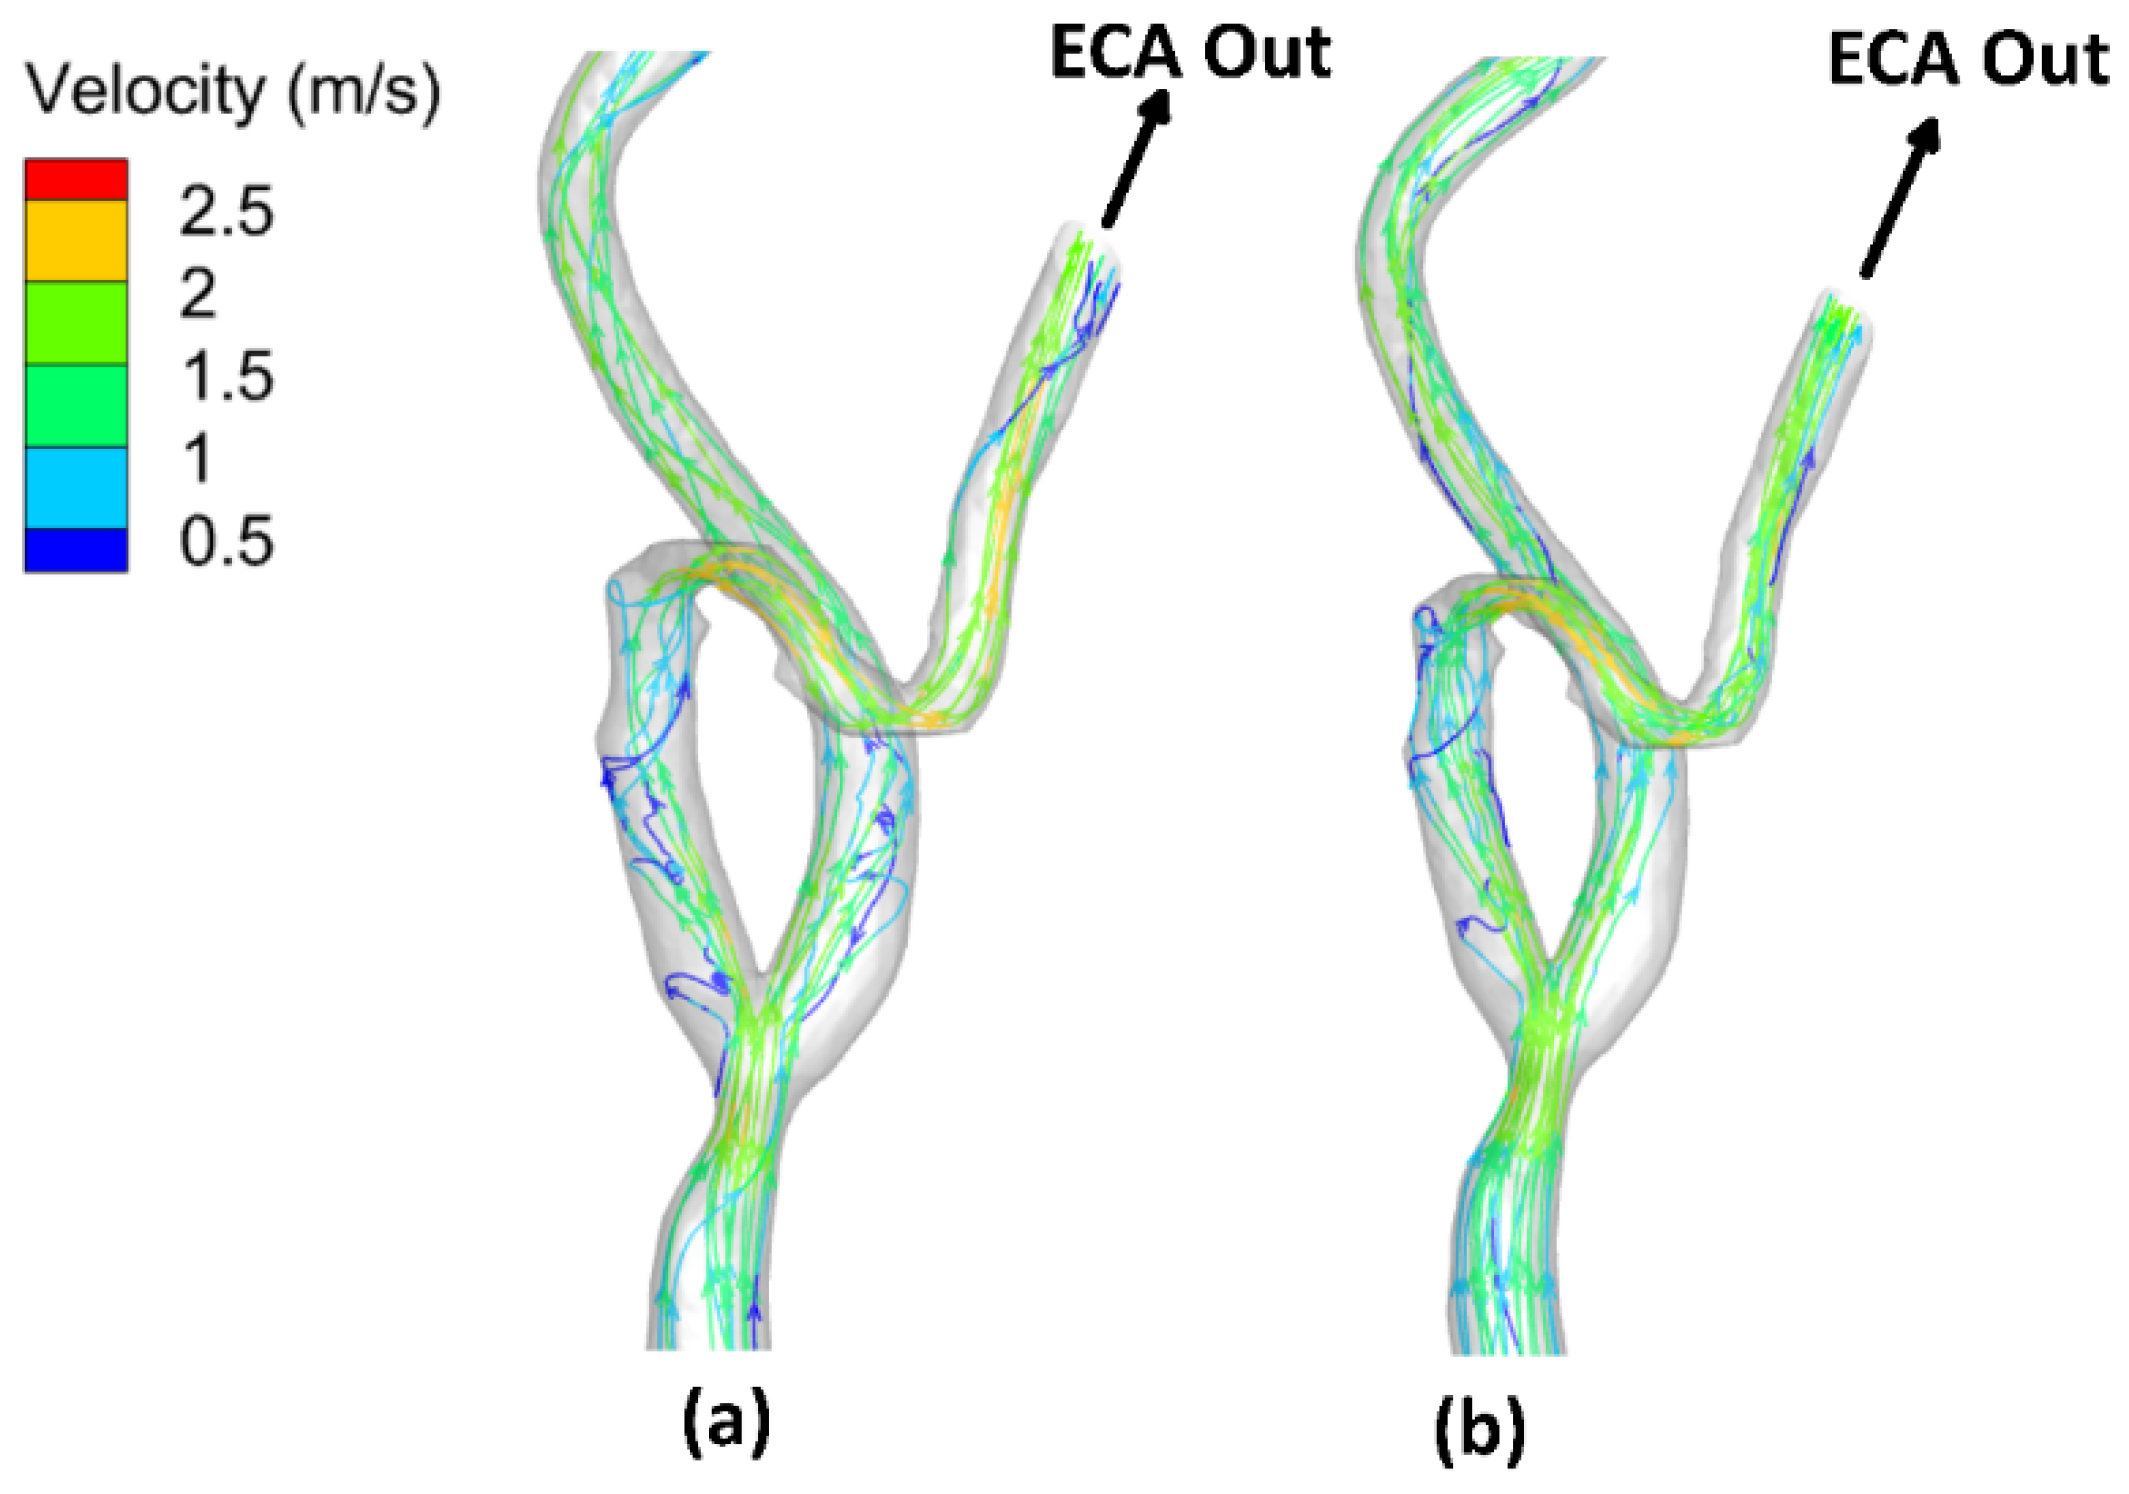
3.3. Velocity Field and Streamlines
3.4. Mass Flow Rate Distribution
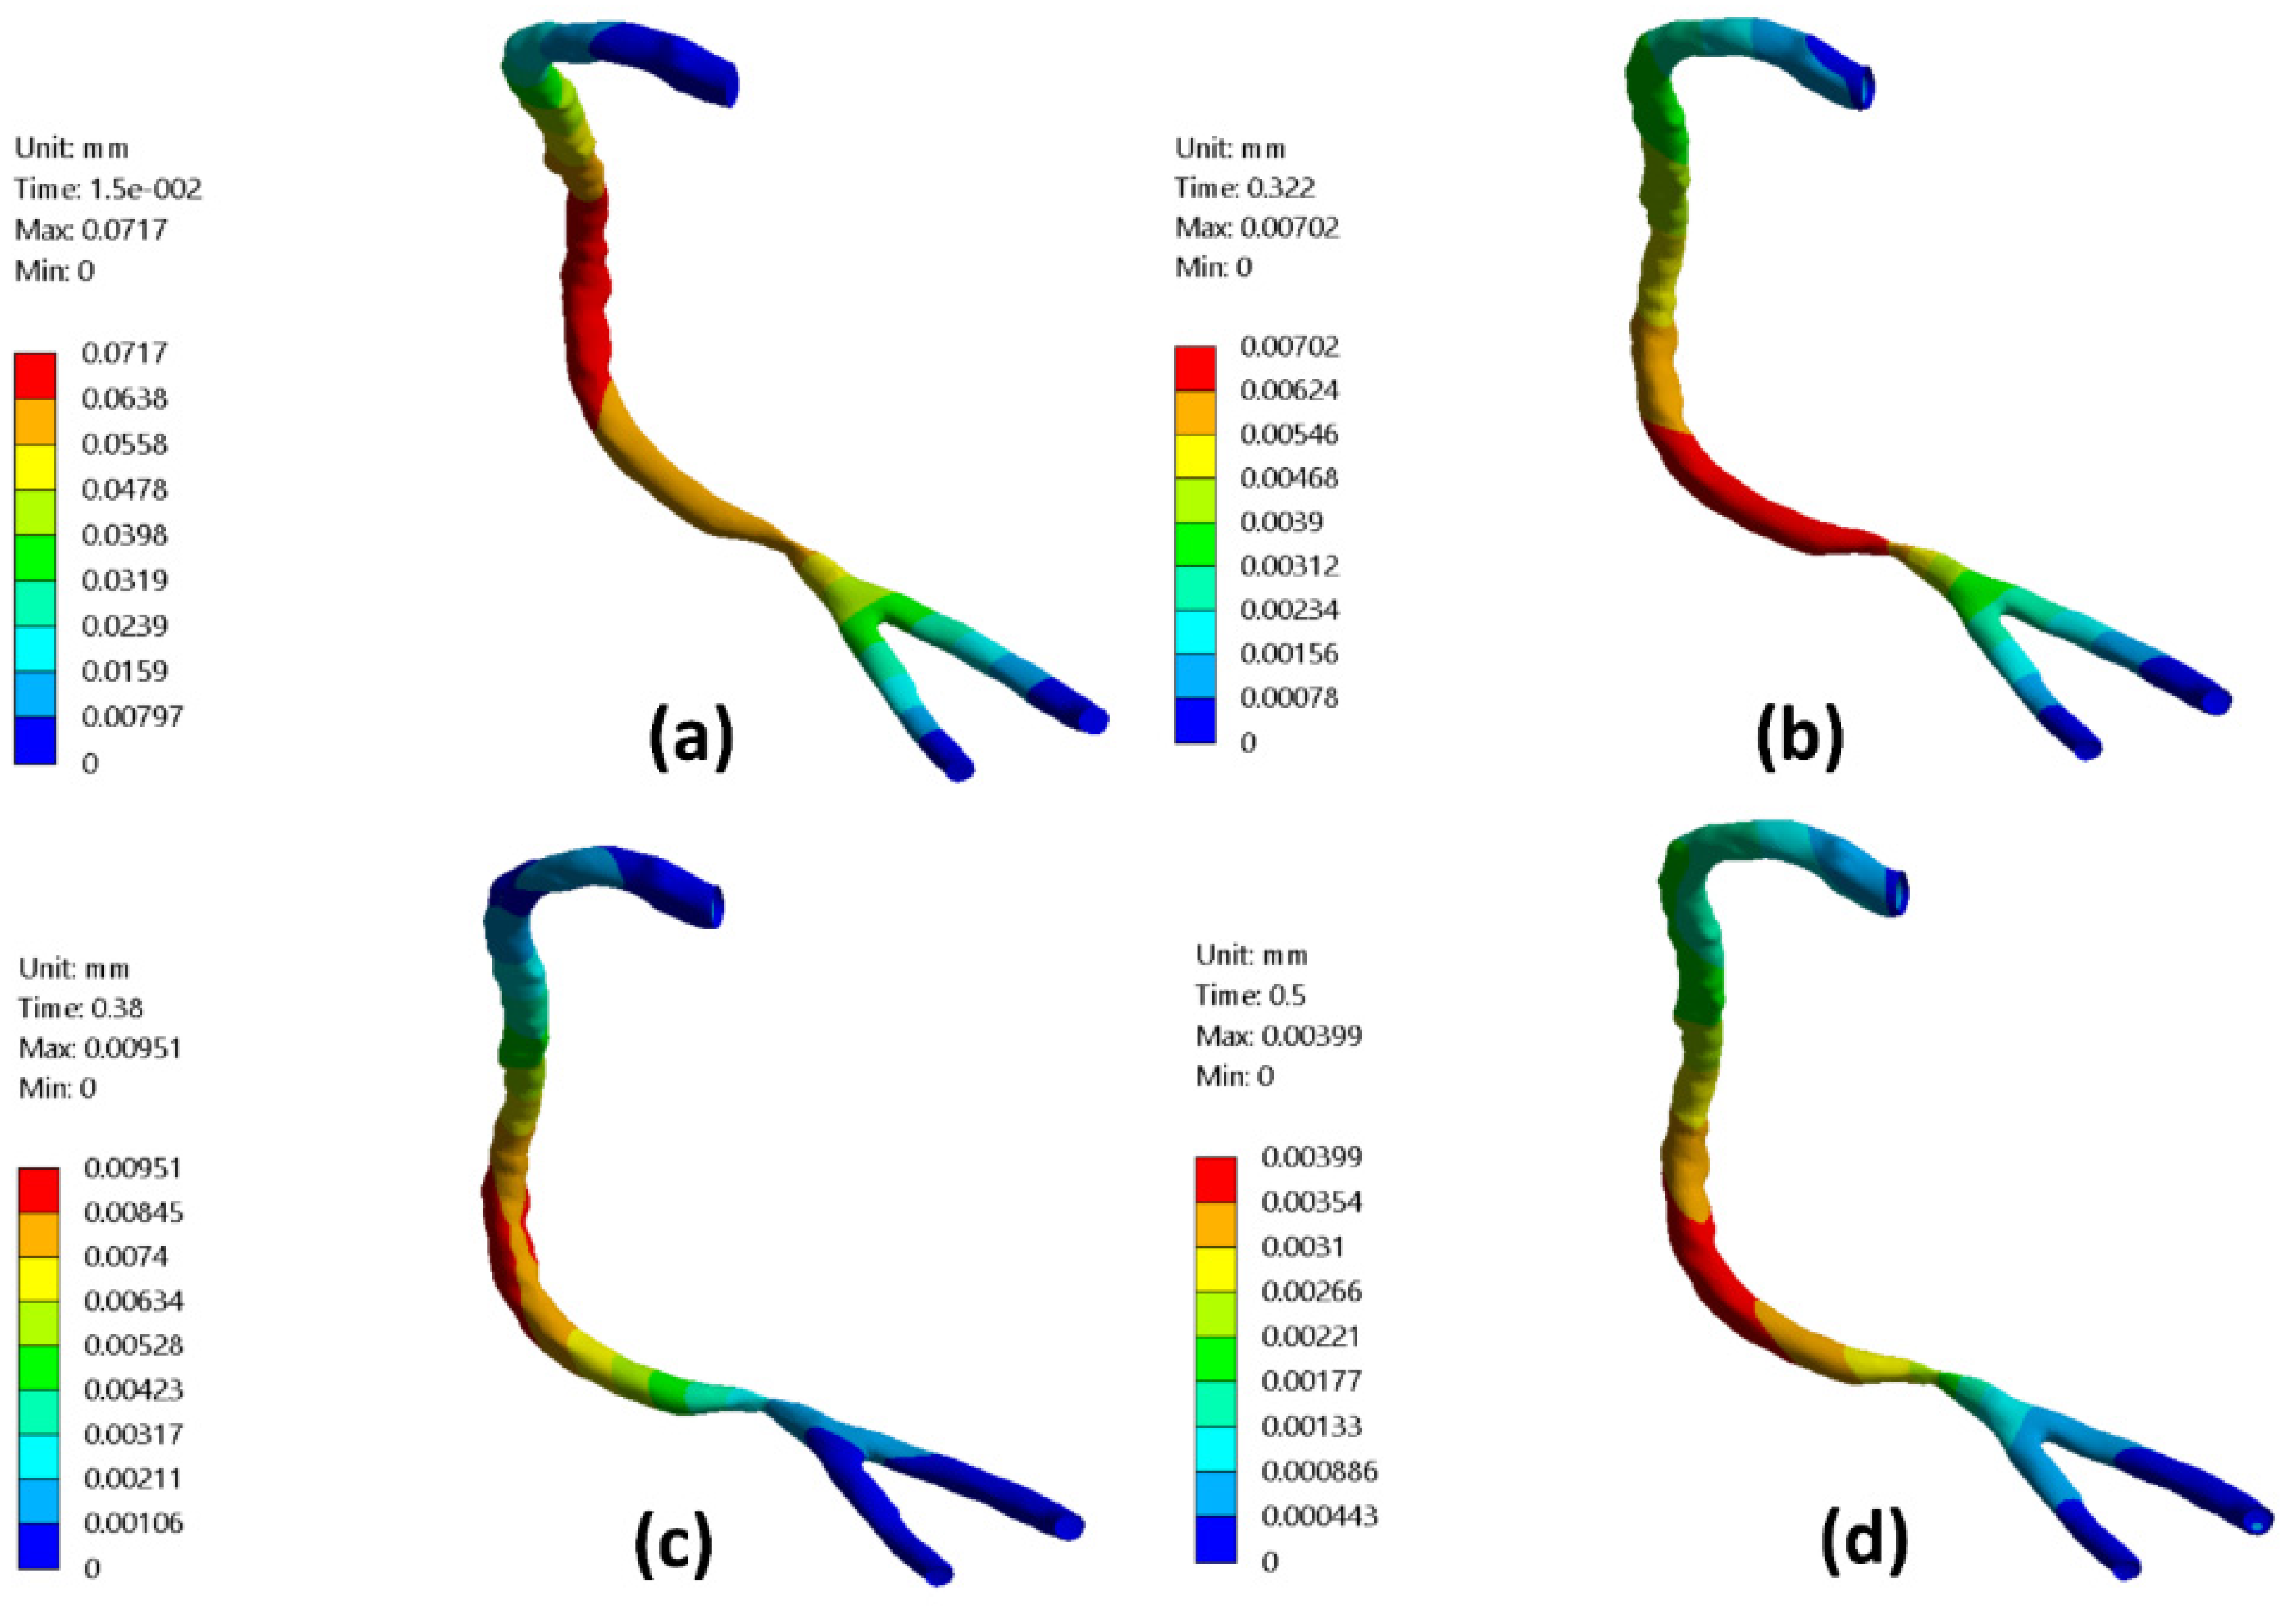
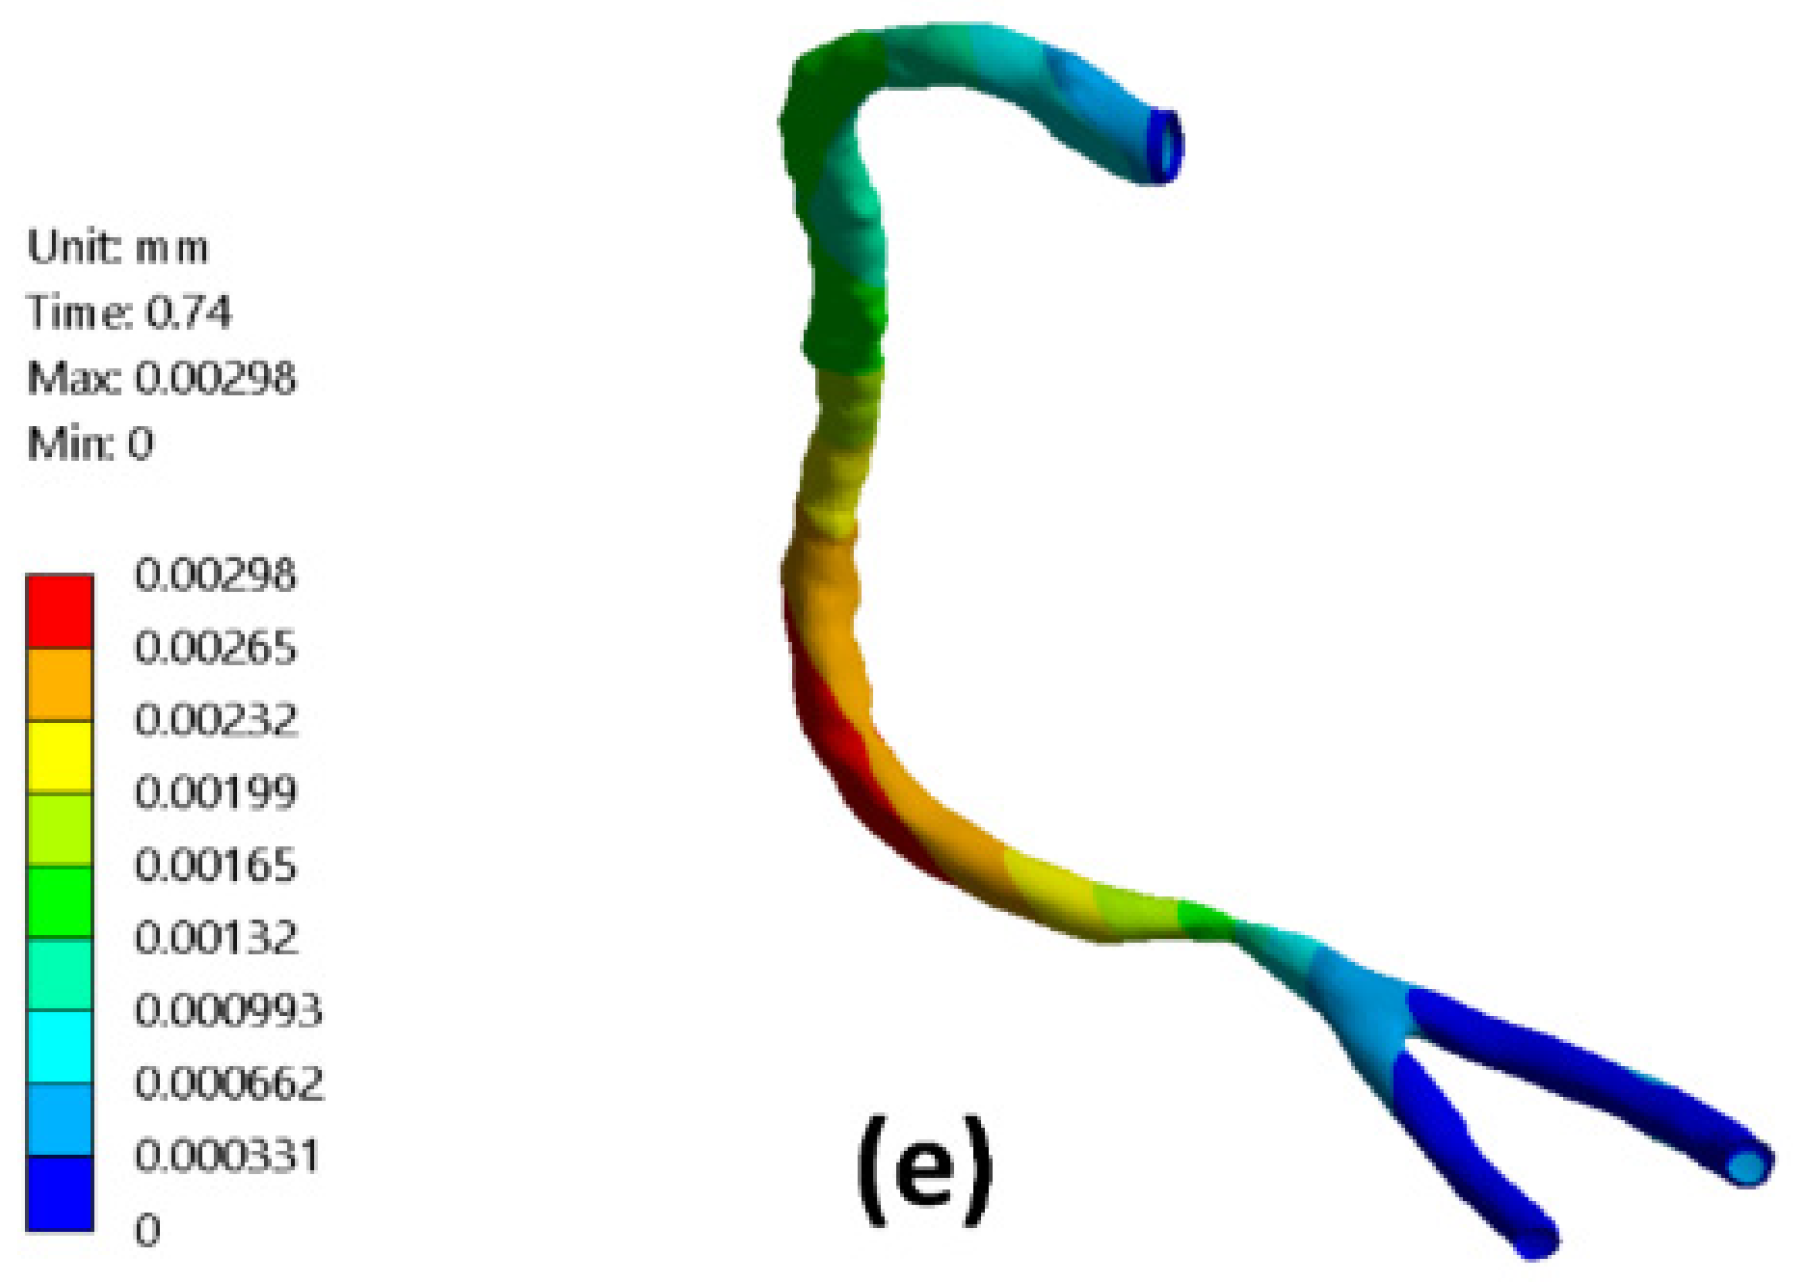
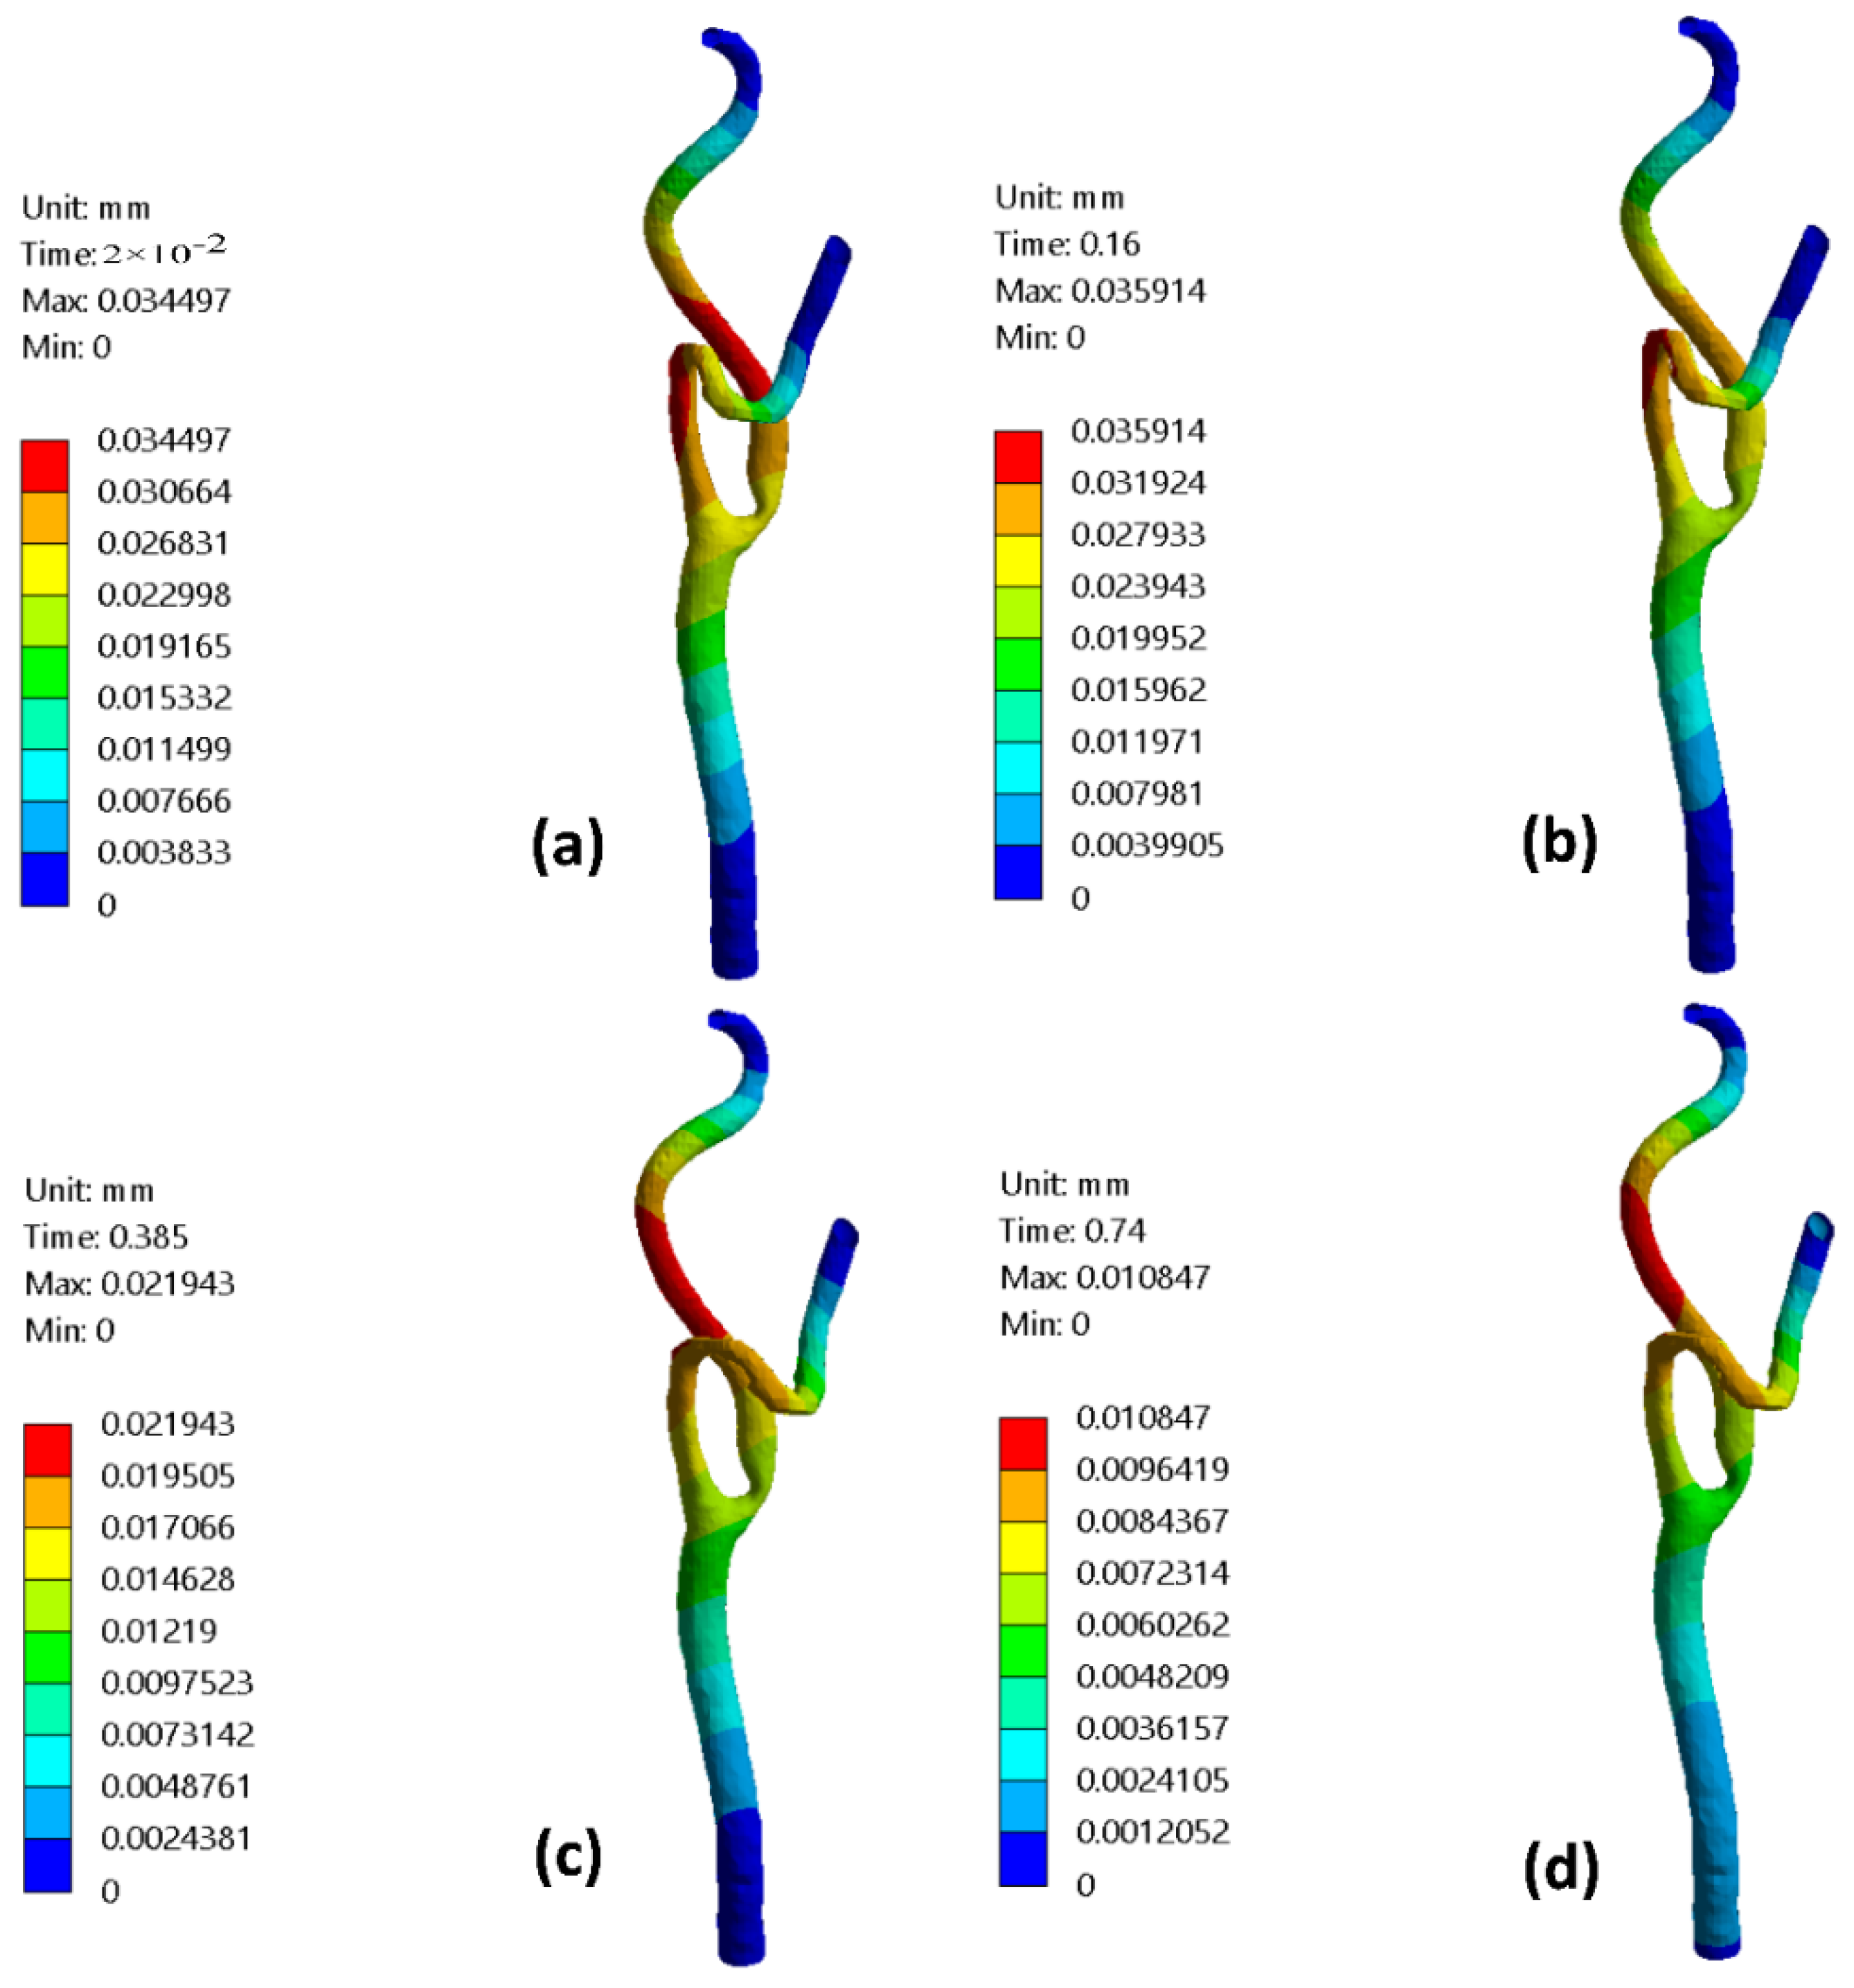
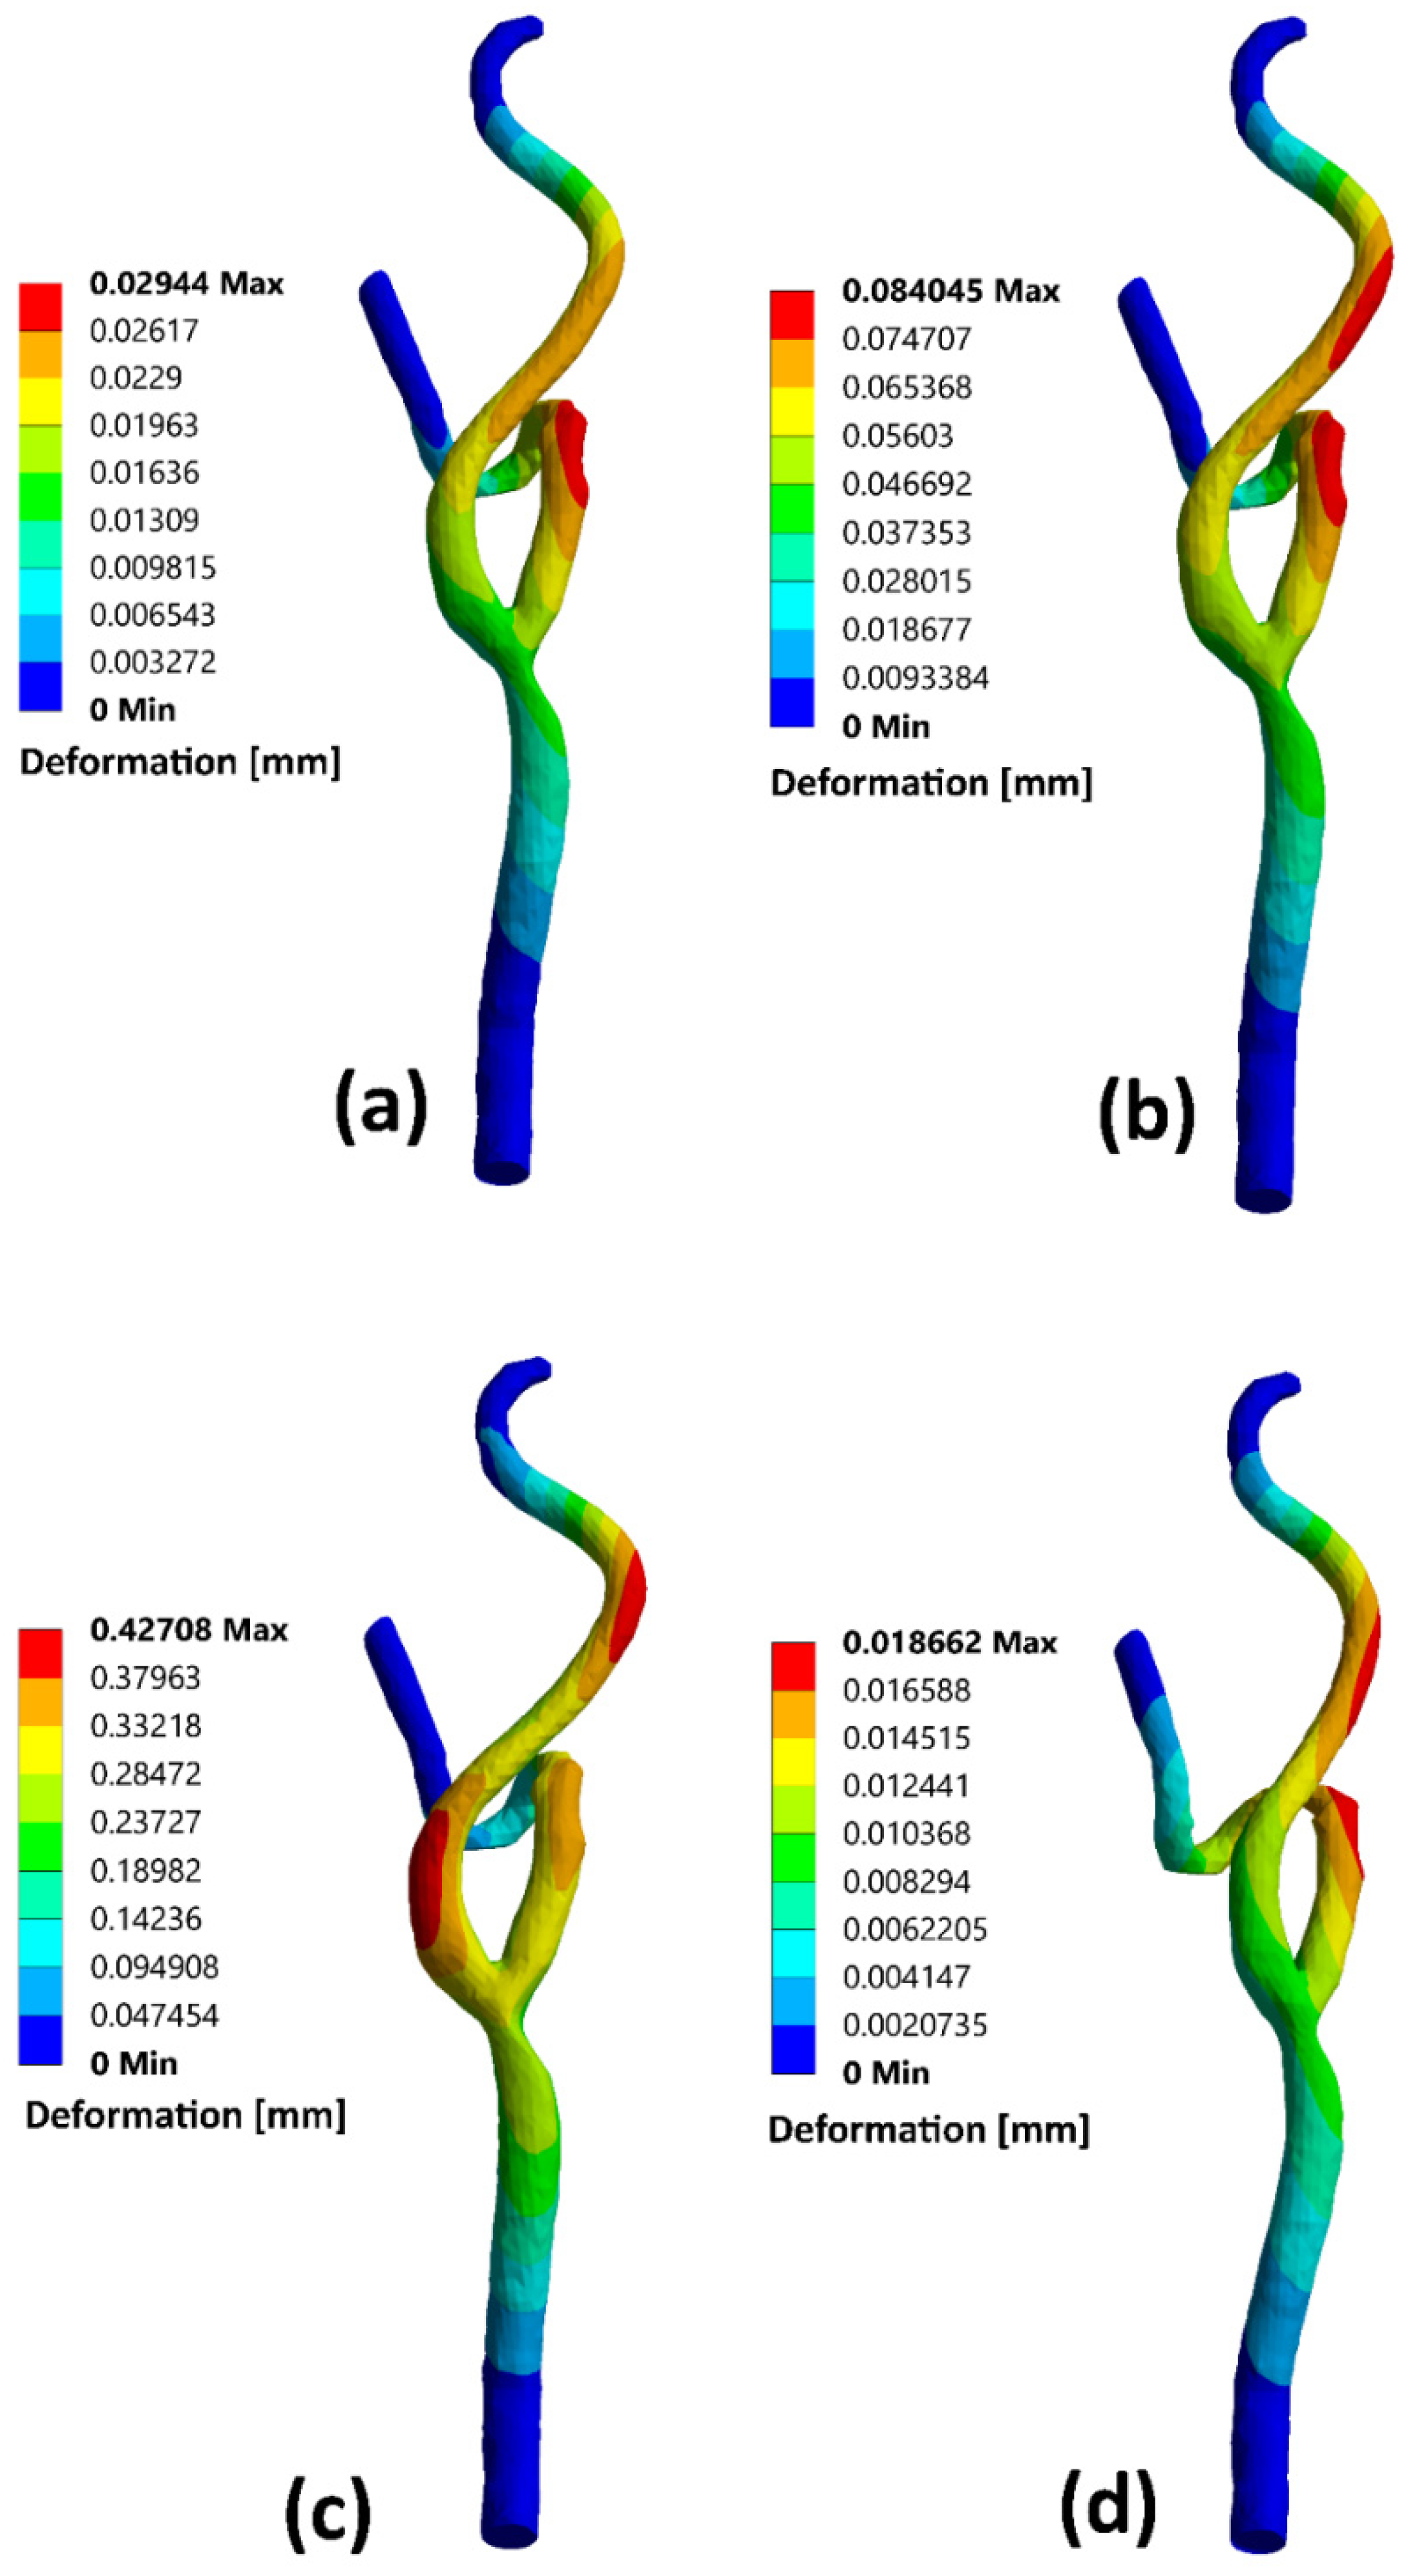
3.5. Arterial Wall Deformation
4. Conclusions
- Accordingly, the blood flow dynamic factors were significantly influenced by using the elastic wall assumption for relatively small diameters of the blood vessels, such as RCA.
- Additionally, the rigid wall assumption is plausible in flow modeling for relatively large diameters such as the carotid artery.
Author Contributions
Funding
Institutional Review Board Statement
Informed Consent Statement
Data Availability Statement
Acknowledgments
Conflicts of Interest
References
- Tu, J.; Inthavong, K.; Wong, K.K.L. Computational Hemodynamics–Theory, Modelling and Applications; Springer: Berlin, Germany, 2015; ISBN 9401795940. [Google Scholar]
- Insull, W. The Pathology of Atherosclerosis: Plaque Development and Plaque Responses to Medical Treatment. Am. J. Med. 2009, 122, S3–S14. [Google Scholar] [CrossRef] [PubMed]
- Zhou, X.; Yin, L.; Xu, L.; Liang, F. Non-periodicity of blood flow and its influence on wall shear stress in the carotid artery bifurcation: An in vivo measurement-based computational study. J. Biomech. 2020, 101, 109617. [Google Scholar] [CrossRef] [PubMed]
- Martorell, J.; Santoma, P.; Kolandaivelu, K.; Kolachalama, V.B.; Melgar-Lesmes, P.; Molins, J.J.; Garcia, L.; Edelman, E.R.; Balcells, M. Extent of flow recirculation governs expression of atherosclerotic and thrombotic biomarkers in arterial bifurcations. Cardiovasc. Res. 2014, 103, 37–46. [Google Scholar] [CrossRef] [PubMed]
- Badimon, L.; Vilahur, G. Thrombosis formation on atherosclerotic lesions and plaque rupture. J. Intern. Med. 2014, 276, 618–632. [Google Scholar] [CrossRef]
- Eshtehardi, P.; Brown, A.J.; Bhargava, A.; Costopoulos, C.; Hung, O.Y.; Corban, M.T.; Hosseini, H.; Gogas, B.D.; Giddens, D.P.; Samady, H. High wall shear stress and high-risk plaque: An emerging concept. Int. J. Cardiovasc. Imaging 2017, 33, 1089–1099. [Google Scholar] [CrossRef]
- Samady, H.; Eshtehardi, P.; McDaniel, M.C.; Suo, J.; Dhawan, S.S.; Maynard, C.; Timmins, L.H.; Quyyumi, A.A.; Giddens, D.P. Coronary artery wall shear stress is associated with progression and transformation of atherosclerotic plaque and arterial remodeling in patients with coronary artery disease. Circulation 2011, 124, 779–788. [Google Scholar] [CrossRef]
- Vergallo, R.; Papafaklis, M.I.; Yonetsu, T.; Bourantas, C.V.; Andreou, I.; Wang, Z.; Fujimoto, J.G.; McNulty, I.; Lee, H.; Biasucci, L.M. Endothelial shear stress and coronary plaque characteristics in humans: Combined frequency-domain optical coherence tomography and computational fluid dynamics study. Circ. Cardiovasc. Imaging 2014, 7, 905–911. [Google Scholar] [CrossRef]
- Doutel, E.; Carneiro, J.; Campos, J.; Miranda, J.M. Experimental and numerical methodology to analyze flows in a coronary bifurcation. Eur. J. Mech. 2018, 67, 341–356. [Google Scholar] [CrossRef]
- He, Y.; Shiu, Y.-T.; Pike, D.B.; Roy-Chaudhury, P.; Cheung, A.K.; Berceli, S.A. Comparison of hemodialysis arteriovenous fistula blood flow rates measured by Doppler ultrasound and phase-contrast magnetic resonance imaging. J. Vasc. Surg. 2018, 68, 1848–1857. [Google Scholar] [CrossRef]
- Zhang, X.; Wu, D.; Li, H.; Fang, Y.; Xiong, H.; Li, Y. Early Diagnosis of Intracranial Internal Carotid Artery Stenosis Using Extracranial Hemodynamic Indices from Carotid Doppler Ultrasound. Bioengineering 2022, 9, 422. [Google Scholar] [CrossRef]
- Albadawi, M.; Abuouf, Y.; Elsagheer, S.; Ookawara, S.; Ahmed, M. Predicting the onset of consequent stenotic regions in carotid arteries using computational fluid dynamics. Phys. Fluids 2021, 33, 123106. [Google Scholar] [CrossRef]
- Nagargoje, M.S.; Mishra, D.K.; Gupta, R. Pulsatile flow dynamics in symmetric and asymmetric bifurcating vessels. Phys. Fluids 2021, 33, 071904. [Google Scholar] [CrossRef]
- Mekheimer, K.S.; Abo-Elkhair, R.E.; Abdelsalam, S.I.; Ali, K.K.; Moawad, A.M.A. Biomedical simulations of nanoparticles drug delivery to blood hemodynamics in diseased organs: Synovitis problem. Int. Commun. Heat Mass Transf. 2022, 130, 105756. [Google Scholar] [CrossRef]
- Gharahi, H.; Zambrano, B.A.; Zhu, D.C.; DeMarco, J.K.; Baek, S. Computational fluid dynamic simulation of human carotid artery bifurcation based on anatomy and volumetric blood flow rate measured with magnetic resonance imaging. Int. J. Adv. Eng. Sci. Appl. Math. 2016, 8, 46–60. [Google Scholar] [CrossRef] [PubMed]
- Khalili, F.; Taebi, A. Advances in Computational Fluid Dynamics Modeling of Cardiac Sounds as a Non-Invasive Diagnosis Method. In Proceedings of the ASME International Mechanical Engineering Congress and Exposition, New York, NY, USA, 1–5 November 2021; Volume 85598, p. V005T05A041. [Google Scholar]
- Taebi, A.; Pillai, R.M.; Roudsari, B.S.; Vu, C.T.; Roncali, E. Computational Modeling of the Liver Arterial Blood Flow for Microsphere Therapy: Effect of Boundary Conditions. Bioengineering 2020, 7, 64. [Google Scholar] [CrossRef]
- Taebi, A. Deep Learning for Computational Hemodynamics: A Brief Review of Recent Advances. Fluids 2022, 7, 197. [Google Scholar] [CrossRef]
- Lopes, D.; Puga, H.; Teixeira, J.C.; Teixeira, S.F. Influence of arterial mechanical properties on carotid blood flow: Comparison of CFD and FSI studies. Int. J. Mech. Sci. 2019, 160, 209–218. [Google Scholar] [CrossRef]
- Lee, S.H.; Kang, S.; Hur, N.; Jeong, S.-K. A fluid-structure interaction analysis on hemodynamics in carotid artery based on patient-specific clinical data. J. Mech. Sci. Technol. 2012, 26, 3821–3831. [Google Scholar] [CrossRef]
- Nejad, A.A.; Talebi, Z.; Cheraghali, D.; Shahbani-Zahiri, A.; Norouzi, M. Pulsatile flow of non-Newtonian blood fluid inside stenosed arteries: Investigating the effects of viscoelastic and elastic walls, arteriosclerosis, and polycythemia diseases. Comput. Methods Programs Biomed. 2018, 154, 109–122. [Google Scholar] [CrossRef]
- Bantwal, A.; Singh, A.; Menon, A.R.; Kumar, N. Pathogenesis of atherosclerosis and its influence on local hemodynamics: A comparative FSI study in healthy and mildly stenosed carotid arteries. Int. J. Eng. Sci. 2021, 167, 103525. [Google Scholar] [CrossRef]
- Dong, J.; Sun, Z.; Inthavong, K.; Tu, J. Fluid–structure interaction analysis of the left coronary artery with variable angulation. Comput. Methods Biomech. Biomed. Eng. 2015, 18, 1500–1508. [Google Scholar] [CrossRef] [PubMed]
- Failer, L.; Minakowski, P.; Richter, T. On the impact of fluid structure interaction in blood flow simulations. Vietnam J. Math. 2021, 49, 169–187. [Google Scholar] [CrossRef]
- Zouggari, L.; Bou-said, B.; Massi, F.; Culla, A.; Millon, A. The Role of Biomechanics in the Assessment of Carotid Atherosclerosis Severity: A Numerical Approach. World J. Vasc. Surg. 2018, 1, 1007. [Google Scholar]
- Yamagishi, M.; Terashima, M.; Awano, K.; Kijima, M.; Nakatani, S.; Daikoku, S.; Ito, K.; Yasumura, Y.; Miyatake, K. Morphology of vulnerable coronary plaque: Insights from follow-up of patients examined by intravascular ultrasound before an acute coronary syndrome. J. Am. Coll. Cardiol. 2000, 35, 106–111. [Google Scholar] [CrossRef]
- Freidoonimehr, N.; Chin, R.; Zander, A.; Arjomandi, M. Effect of shape of the stenosis on the hemodynamics of a stenosed coronary artery. Phys. Fluids 2021, 33, 81914. [Google Scholar] [CrossRef]
- Ambrose, J.A.; Winters, S.L.; Stern, A.; Eng, A.; Teichholz, L.E.; Gorlin, R.; Fuster, V. Angiographie morphology and the pathogenesis of unstable angina pectoris. J. Am. Coll. Cardiol. 1985, 5, 609–616. [Google Scholar] [CrossRef]
- Poepping, T.L.; Rankin, R.N.; Holdsworth, D.W. Flow patterns in carotid bifurcation models using pulsed Doppler ultrasound: Effect of concentric vs. eccentric stenosis on turbulence and recirculation. Ultrasound Med. Biol. 2010, 36, 1125–1134. [Google Scholar] [CrossRef]
- Oviedo, C.; Maehara, A.; Mintz, G.S.; Araki, H.; Choi, S.Y.; Tsujita, K.; Kubo, T.; Doi, H.; Templin, B.; Lansky, A.J.; et al. Intravascular ultrasound classification of plaque distribution in left main coronary artery bifurcations where is the plaque really located? Circ. Cardiovasc. Interv. 2010, 3, 105–112. [Google Scholar] [CrossRef]
- Latib, A.; Colombo, A. Bifurcation disease: What do we know, what should we do? JACC Cardiovasc. Interv. 2008, 1, 218–226. [Google Scholar] [CrossRef]
- Ferguson, G.G.; Eliasziw, M.; Barr, H.W.K.; Clagett, G.P.; Barnes, R.W.; Wallace, M.C.; Taylor, D.W.; Haynes, R.B.; Finan, J.W.; Hachinski, V.C. The North American symptomatic carotid endarterectomy trial: Surgical results in 1415 patients. Stroke 1999, 30, 1751–1758. [Google Scholar] [CrossRef]
- Cury, R.C.; Abbara, S.; Achenbach, S.; Agatston, A.; Berman, D.S.; Budoff, M.J.; Dill, K.E.; Jacobs, J.E.; Maroules, C.D.; Rubin, G.D.; et al. CAD-RADSTM Coronary Artery Disease—Reporting and Data System. An expert consensus document of the Society of Cardiovascular Computed Tomography (SCCT), the American College of Radiology (ACR) and the North American Society for Cardiovascular Imaging (NASCI). J. Cardiovasc. Comput. Tomogr. 2016, 10, 269–281. [Google Scholar] [CrossRef] [PubMed]
- Eigenbrodt, M.L.; Sukhija, R.; Rose, K.M.; Tracy, R.E.; Couper, D.J.; Evans, G.W.; Bursac, Z.; Mehta, J.L. Common carotid artery wall thickness and external diameter as predictors of prevalent and incident cardiac events in a large population study. Cardiovasc. Ultrasound 2007, 5, 11. [Google Scholar] [CrossRef] [PubMed]
- Fayad, Z.A.; Fuster, V.; Fallon, J.T.; Jayasundera, T.; Worthley, S.G.; Helft, G.; Aguinaldo, J.G.; Badimon, J.J.; Sharma, S.K. Noninvasive in vivo human coronary artery lumen and wall imaging using black-blood magnetic resonance imaging. Circulation 2000, 102, 506–510. [Google Scholar] [CrossRef] [PubMed]
- Peacock, J.; Jones, T.; Tock, C.; Lutz, R. The onset of turbulence in physiological pulsatile flow in a straight tube. Exp. Fluids 1998, 24, 1–9. [Google Scholar] [CrossRef]
- Yilmaz, F.; Gundogdu, M.Y. A critical review on blood flow in large arteries; relevance to blood rheology, viscosity models, and physiologic conditions. Korea-Aust. Rheol. J. 2008, 20, 197–211. [Google Scholar]
- Wang, X.; Li, X. Computational simulation of aortic aneurysm using FSI method: Influence of blood viscosity on aneurismal dynamic behaviors. Comput. Biol. Med. 2011, 41, 812–821. [Google Scholar] [CrossRef]
- Ali, D.; Sen, S. Permeability and fluid flow-induced wall shear stress of bone tissue scaffolds: Computational fluid dynamic analysis using Newtonian and non-Newtonian blood flow models. Comput. Biol. Med. 2018, 99, 201–208. [Google Scholar] [CrossRef]
- Abuouf, Y.; AlBadawi, M.; Ookawara, S.; Ahmed, M. Effect of guidewire insertion in fractional flow reserve procedure for real geometry using computational fluid dynamics. Biomed. Eng. Online 2021, 20, 95. [Google Scholar] [CrossRef]
- Abuouf, Y.; Ookawara, S.; Ahmed, M. Analysis of the effect of guidewire position on stenosis diagnosis using computational fluid dynamics. Comput. Biol. Med. 2020, 121, 103777. [Google Scholar] [CrossRef]
- Cho, Y.I.; Kensey, K.R. Effects of the non-Newtonian viscosity of blood on flows in a diseased arterial vessel. Part 1: Steady flows. Biorheology 1991, 28, 241–262. [Google Scholar] [CrossRef]
- Mendieta, J.B.; Fontanarosa, D.; Wang, J.; Paritala, P.K.; McGahan, T.; Lloyd, T.; Li, Z. The importance of blood rheology in patient-specific computational fluid dynamics simulation of stenotic carotid arteries. Biomech. Model. Mechanobiol. 2020, 19, 1477–1490. [Google Scholar] [CrossRef] [PubMed]
- Albadawi, M.; Abuouf, Y.; Ookawara, S.; Ahmed, M. Influence of Carotid Artery Stenosis Location on Lesion Progression Using Computational Fluid Dynamics. In Proceedings of the ASME International Mechanical Engineering Congress and Exposition, New York, NY, USA, 16–19 November 2020; Volume 84522, p. V005T05A031. [Google Scholar]
- Lee, S.-W.; Antiga, L.; Steinman, D.A. Correlations among indicators of disturbed flow at the normal carotid bifurcation. J. Biomech. Eng. 2009, 131, 061013. [Google Scholar] [CrossRef] [PubMed]
- Klabunde, R. Cardiovascular Physiology Concepts; Wolters Kluwer Health/Lippincott Williams & Wilkins: Philadelphia, PA, USA, 2011; ISBN 9781451113846. [Google Scholar]
- Shimizu, Y.; Liu, L.; Kosukegawa, H.; Funamoto, K.; Hayase, T.; Nakayama, T.; Ohta, M. Deformation of Stenotic Blood Vessel Model Made from Poly (Vinyl Alcohol) Hydrogel by Hydrostatic Pressure. In Proceedings of the ASME 2016 International Mechanical Engineering Congress and Exposition, Phoenix, AZ, USA, 11–17 November 2016; Volume 3, p. V003T04A055. [Google Scholar]
- De Wilde, D.; Trachet, B.; De Meyer, G.; Segers, P. The influence of anesthesia and fluid–structure interaction on simulated shear stress patterns in the carotid bifurcation of mice. J. Biomech. 2016, 49, 2741–2747. [Google Scholar] [CrossRef] [PubMed]
- Dhawan, S.S.; Avati Nanjundappa, R.P.; Branch, J.R.; Taylor, W.R.; Quyyumi, A.A.; Jo, H.; McDaniel, M.C.; Suo, J.; Giddens, D.; Samady, H. Shear stress and plaque development. Expert Rev. Cardiovasc. Ther. 2010, 8, 545–556. [Google Scholar] [CrossRef]
- Lubliner, J. Plasticity Theory; Dover Publications: New York, NY, USA, 2008; ISBN 978-0486462905. [Google Scholar]


| Nominal Hydraulic Diameter | Throat Diameter | Wall Thickness | |||
|---|---|---|---|---|---|
| Main Branch | Outlet (1) | Outlet (2) | |||
| Stenotic RCA—model A | |||||
| CCA | ECA | ICA | |||
| Stenotic ICA—model B | |||||
| Stenotic CCA—model C | |||||
| WSS (Pa) | ||||
|---|---|---|---|---|
| Stenosis Throat | Artery Bifurcation | |||
| Elastic Wall | Rigid Wall | Elastic Wall | Rigid Wall | |
| Stenotic RCA—model A | 508.8 | 456.7 | 64.4 | 61.9 |
| Stenotic ICA—model B | 116.9 | 118.8 | 16.3 | 16.2 |
| Stenotic CCA—model C | 63.01 | 61.5 | 27.3 | 25.9 |
| TAWSS (Pa) | ||||
|---|---|---|---|---|
| Stenosis Throat | Artery Bifurcation | |||
| Elastic Wall | Rigid Wall | Elastic Wall | Rigid Wall | |
| Stenotic RCA—model A | 295.1 | 267.4 | 30.3 | 28.9 |
| Stenotic ICA—model B | 56.8 | 57.3 | 9 | 8.5 |
| Stenotic CCA—model C | 37.9 | 34.65 | 15.5 | 14.2 |
| Flow Rate at Late Diastole (g/s) | |||
|---|---|---|---|
| Inlet | Outlet (1) | Outlet (2) | |
| Elastic wall (FSI) | 2.095 | 2.095 | 0 |
| Rigid wall (CFD) | 1.94 | 1.727 | 0.215 |
| Flow Rate at Peak Systole (g/s) | |||
| Inlet | Outlet (1) | Outlet (2) | |
| Elastic wall (FSI) | 3.508 | 3.508 | 0 |
| Rigid wall (CFD) | 3.163 | 2.446 | 0.716 |
| Flow Rate at Late Diastole (g/s) | |||
|---|---|---|---|
| Inlet | ICA | ECA | |
| Elastic wall (FSI) | 19.75 | 9.671 | 10.08 |
| Rigid wall (CFD) | 19.92 | 9.77 | 10.14 |
| Flow Rate at Peak Systole (g/s) | |||
| Inlet | ICA | ECA | |
| Elastic wall (FSI) | 43.7 | 21.304 | 22.4 |
| Rigid wall (CFD) | 43.63 | 21.3 | 22.35 |
| Flow Rate at Late Diastole (g/s) | |||
|---|---|---|---|
| Inlet | ICA | ECA | |
| Elastic wall (FSI) | 18.89 | 10.2 | 8.7 |
| Rigid wall (CFD) | 19.62 | 10.6 | 8.9 |
| Flow Rate at Peak Systole (g/s) | |||
| Inlet | ICA | ECA | |
| Elastic wall (FSI) | 40.73 | 21.8 | 18.9 |
| Rigid wall (CFD) | 40.44 | 21.65 | 18.8 |
Publisher’s Note: MDPI stays neutral with regard to jurisdictional claims in published maps and institutional affiliations. |
© 2022 by the authors. Licensee MDPI, Basel, Switzerland. This article is an open access article distributed under the terms and conditions of the Creative Commons Attribution (CC BY) license (https://creativecommons.org/licenses/by/4.0/).
Share and Cite
Albadawi, M.; Abuouf, Y.; Elsagheer, S.; Sekiguchi, H.; Ookawara, S.; Ahmed, M. Influence of Rigid–Elastic Artery Wall of Carotid and Coronary Stenosis on Hemodynamics. Bioengineering 2022, 9, 708. https://doi.org/10.3390/bioengineering9110708
Albadawi M, Abuouf Y, Elsagheer S, Sekiguchi H, Ookawara S, Ahmed M. Influence of Rigid–Elastic Artery Wall of Carotid and Coronary Stenosis on Hemodynamics. Bioengineering. 2022; 9(11):708. https://doi.org/10.3390/bioengineering9110708
Chicago/Turabian StyleAlbadawi, Muhamed, Yasser Abuouf, Samir Elsagheer, Hidetoshi Sekiguchi, Shinichi Ookawara, and Mahmoud Ahmed. 2022. "Influence of Rigid–Elastic Artery Wall of Carotid and Coronary Stenosis on Hemodynamics" Bioengineering 9, no. 11: 708. https://doi.org/10.3390/bioengineering9110708
APA StyleAlbadawi, M., Abuouf, Y., Elsagheer, S., Sekiguchi, H., Ookawara, S., & Ahmed, M. (2022). Influence of Rigid–Elastic Artery Wall of Carotid and Coronary Stenosis on Hemodynamics. Bioengineering, 9(11), 708. https://doi.org/10.3390/bioengineering9110708