Abstract
Syngas fermentation by methanogens is a novel process to purify biogas. Methanogens are able to ferment non-desirable CO2, H2, and CO to methane. However, to use methanogens on an industrial scale, more research has to be done. There are studies that discuss the growth of methanogens on syngas in combination with acetate. In this research, growth of methanogens on syngas as sole carbon source is discussed. Effluent of an anaerobic fed-batch was selectively cultivated with syngas in 400 mL Eppendorf© bioreactors. After a period of 7 days, fifteen 120 mL flasks were filled with three different liquid-to-gas ratios (1:1, 1:3, 1:5). Results showed that different liquid-to-gas ratios change the metabolic preference of the anaerobic microbial community. Moreover, complete conversion in a four-to-eight-day period, via the carboxidotrophic pathway, was observed in all three liquid-to-gas ratios.
1. Introduction
Syngas fermentation has been seen as a way to capture the excess of renewable produced energy and as an ex-situ manner to purify biogas production [1]. H2 electrolyzing and gasification of biomass could precede the ex-situ purification. Renewable produced electricity is in this case used to electrolyze H2 from water, also known as a power-to-gas solution [1,2]. However, H2 is difficult to transport in the current natural gas grid. On the other side, gasification of carbon sources results in the production biogas and syngas [3]. In order to use and transport the produced biogas through the natural gas grid, it has to be purified [4]. Both H2 and syngas can be used as organic feedstocks for ex-situ methanation. Hence, syngas by methanogens is a solution that uses a separated fermentation process. This separated fermentation process includes mainly methanogens that convert the non-desirable CO2, H2, and CO concentrations within the anaerobic fermented biogas. It is an additional purification step to increase CH4 concentrations up to 99 mol% CH4 [4].
To be able to apply syngas fermentation on an industrial scale, more research has to be done about methanogenic growth [5]. Although around 150 methanogenic species are characterized, only four are able to grow on CO as a pure carbon source: Methanobacterium thermoautotrophicum, Methanosarcani acetivorans, Methanosarcina barkeri, and Methanothermobacter marburgensis [6,7]. Since CO is seen as an inhibitor to the growth of methanogens, it is interesting to show the ability of a mixed culture to grow on a medium with CO as primary carbon. It is known that methanogens have four carbonic metabolic pathways: carboxidotrophic, hydrogenotrophic, methylotrophic, and acetoclastic [8,9,10]. The four pathways are depicted in Equations (1)–(4). The ability to grow on a medium with CO as primary carbon source shows the ability of the anaerobic microbial community to use these pathways. The amount of anaerobic microbial community present (i.e., liquid) in relation to the gaseous feedstock present hypothetically influences the preference for a specific pathway. In this case, a specific liquid-to-gas ratio could optimize the industrial application of ex-situ anaerobic syngas fermentation [1,11].
4 CO + 2 H2O → CH4 + 3 CO2
4 H2 + CO2 → CH4 + 2 H2O
CH3COH + H2 → CH4 + H2O
CH3COOH→ CH4 + CO2
In this study, the methanogenic growth of an anaerobic consortium is studied for three different liquid-to-gas ratios. Interestingly, in all three ratio’s the concentration of CO is completely converted within eight days. Although similar CO conversion rates are found [3,7,12], these studies research the conversion of syngas to acetate or they use additional carbon sources for methanation. In this study, the major carbon source is syngas, which is used to produce methane. It is shown that a higher liquid-to-gas ratio increases the conversion rate and results in a higher metabolic preference for volatile fatty acids (VFA). In all ratios, both the carboxidotrophic and hydrogenotrophic pathways are used by the methanogenic community to achieve this conversion rate.
2. Materials and Methods
2.1. Materials
The anaerobic culture for syngas fermentation was obtained from a mesophilic digester that anaerobically treats wastewater at the wastewater treatment plant (WWTP) of Garmerwolde in Groningen, the Netherlands. The fresh inoculum used in the batch tests was selectively degassed to ensure anaerobic conditions and to keep methanogenic bacteria active. A two-liter glass bottle, containing 1.4 L fresh inoculum, was flushed with syngas for 10 min and placed in the incubator at 36 °C for 1 week. For the selective degassing, Stam medium was used to reinforce the methanogenic activity. The Stam medium included 0.265 g Na2HPO4·2 H2O, 0.205 g KH2PO4, 0.15 g NH4Cl, 0.055 g CaCl2·2H2O, 0.05 MgCl2·6H2O, 0.15g NaCl, 2.0 g NaHCO3, and 0.24 g Na2S·9H2O per liter (including 1 mL·L−1 acid trace element solution, 1 mL·L−1 alkaline trace element solution, and 0.2 mL·L−1 vitamins solution [13]).
2.2. Batch Tests
Fifteen 120 mL glass flasks were filled with inoculum and syngas with different liquid–gas ratios (working volume/headspace volume) and tested in mesophilic and thermophilic conditions. The flasks were filled such that three different ratios were made: a ratio of 1:5 (20 mL of liquid and 100 mL of gas), 1:3 (30 mL of consortium and 90 mL of gas), and 1:1 (60 mL of consortium and 60 mL of gas). The glass flasks were sealed and flushed with syngas (10% CH4, 10% CO2, 25% CO, and 55% H2) for 5 min to saturate the glass bottle and to ensure anaerobic conditions. This specific syngas composition was chosen because it is a composition that is acquired by gasifying biomass (i.e., natural carbon sources such as fossil fuels or agricultural waste). Thereafter, they were placed in an incubator, maintained at a constant temperature (35 ± 1 °C), and shaken manually twice per day during the experimental period of the assays. At day 4, day 6, and day 8 (end), a triplicate was removed, and their volumetric composition of the gas was measured. For every ratio and every time intervals, two control groups were added: (A) containing water and syngas and (B) containing the inoculum. Control A shows the uptake of the gaseous substrates in water at the specific day and control B shows whether the consortium produces methane without the addition of a syngas. Controls were used to correct the methane production from syngas.
2.3. Anlaytical Methods
The volumetric percentages of CO, CO2, and CH4 were measured on a gas chromatograph HP 5890 series II with a thermal conductivity detector. The carrier gas used was helium. The temperature of the column was set to 40 °C, after which the gas temperature was increased to 90 °C in 3 min. The detector was maintained at 90°C for 8 min. As a reference, a syngas mixture with a composition of 10% CH4, 10% CO2, 25% CO, and 55% H2 was used. The gasses were injected via a syringe at atmospheric pressure and room temperature. The HACH AT1000 automatic titrator was used to determine the total alkalinity (TA), the volatile fatty acids (VFA), and the pH of the samples. HACH © AT1000 automatic titrator uses the Nordmann method to determine these values. A 0.1 M of sulphuric acid solution was titrated to express the TA value in mg/L of calcium carbonate at a pH up to 5. After a second titration, the VFA value was measured in mg/L acetic acid between a pH of 4.4 and 5.
3. Results
3.1. Methane Production
In Figure 1, the volumetric concentrations of CO2, CH4, and CO in a 120 mL flask with three different liquid-to-gas ratios at 35 °C are presented. In ratio 1:1, the CH4 concentration increased from the initial 10 to 60% at day 4. After day 4, the concentration stayed relatively flat around a volumetric concentration at 60%.
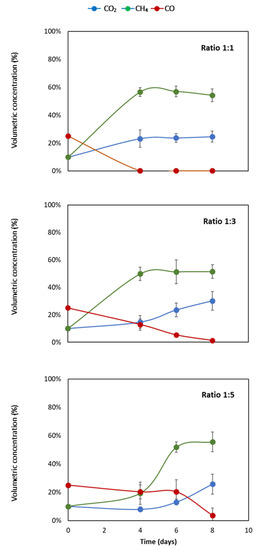
Figure 1.
Volumetric composition of CO2, CO, and CH4 of liquid-to-gas volume ratios of 1:5, 1:3, and 1:1. The error bars represent the standard deviations of the triplicate samples. All data points contain error bars.
The volumetric concentration of CO2 also increased, by 12%, from the initial 10% to 22% at day 4. Lastly, the volumetric concentration of CO decreased from 25% to 0% at day 4. The concentration of both CO2 and CO stayed flat around the concentration of, respectively, 22% and 0% at days 6 and 8.
In the liquid-to-gas ratio of 1:3, a gradual increase of CH4 was observed. The concentration increased from 10% to 50% at day 4 and continued to increase to 55% and 56% at days 6 and 8, respectively. At day 4, the volumetric concentration of CO2 in the headspace was measured to be close to the initial concentration of 10%. After day 4, the concentration increased from 15% to 25% on day 6 and day 8, respectively, as depicted in Figure 1.
Lastly, the volumetric concentration of CO decreased from 25% to 10% at day 4, and a further decline of the concentration was observed at day 6. Eventually, the CO concentration reached 0% at day 8. In the flasks with ratio of 1:5, an increase of CH4 concentration of 15% was observed in the first four days. At days 6 and 8, the concentration reached up to 56% and 58%, respectively. Moreover, the CO2 concentration stayed almost flat the first four days and afterwards increased to 18% and 25% on days 6 and 8, respectively. A change in CO concentration was observed at day 8, where CO decreased from 21% (day 6) to 3% (day 8).
3.2. TA, VFA and pH
In Figure 2, the changes of TA, VFA, and pH as a function of time (days) at different liquid-to-gas ratios are presented. TA values for the liquid-to-gas ratios 1:1 and 1:5 remained relatively stable over eight days (range 3150–3400 mg/L); however, at a liquid-to-volume ratio of 1:3, an increasing and decreasing trend could be observed, and TA value increased to 4000 mg/L on day 4 and then decreased on days 6 and 8 to 3900 mg/L.
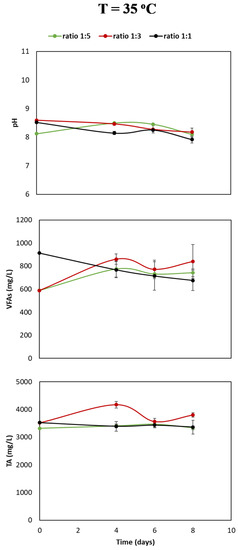
Figure 2.
Change in buffer capacity or total alkalinity (TA), volatile fatty acid composition (VFA), and pH at three different liquid-to-gas ratios as a function of time (days). The error bars represent the standard deviations of the triplicate samples. All data points contain error bars.
The TA values of the ratio 1:3 were above the other ratios with the largest difference being approximately 550 mg/L, measured at day four. Furthermore, VFA present in the three ratios was determined. The VFA values in ratios 1:3 and 1:5 increased from an initial value of approximately 600 mg/L to values around 750 and 825 mg/L in eight days. The initial VFA value at gas-to-liquid ratio 1:1 was approximately 900 mg/L. In a period of eight days, it decreased to 700 mg/L. Lastly, the change of pH values after a function of time has been presented. In all three liquid-to-gas volume ratios, the pH value varied from 8 to 8.5 as a function of time irrespective of the volume ratio of liquid-to-gas. No significant increasing or decreasing trend was seen over a period of eight days. Thus, the archaea methanogens in the microbial community use hydrogenotrophic and carboxidotrophic metabolic pathways and therefore metabolize CO2 and CO, respectively, to CH4.
Based on Figure 1 and Figure 2, three main observations can be made: (1) a higher liquid-to-gas ratio increases the production rate of CH4; (2) in a higher liquid-to-gas ratio, CO is completely consumed in a period of four days; and (3) at a ratio of 1:1, the VFA increased, and in the other ratios the VFA decreased.
4. Discussion
4.1. CH4 Production by Methanogens
A significant increase in CH4 concentration can be seen in all ratios. In all the ratio experiments, the production yield of CH4 approaches 100% of the theoretical yield. The maximal theoretical volumetric concentration of CH4 is 57%. In the liquid-to-gas ratio of 1:1, a volumetric concentration of 60% is already reached at day four. It takes eight days for the other ratios to reach a concentration of 60%. Therefore, a higher liquid-to-gas ratio increases the production rate of CH4.
The concentrations of CH4 in the headspace depicted in Figure 1 are similar to the CH4 production obtained in a previous study [14]. They use a slightly different syngas composition, namely, 48.4% H2, 26.4% CO2, 23.3% CO, and 1.9% CH4. The production is similar, because in a timeframe of eight days the CO is completely consumed and converted to CH4. The production of CH4 stabilizes after six days. Finally, after nine days, they achieve a methane conversion of 50% of the theoretical yield in mesophilic conditions. Here the similarities end, because in this study a theoretical yield of 100% is observed. The use of a liquid solid instead of solid biochar explains this difference. Moreover, the theoretical yield does not reach 100% because additional VFA are made [7,14]. Methanogenic activity of the microbial community is exposed to syngas during the selective cultivation. This exposure could be the reason for more methanogenic instead of acetogenic activity.
The results show methanation yields exceeding 100% the theoretical yield. The theoretical yield is calculated considering the gaseous substrate as sole carbon source. Methanation yields exceeding the theoretical calculated yields therefore indicate a minor concentration of other carboxylic substrates initially present in the sludge. This is also explained by the minor initial concentrations of VFA depicted in Figure 2, namely, 900 mg/L and 600 mg/L for, respectively, ratio 1:1 and ratios 1:2 and 1:5 [15].
4.2. CO Consumption by Methanogens
Interestingly, the CO concentration in the headspace of all three liquid-to-gas ratios is completely consumed in eight days. There is, however, a big difference in the speed at which the CO is consumed. At ratio 1:1, the CO is already consumed at day four, where at ratio 1:3 the CO concentration is still 20%. It is logical that in a higher liquid-to-gas ratio the consumption is faster, because relatively more methanogens are present. However, the fact that the CO is completely converted in such a short time period is surprising. In a previous study, a complete CO consumption at nine days was shown, but not at four days [14]. Another study showed a complete CO consumption at 10 days [16]. Both studies exhibited similar mesophilic conditions and a headspace containing a volumetric CO concentration of 23.3% and 40% CO, respectively.
On the other hand, even faster consumption rates are presented in [6]. They prove that in thermophilic conditions, CO concentrations can be consumed in one day by a coculture of M. thermoautotrophicus and Carboxydothermus hydrogenoformans. However, these are thermophilic conditions that have been selectively cultivated. Moreover, a pure culture of the M. thermoautotrophicus completely converted CO in approximately eight days, although both were performed at different temperatures, which is in line with our study [6].
It is interesting to see a minor increase in the CO2 concentration. This indicates that the carboxidotrophic pathway is a preferred pathway by this methanogenic community. It is known that the carboxidotrophic and hydrogenotrophic metabolic pathways simultaneously convert CH4. It is also logical that the carboxidotrophic pathway is preferred, because it is thermodynamically more favorable than the hydrogenotrophic pathway [17]. The carboxidotrophic and hydrogenotrophic reactions are depicted in Equations (1) and (2).
4.3. Effect of VFA on Syngas Fermentation
In the ratio experiment, an increase in VFA values was observed as a function of time liquid-to-gas volume ratios of 1:3 and 1:5, see Figure 2. On the other hand, the VFA values of the experiment with a liquid-to-gas volume ratio of 1:1 decreased as a function of time. The decrease in VFA values can be explained by the variety of microbes present in the mixed microbial culture. Several species of this mixed culture are able to use formate, methanol, or acetate as catabolic product [18]. The production of CH4 from CO occurs along three routs: directly, via the hydrogenotrophic pathway, and by using acetate as intermediate [10].
The direct pathway, known as the carboxidotrophic pathway, can be seen in Equation (1). For the other two routes—via the hydrogenotrophic pathway and by using acetate as intermediate—methanogens need other anaerobic microorganic species. These species first convert CO to CO2 or acetate. However, they do not have the ability to further convert the CO2 and acetate to CH4. CO2 and acetate can therefore be seen as ‘’intermediate’’ products. Now it can be explained why the VFA values fluctuate at liquid-to-gas volume ratios of 1:3 and 1:5 as a function of time. The methanogens consume acetate as catabolic products to produce CO2, following the metabolic pathway of Equation (4), thereby reducing the VFA value as observed in the instance of a liquid-to-gas volume ratio of 1:1. On the other hand, in liquid-to-gas ratio 1:3 and 1:5, other microorganism present in the mixed culture use the CO and CO2 to produce acetate. The production of acetate increases the VFA value, as observed in the instance of a liquid-to-gas volume ratio of 1:1.
In addition, there is a reaction that will definitely be used by anaerobic microorganisms. This reaction is called the water gas shift reaction, see Equation (5). This reaction balances the concentrations of CO and CO2. It is therefore an important intermediate reaction for syngas fermentation by methanogens [9].
CO + H2O → CO2 + H2
A previous study found that a reduction of the VFA value by 47.8% resulted in a CH4 yield of between 62% and 67% [15]. However, in this case acetate was the main carbon source, and the concentration of VFA was 1400 mg/L, almost twice the initial VFA value measured in the gas-to-liquid ratio of 1:1. Use of another carbon source, apart from syngas, is often discussed in literature [10,12,14]. The experiment on the effect of liquid-to-gas ratio on syngas fermentation is a unique experiment, because no additional carbon source has been added. Only a very limited amount of VFA was initially present. Both the production and consumption of the VFA by the microbial community shows the vitality of methanogens. The quick depletion of the carbon sources present in the syngas changes the adaptation of the microbial community in the gas-to-liquid ratio 1:1. When relatively more gaseous carbon is available, in ratio 1:5 and 1:3, the methanogens change their metabolic pathways and produce more VFA. When a higher liquid-to-gas ratio is present, the VFA are used as additional feedstock.
To conclude, there is methanogenic activity present in the sludge. Under mesophilic conditions, the consumption of CO is more efficient than recent studies presented, and it can be concluded that the carboxidotrophic pathway is preferred over the hydrogenotrophic pathway. This suggests the presence of methanogenic species, known to be able to use CO as metabolic feedstock for methanation, such as Methanobacterium thermoautotrophicum, Methanosarcani acetivorans, Methanosarcina barkeri, and Methanothermobacter marburgensis. A topic for future studies could be to further identify specific species and their methanogenic metabolic activity. Furthermore, the change in VFA concentration in the reaction medium is different across liquid-to-gas liquid ratios. In a high liquid-to-gas ratio, the microbial community is more likely to use the present VFA as feedstock. In lower liquid-to-gas ratios, it is likely to produce VFA and therefore store energy in the form of carbon sources. The hypothesis is partly accepted, because on one hand there is carboxidotrophic metabolic activity that reduces the CO. However, on the other hand, the CO2 concentration does not decrease. This is due to the production of CO2 by the carboxidotrophic pathways and because the H2 concentration limits further consumption of CO2.
5. Conclusions
The methanogens indeed produced methane, and the CO was significantly consumed. However, the concentration of CO2 does not significantly decrease. This fact can be contributed to a limited amount of H2 in the volumetric gas composition. In general, the microbial community present preferred to produce methane rather than acetate. Complete CO conversion via the carboxidotrophic pathway was observed experimentally at different liquid-to-gas ratios. The short, four-, and eight-day periods, in which this occurred, were remarkable. According to the literature, complete conversion under mesophilic conditions took nine to ten days. Moreover, the production and consumption of VFA were observed in the microbial sludge. A larger liquid-to-gas ratio made the anaerobic microbial community prefer VFA metabolism. In media with a smaller liquid-to-gas ratio, the anaerobic microbial community produced VFA.
Author Contributions
Conceptualization, S.A.; methodology, S.A.; writing—original draft preparation, S.A. and S.J.M.; writing—review and editing, G.J.W.E. All authors have read and agreed to the published version of the manuscript.
Funding
This research received no external funding.
Conflicts of Interest
The authors declare no conflict of interest.
References
- Rusmanis, D.; O’Shea, R.; Wall, D.M.; Murphy, J.D. Biological hydrogen methanation systems–an overview of design and efficiency. Bioengineered 2019, 10, 604–634. [Google Scholar] [CrossRef]
- Enzmann, F.; Mayer, F.; Rother, M.; Holtmann, D. Methanogens: Biochemical background and biotechnological applications. AMB Express 2018, 8, 1–22. [Google Scholar] [CrossRef] [PubMed]
- Phillips, J.R.; Huhnke, R.L.; Atiyeh, H.K. Syngas fermentation: A microbial conversion process of gaseous substrates to various products. Fermentation 2017, 3, 28. [Google Scholar] [CrossRef]
- Vlap, H.; Mellema, R.; Verhaegh, N.; Aalfs, D.; Zeijlmaker, R.; Van Halen, B.; Postma, F. METHANATION Technical Fundamentals and Market; DNV GL: Arnhem, The Netherlands, 2019. [Google Scholar]
- Grimalt-Alemany, A.; Skiadas, I.V.; Gavala, H.N. Syngas biomethanation: State-of-the-art review and perspectives. Biofuels Bioprod. Biorefining 2018, 12, 139–158. [Google Scholar] [CrossRef]
- Sokolova, T.G.; Henstra, A.M.; Sipma, J.; Parshina, S.N.; Stams, A.J.M.; Lebedinsky, A.V. Diversity and ecophysiological features of thermophilic carboxydotrophic anaerobes. FEMS Microbiol. Ecol. 2009, 68, 131–141. [Google Scholar] [CrossRef] [PubMed]
- Diender, M.; Uhl, P.S.; Bitter, J.H.; Stams, A.J.M.; Sousa, D.Z. High rate biomethanation of carbon monoxide-rich gases via a thermophilic synthetic coculture. ACS Sustain. Chem. Eng. 2018, 6, 2169–2176. [Google Scholar] [CrossRef] [PubMed]
- Lackner, N.; Hintersonnleitner, A.; Wagner, A.O.; Illmer, P. Hydrogenotrophic methanogenesis and autotrophic growth of methanosarcina thermophila. Archaea 2018, 2018, 4712608. [Google Scholar] [CrossRef] [PubMed]
- Ragsdale, S.W.; Pierce, E. Acetogenesis and the wood-ljungdahl pathway of CO2 fixation. Biochim. Biophys. Acta (BBA) Proteins Proteom. 2008, 1784, 1873–1898. [Google Scholar] [CrossRef] [PubMed]
- Santos, M.; Reis, N.M.; Guiot, S.R.; Navarro, S.S.; Cimpoia, R.; Bruant, G. Biomethanation of syngas using anaerobic sludge: Shift in the catabolic routes with the CO partial pressure increase. Front. Microbiol. 2016, 7, 1188. [Google Scholar]
- Sipma, J. Microbial Hydrogenogenic CO Conversions: Applications in Synthesis Gas Purification and Biodesulfurization. Ph.D. Thesis, Wageningen University, Wageningen, The Netherlands, 2006. [Google Scholar]
- Luo, G.; Jing, Y.; Lin, Y.; Zhang, S.; An, D. A novel concept for syngas biomethanation by two-stage process: Focusing on the selective conversion of syngas to acetate. Sci. Total Environ. 2018, 645, 1194–1200. [Google Scholar] [CrossRef] [PubMed]
- Stams, A.J.M.; Van Dijk, J.B.; Dijkema, C.; Plugge, C.M. Growth of syntrophic propionate-oxidizing bacteria with fumarate in the absence of methanogenic bacteria. Appl. Environ. Microbiol. 1993, 59, 1114–1119. [Google Scholar] [CrossRef] [PubMed]
- Schwede, S.; Bruchmann, F.; Thorin, E.; Gerber, M. Biological syngas methanation via immobilized methanogenic archaea on biochar. Energy Procedia 2017, 105, 823–829. [Google Scholar] [CrossRef]
- Mohd, N.S.; Husnain, T.; Li, B.; Rahman, A.; Riffat, R. Investigation of the performance and kinetics of anaerobic digestion at 45 °C. J. Water Resour. Prot. 2015, 7, 1099–1100. [Google Scholar] [CrossRef][Green Version]
- Arantes, A.L.; Alves, J.I.; Stams, A.J.M.; Alves, M.M.; Sousa, D.Z. Enrichment of syngas-converting communities from a multi-orifice baffled bioreactor. Microb. Biotechnol. 2018, 11, 639–646. [Google Scholar] [CrossRef] [PubMed]
- Hu, P.; Bowen, S.H.; Lewis, R.S. A thermodynamic analysis of electron production during syngas fermentation. Bioresour. Technol. 2011, 102, 8071–8076. [Google Scholar] [CrossRef] [PubMed]
- Stams, A.J.M. Metabolic interactions between anaerobic bacteria in methanogenic environments. Antonie van Leeuwenhoe 1994, 66, 271–294. [Google Scholar] [CrossRef] [PubMed]
Publisher’s Note: MDPI stays neutral with regard to jurisdictional claims in published maps and institutional affiliations. |
© 2020 by the authors. Licensee MDPI, Basel, Switzerland. This article is an open access article distributed under the terms and conditions of the Creative Commons Attribution (CC BY) license (http://creativecommons.org/licenses/by/4.0/).