Dynamic Properties of Heart Fragments from Different Regions and Their Synchronization

 , and
, and 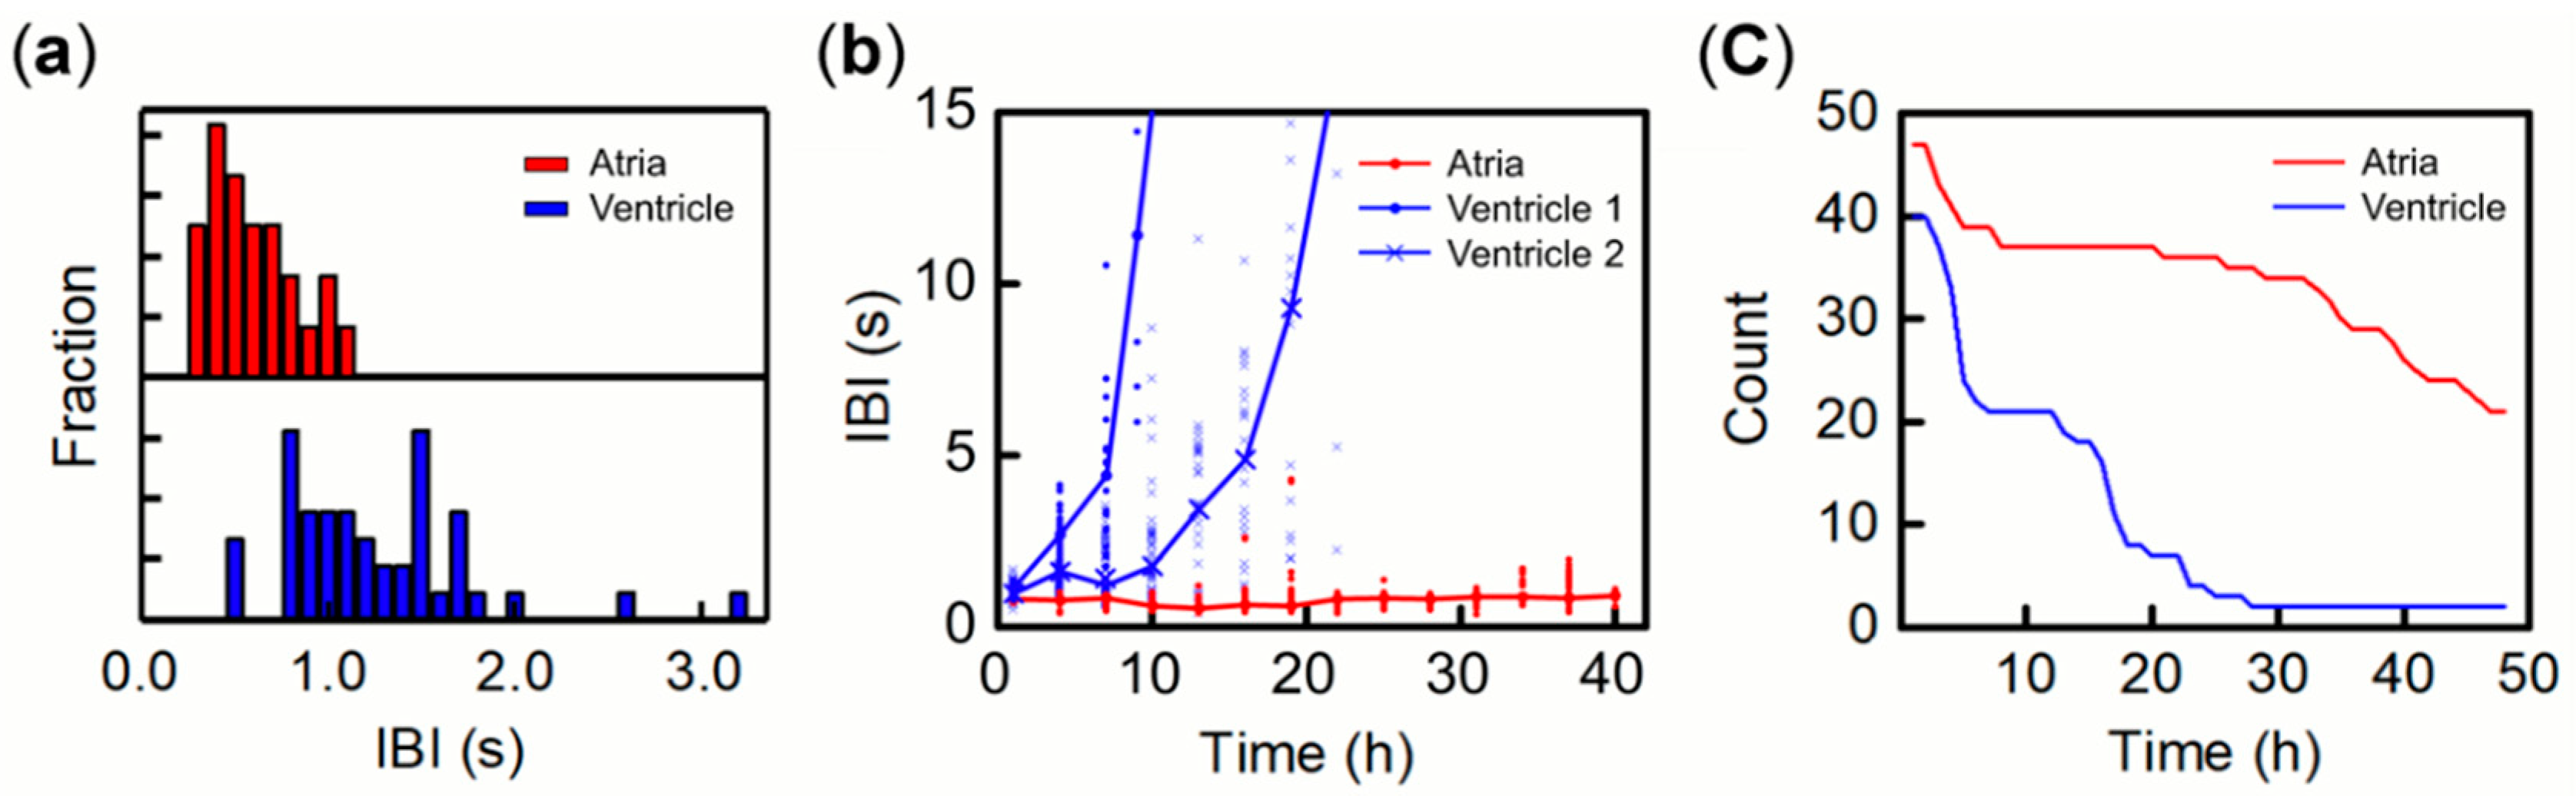
Abstract
1. Introduction
2. Materials and Methods
2.1. Heart Fragments
2.2. Monitoring Contractile Activity and Beat Sequences
3. Results
3.1. Beat Activity of Single Tissue Fragments of Atria and Ventricles
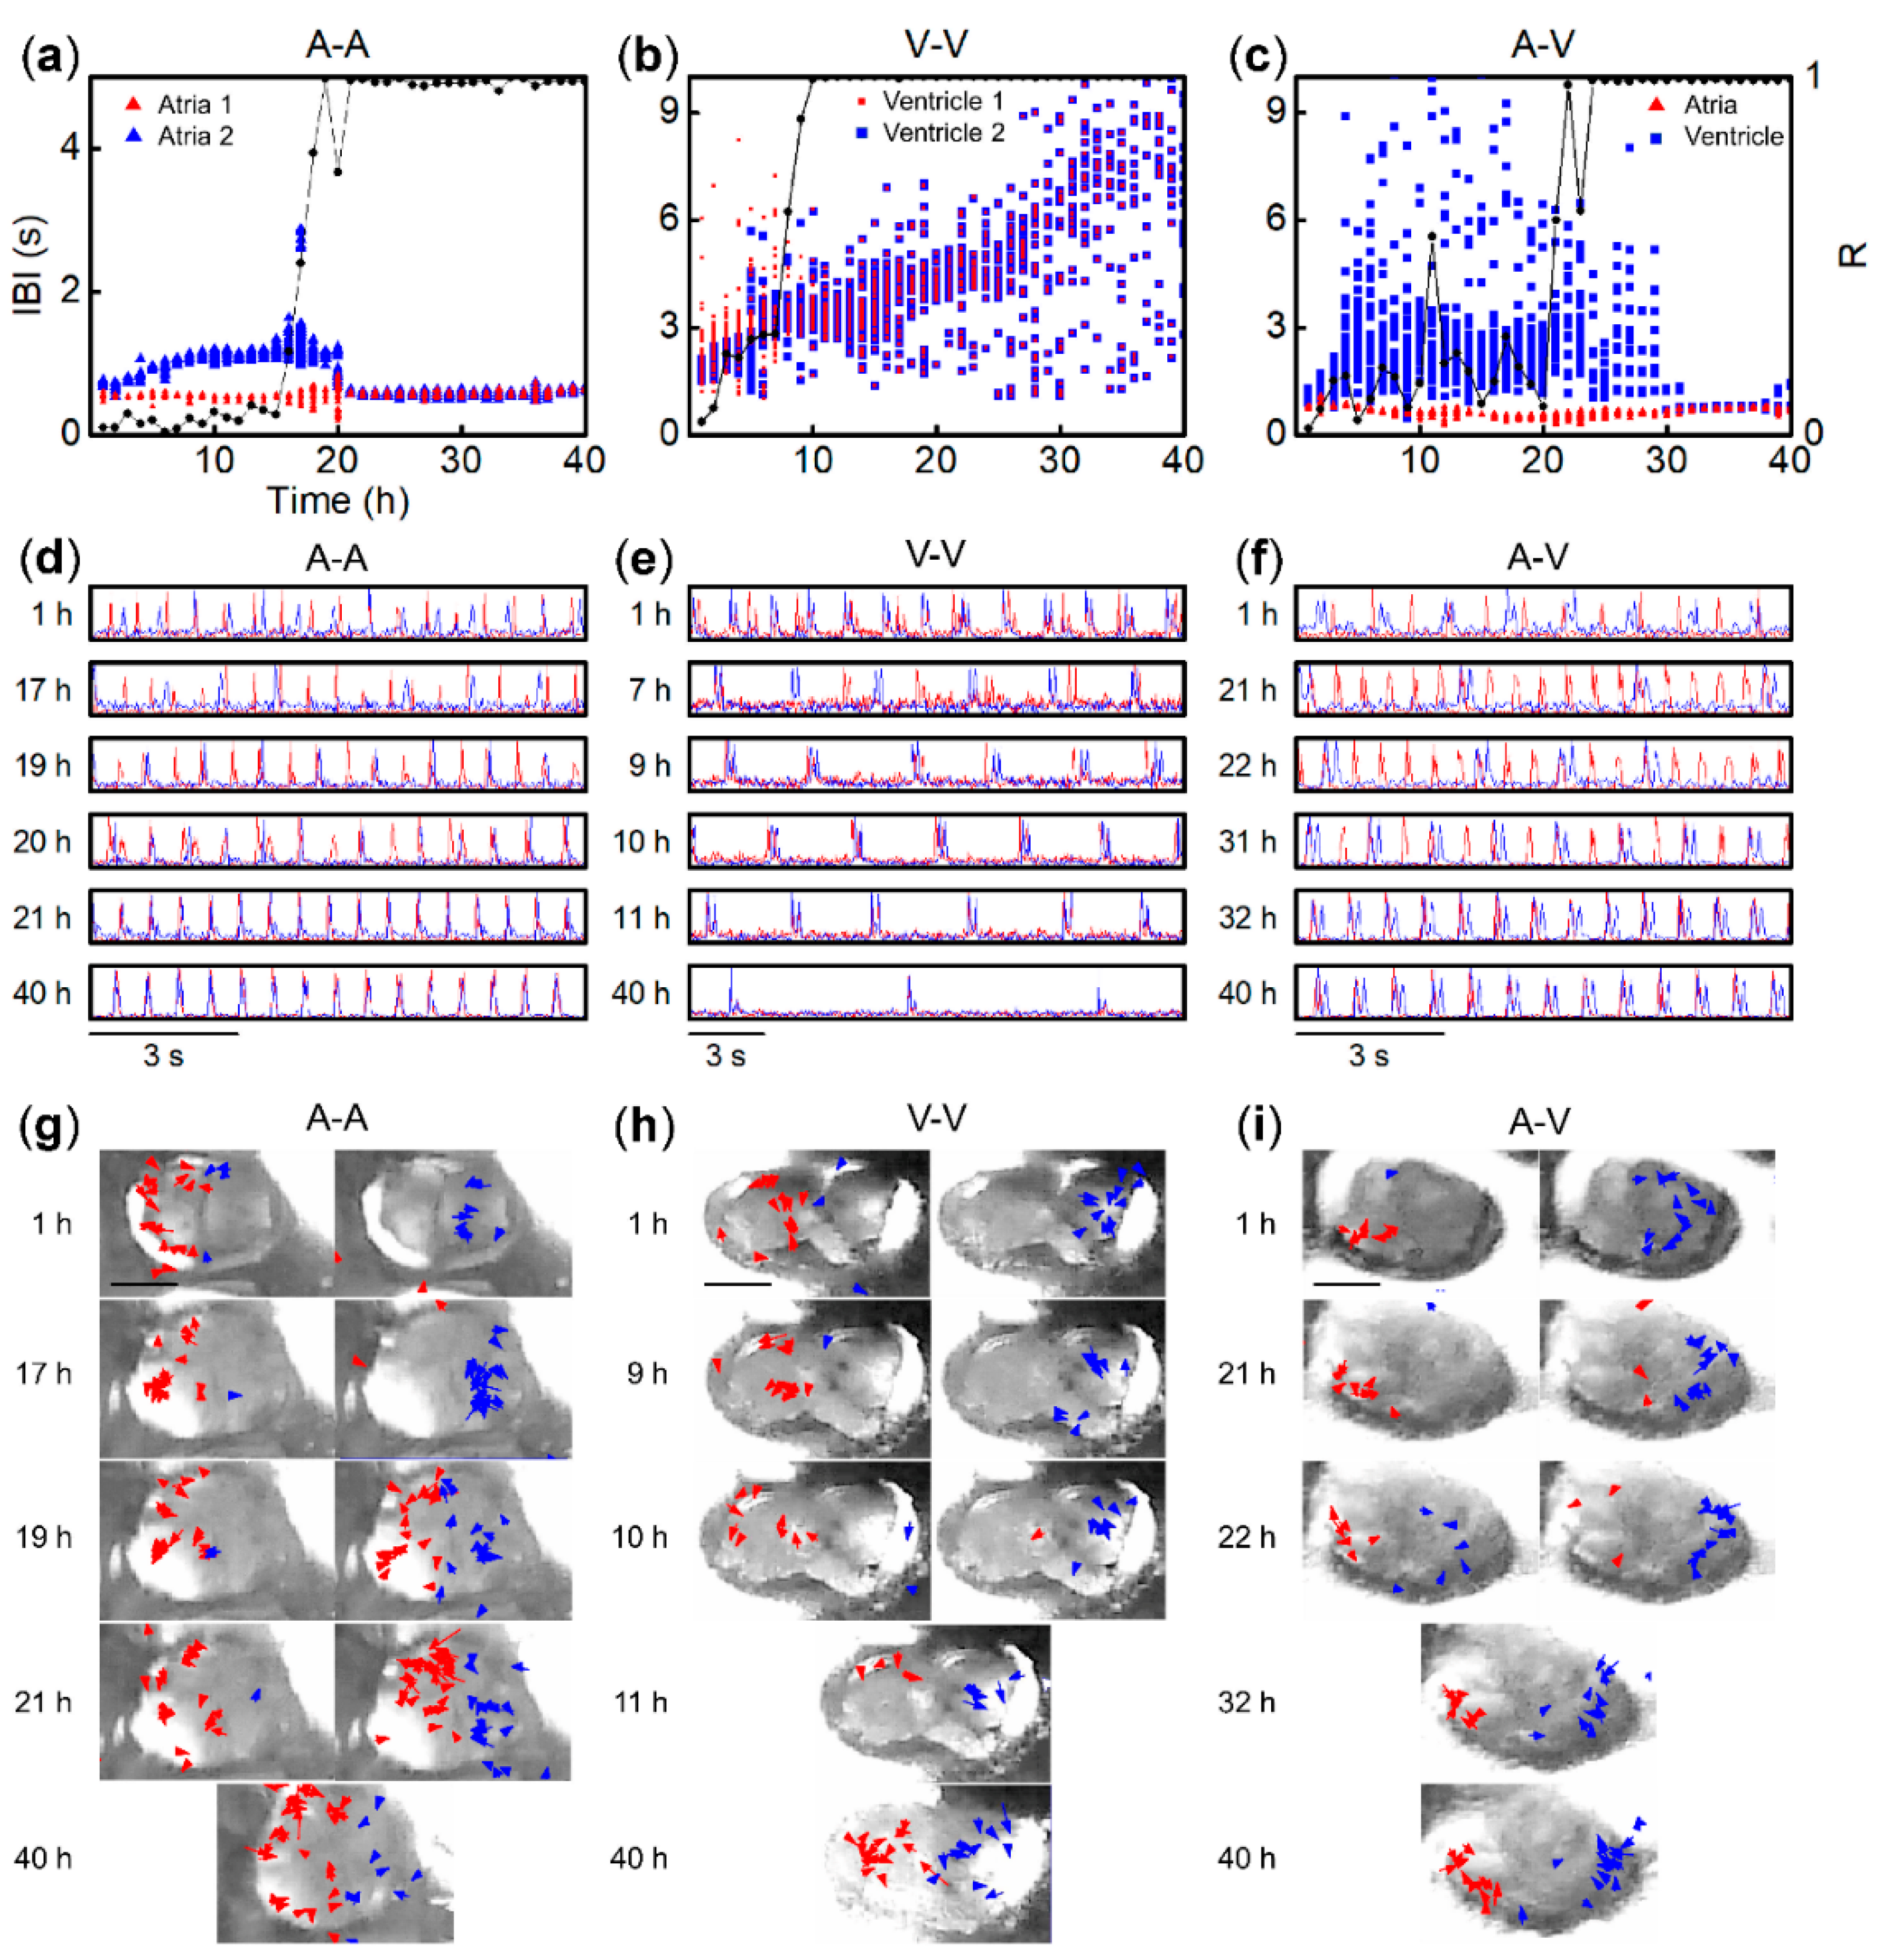
3.2. Synchronization of Beats between Paired Fragments from Different Regions
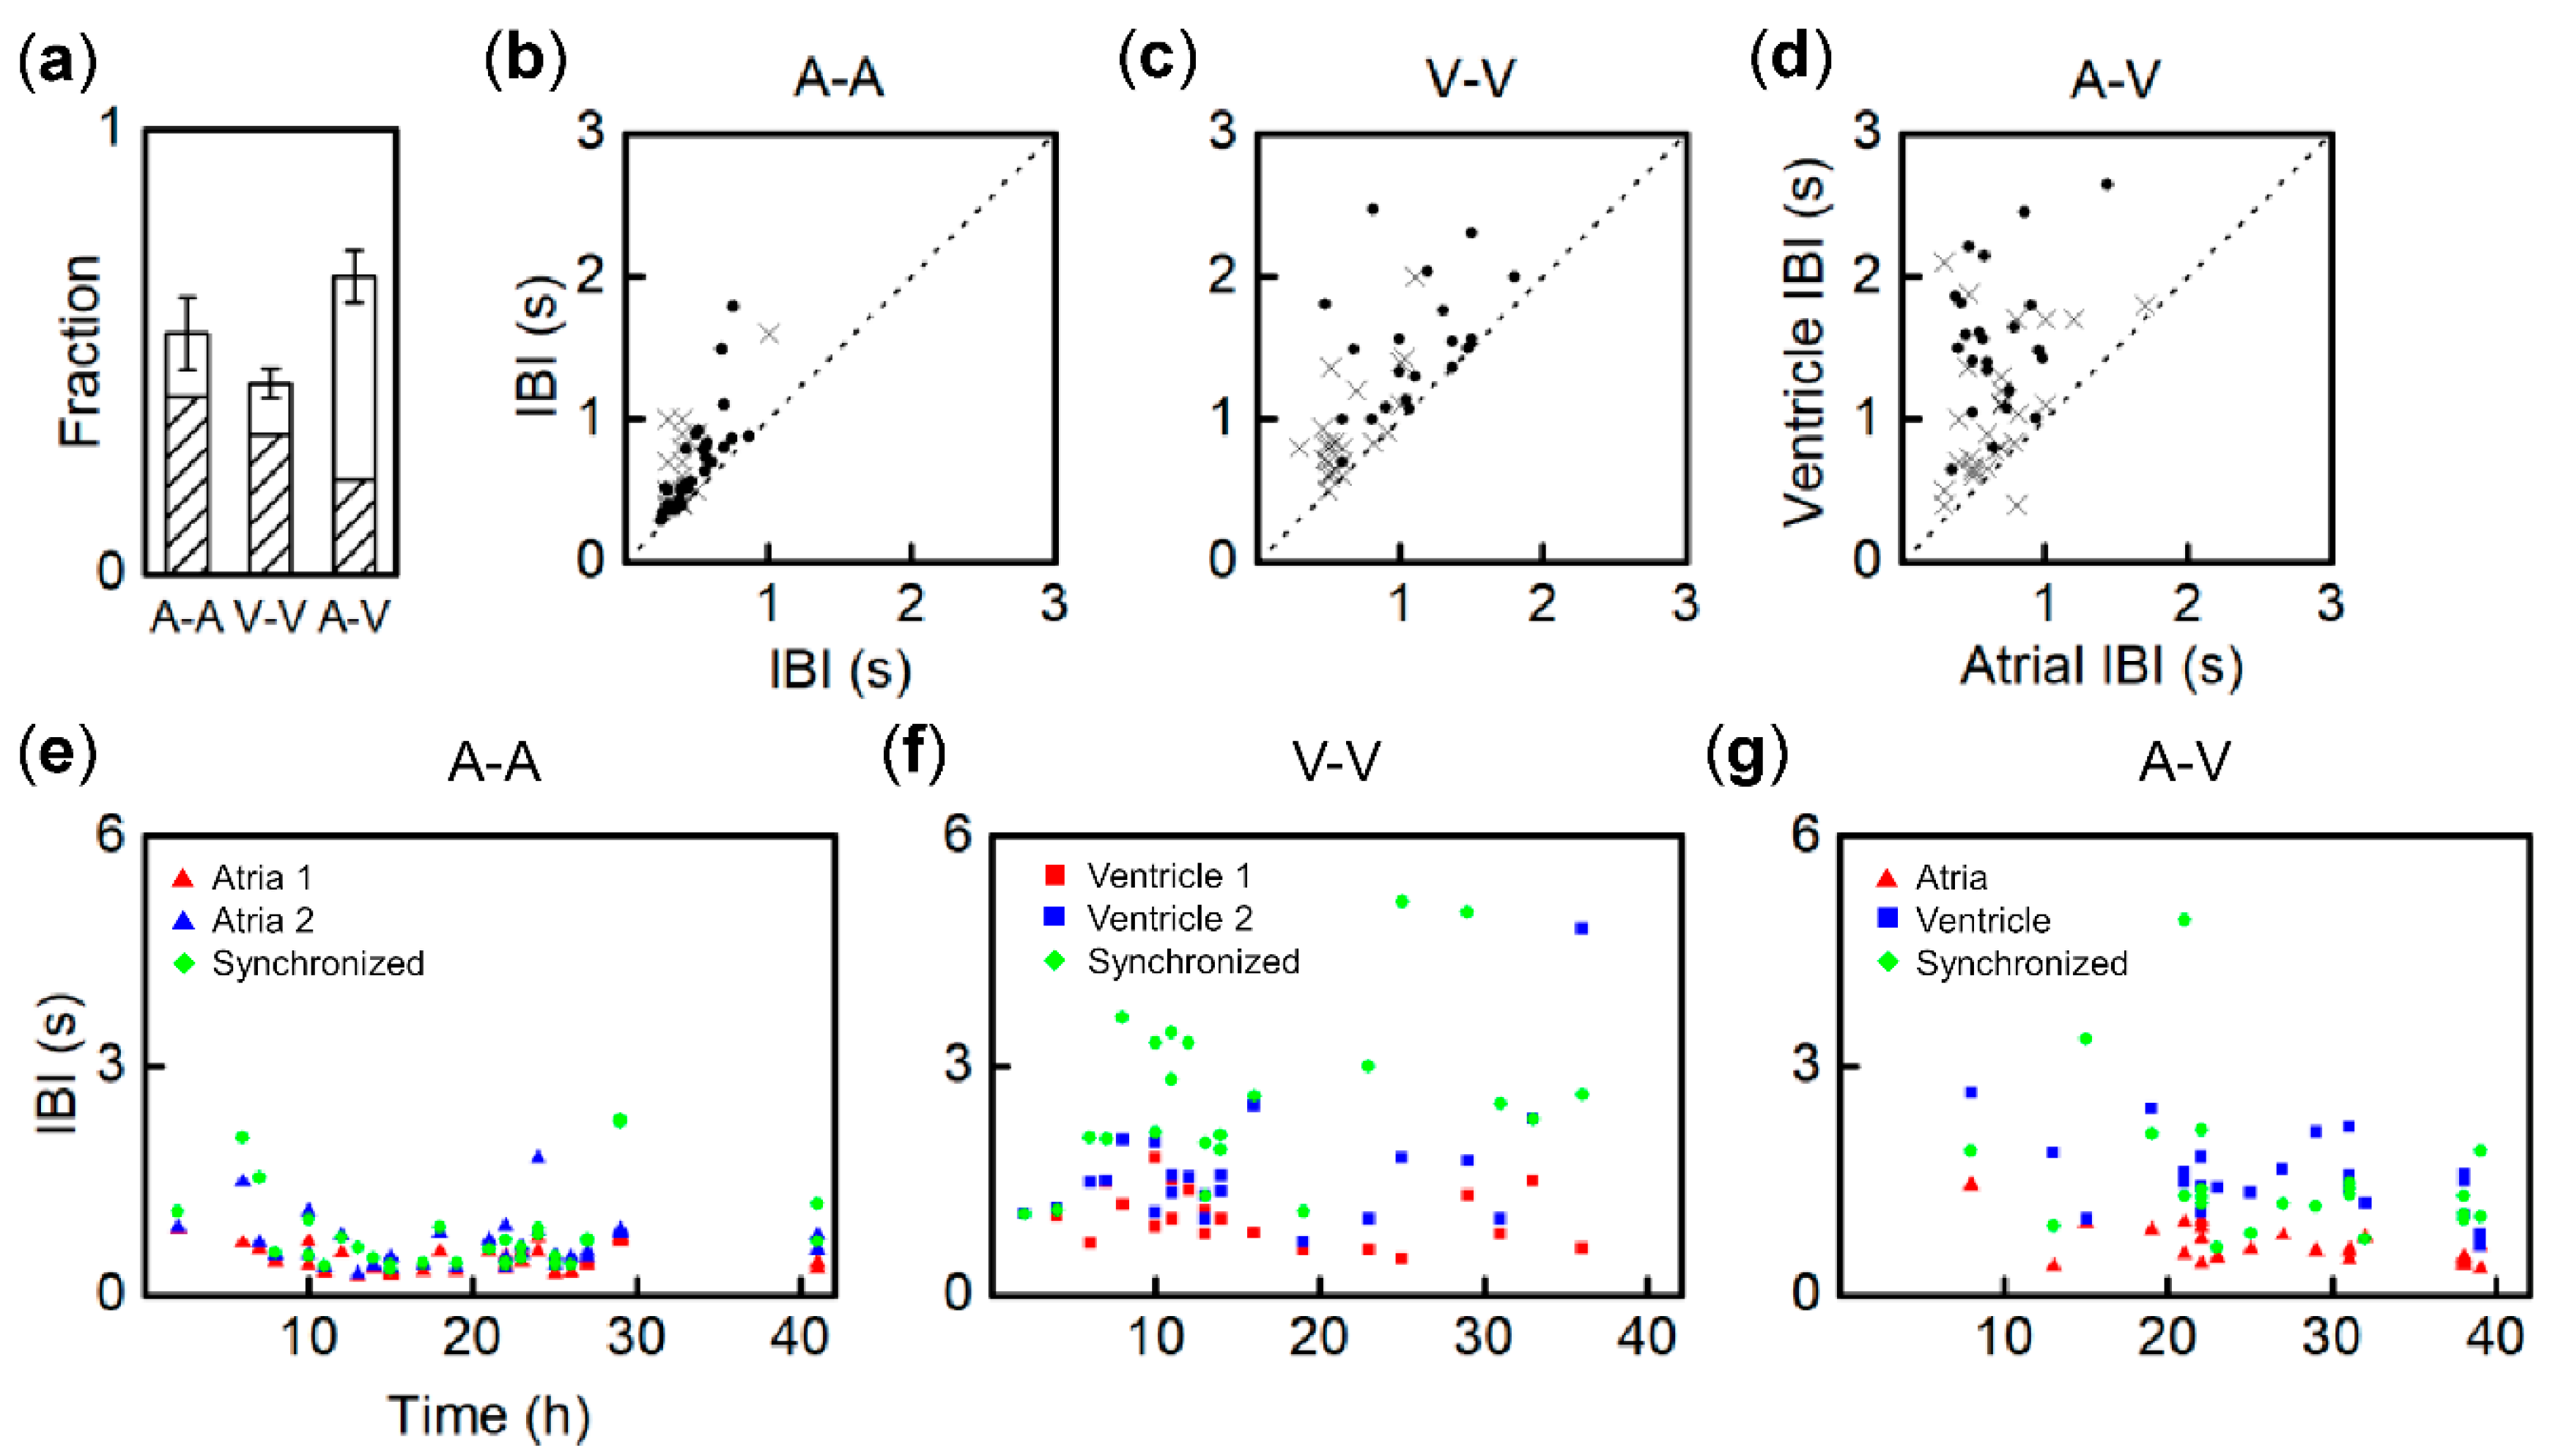
3.3. Synchronization Probability of Fragment Pairs from Different Regions and IBI Transitions
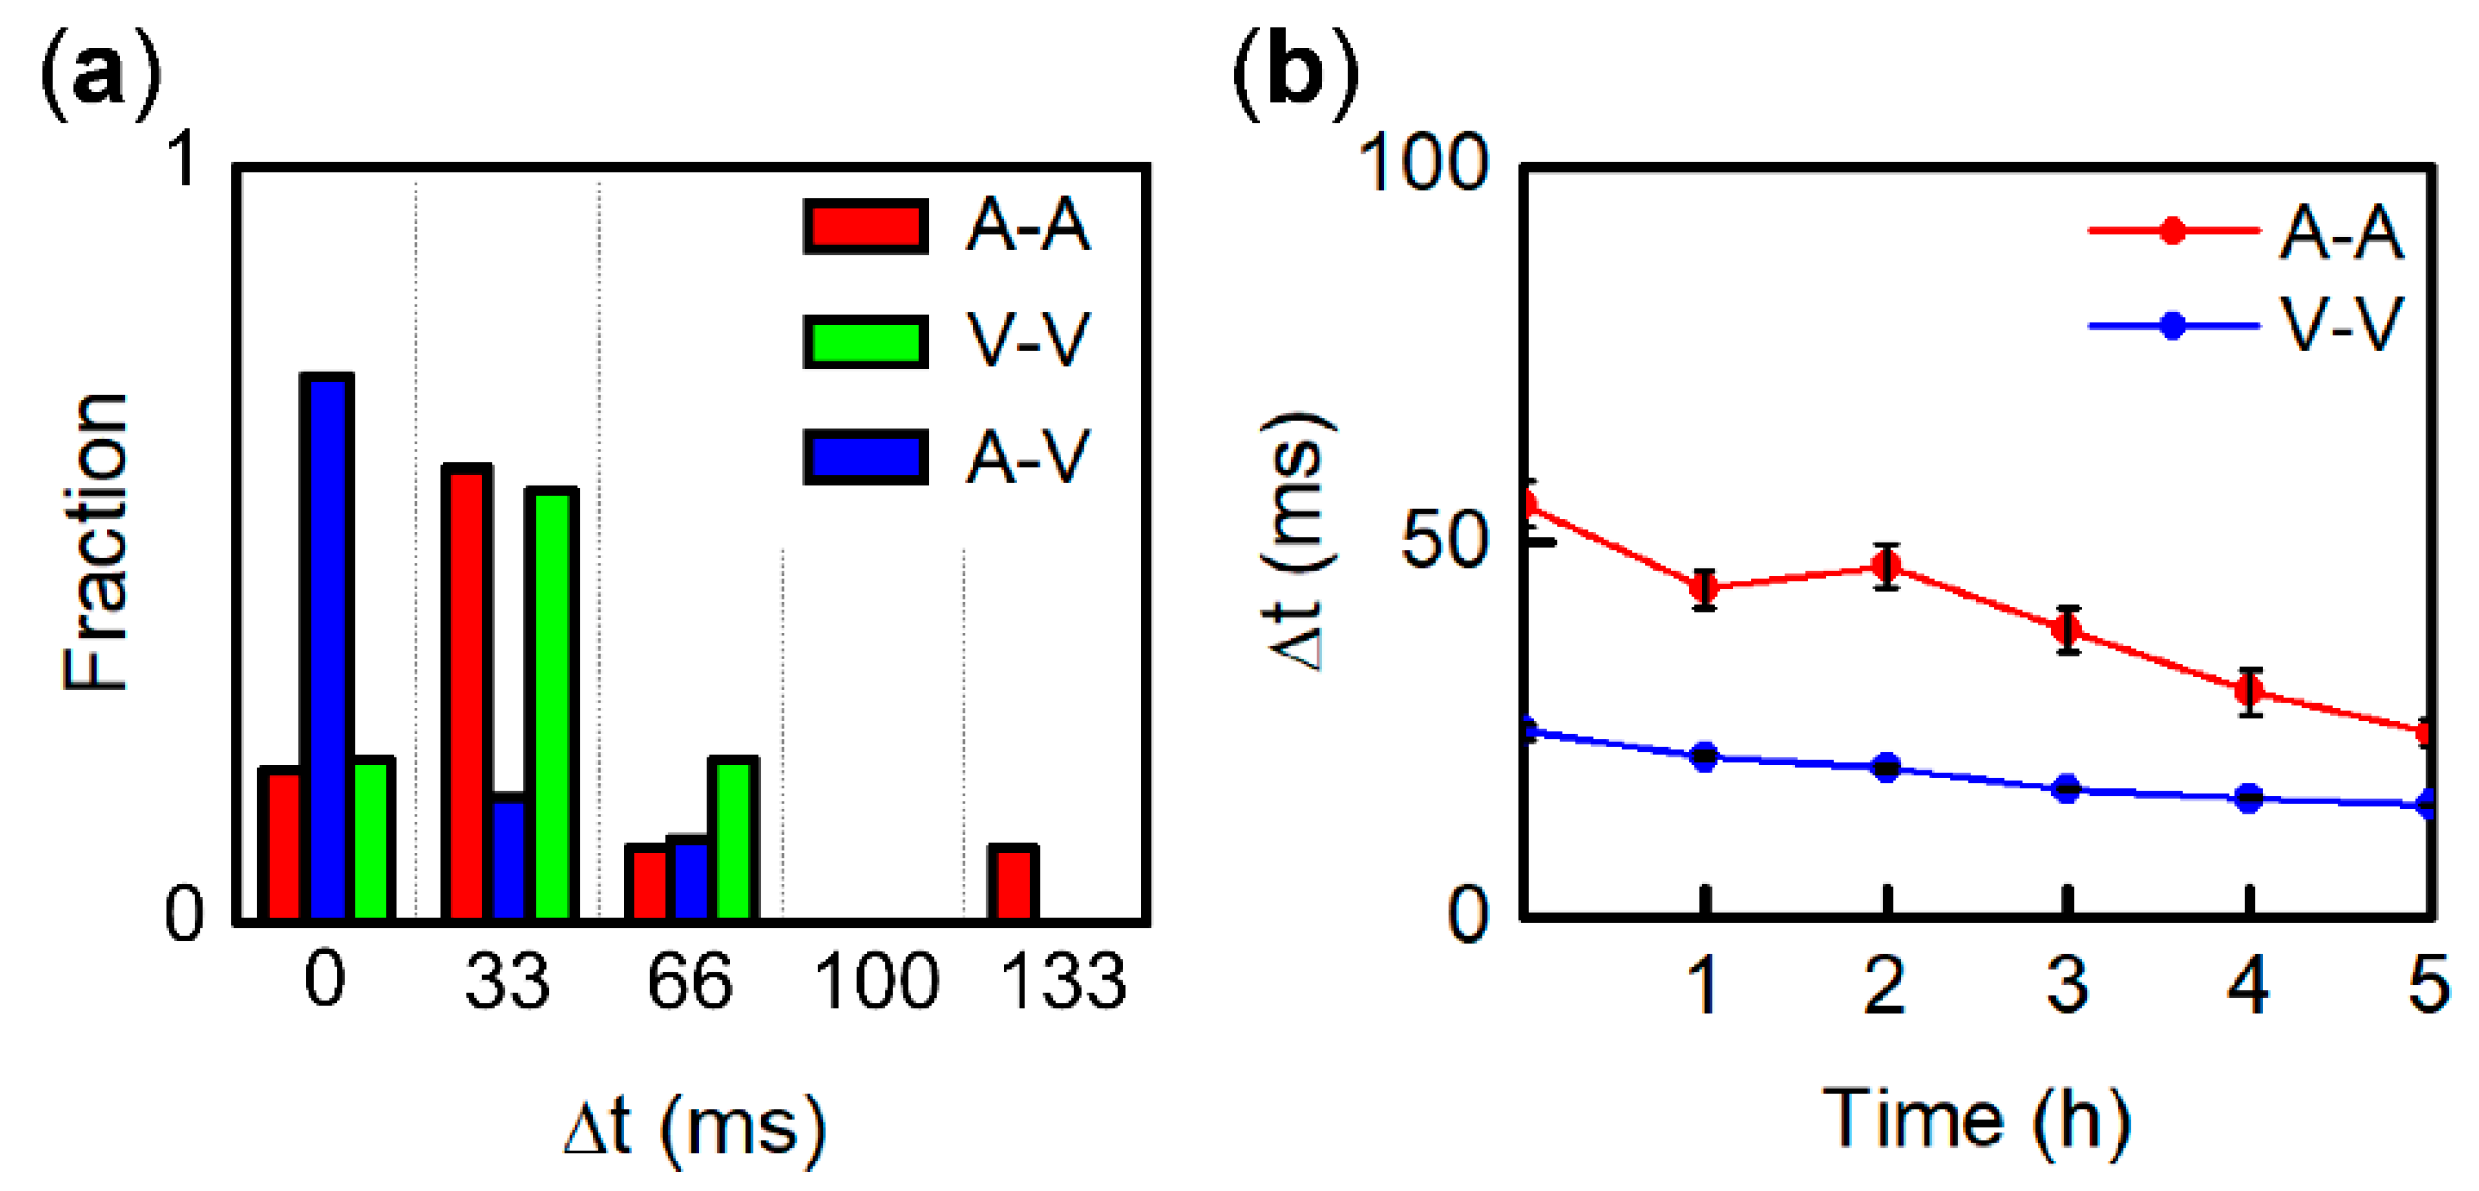
3.4. Entrainment Dynamics of Fragment Pairs after 1:1 Synchronization
3.5. Origin of IBI Fluctuation of Pacemaker
4. Discussion
4.1. Contractile Function of Single Heart Tissue Fragments
4.2. Regional Differences in Synchronization Time and Probability
5. Conclusions
Supplementary Materials
Author Contributions
Funding
Acknowledgments
Conflicts of Interest
References
- Glass, L. Synchronization and rhythmic processes in physiology. Nature 2001, 410, 277–284. [Google Scholar] [CrossRef] [PubMed]
- Nash, M.P.; Panfilov, A.V. Electromechanical model of excitable tissue to study reentrant cardiac arrhythmias. Progress Biophys. Mol. Biol. 2004, 85, 501–522. [Google Scholar] [CrossRef] [PubMed]
- Mangoni, M.E.; Nargeot, J. Genesis and Regulation of the Heart Automaticity. Physiol. Rev. 2008, 88, 919–982. [Google Scholar] [CrossRef] [PubMed]
- Mesirca, P.; Torrente, A.G.; Mangoni, M.E. Functional role of voltage gated Ca2+ channels in heart automaticity. Front. Physiol. 2015, 6. [Google Scholar] [CrossRef]
- Hirt Marc, N.; Hansen, A.; Eschenhagen, T. Cardiac Tissue Engineering. Circ. Res. 2014, 114, 354–367. [Google Scholar] [CrossRef]
- Devalla, H.D.; Passier, R. Cardiac differentiation of pluripotent stem cells and implications for modeling the heart in health and disease. Sci. Transl. Med. 2018, 10, eaah5457. [Google Scholar] [CrossRef]
- Marriott Henry, J.L. Atrioventricular Synchronization and Accrochage. Circulation 1956, 14, 38–43. [Google Scholar] [CrossRef]
- Segers, M.; Lequime, J.; Denolin, H. Synchronization of auricular and ventricular beats during complete heart block. Am. Heart J. 1947, 33, 685–691. [Google Scholar] [CrossRef]
- Sarre, A.; Maury, P.; Kucera, P.; Kappenberger, L.; Raddatz, E. Arrhythmogenesis in the Developing Heart During Anoxia-Reoxygenation and Hypothermia-Rewarming: An In Vitro Model. J. Cardiovasc. Electrophysiol. 2006, 17, 1350–1359. [Google Scholar] [CrossRef]
- De Souza, E.J.; Ahmed, W.; Chan, V.; Bashir, R.; Saif, T. Cardiac myocytes’ dynamic contractile behavior differs depending on heart segment. Biotechnol. Bioeng. 2013, 110, 628–636. [Google Scholar] [CrossRef]
- Nerbonne, J.M.; Kass, R.S. Molecular physiology of cardiac repolarization. Physiol. Rev. 2005, 85, 1205–1253. [Google Scholar] [CrossRef] [PubMed]
- Burstein, B.; Libby, E.; Calderone, A.; Nattel, S. Differential Behaviors of Atrial Versus Ventricular Fibroblasts. Circulation 2008, 117, 1630–1641. [Google Scholar] [CrossRef] [PubMed]
- Easty, G.C.; Easty, D.M. An Organ Culture System for the Examination of Tumor Invasion. Nature 1963, 199, 1104–1105. [Google Scholar] [CrossRef] [PubMed]
- Bracke, M.E.; Parmar, V.S.; Depass, A.L.; Stevens, C.V.; Vanhoecke, B.W.; Mareel, M.M. Chick heart invasion assay. Methods Mol. Biol. 2014, 1070, 93–106. [Google Scholar] [CrossRef]
- Strogatz, S.H.; Stewart, I. Coupled oscillators and biological synchronization. Sci. Am. 1993, 269, 102–109. [Google Scholar] [CrossRef]
- Masuda, S.; Shimizu, T.; Yamato, M.; Okano, T. Cell sheet engineering for heart tissue repair. Adv. Drug Deliv. Rev. 2008, 60, 277–285. [Google Scholar] [CrossRef] [PubMed]
- Nussinovitch, U.; Gepstein, L. Optogenetics for in vivo cardiac pacing and resynchronization therapies. Nat. Biotechnol. 2015, 33, 750. Available online: https://www.nature.com/articles/nbt.3268#supplementary-information (accessed on 16 June 2020). [CrossRef] [PubMed]
- Shimizu, T. Myocardial Tissue Engineering. In Tissue Engineering for Tissue and Organ Regeneration; Eberli, D., Ed.; InTech: London, UK, 2011. [Google Scholar] [CrossRef]
- Valentinuzzi, M.E. Why Cardiac Resynchronization Therapy (CRT) is Usually Prescribed along with Automatic Implantable Defibrillation (AID)? Is it a Sensible Decision? Historical Perspective. Int. J. Clin. Cardiol. 2017, 4, 7. [Google Scholar] [CrossRef][Green Version]
- Almeida, S.O.; Skelton, R.J.; Adigopula, S.; Ardehali, R. Arrhythmia in Stem Cell Transplantation. Card. Electrophysiol. Clin. 2015, 7, 357–370. [Google Scholar] [CrossRef]
- Jongsma, H.J.; Masson-Pévet, M.; Tsjernina, L. The development of beat-rate synchronization of rat myocyte pairs in cell culture. Basic Res. Cardiol. 1987, 82, 454–464. [Google Scholar] [CrossRef]
- Haraguchi, Y.; Shimizu, T.; Yamato, M.; Kikuchi, A.; Okano, T. Electrical coupling of cardiomyocyte sheets occurs rapidly via functional gap junction formation. Biomaterials 2006, 27, 4765–4774. [Google Scholar] [CrossRef] [PubMed]
- Ypey, D.L.; Clapham, D.E.; DeHaan, R.L. Development of electrical coupling and action potential synchrony between paired aggregates of embryonic heart cells. J. Membr. Biol. 1979, 51, 75–96. [Google Scholar] [CrossRef] [PubMed]
- Agladze, N.N.; Halaidych, O.V.; Tsvelaya, V.A.; Bruegmann, T.; Kilgus, C.; Sasse, P.; Agladze, K.I. Synchronization of excitable cardiac cultures of different origin. Biomater. Sci. 2017, 5, 1777–1785. [Google Scholar] [CrossRef] [PubMed]
- Chen, W.; Cheng, S.C.; Avalos, E.; Drugova, O.; Osipov, G.; Lai, P.-Y.; Chan, C.K. Synchronization in growing heterogeneous media. EPL (Europhy. Lett.) 2009, 86, 18001. [Google Scholar] [CrossRef]
- Kuramoto, Y.; Nishikawa, I. Statistical macrodynamics of large dynamical systems. Case of a phase transition in oscillator communities. J. Stat. Phys. 1987, 49, 569–605. [Google Scholar] [CrossRef]
- Kaneko, T.; Nomura, F.; Hamada, T.; Abe, Y.; Takamori, H.; Sakakura, T.; Takasuna, K.; Sanbuissho, A.; Hyllner, J.; Sartipy, P.; et al. On-chip in vitro cell-network pre-clinical cardiac toxicity using spatiotemporal human cardiomyocyte measurement on a chip. Sci. Rep. 2014, 4, 4670. Available online: https://www.nature.com/articles/srep04670#supplementary-information (accessed on 16 June 2020). [CrossRef]
- Christoph, J.; Chebbok, M.; Richter, C.; Schröder-Schetelig, J.; Bittihn, P.; Stein, S.; Uzelac, I.; Fenton, F.H.; Hasenfuß, G.; Gilmour, R.F., Jr.; et al. Electromechanical vortex filaments during cardiac fibrillation. Nature 2018, 555–667. Available online: https://www.nature.com/articles/nature26001#supplementary-information (accessed on 16 June 2020). [CrossRef]
- Walton, S.; Berger, K.; Thiyagalingam, J.; Duffy, B.; Fang, H.; Holloway, C.; Trefethen, A.E.; Chen, M. Visualizing Cardiovascular Magnetic Resonance (CMR) imagery: Challenges and opportunities. Progress Biophys. Mol. Biol. 2014, 115, 349–358. [Google Scholar] [CrossRef]
- Trayanova, N.A.; Chang, K.C. How computer simulations of the human heart can improve anti-arrhythmia therapy. J. Physiol. 2016, 594, 2483–2502. [Google Scholar] [CrossRef]
- Quarteroni, A.; Lassila, T.; Rossi, S.; Ruiz-Baier, R. Integrated Heart—Coupling multiscale and multiphysics models for the simulation of the cardiac function. Comput. Methods Appl. Mech. Eng. 2017, 314, 345–407. [Google Scholar] [CrossRef]
- Nordsletten, D.A.; Niederer, S.A.; Nash, M.P.; Hunter, P.J.; Smith, N.P. Coupling multi-physics models to cardiac mechanics. Progress Biophys. Mol. Biol. 2011, 104, 77–88. [Google Scholar] [CrossRef] [PubMed]
- Hayakawa, T.; Kunihiro, T.; Ando, T.; Kobayashi, S.; Matsui, E.; Yada, H.; Kanda, Y.; Kurokawa, J.; Furukawa, T. Image-based evaluation of contraction–relaxation kinetics of human-induced pluripotent stem cell-derived cardiomyocytes: Correlation and complementarity with extracellular electrophysiology. J. Mol. Cell. Cardiol. 2014, 77, 178–191. [Google Scholar] [CrossRef] [PubMed]
- Gorce, J.-M.; Friboulet, D.; Magnin, I.E. Estimation of three-dimensional cardiac velocity fields: Assessment of a differential method and application to three-dimensional CT data. Med. Image Anal. 1997, 1, 245–261. [Google Scholar] [CrossRef]
- DeHaan, R.L.; Fujii, S.; Satin, J. Cell Interactions in Cardiac Development. Dev. Growth Differ. 1990, 32, 233–241. [Google Scholar] [CrossRef]
- Sabourin, J.; Robin, E.; Raddatz, E. A key role of TRPC channels in the regulation of electromechanical activity of the developing heart. Cardiovasc. Res. 2011, 92, 226–236. [Google Scholar] [CrossRef]
- Jalife, J. Mutual entrainment and electrical coupling as mechanisms for synchronous firing of rabbit sino-atrial pace-maker cells. J. Physiol. 1984, 356, 221–243. [Google Scholar] [CrossRef]
- Verheijck, E.E.; Wilders, R.; Joyner, R.W.; Golod, D.A.; Kumar, R.; Jongsma, H.J.; Bouman, L.N.; Ginneken, A.C.G.V. Pacemaker Synchronization of Electrically Coupled Rabbit Sinoatrial Node Cells. J. Gen. Physiol. 1998, 111, 95–112. [Google Scholar] [CrossRef]
- Hwang, S.-M.; Kim, T.Y.; Lee, K.J. Complex-periodic spiral waves in confluent cardiac cell cultures induced by localized inhomogeneities. Proc. Natl. Acad. Sci. USA 2005, 102, 10363. [Google Scholar] [CrossRef]
- Colli Franzone, P.; Pavarino, L.F.; Scacchi, S. Effects of mechanical feedback on the stability of cardiac scroll waves: A bidomain electro-mechanical simulation study. Chaos: Interdiscip. J. Nonlinear Sci. 2017, 27, 093905. [Google Scholar] [CrossRef]
- Borek, B.; Shajahan, T.K.; Gabriels, J.; Hodge, A.; Glass, L.; Shrier, A. Pacemaker interactions induce reentrant wave dynamics in engineered cardiac culture. Chaos Interdiscip. J. Nonlinear Sci. 2012, 22, 033132. [Google Scholar] [CrossRef]
- de Diego, C.; Pai, R.K.; Dave, A.S.; Lynch, A.; Thu, M.; Chen, F.; Xie, L.-H.; Weiss, J.N.; Valderrábano, M. Spatially discordant alternans in cardiomyocyte monolayers. Am. J. Physiol.-Heart Circ. Physiol. 2008, 294, H1417–H1425. [Google Scholar] [CrossRef] [PubMed]
- Sato, D.; Xie, L.-H.; Sovari, A.A.; Tran, D.X.; Morita, N.; Xie, F.; Karagueuzian, H.; Garfinkel, A.; Weiss, J.N.; Qu, Z. Synchronization of chaotic early afterdepolarizations in the genesis of cardiac arrhythmias. Proc. Natl. Acad. Sci. 2009, 106, 2983. [Google Scholar] [CrossRef] [PubMed]
- Engler, A.J.; Carag-Krieger, C.; Johnson, C.P.; Raab, M.; Tang, H.-Y.; Speicher, D.W.; Sanger, J.W.; Sanger, J.M.; Discher, D.E. Embryonic cardiomyocytes beat best on a matrix with heart-like elasticity: Scar-like rigidity inhibits beating. J. Cell Sci. 2008, 121, 3794. [Google Scholar] [CrossRef] [PubMed]
- van Putten, S.; Shafieyan, Y.; Hinz, B. Mechanical control of cardiac myofibroblasts. J. Mol. Cell. Cardiol. 2016, 93, 133–142. [Google Scholar] [CrossRef] [PubMed]
- Thompson Susan, A.; Copeland Craig, R.; Reich Daniel, H.; Tung, L. Mechanical Coupling Between Myofibroblasts and Cardiomyocytes Slows Electric Conduction in Fibrotic Cell Monolayers. Circulation 2011, 123, 2083–2093. [Google Scholar] [CrossRef]
- Rother, J.; Richter, C.; Turco, L.; Knoch, F.; Mey, I.; Luther, S.; Janshoff, A.; Bodenschatz, E.; Tarantola, M. Crosstalk of cardiomyocytes and fibroblasts in co-cultures. Open Biol. 2015, 5, 150038. [Google Scholar] [CrossRef]
- Jansen, J.A.; van Veen, T.A.B.; de Bakker, J.M.T.; van Rijen, H.V.M. Cardiac connexins and impulse propagation. J. Mol. Cell. Cardiol. 2010, 48, 76–82. [Google Scholar] [CrossRef]
- Oyamada, M.; Kimura, H.; Oyamada, Y.; Miyamoto, A.; Ohshika, H.; Mori, M. The Expression, Phosphorylation, and Localization of Connexin 43 and Gap-Junctional Intercellular Communication during the Establishment of a Synchronized Contraction of Cultured Neonatal Rat Cardiac Myocytes. Exp. Cell Res. 1994, 212, 351–358. [Google Scholar] [CrossRef]
- Kojima, K.; Kaneko, T.; Yasuda, K. Role of the community effect of cardiomyocyte in the entrainment and reestablishment of stable beating rhythms. Biochem. Biophys. Res. Commun. 2006, 351, 209–215. [Google Scholar] [CrossRef]
- Christoffels, V.M.; Moorman, A.F. Development of the cardiac conduction system: Why are some regions of the heart more arrhythmogenic than others? Circ. Arrhythm. Electrophysiol. 2009, 2, 195–207. [Google Scholar] [CrossRef]
- Zhang, H.; Shepherd, N.; Creazzo, T.L. Temperature-sensitive TREK currents contribute to setting the resting membrane potential in embryonic atrial myocytes. J. Physiol. 2008, 586, 3645–3656. [Google Scholar] [CrossRef] [PubMed]
- Fagotto, F. The cellular basis of tissue separation. Development 2014, 141, 3303. [Google Scholar] [CrossRef] [PubMed]
- Zlochiver, S.; Muñoz, V.; Vikstrom, K.L.; Taffet, S.M.; Berenfeld, O.; Jalife, J. Electrotonic Myofibroblast-to-Myocyte Coupling Increases Propensity to Reentrant Arrhythmias in Two-Dimensional Cardiac Monolayers. Biophys. J. 2008, 95, 4469–4480. [Google Scholar] [CrossRef] [PubMed]
- Ongstad, E.; Kohl, P. Fibroblast–myocyte coupling in the heart: Potential relevance for therapeutic interventions. J. Mol. Cell. Cardiol. 2016, 91, 238–246. [Google Scholar] [CrossRef]
- MacCannell, K.A.; Bazzazi, H.; Chilton, L.; Shibukawa, Y.; Clark, R.B.; Giles, W.R. A mathematical model of electrotonic interactions between ventricular myocytes and fibroblasts. Biophys. J. 2007, 92, 4121–4132. [Google Scholar] [CrossRef] [PubMed]
- Ponard, J.G.C.; Kondratyev, A.A.; Kucera, J.P. Mechanisms of Intrinsic Beating Variability in Cardiac Cell Cultures and Model Pacemaker Networks. Biophys. J. 2007, 92, 3734–3752. [Google Scholar] [CrossRef]
- Jongsma, H.J.; Wilders, R. Gap junctions in cardiovascular disease. Circ. Res. 2000, 86, 1193–1197. [Google Scholar] [CrossRef]
- Schroer, A.K.; Merryman, W.D. Mechanobiology of myofibroblast adhesion in fibrotic cardiac disease. J. Cell Sci. 2015, 128, 1865. [Google Scholar] [CrossRef]
- Zeisberg, E.M.; Kalluri, R. Origins of cardiac fibroblasts. Circ. Res. 2010, 107, 1304–1312. [Google Scholar] [CrossRef]
- Hansen, A.; Eder, A.; Bönstrup, M.; Flato, M.; Mewe, M.; Schaaf, S.; Aksehirlioglu, B.; Schwörer, A.; Uebeler, J.; Eschenhagen, T. Development of a Drug Screening Platform Based on Engineered Heart Tissue. Circ. Res. 2010, 107, 35–44. [Google Scholar] [CrossRef]


© 2020 by the authors. Licensee MDPI, Basel, Switzerland. This article is an open access article distributed under the terms and conditions of the Creative Commons Attribution (CC BY) license (http://creativecommons.org/licenses/by/4.0/).
Share and Cite
Arai, S.; Lloyd, K.; Takahashi, T.; Mammoto, K.; Miyazawa, T.; Tamura, K.; Kaneko, T.; Ishida, K.; Moriyama, Y.; Mitsui, T. Dynamic Properties of Heart Fragments from Different Regions and Their Synchronization. Bioengineering 2020, 7, 81. https://doi.org/10.3390/bioengineering7030081
Arai S, Lloyd K, Takahashi T, Mammoto K, Miyazawa T, Tamura K, Kaneko T, Ishida K, Moriyama Y, Mitsui T. Dynamic Properties of Heart Fragments from Different Regions and Their Synchronization. Bioengineering. 2020; 7(3):81. https://doi.org/10.3390/bioengineering7030081
Chicago/Turabian StyleArai, Shin, Kento Lloyd, Tomonori Takahashi, Kazuki Mammoto, Takashi Miyazawa, Kei Tamura, Tomoyuki Kaneko, Kentaro Ishida, Yuuta Moriyama, and Toshiyuki Mitsui. 2020. "Dynamic Properties of Heart Fragments from Different Regions and Their Synchronization" Bioengineering 7, no. 3: 81. https://doi.org/10.3390/bioengineering7030081
APA StyleArai, S., Lloyd, K., Takahashi, T., Mammoto, K., Miyazawa, T., Tamura, K., Kaneko, T., Ishida, K., Moriyama, Y., & Mitsui, T. (2020). Dynamic Properties of Heart Fragments from Different Regions and Their Synchronization. Bioengineering, 7(3), 81. https://doi.org/10.3390/bioengineering7030081