A Multidisciplinary Approach toward High Throughput Label-Free Cytotoxicity Monitoring of Superparamagnetic Iron Oxide Nanoparticles


Abstract
1. Introduction
1.1. SPIONs Applications
- MRI Contrast Agent: MRI is used to visualize and track a diseased portion of the brain. The strength of the signal is influenced by the two-relaxation times of water protons, the longitudinal (TL) and transverse (TT) [23,24]. For the image refinement, contrast agents are utilized to decrease TL and TT relaxation times. The SPIONs act as negative contrast agents, producing a negative signal on TT weighted images and enhancing TT contrast [25].
- Tumor Diagnostics and Therapy: Functionalized SPIONs can play an essential role in the delivery of therapeutic components and subsequently for initiating tumor cell death [26]. A biocompatible coating on SPIONs provides suitable functional groups for conjugating with tumor cells [27,28]. For instance, SPIONs can be attached to the anti-IL-1β monoclonal antibody to be used for MRI diagnoses and targeted therapy by neutralizing IL-1β which is overexpressed in the epileptogenic area of an acute rat model with temporal lobe epilepsy [29], a disease in the brain associated with inflammation [30].
- Thermotherapy: To implement a hyperthermia treatment, SPIONs can be introduced in the body through a magnetic delivery system or a local injection to the affected area [31]. SPIONs can vibrate and produce heat in an interchanging magnetic field [8,9]. The generated heat can be used for thermotherapy purposes.
- Crossing BBB: As previously mentioned, recent studies have reported that SPIONs can enter the brain without causing damage to the blood-brain barrier [32]. To date, many types of research have been conducted to understand the BBB mechanisms and enhance the BBB permeability using functionalized SPIONs. Among these efforts is an optimized in-vitro BBB model, which was recently being reported using mouse brain endothelial cells and astrocytes [33,34]. Also, experimental data demonstrated how one could modify SPIONs to deliver drugs to the brain to more effectively treat a wide range of neurological disorders [35].
- Drug Delivery: SPIONs are widely used because of their larger surface to mass ratio [36] compared to other NPs, their quantum properties [37] and their ability to absorb [38] and carry other compounds. The aims for such NP entrapment of drugs are either enhanced delivery to or uptake by, target cells and a reduction in the toxicity of the free drug to non-target organs. Both situations will increase the ratio between the doses resulting in therapeutic efficacy and toxicity to other organ systems. For these reasons, the creation of long-lived and target-specific NPs and accurate toxicity studies should be performed to increase the advantages of these particles for the applications mentioned earlier [10]. It is noteworthy that SPIONs are not stable under physiological conditions due to the reduction of electrostatic repulsion, which causes NP aggregation. To re-disperse SPIONs in biological media, further surface modifications are applied in particular on the commercially available SPIONs [39].
1.2. Effects of NPs on Cells: In-Vitro Studies
1.2.1. Fundamental Effects
- Effect on cell membrane: All types of NPs including SPIONs can be assimilated into the cell via different processes and all these types passe through the protective barrier of the cell—the cell membrane. As NPs make their way through the cell membrane, they affect the major components of the membrane, the proteins [50,51] and the lipid bilayer [52].
- Effect on Lysosomes: A study using silica (SiO2) NPs on human cervix carcinoma (HeLa) cells, had shown that NPs disrupt normal activities of the lysosomes by causing damage in their cargo delivery via autophagosomes. Although the autophagy-mediated protein turnover and degradation of internalized epidermal growth factor were affected, this did not induce cell death [53].
- Effect on cytoplasmic organelles: Experimental investigation has shown evidence that NPs affect cytoplasmic organelles like the mitochondria [54] and nucleus [55]. Another study had shown that even if using gold nanoparticles (GNPs) does not cause accumulation within the mitochondria, NPs close to the organelle could still enhance damage due to the delocalization of photoelectrons from the cytosol. Furthermore, the presence of GNPs in the cytosol increases the energy deposition in the mitochondrial volume more than the presence of GNPs within the nuclear volume [56].
- Other effects: The exposure of the cell to NPs brings about harmful effects such as damage mitochondrial function, inflammation, the formation of apoptotic bodies, membrane leakage of lactate dehydrogenase, reactive oxygen species (ROS) production, increase in micronuclei, and chromosome condensation [49]. In such cytotoxicity studies, there are various indicators such as micronuclei that are an indicator of gross chromosomal damage that is used to measure genotoxicity.
1.2.2. In-vitro Toxicity Assays
2. Related Works
2.1. SPIONs’ Cytotoxicity Studies
2.2. High Throughput Impedance-Based Cellular Analysis
3. Materials and Methods
3.1. Materials
3.1.1. Organism
3.1.2. Chemicals
Solutions and Media for Cell Culture
3.1.3. Consumables
Consumables for Biological Sample Preparation and Test
Consumable for Impedance Analysis
3.1.4. Equipment
Required Equipment for Biological Sample Preparation and Test
Required Equipment and Accessories for Microscopic Analysis
Required Equipment for Impedance Analysis
3.1.5. Software
3.2. Methods
3.2.1. Sample Preparation and Biological Test
Preparation of SPIONs with Different Concentration
Cell Culture and Maintenance
Cell Concentration Preparation and Inoculation
Preparation for TBDE Test Mixture
Cell Counting and Cell Viability Test
3.2.2. Microscopic Methods
3.2.3. Electrical Methods
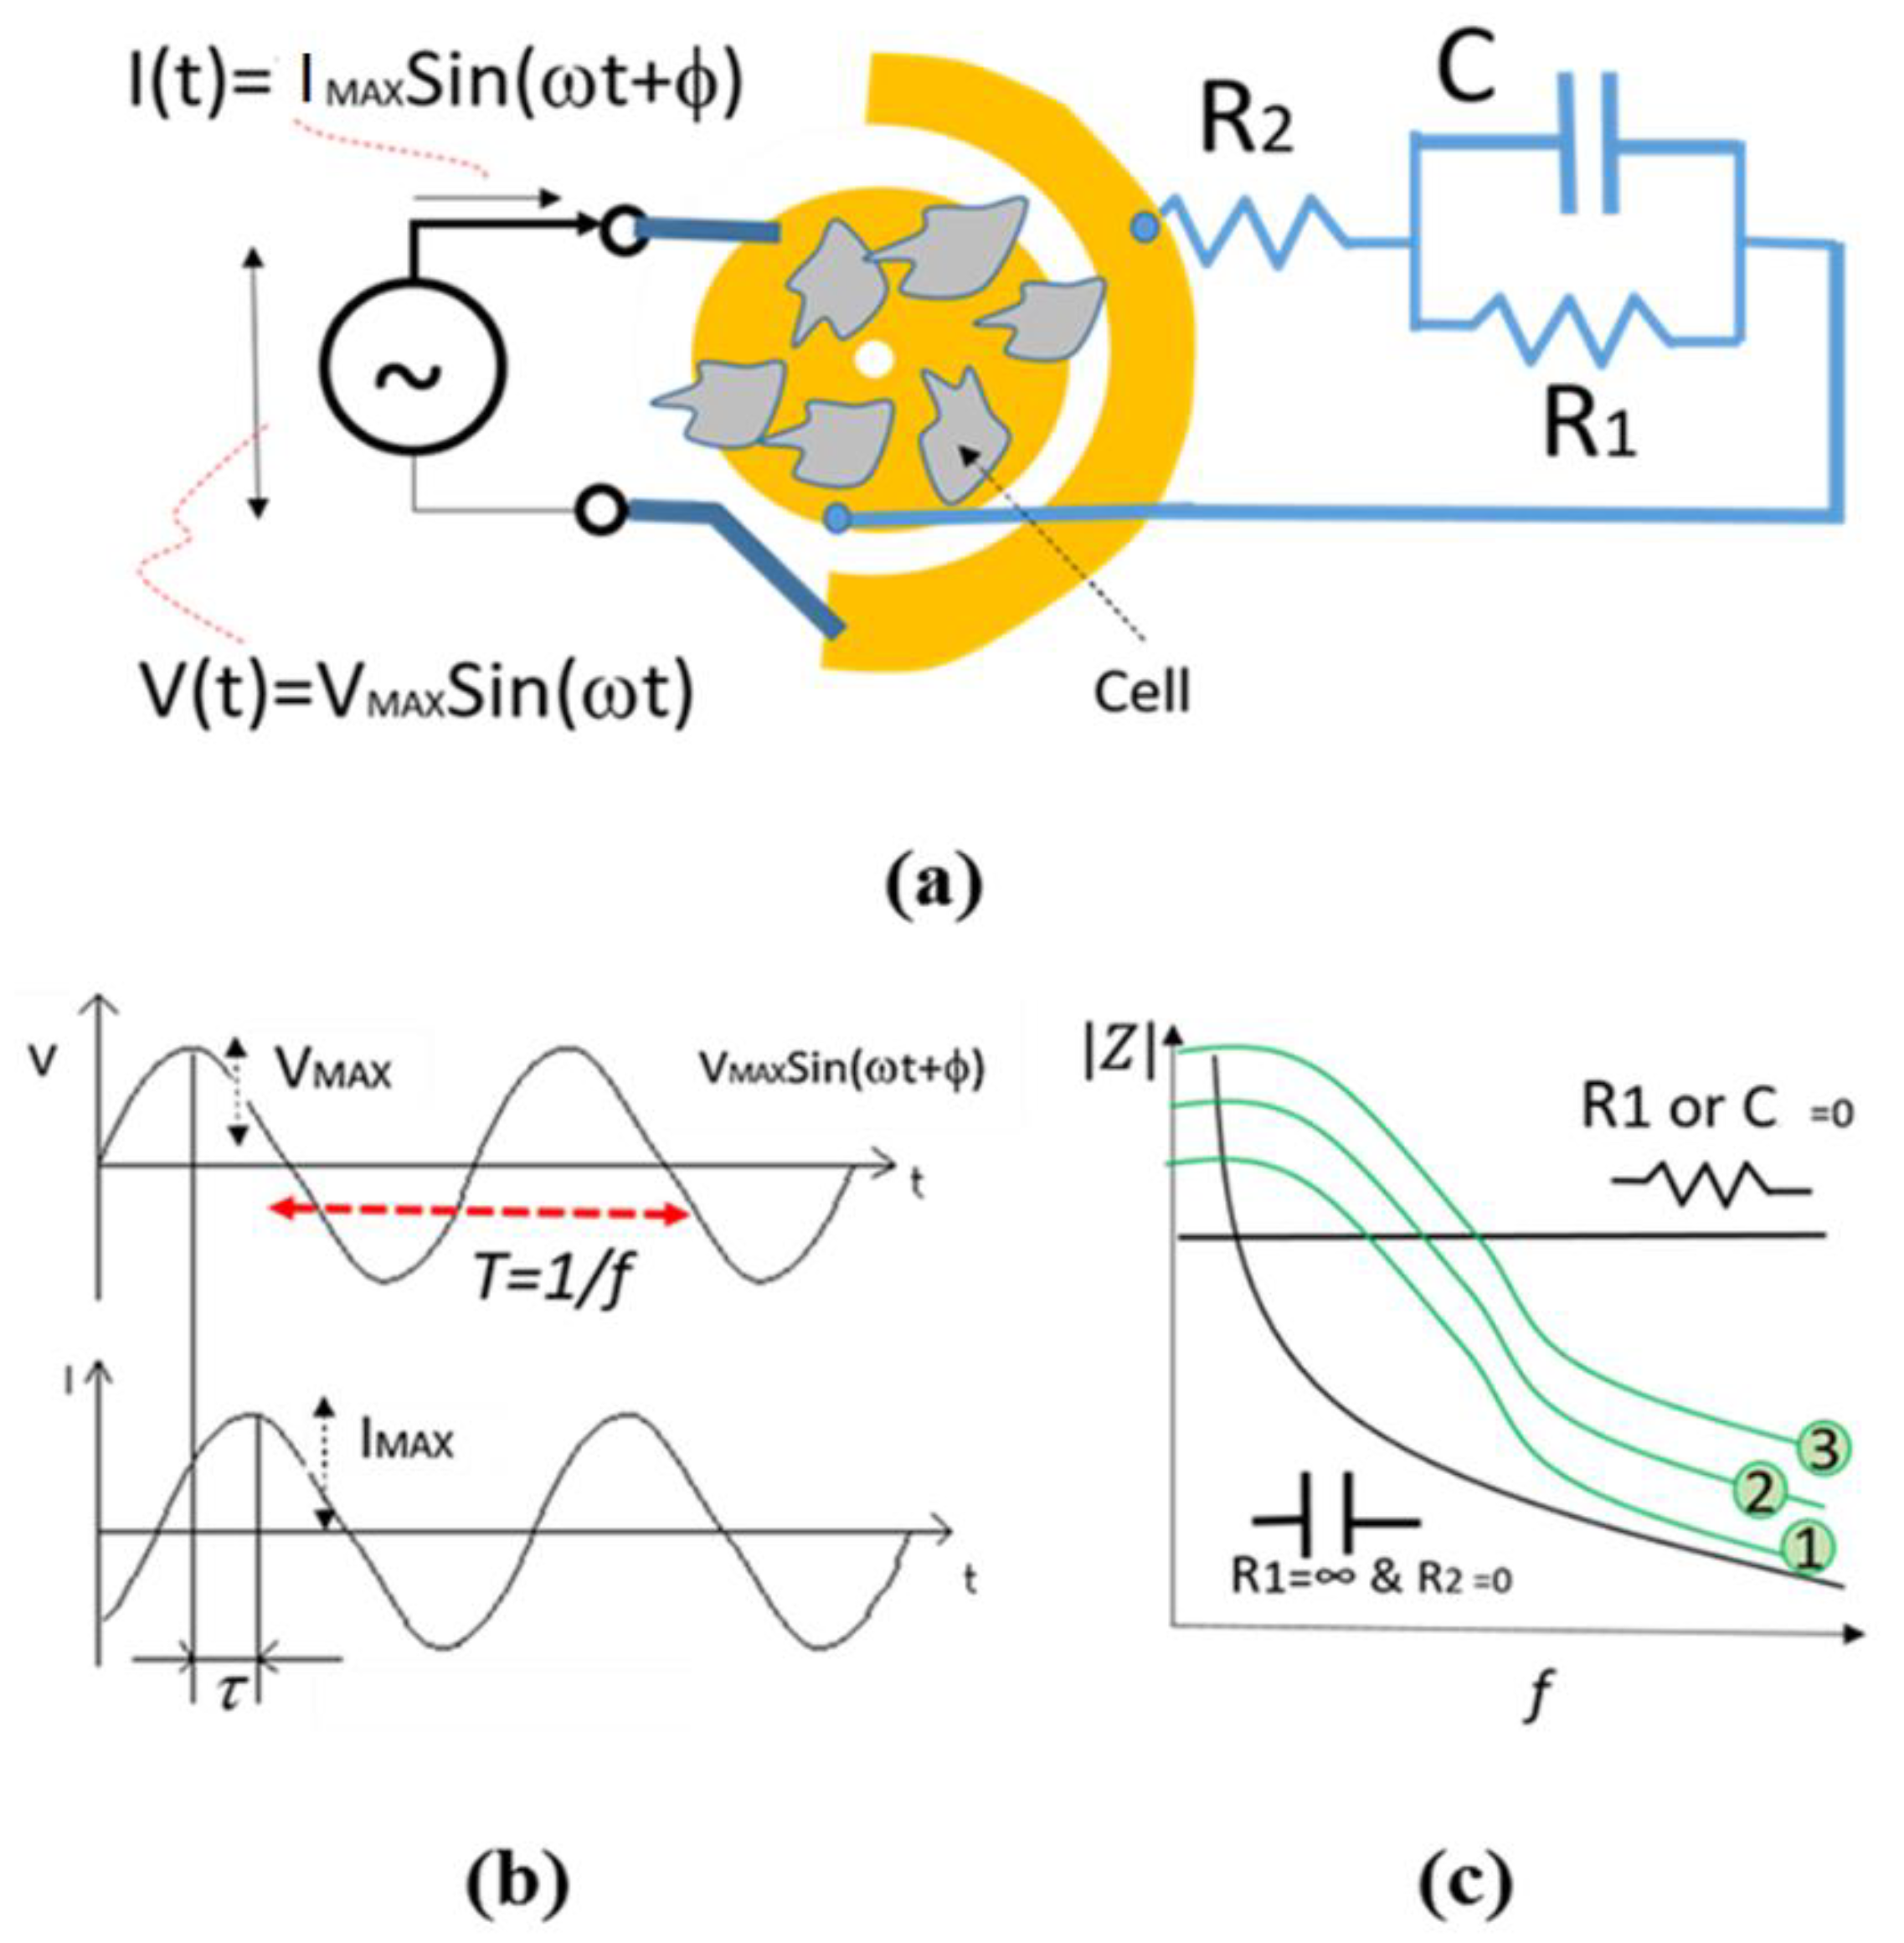
The Principle of Impedance Spectroscopy Technique for Cellular Analysis
Impedance-Based Cellular Analysis
Maximum Surface Area
Electrical Model
Impedance Measurement Assay
4. Results and Discussions
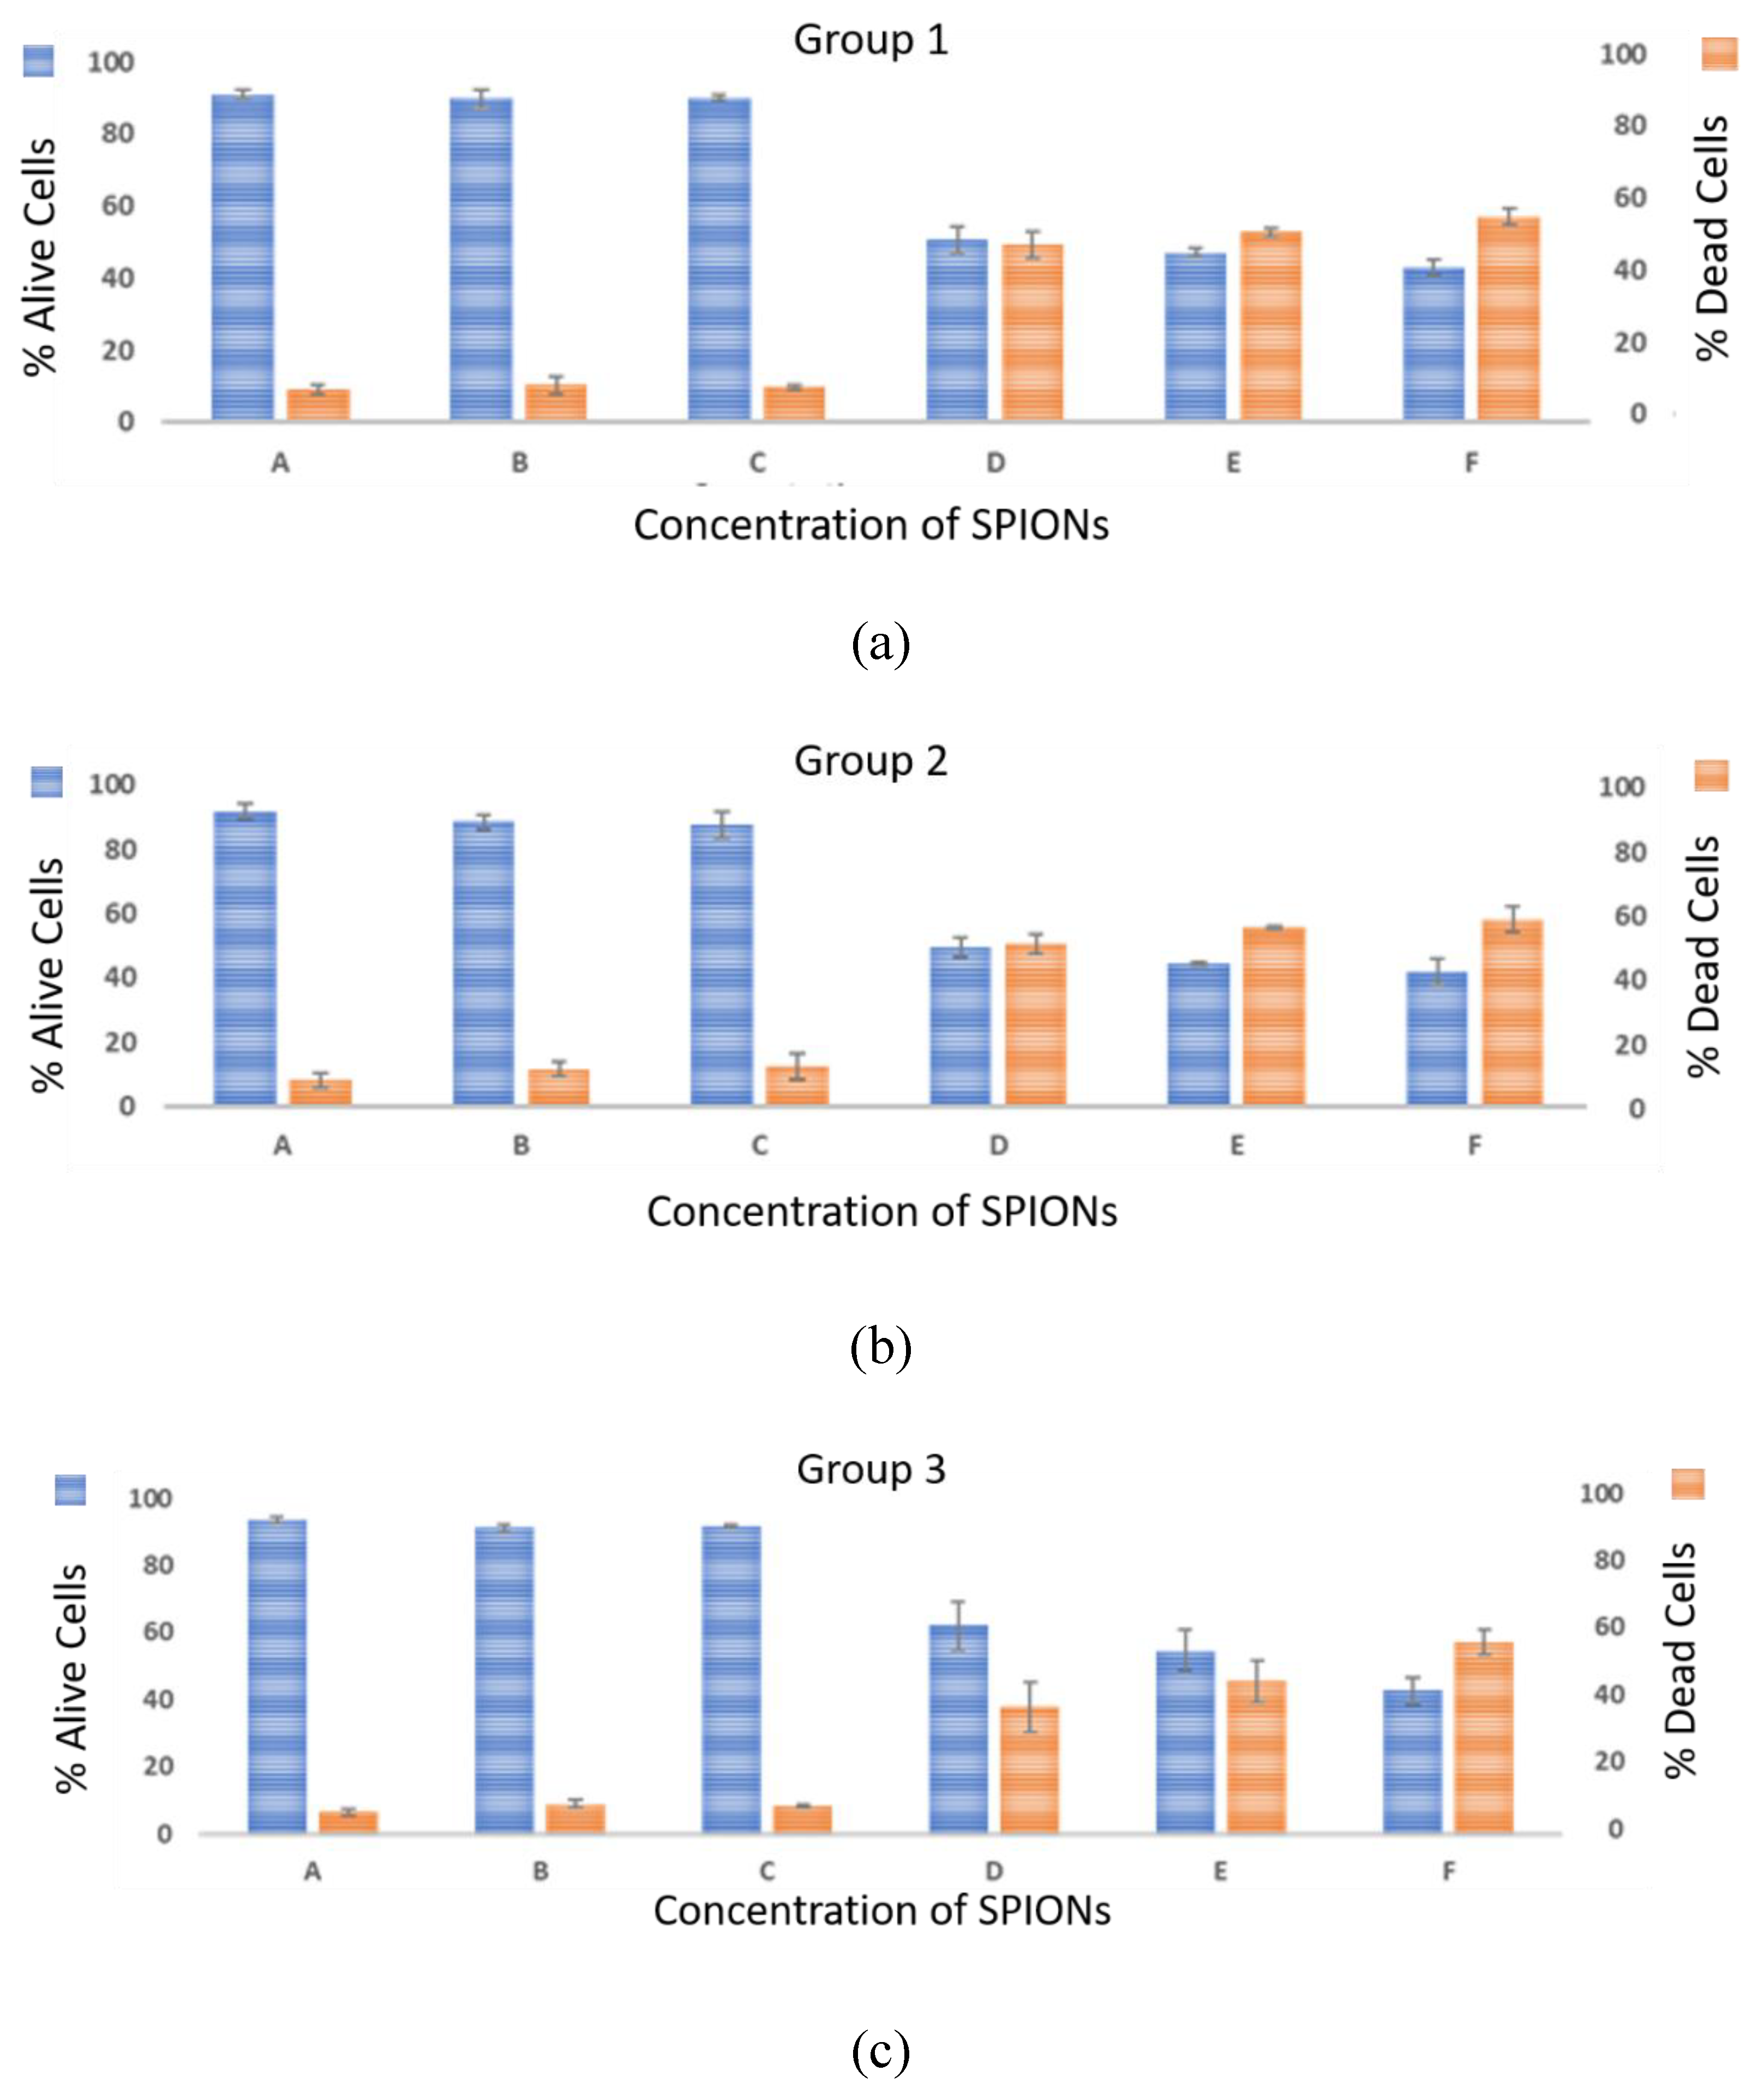
- Biological method: The cell viability tests were performed using the trypan blue exclusion assay. This technique was used to count the number of viable cells after 72 h (T8) of exposure.
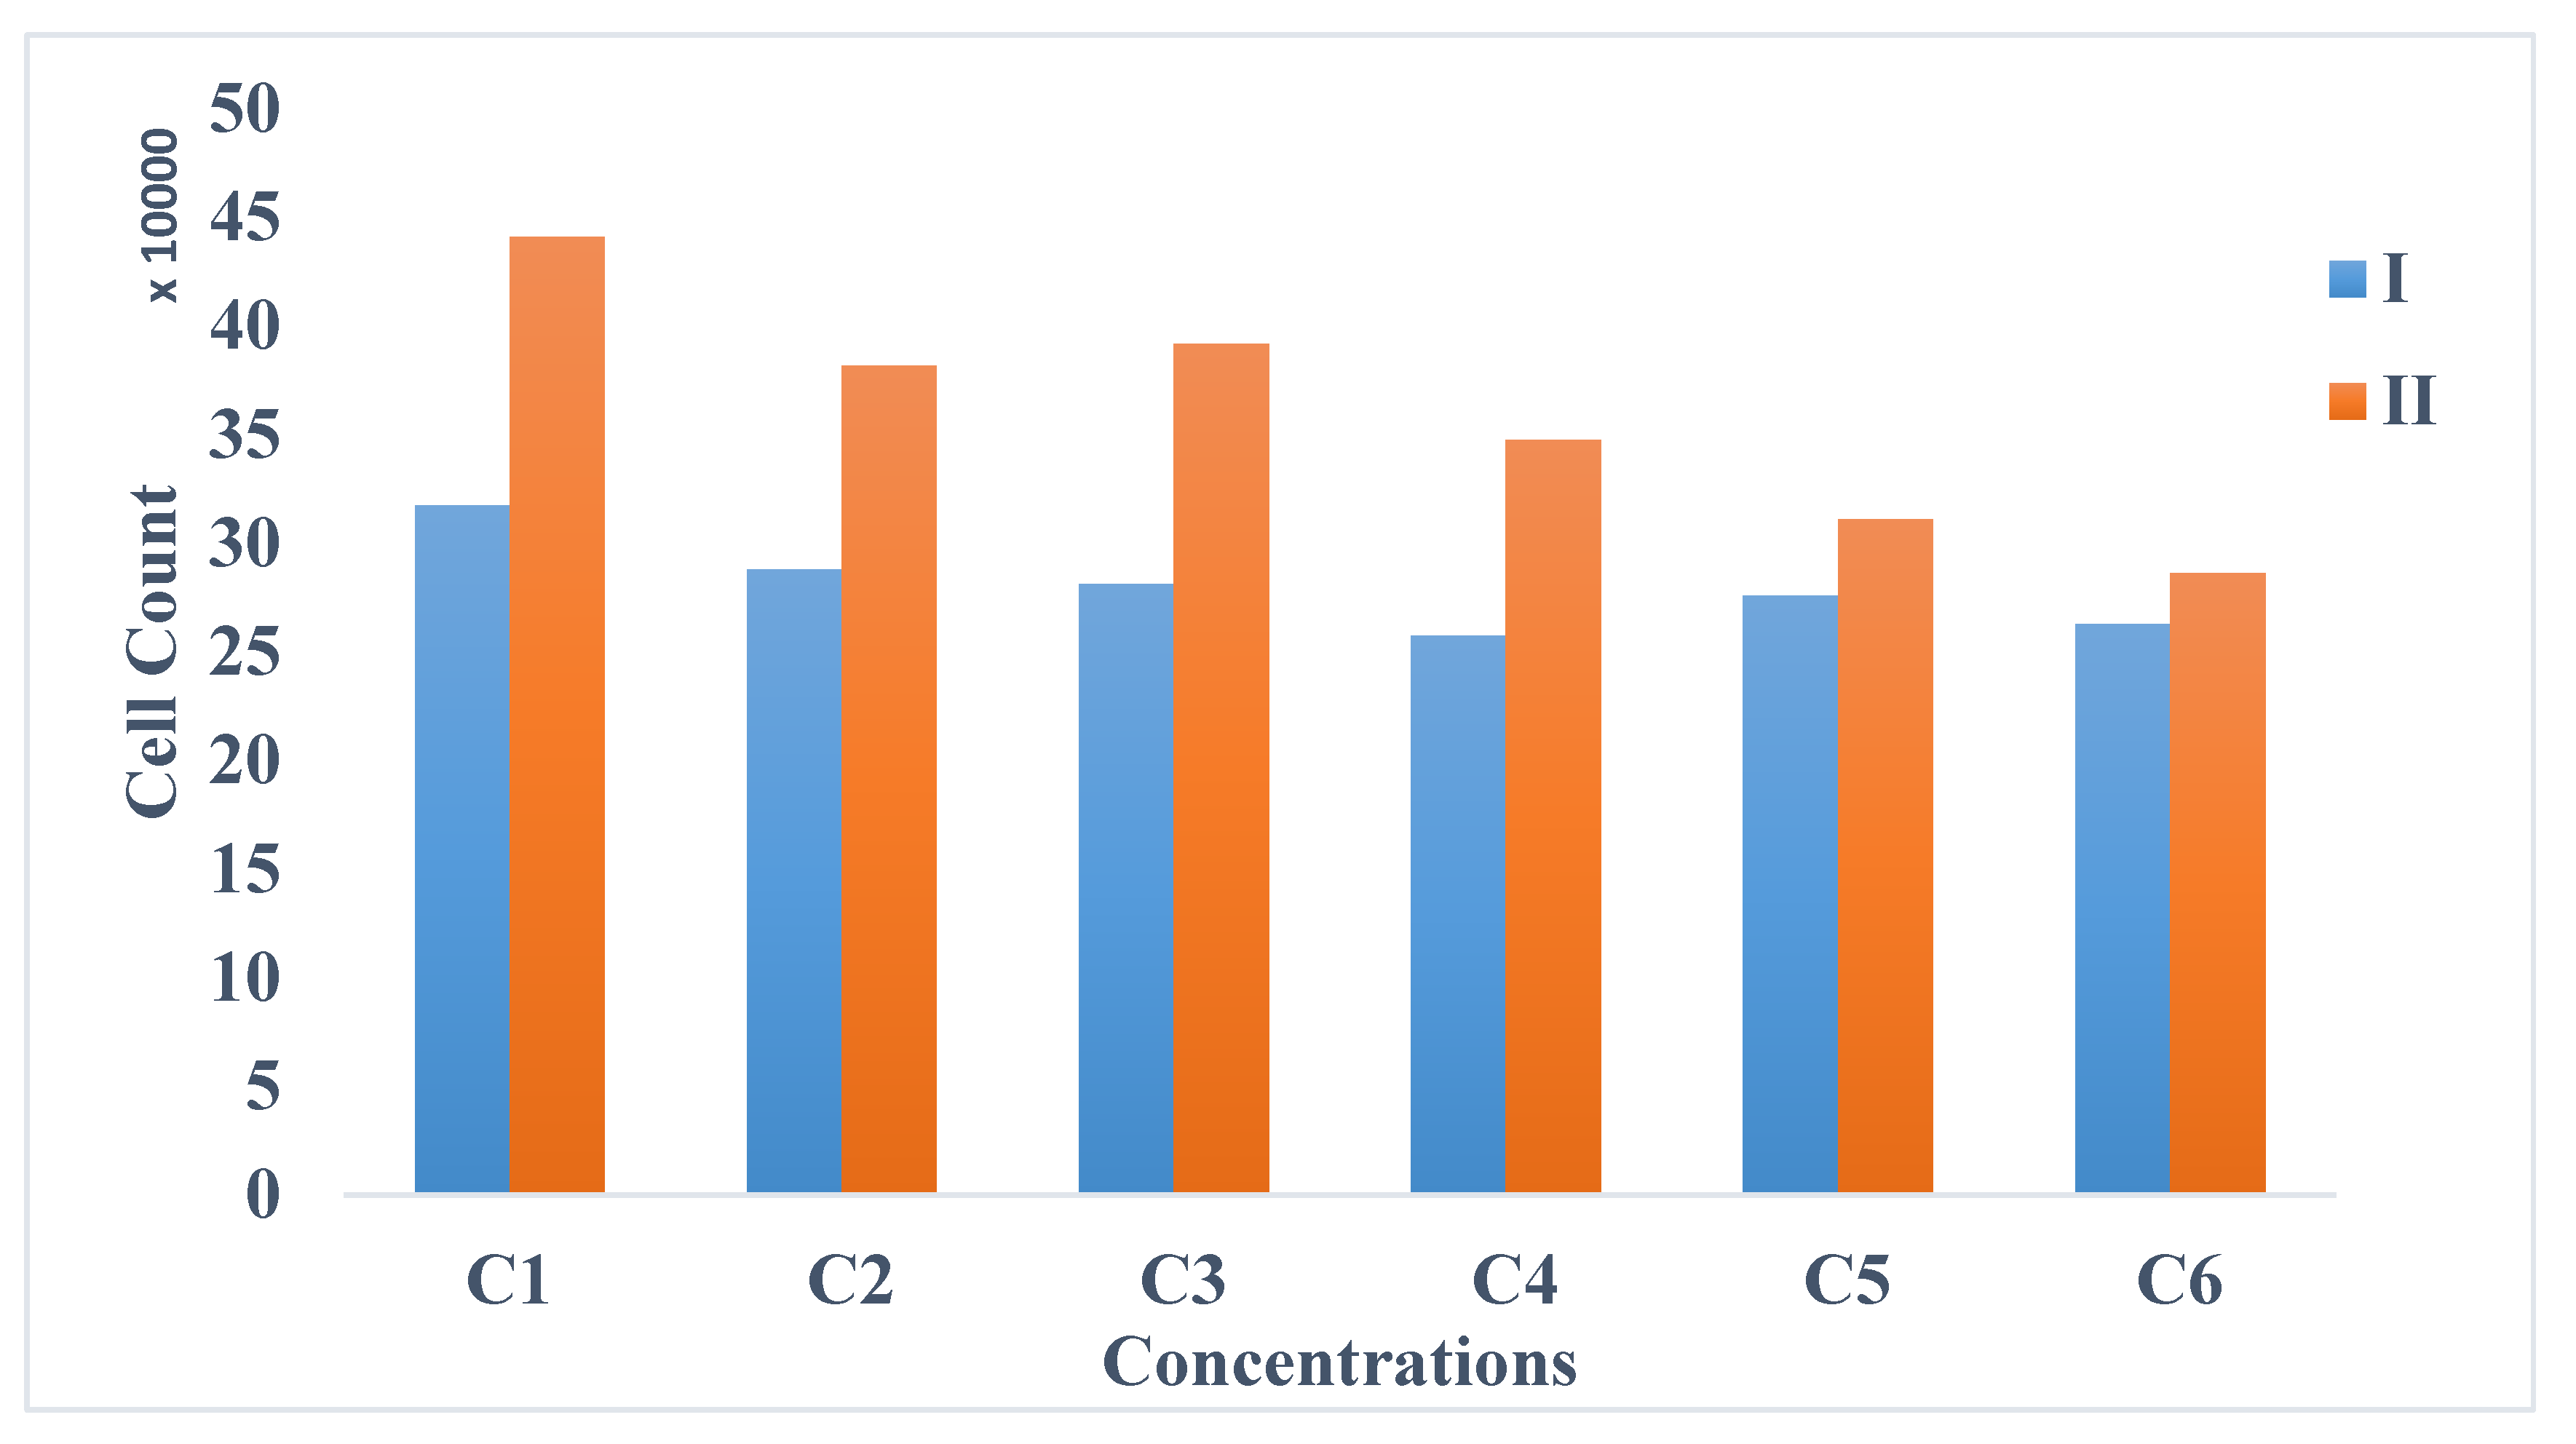
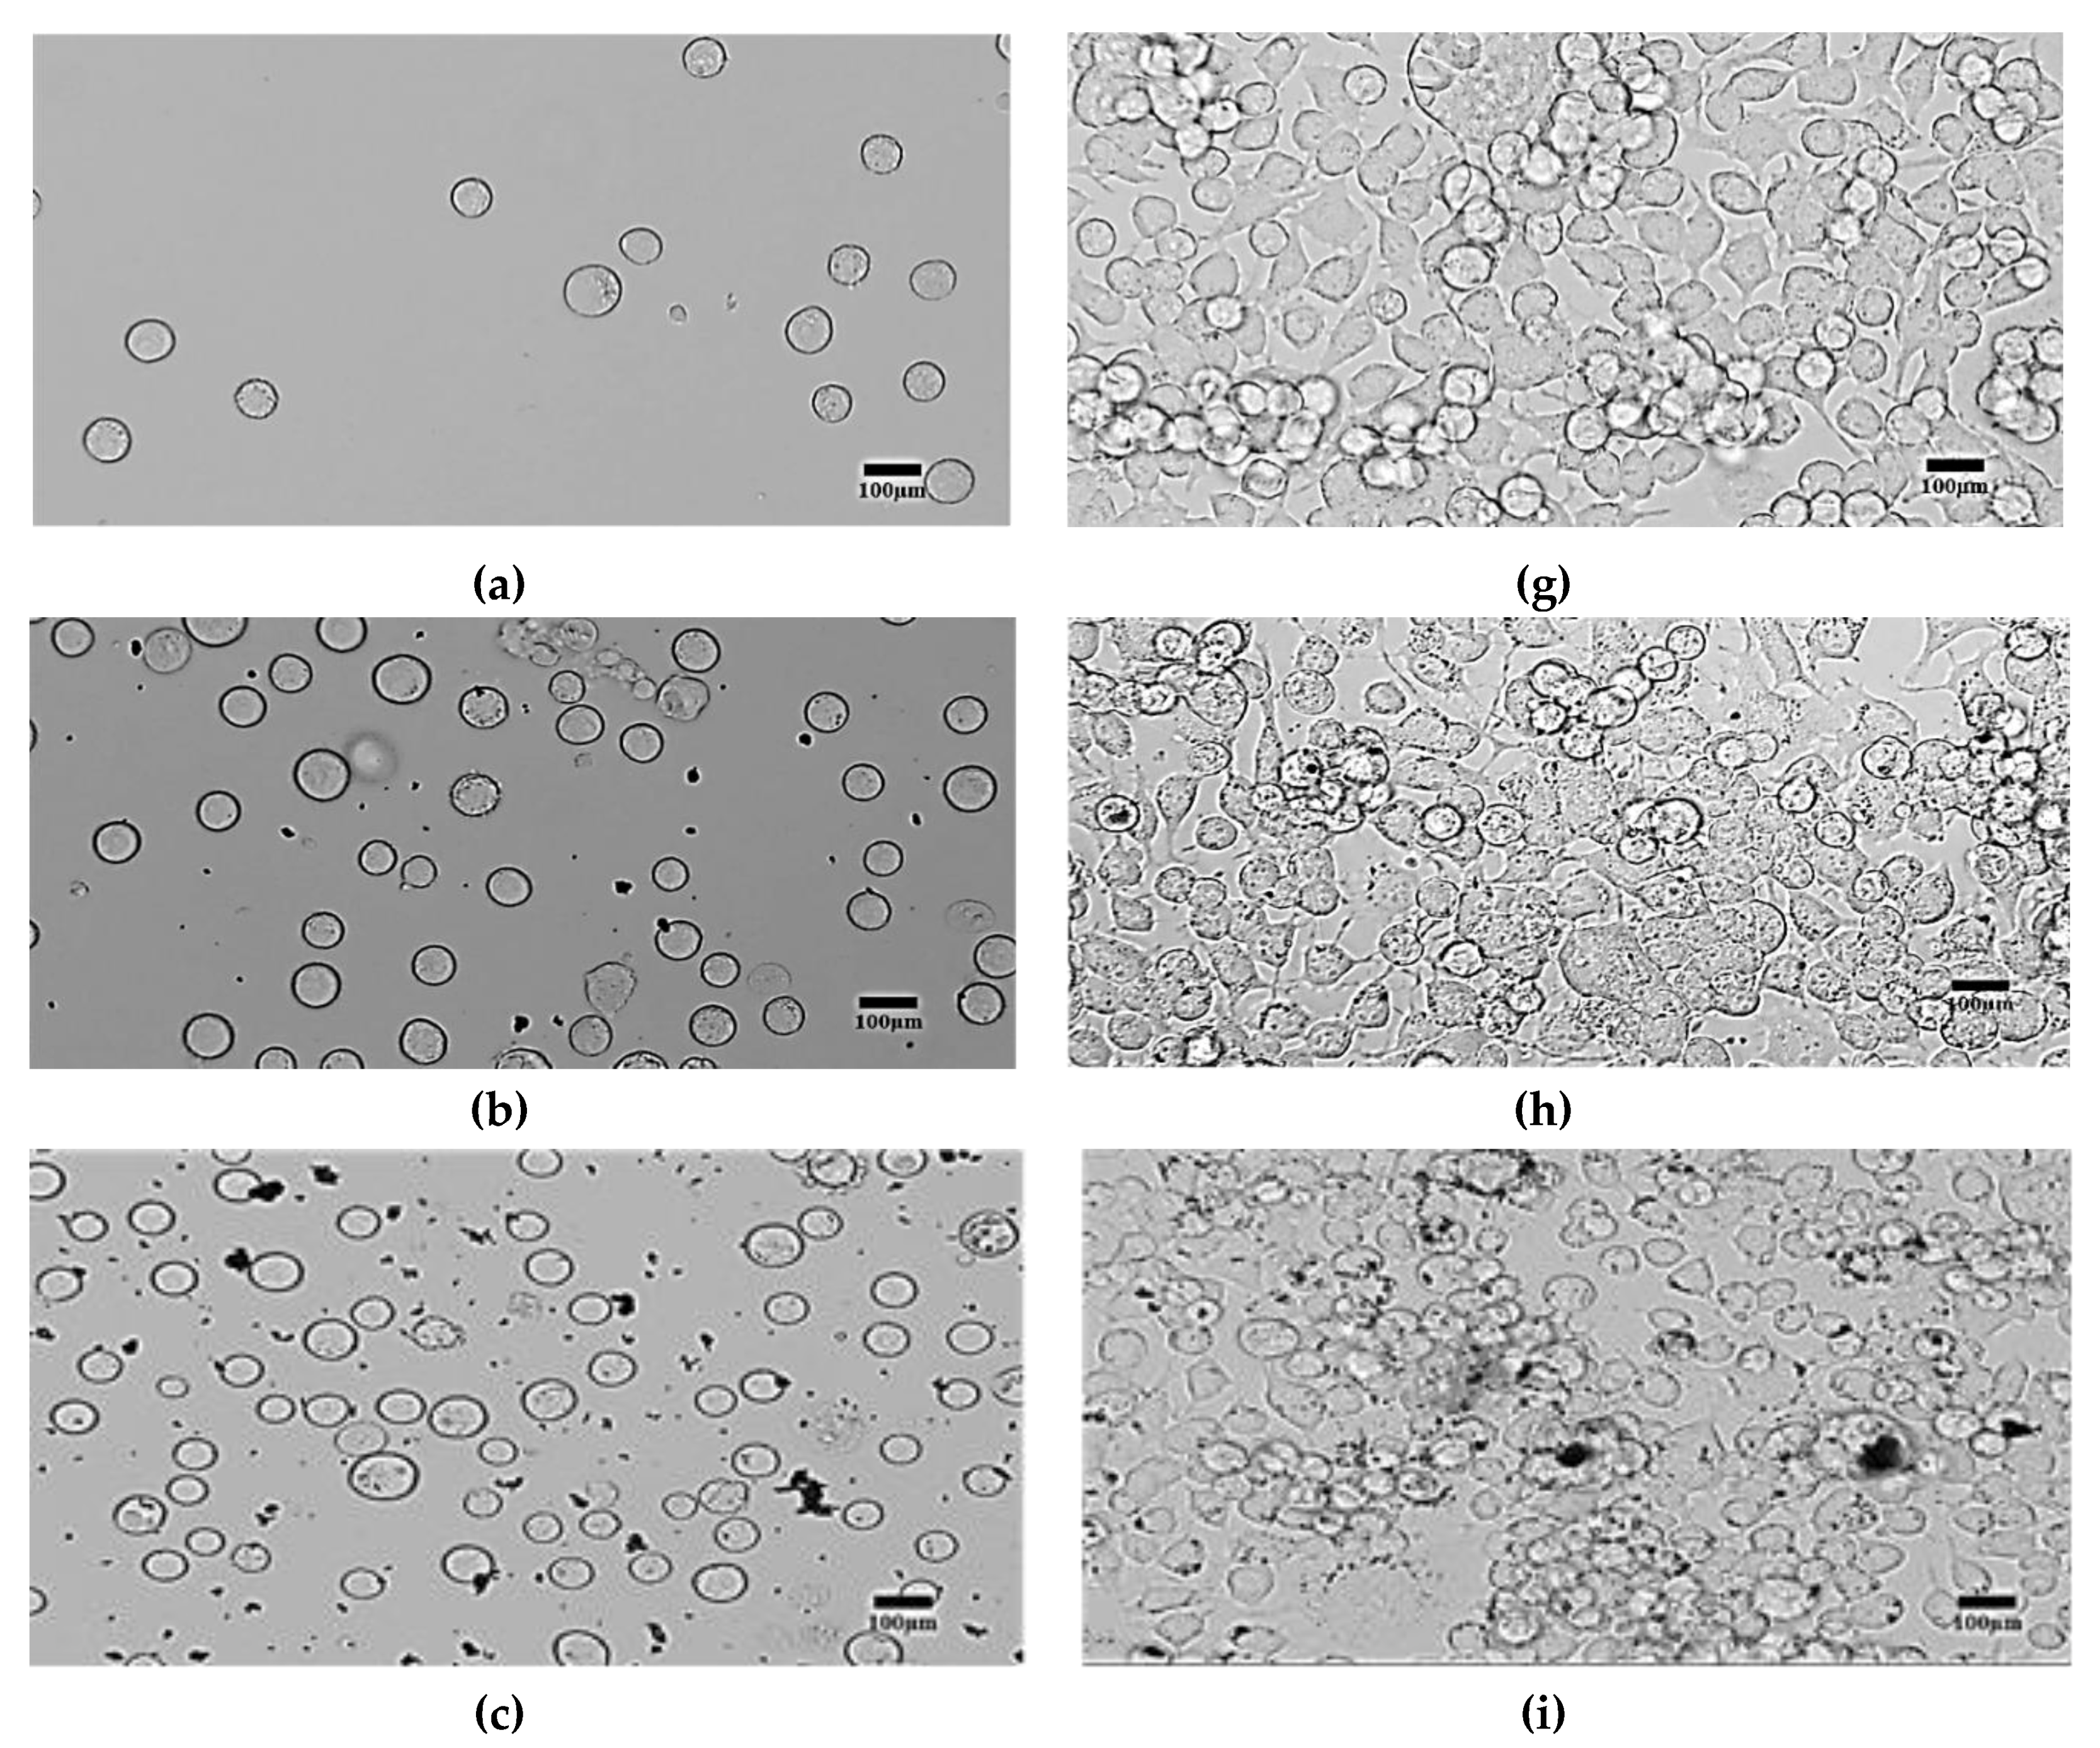
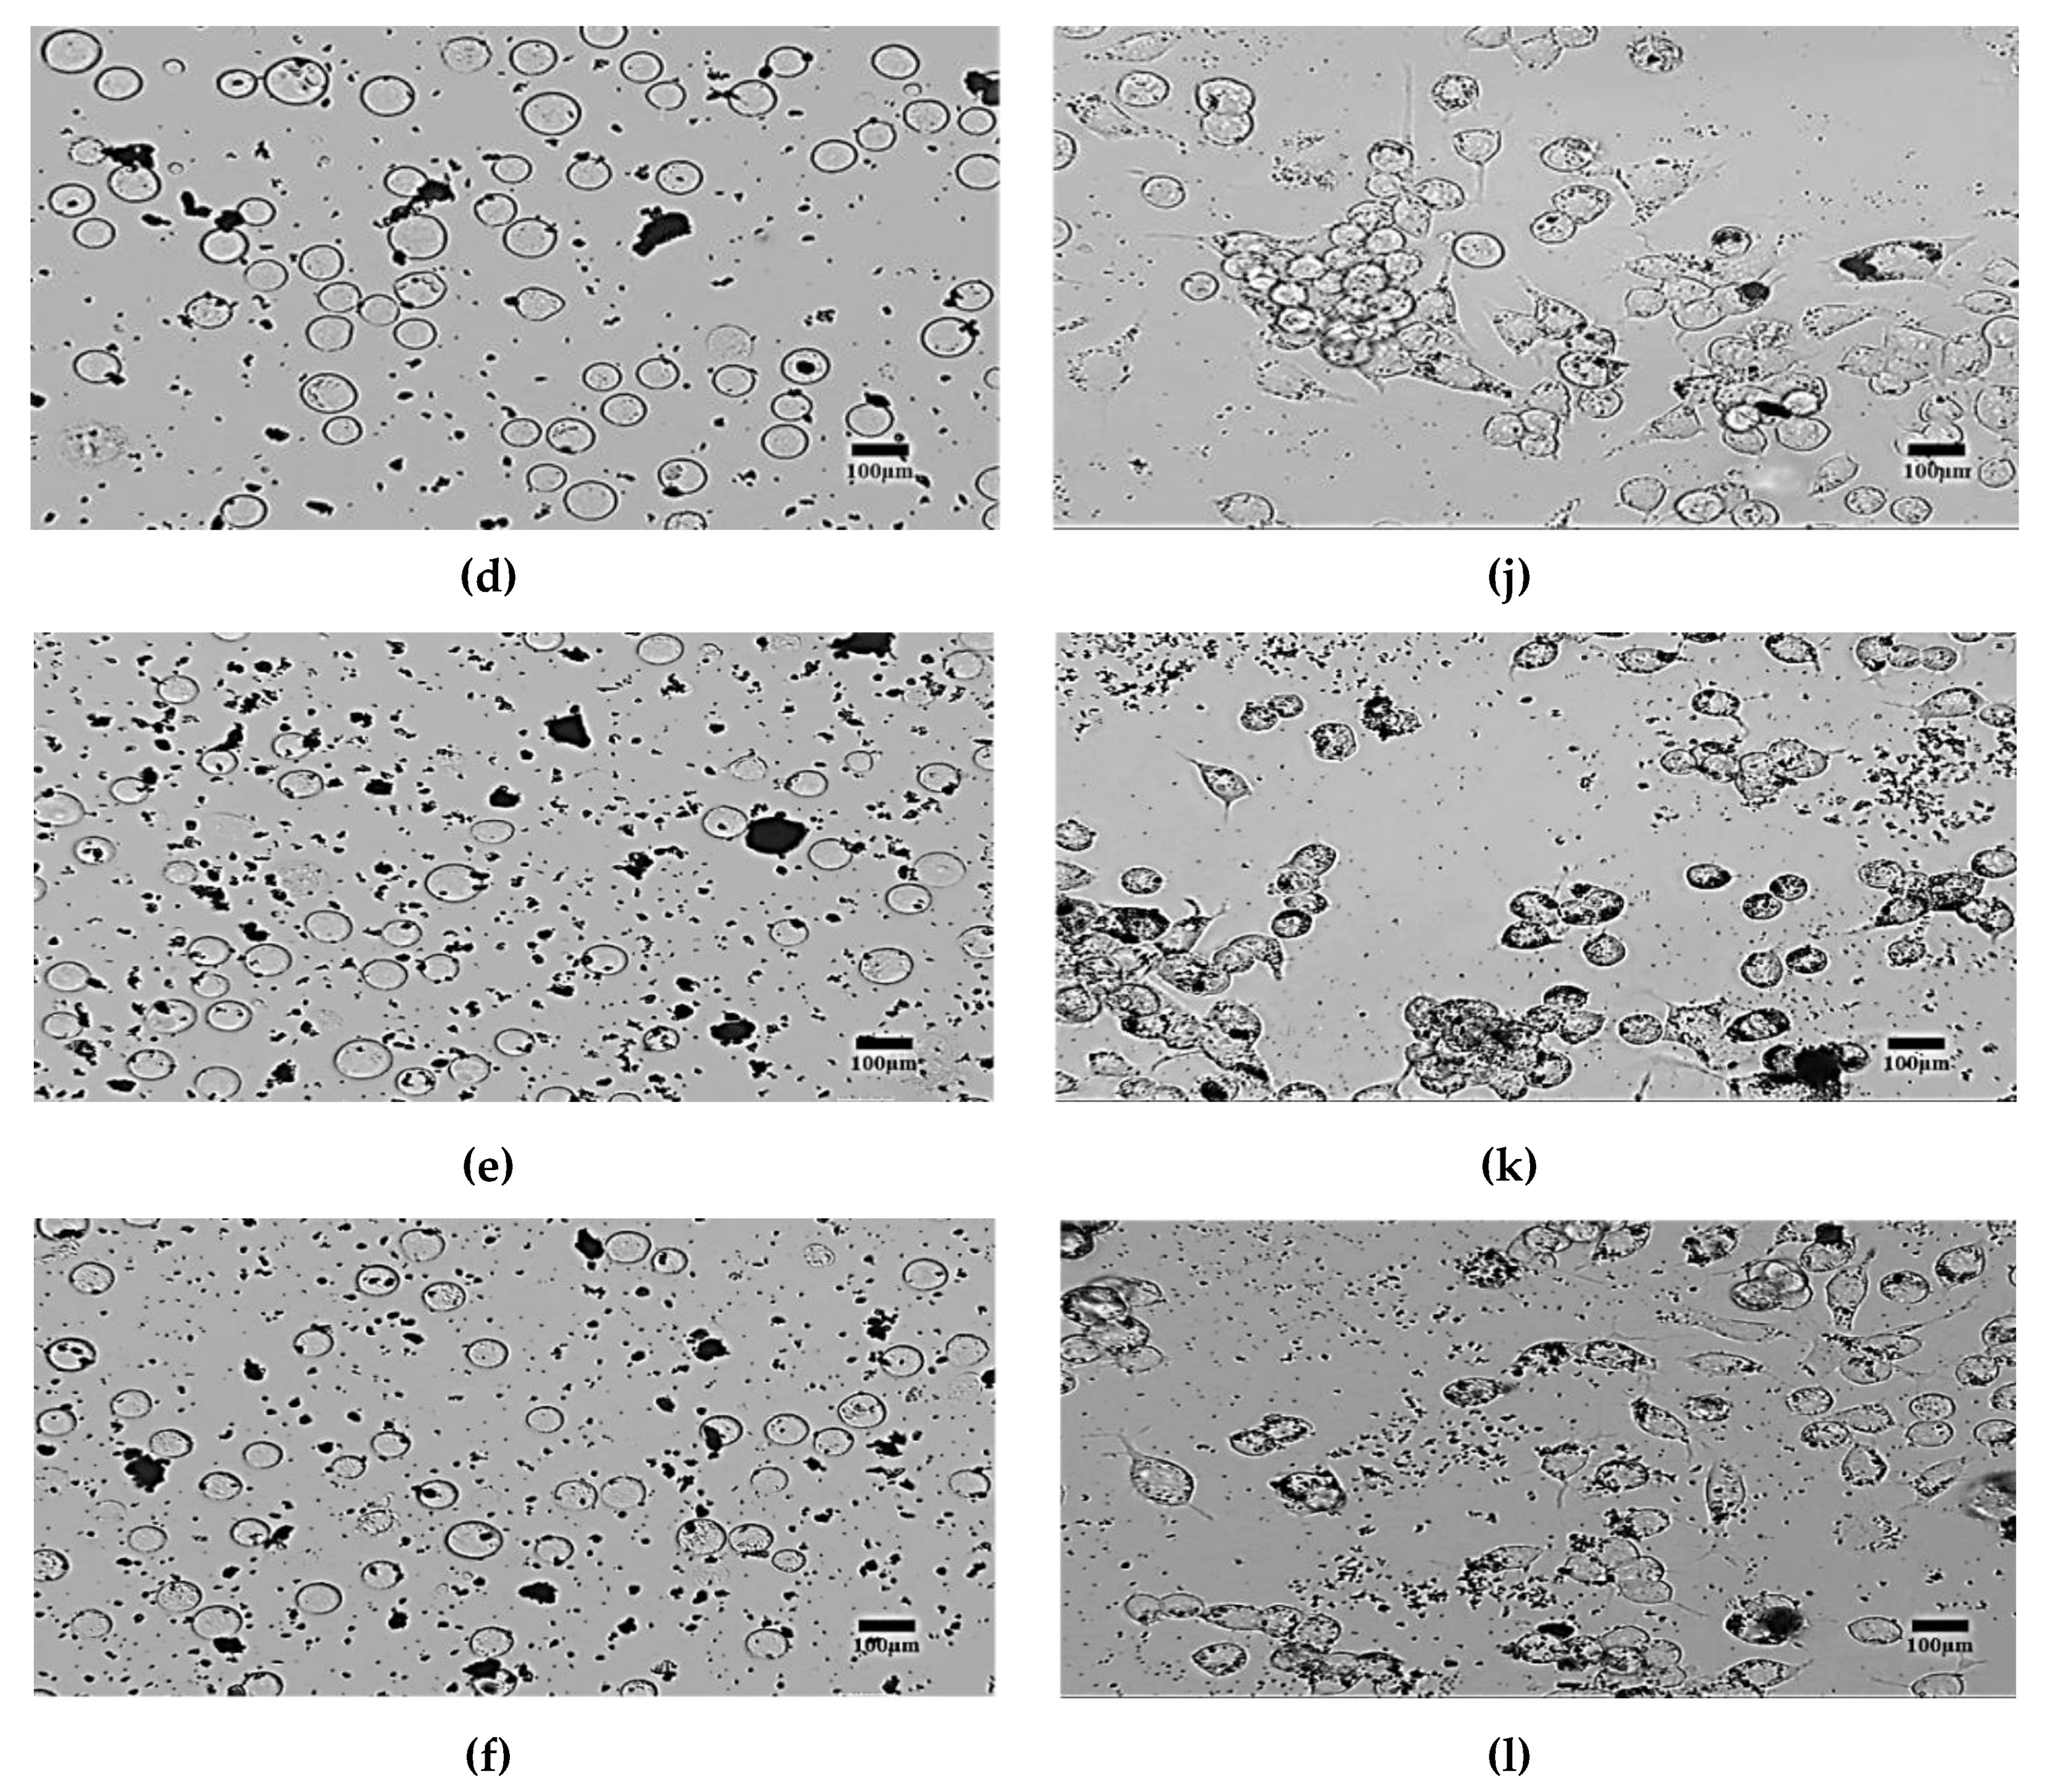
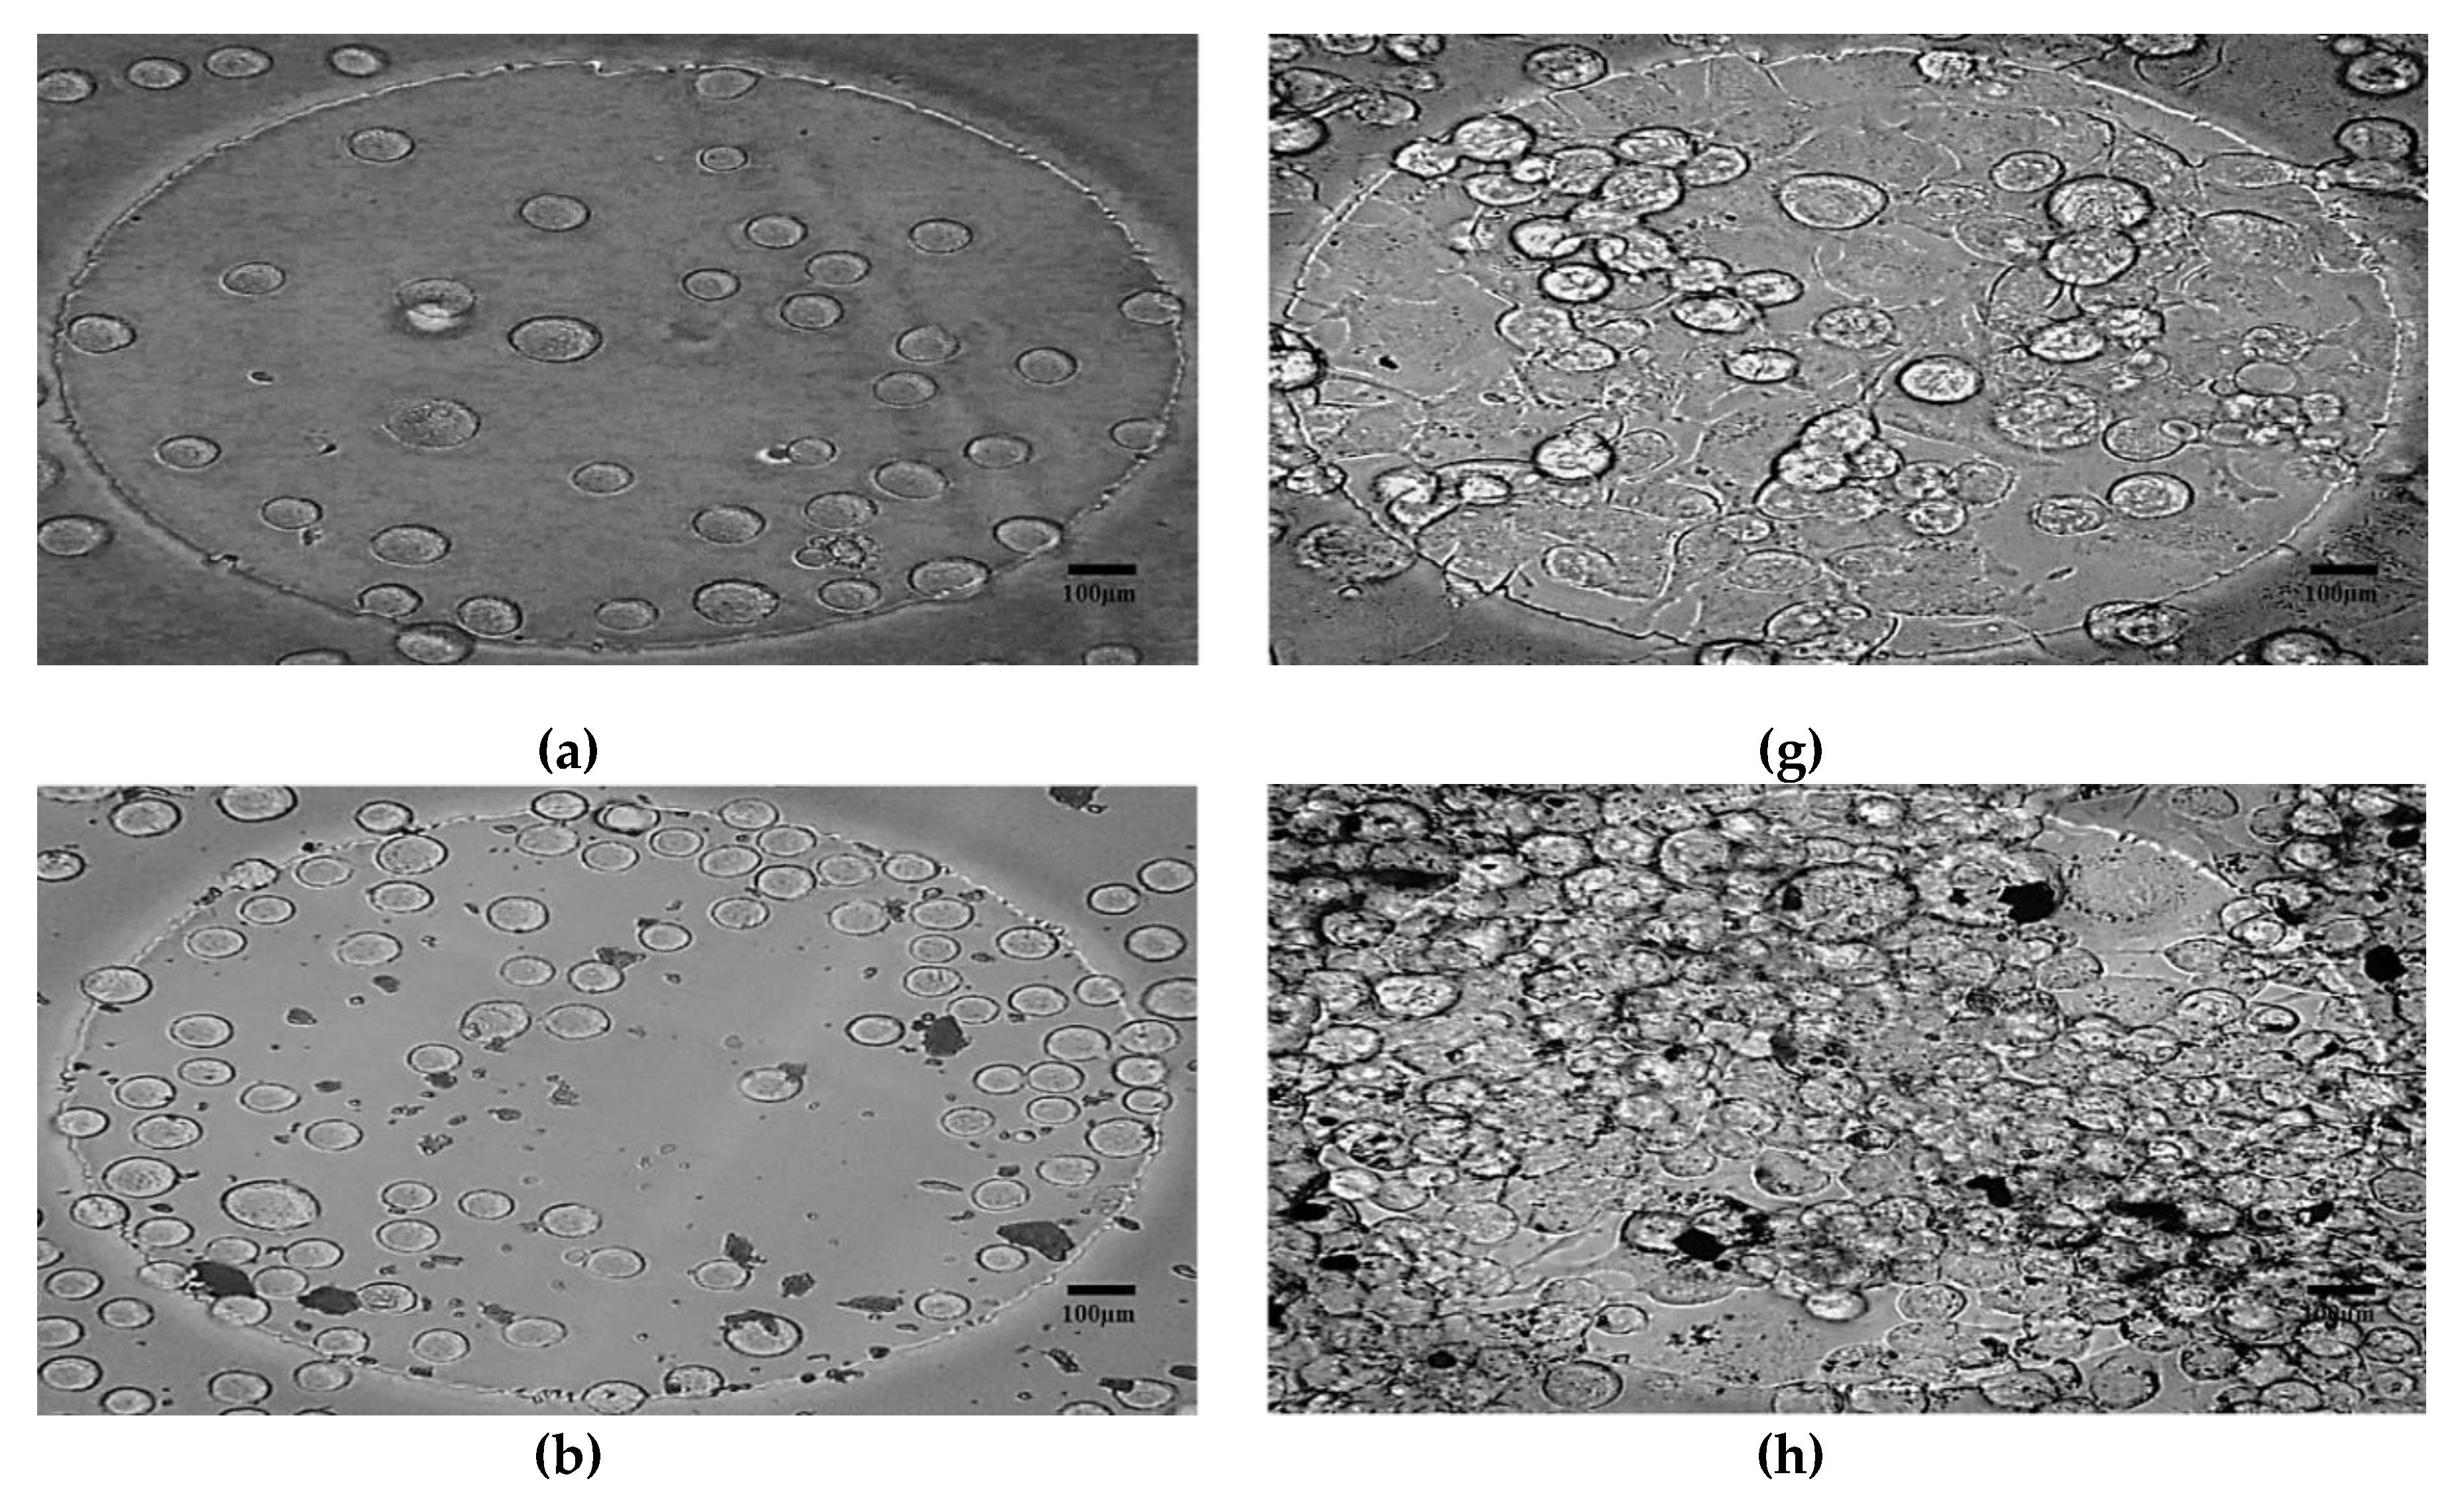
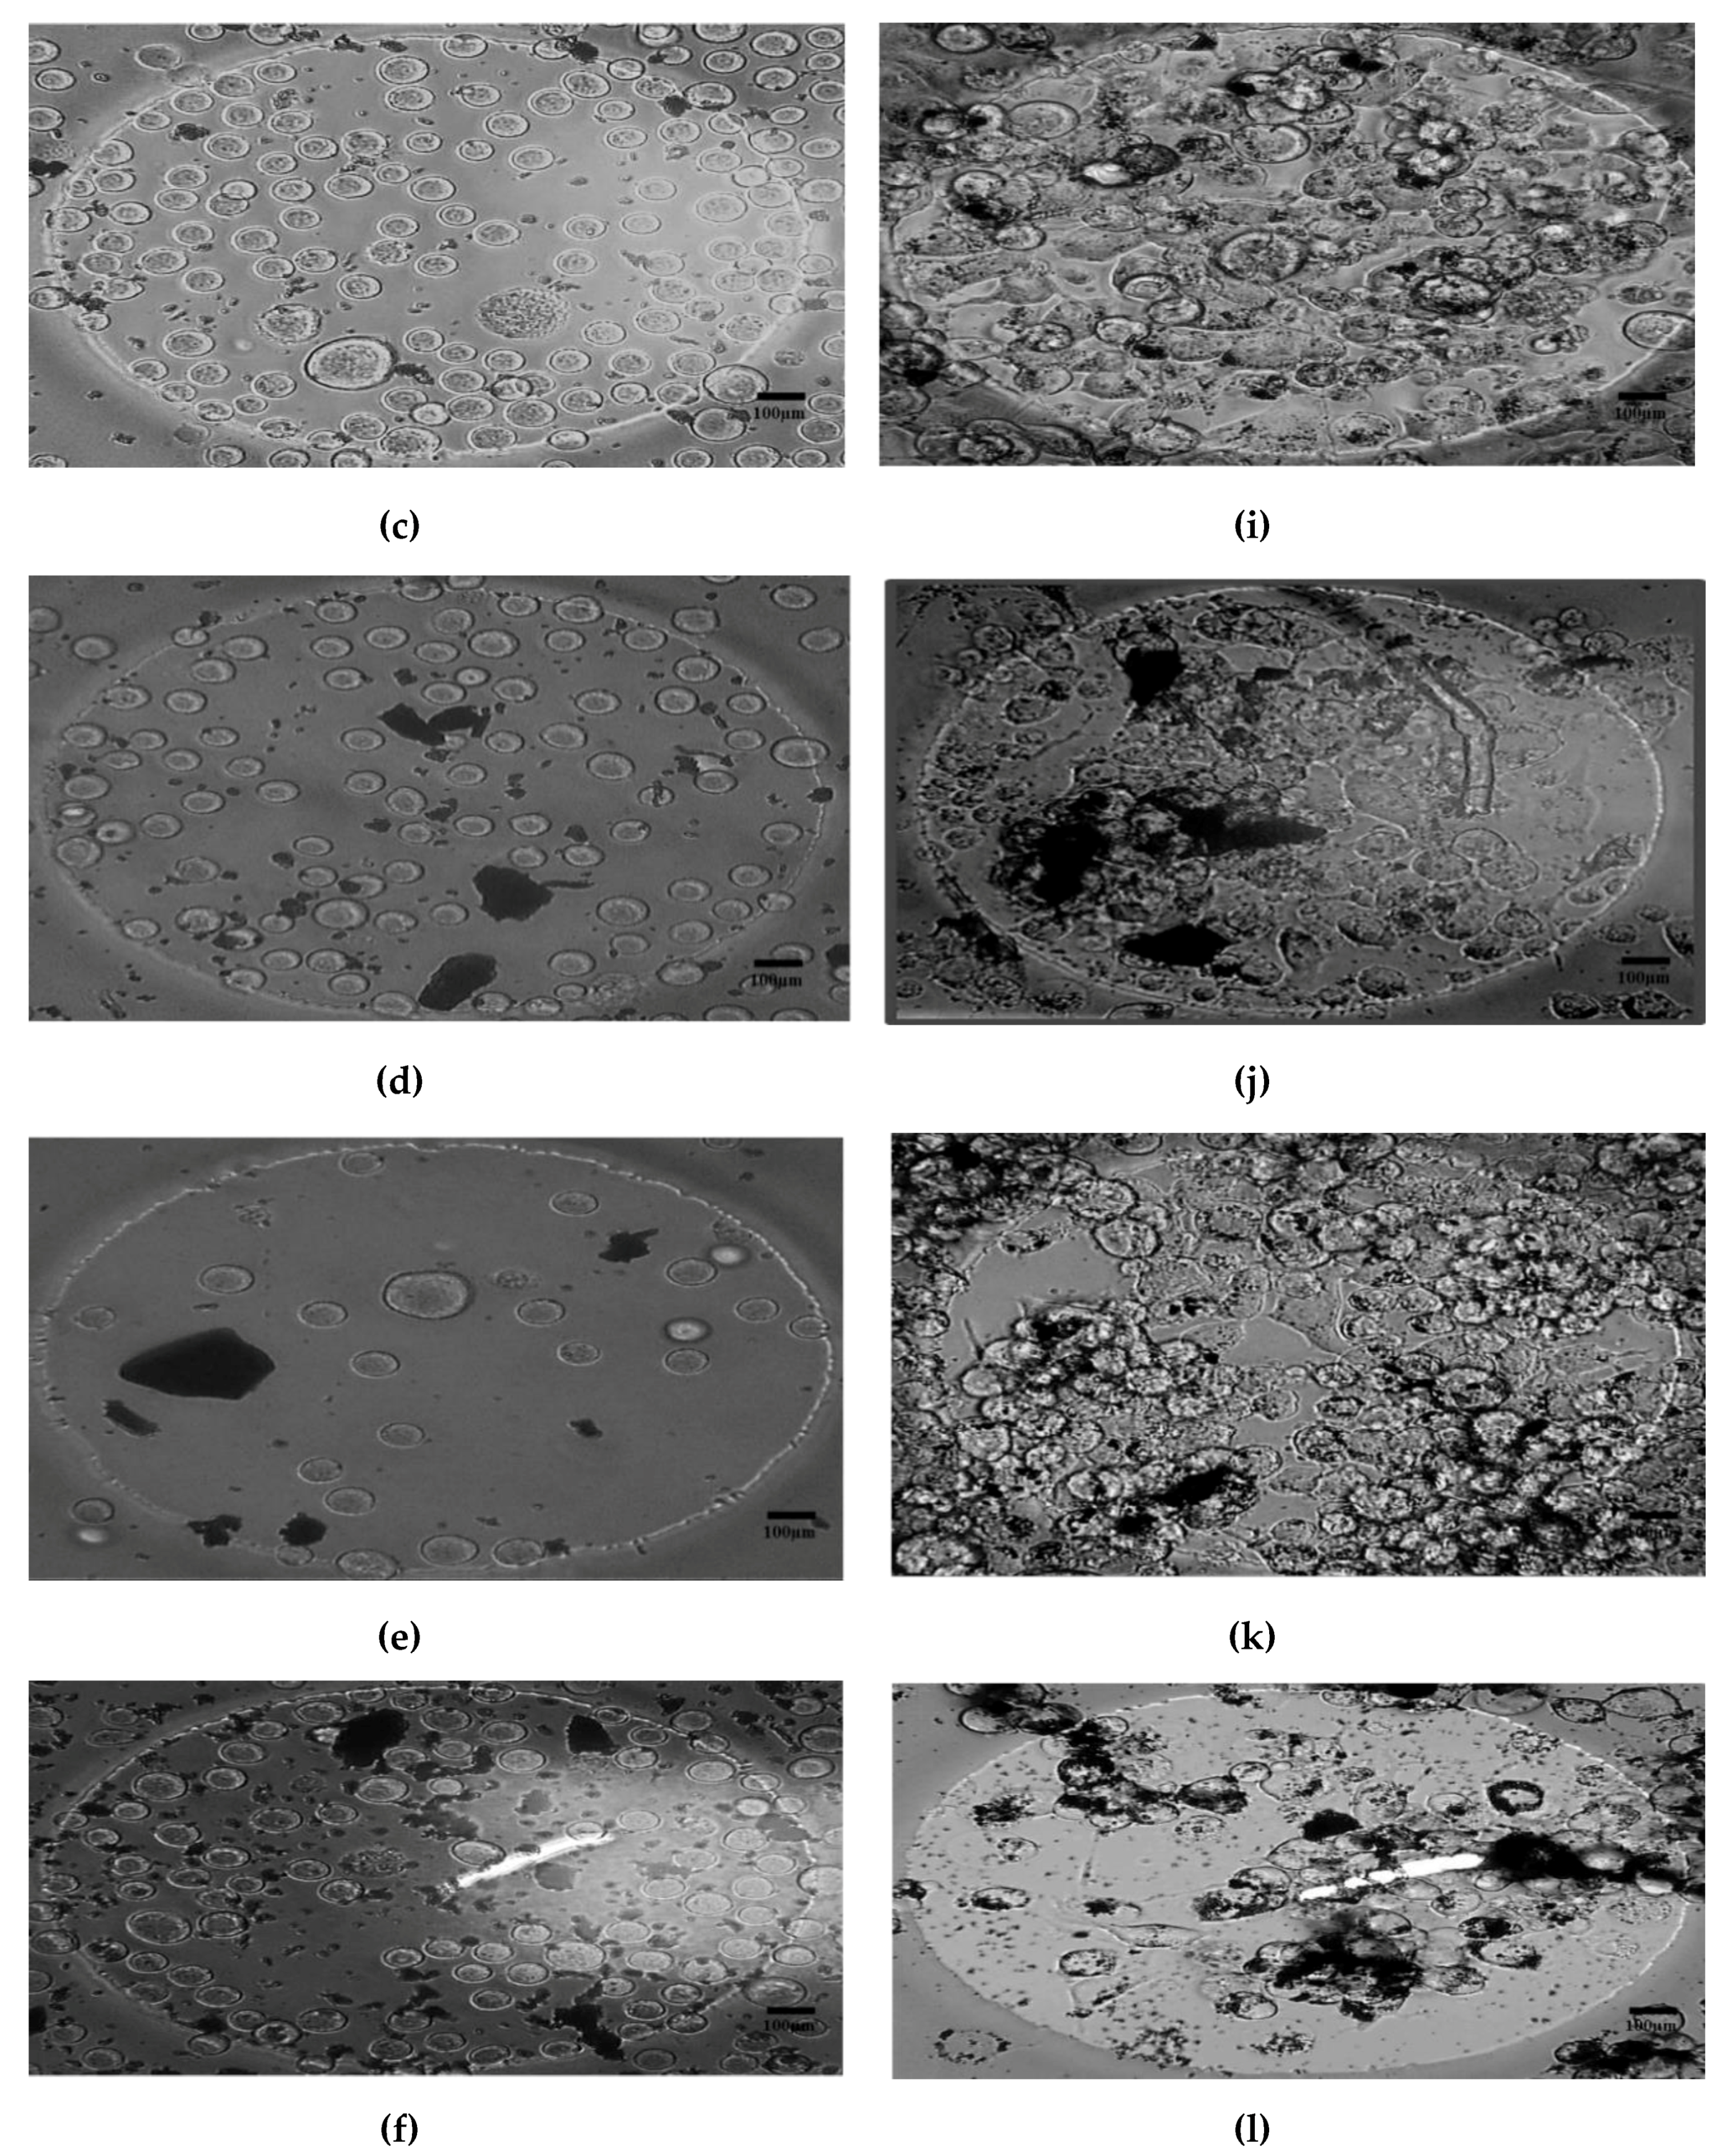
- Morphological method: The microscopic images of the N2a cells were captured to compare the treated and untreated cells. The treated cells were the cells mixed with SPIONs with different concentrations (C2–C6). The N2a cells were cultured in an incubator.
- Electrical method: The attachment of cells and SPIONs above electrodes can change the impedance as described in Section 3. The impedance spectroscopy of cells in control (C1) and with the presence of SPIONs (C2–C6) are measured in different times (T1–T8) by hypothesizing that the effect of SPIONs on cells can be tracked using the recorded impedances.
4.1. Biological Effects
4.2. Morphological Effects
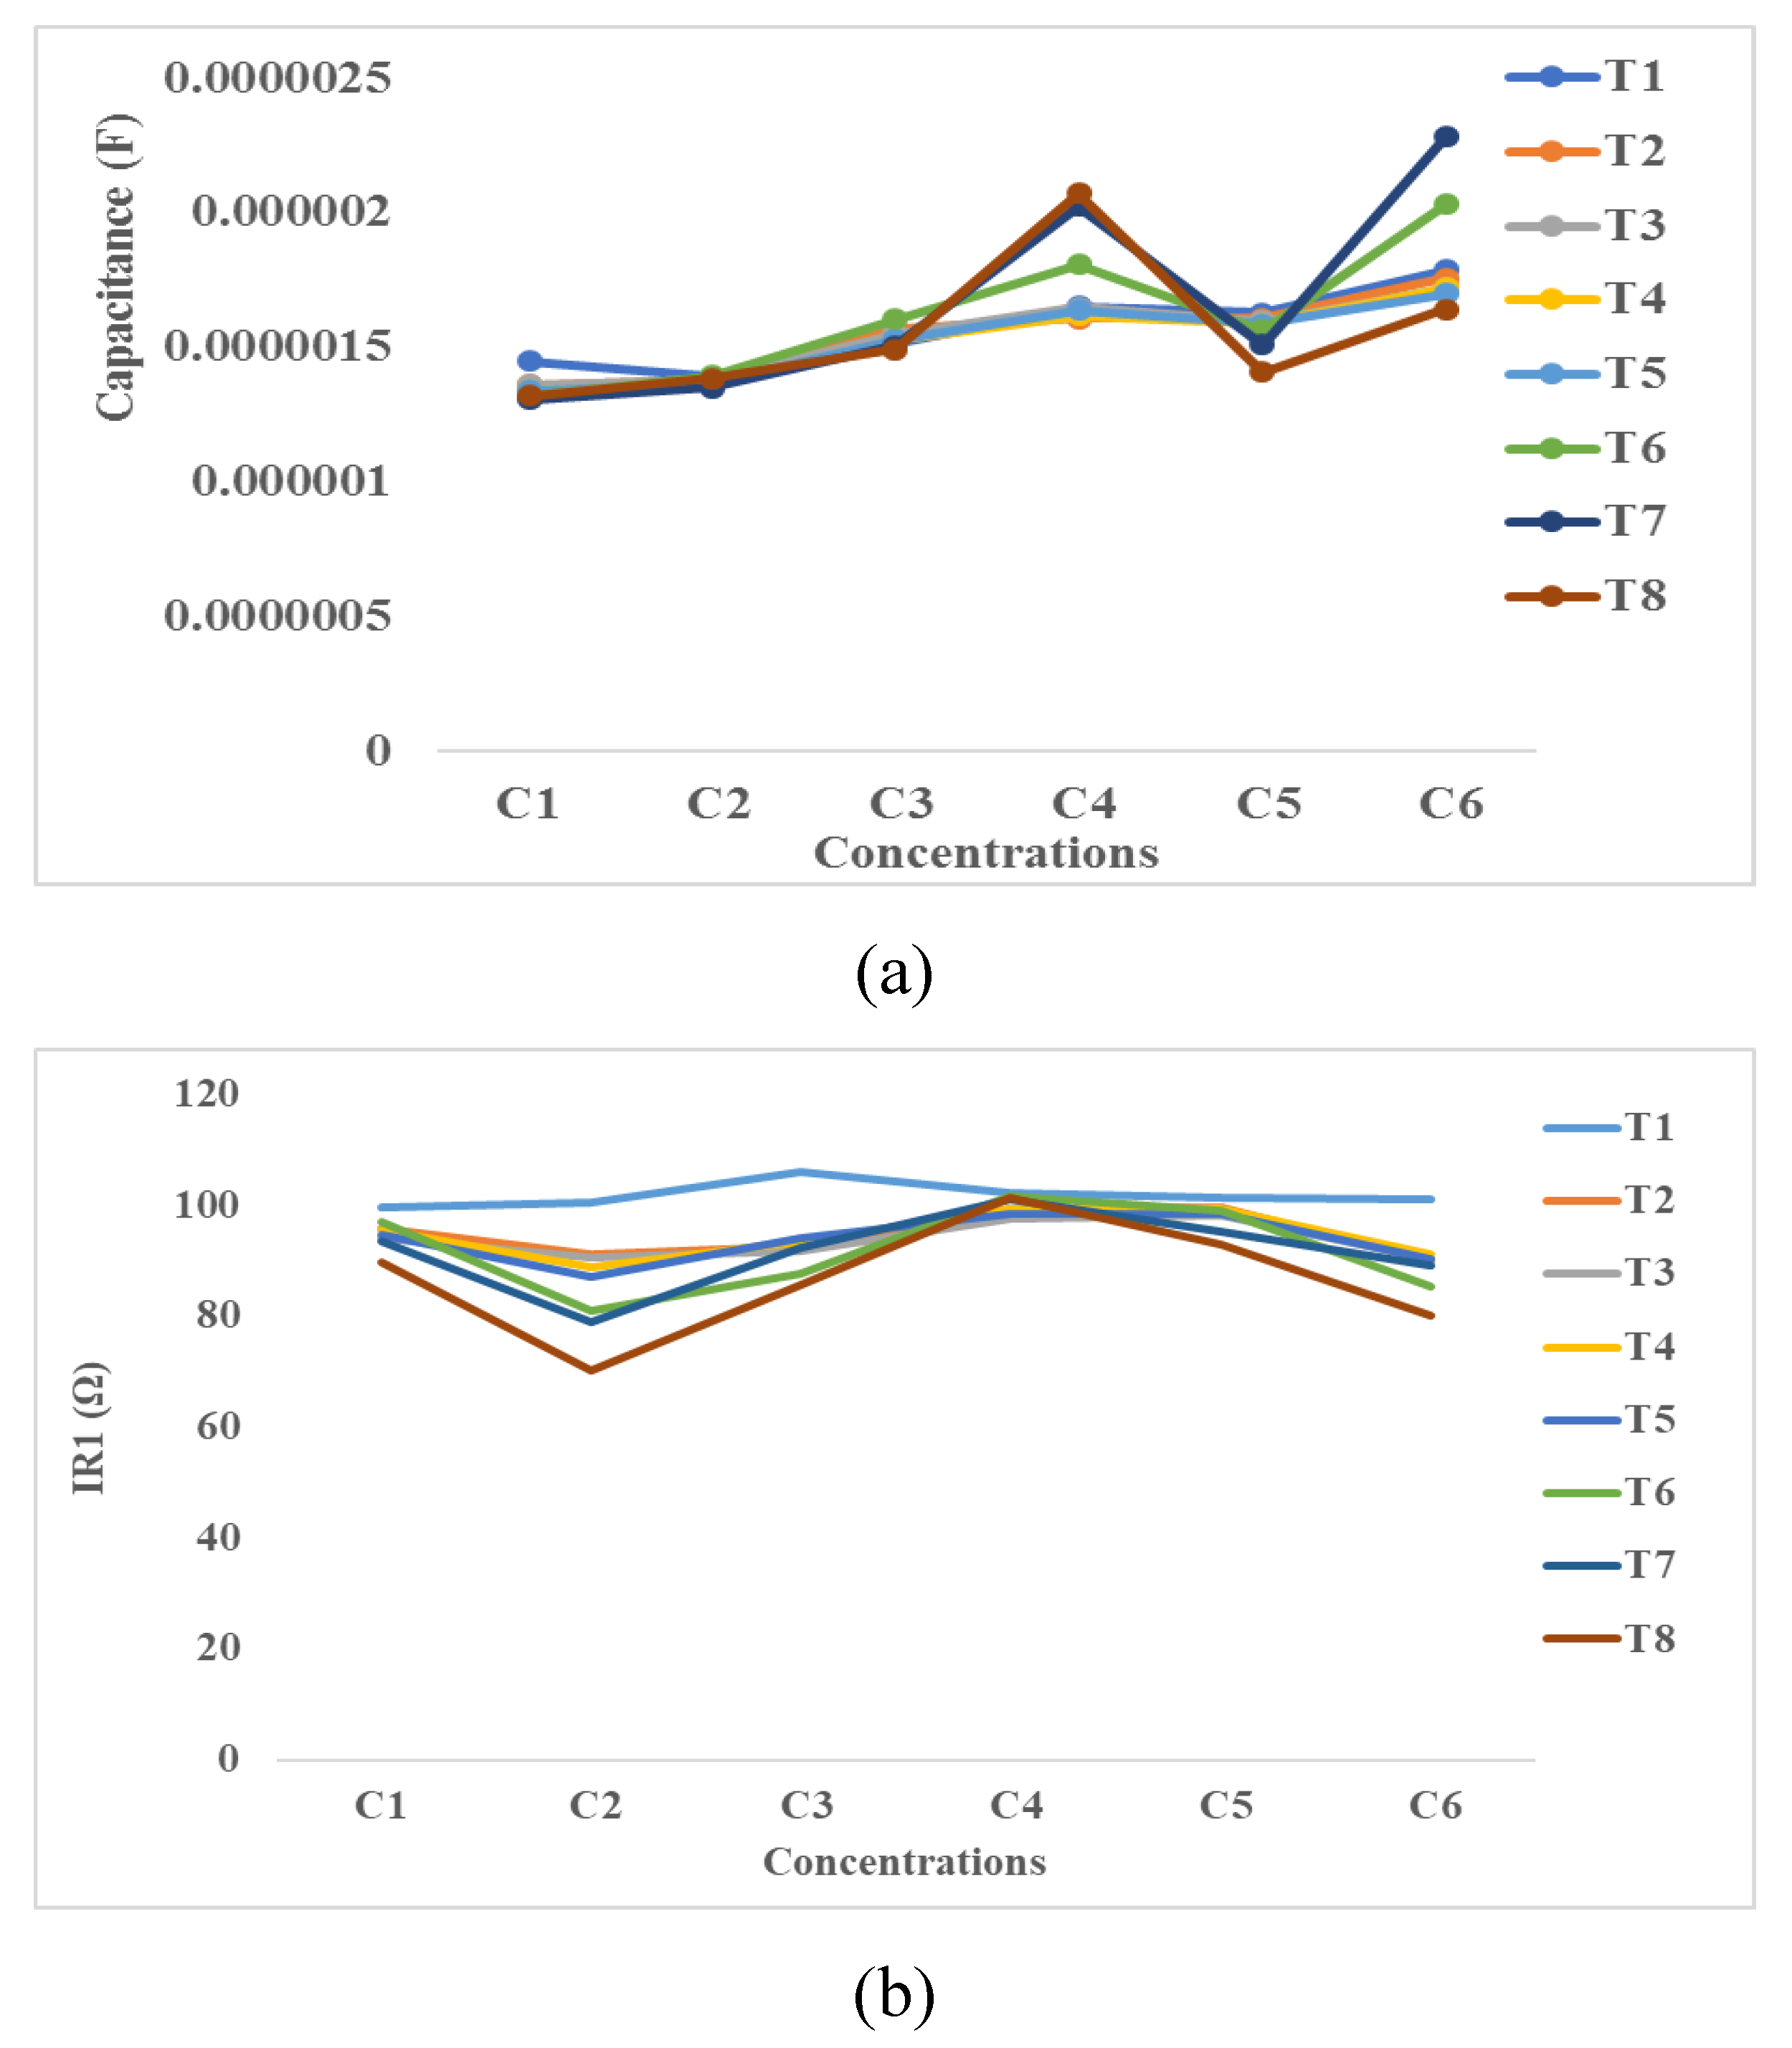
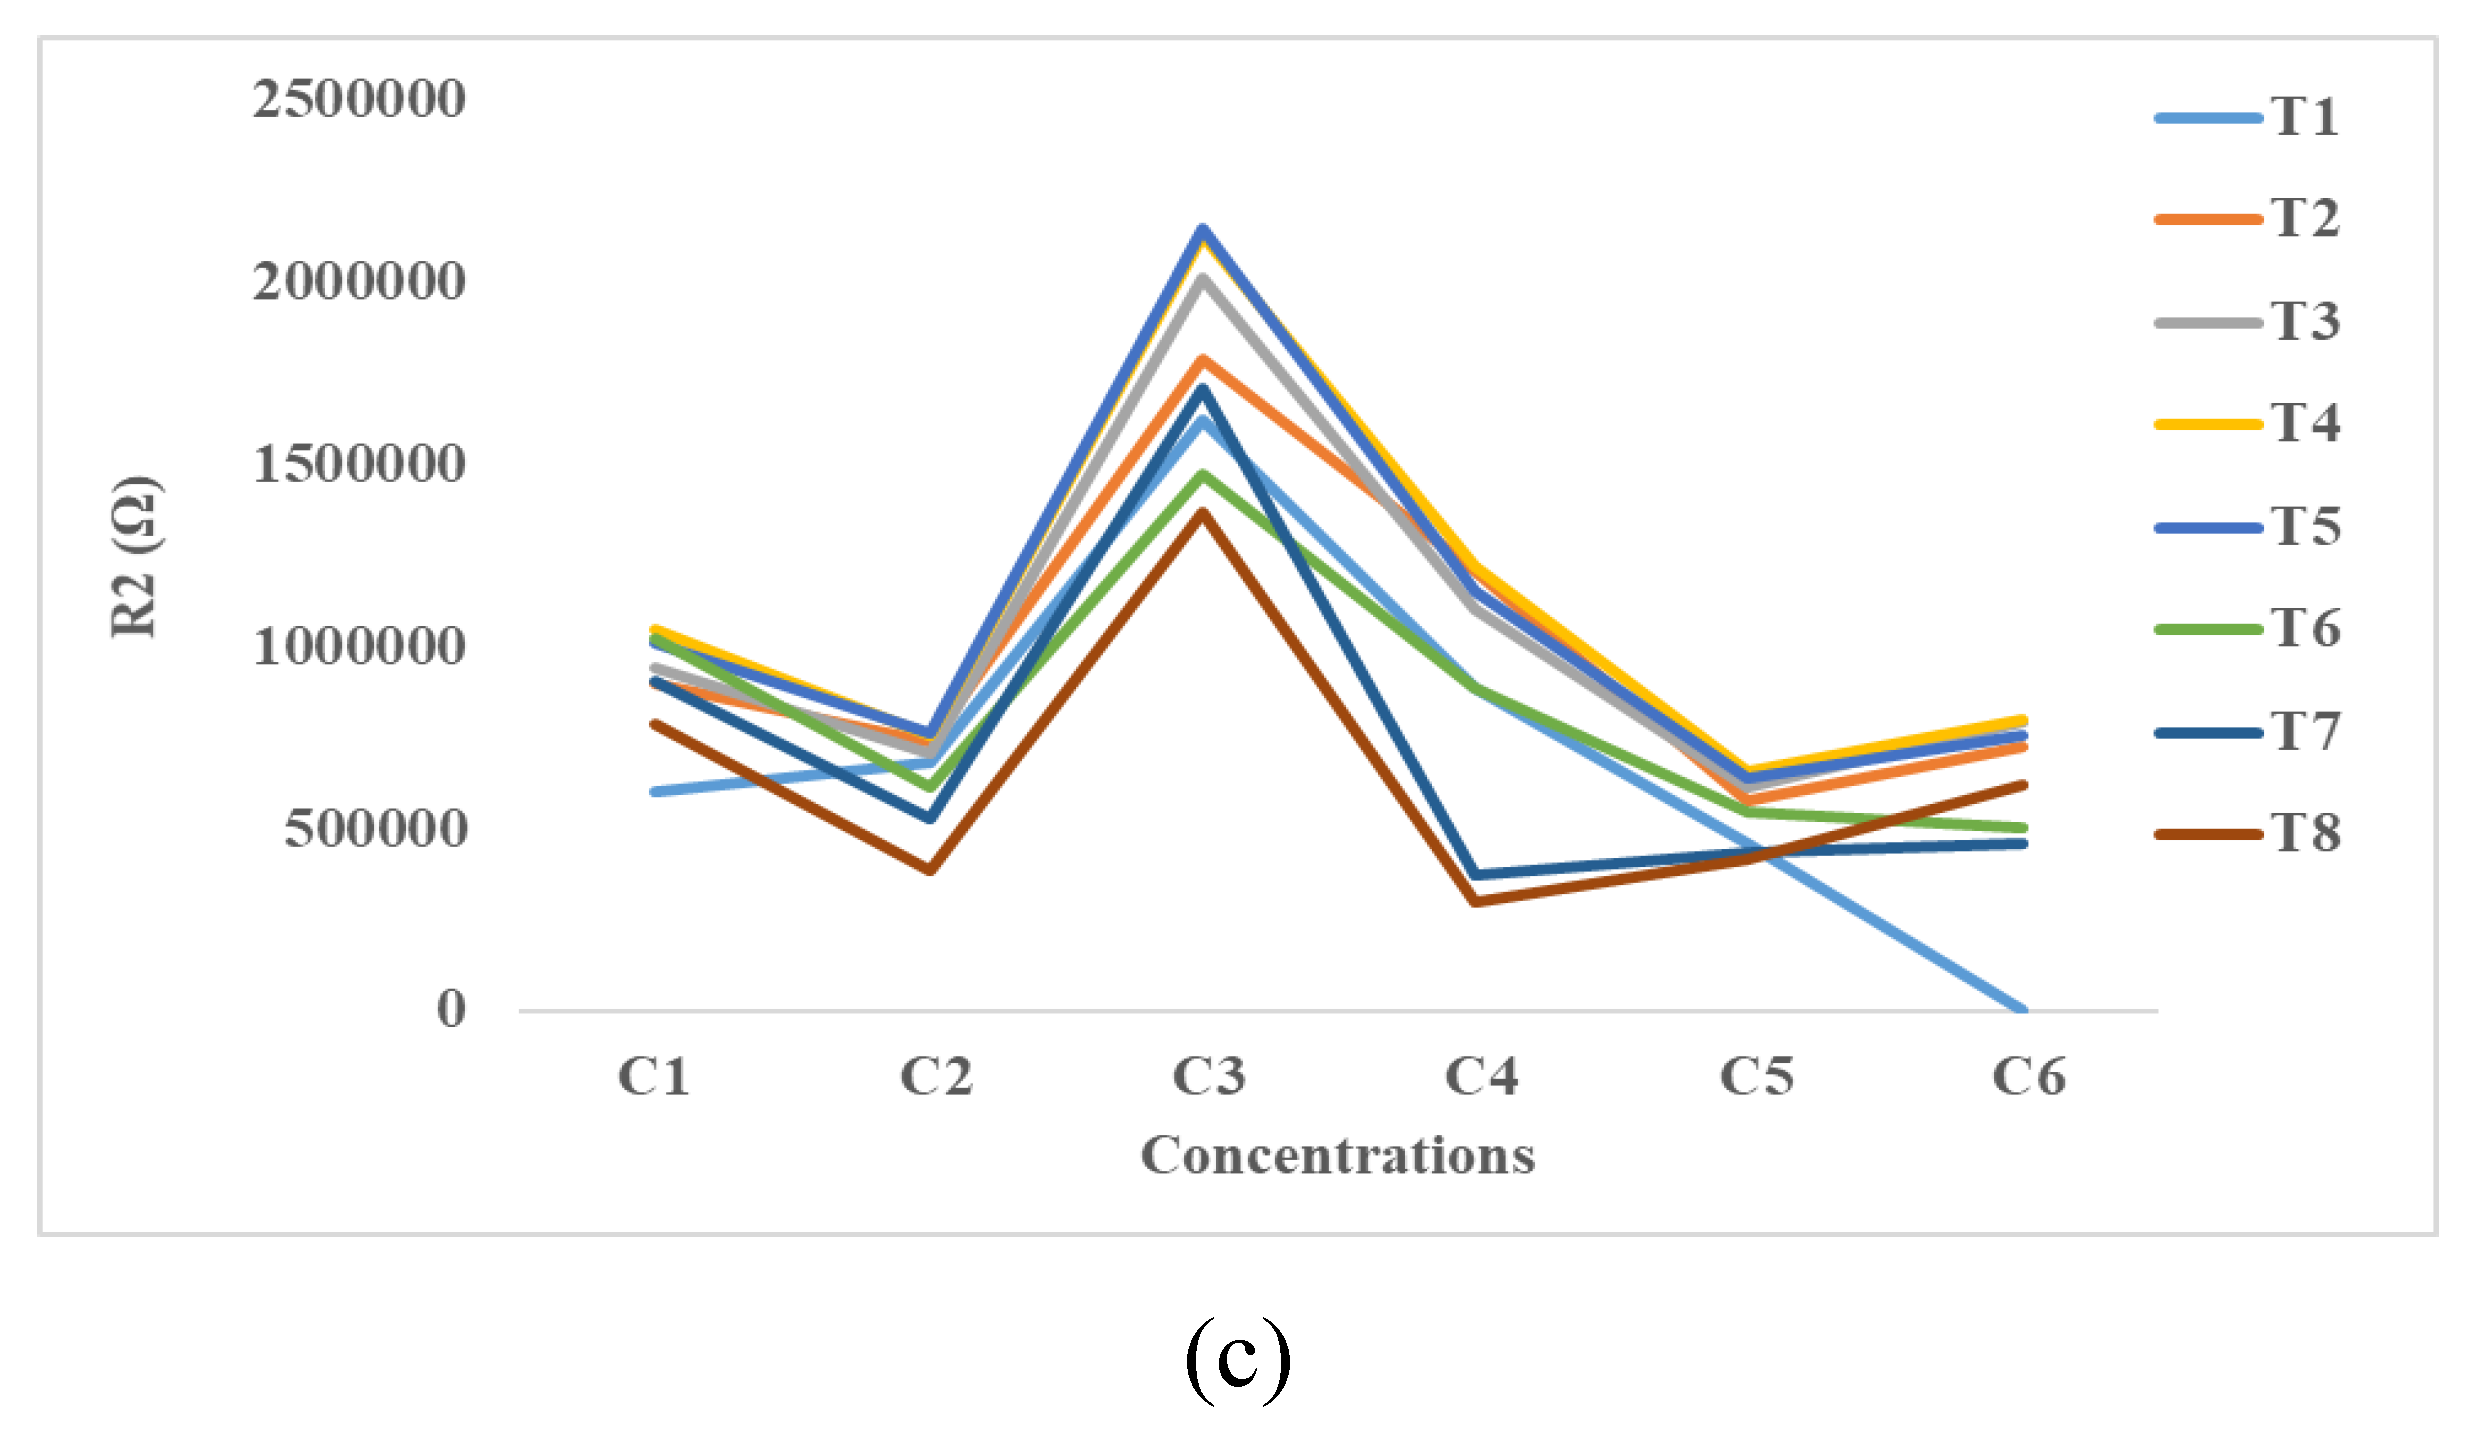
4.3. Impedance Effects
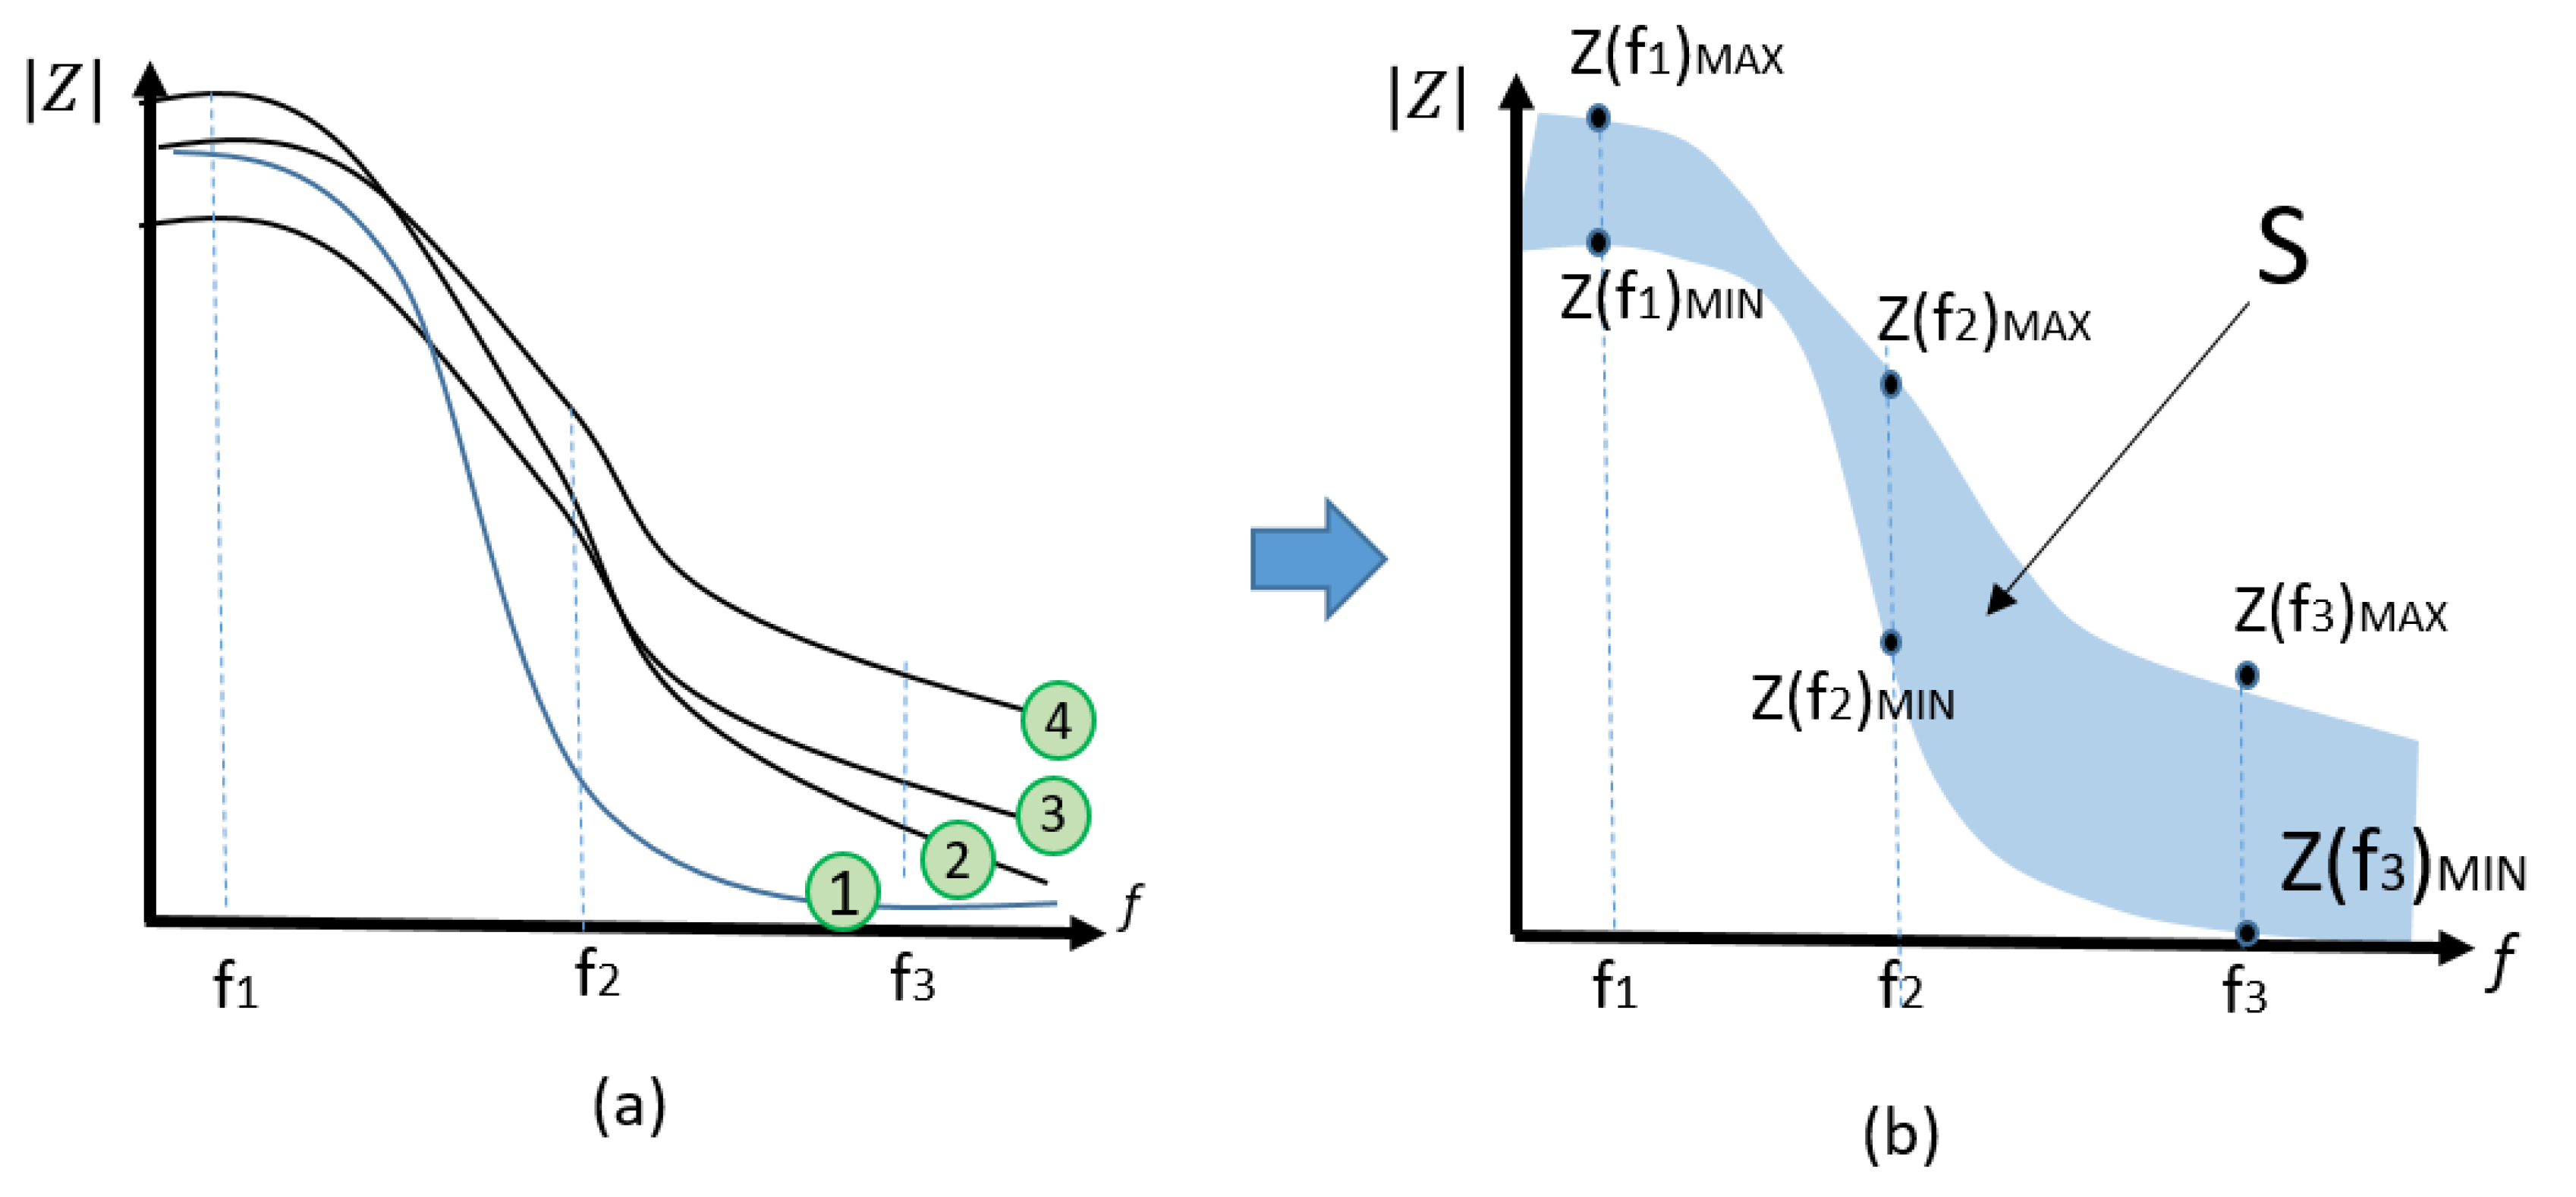
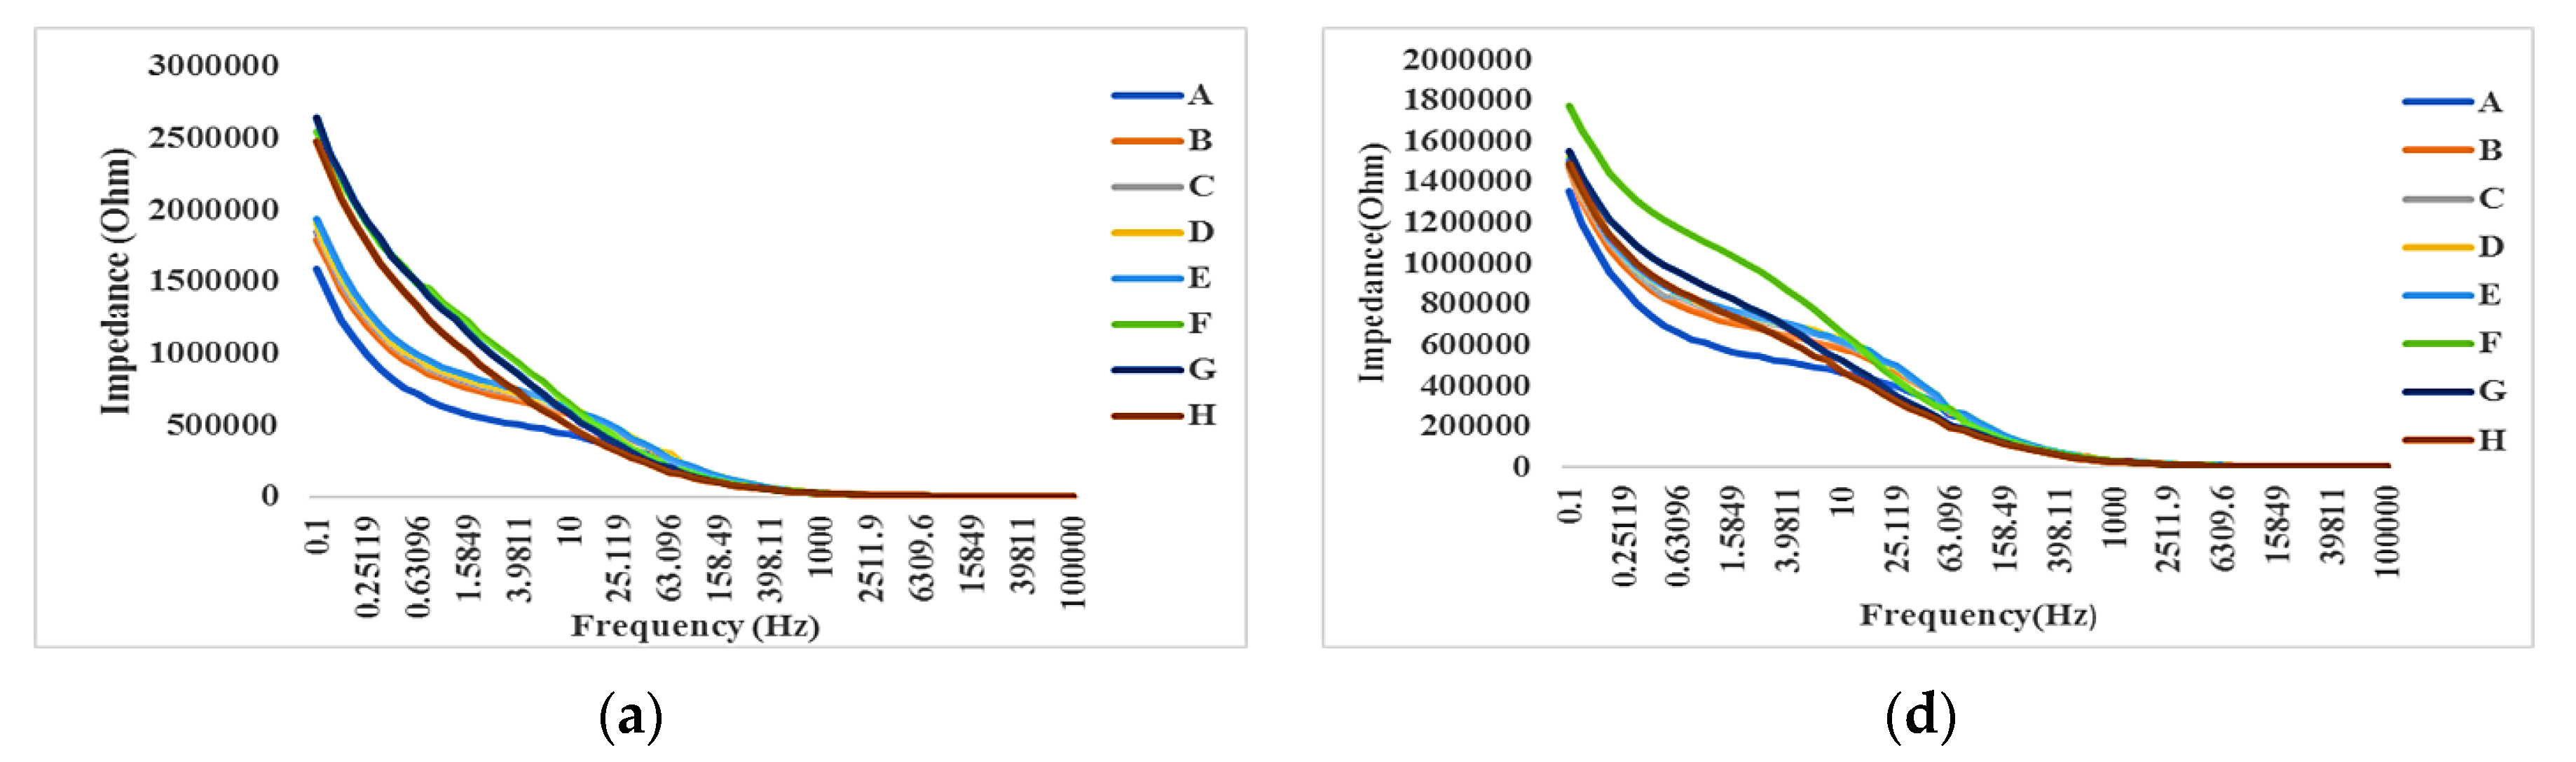
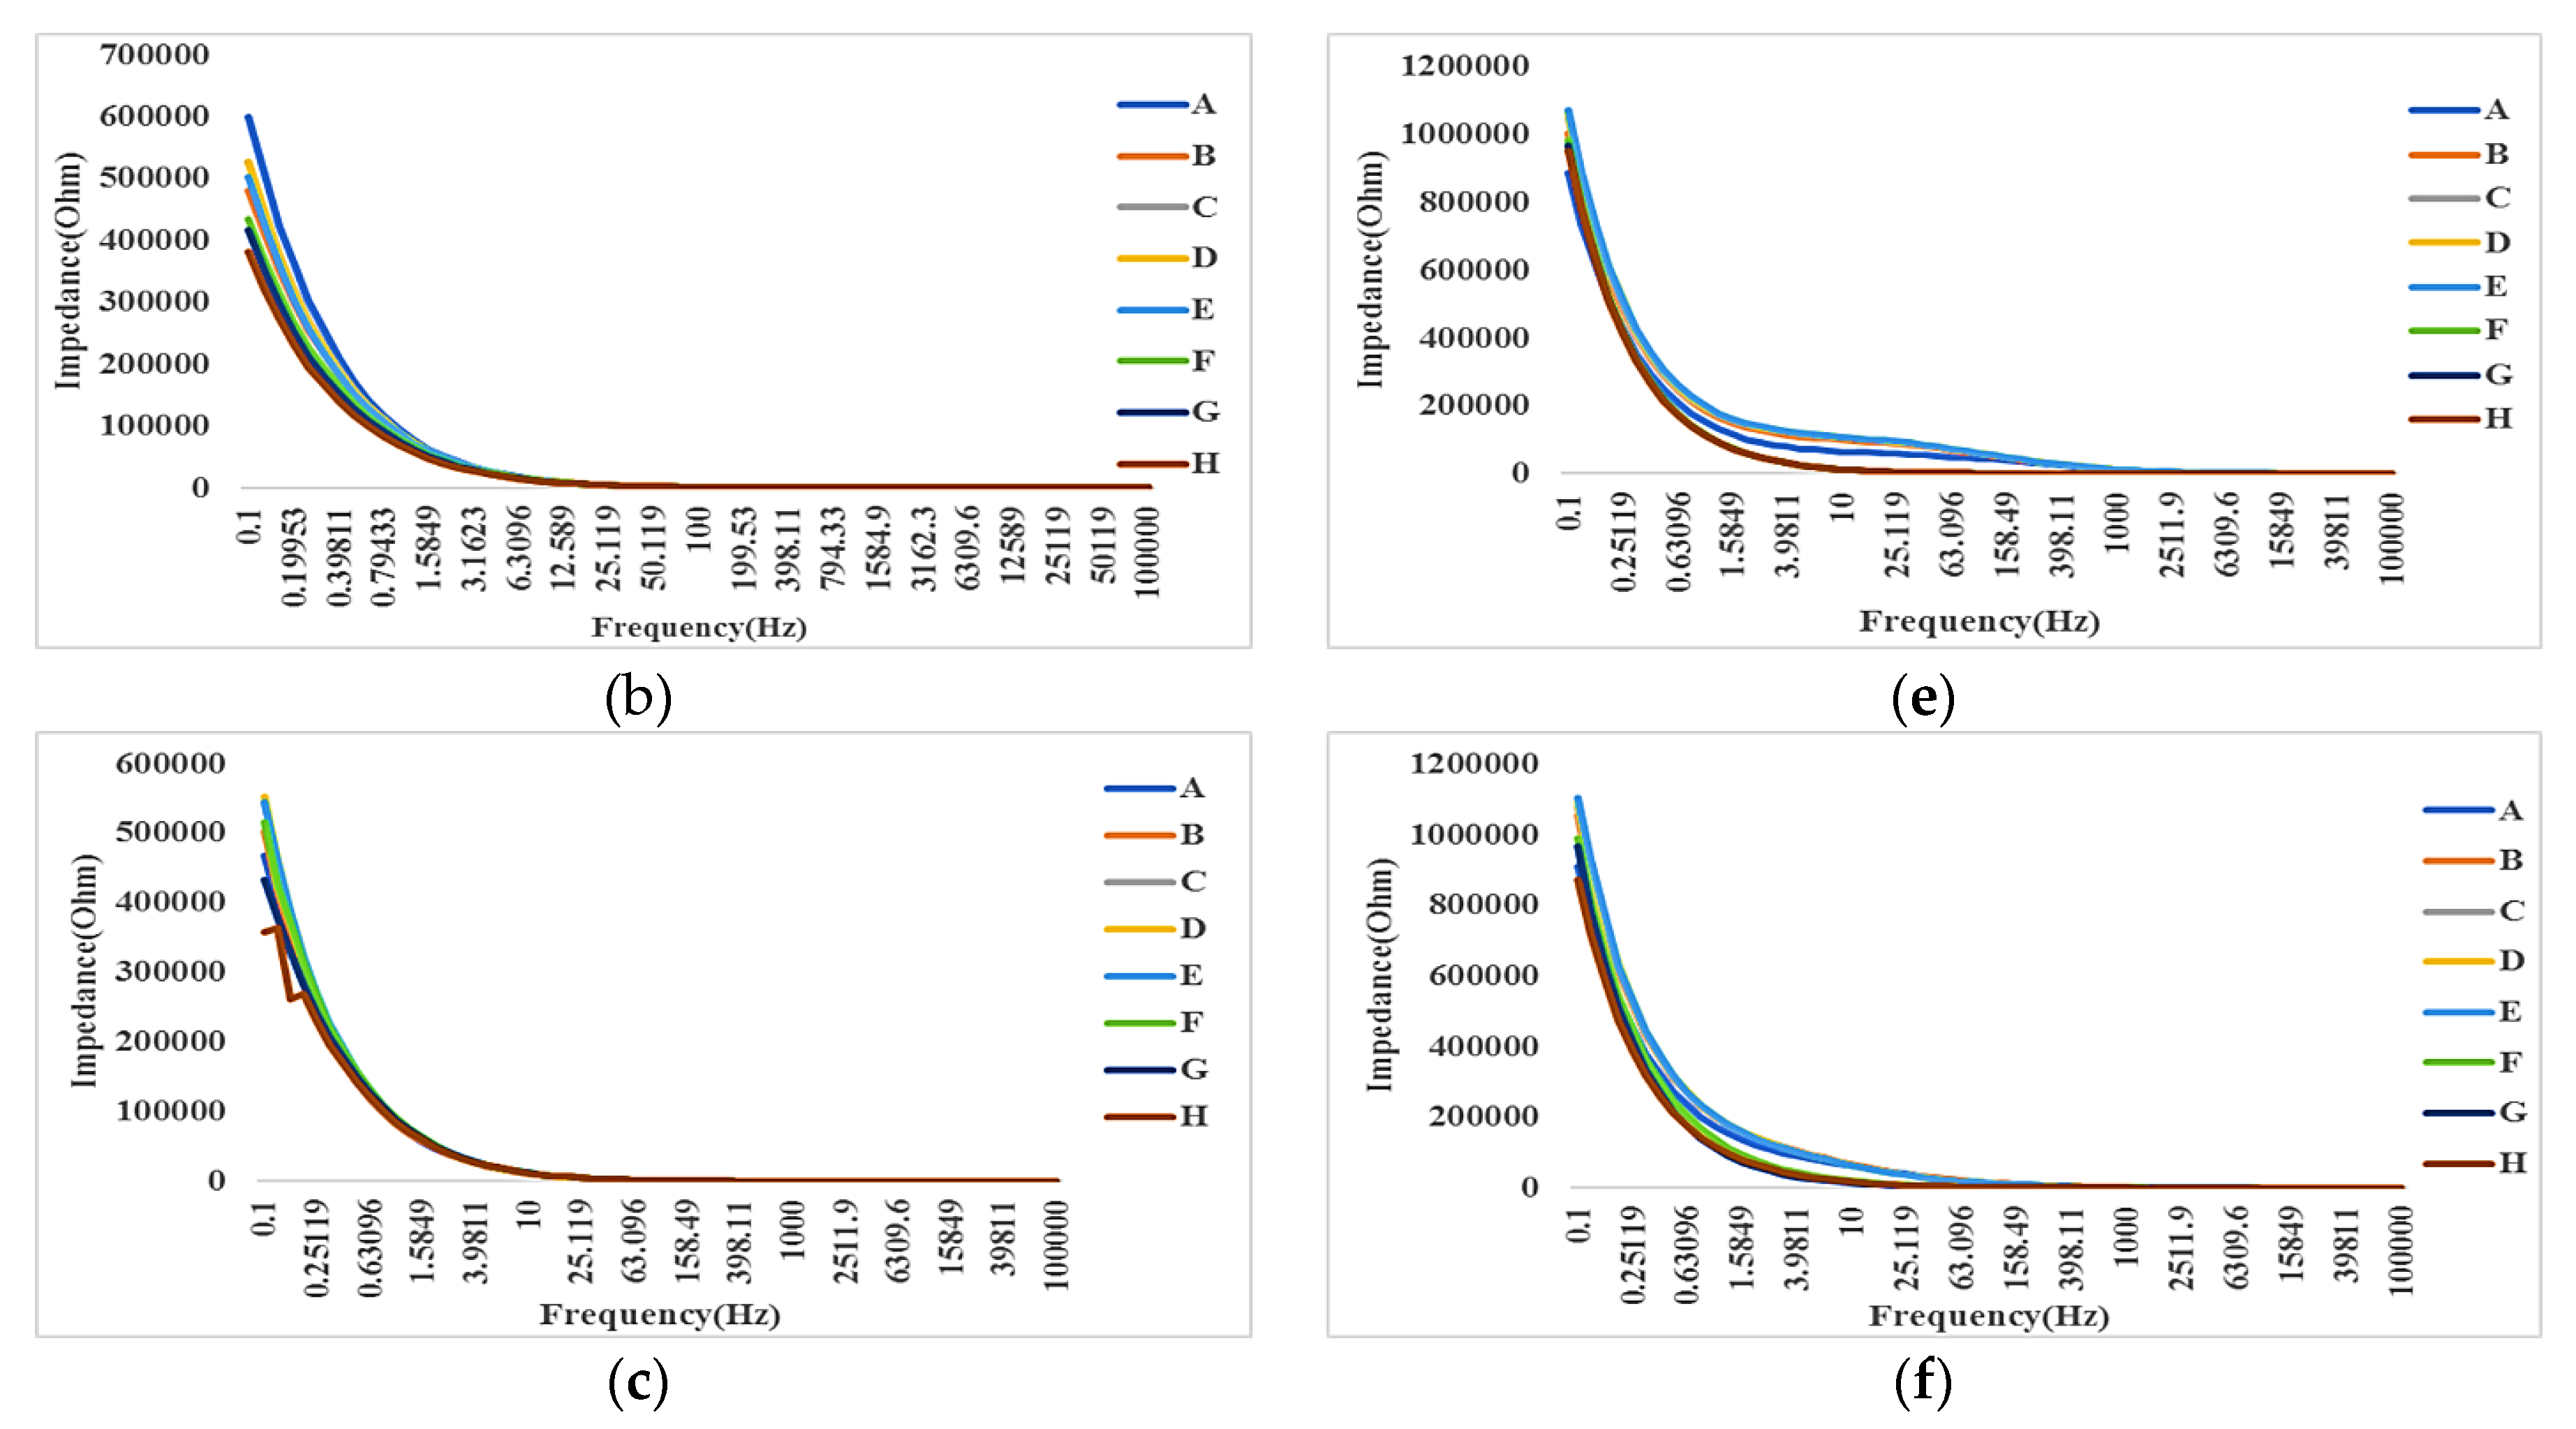
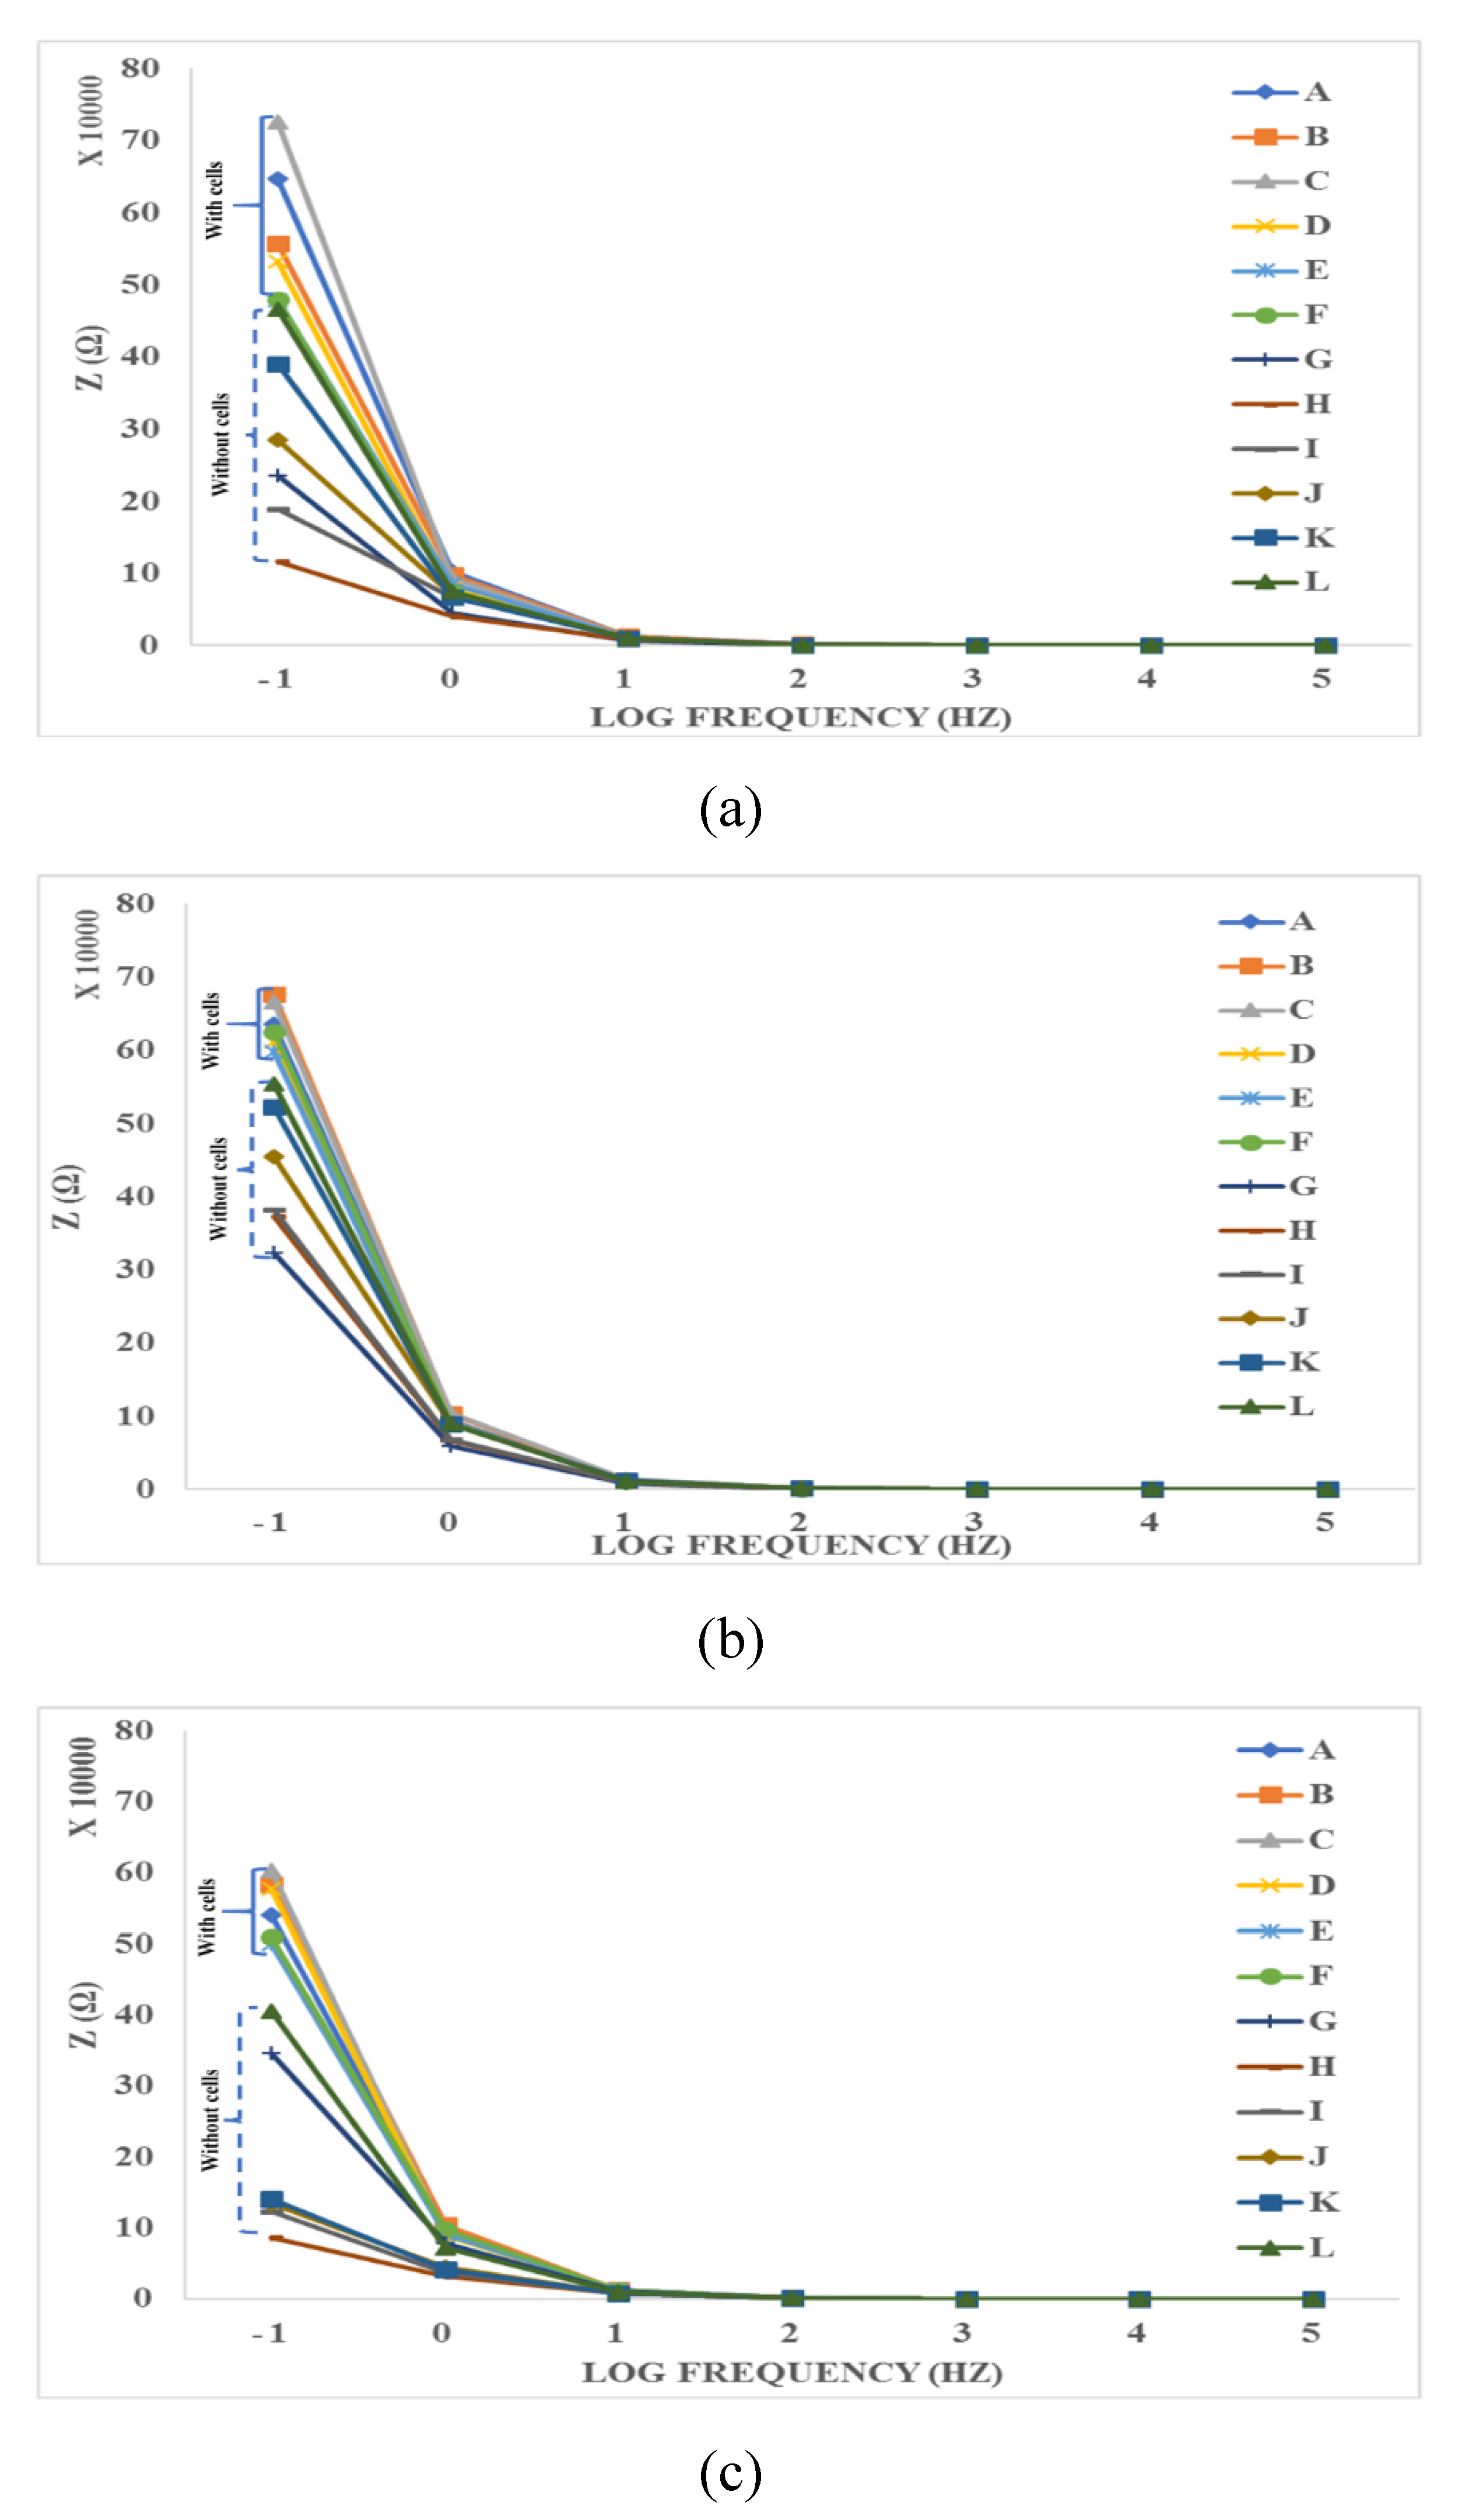
4.3.1. Impedance Spectroscopy
4.3.2. Time-Averaged Impedance Spectroscopy
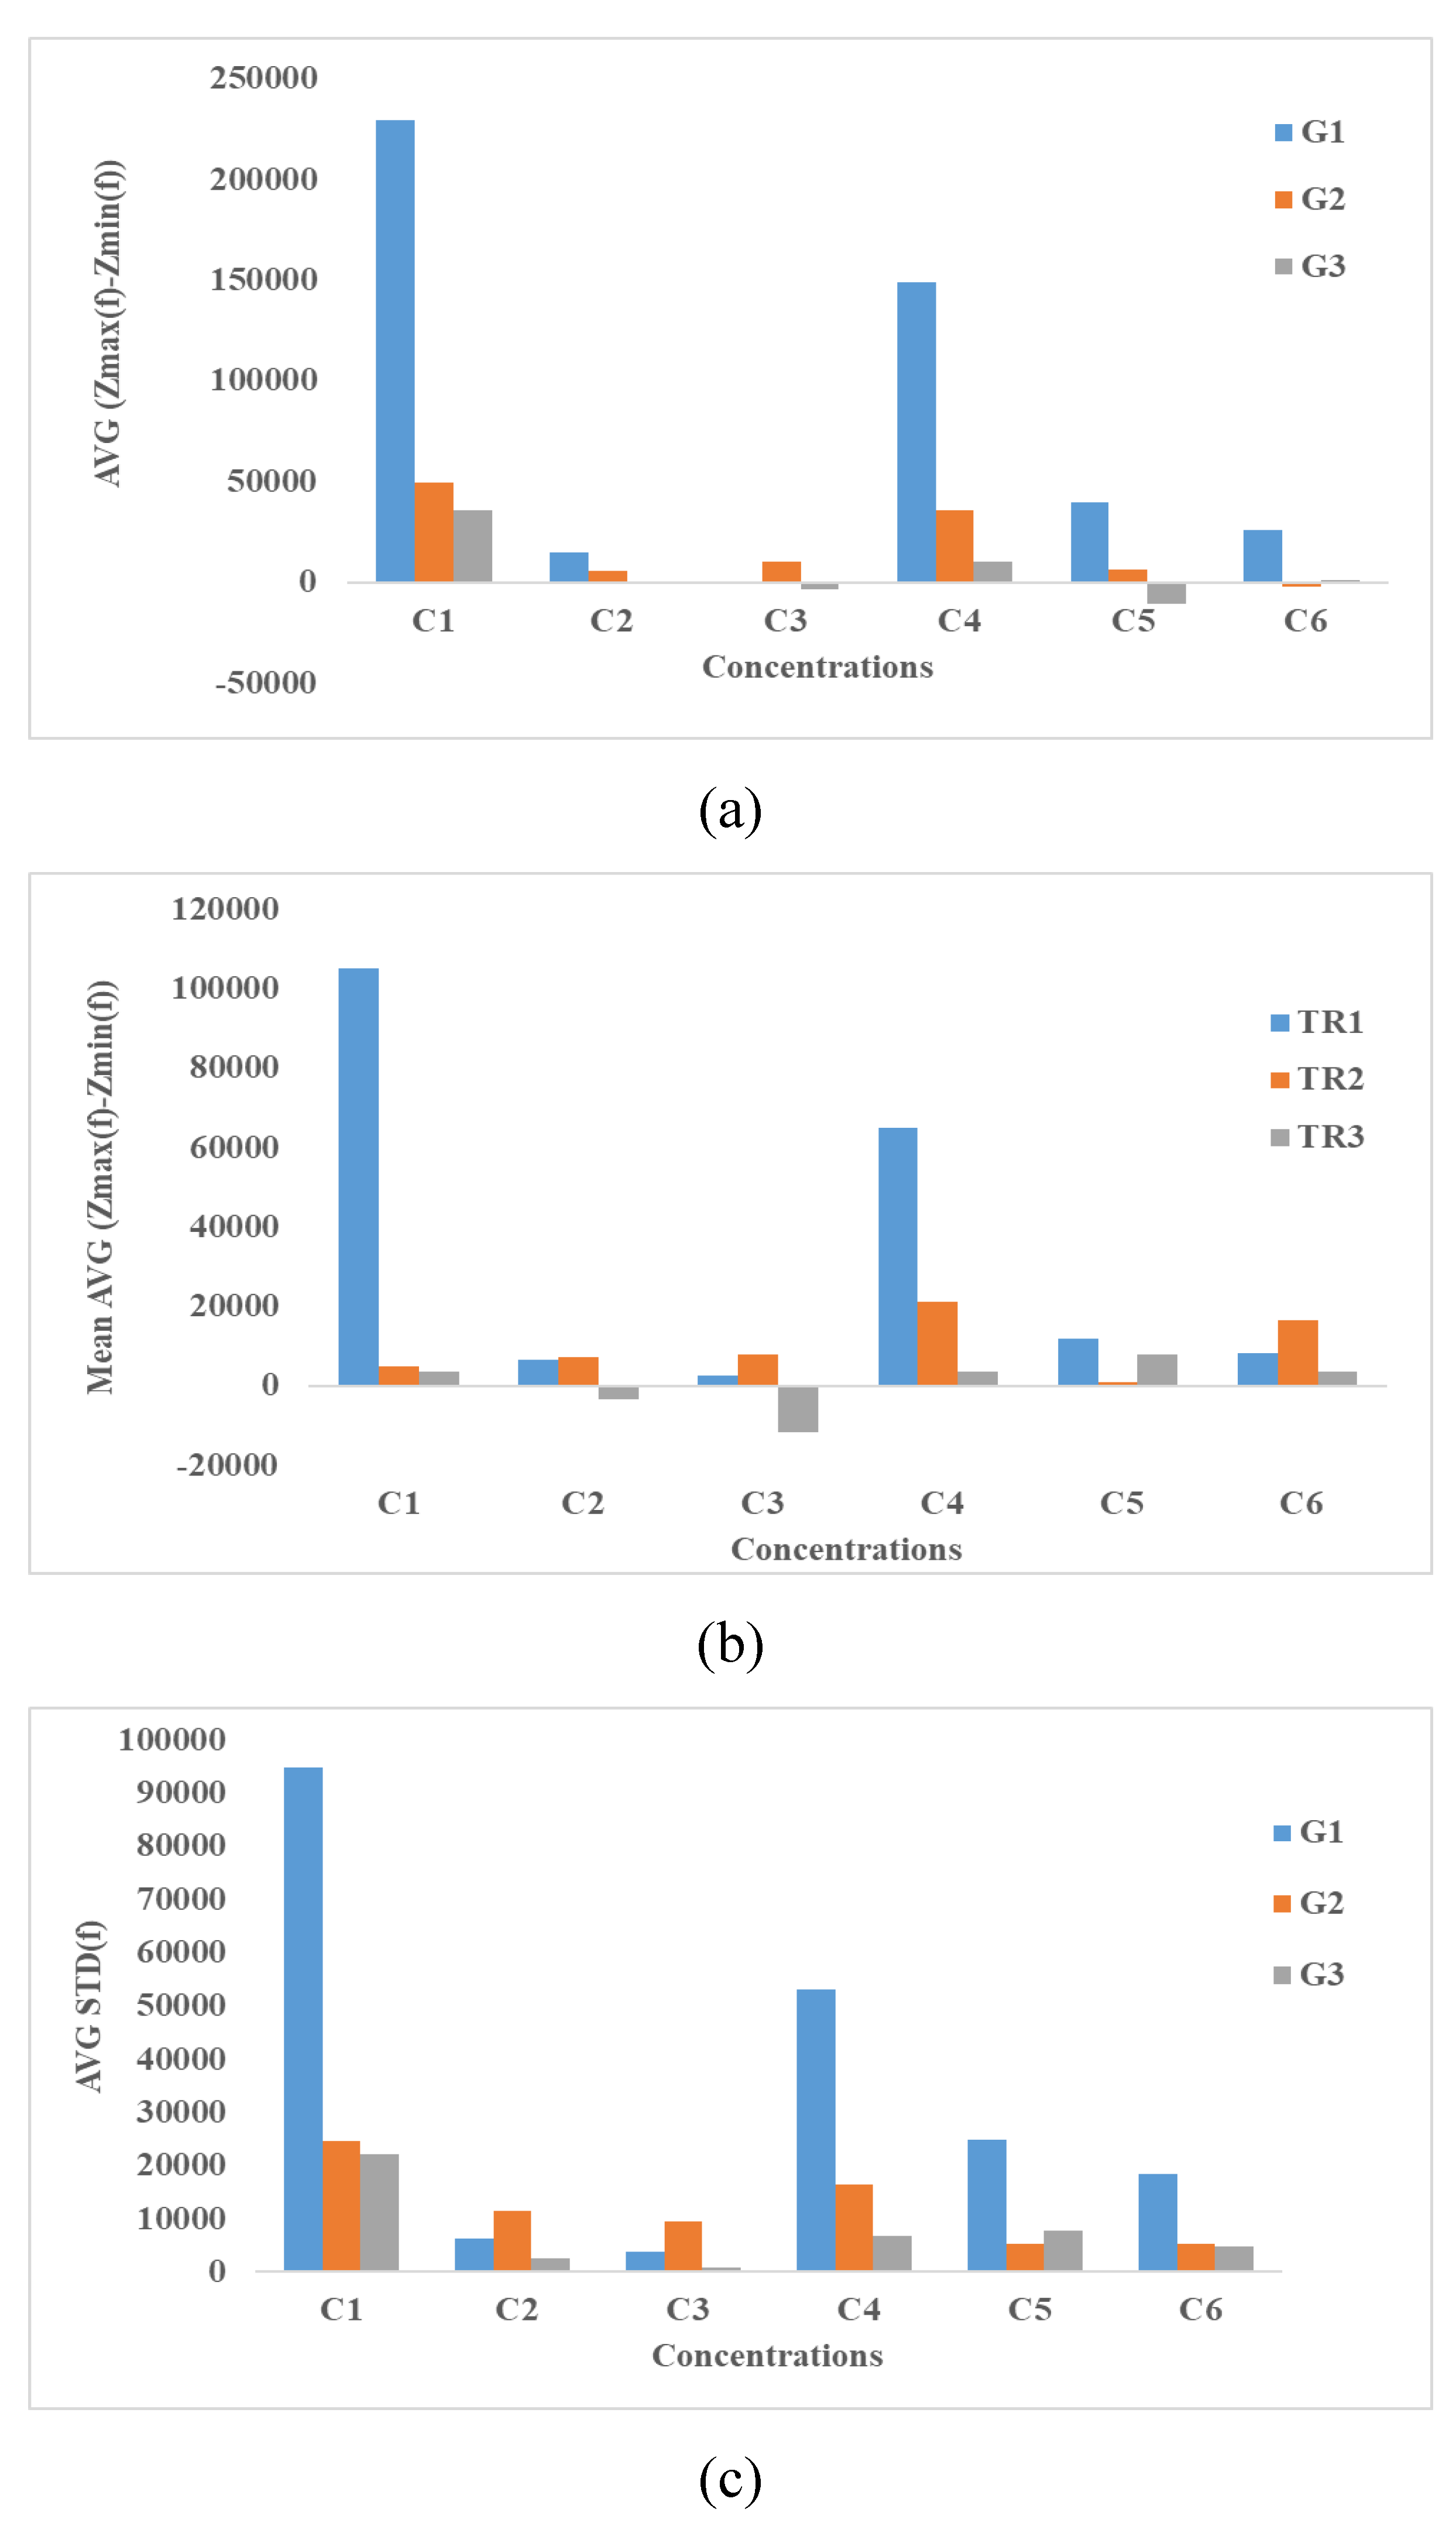
4.3.3. Integration Methods
4.3.4. Equivalent Electrical Circuit’s Method
5. Future Discussion
5.1. Economical Assessment
5.2. Time Assessment
5.3. High Throughput Analysis Device for the Future
6. Conclusions
Author Contributions
Funding
Conflicts of Interest
References
- Weinstein, J.S.; Varallyay, C.G.; Dosa, E.; Gahramanov, S.; Hamilton, B.; Rooney, W.D.; Muldoon, L.L.; Neuwelt, E.A. Superparamagnetic iron oxide nanoparticles: Diagnostic magnetic resonance imaging and potential therapeutic applications in neurooncology and central nervous system inflammatory pathologies, a review. J. Cereb. Blood Flow Metab. 2010, 30, 15–35. [Google Scholar] [CrossRef] [PubMed]
- Poller, J.M.; Zaloga, J.; Schreiber, E.; Unterweger, H.; Janko, C.; Radon, P.; Eberbeck, D.; Trahms, L.; Alexiou, C.; Friedrich, R.P. Selection of potential iron oxide nanoparticles for breast cancer treatment based on in vitro cytotoxicity and cellular uptake. Int. J. Nanomed. 2017, 12, 3207–3220. [Google Scholar] [CrossRef]
- Kang, Y.S.; Risbud, S.; Rabolt, J.F.; Stroeve, P. Synthesis and Characterization of Nanometer-Size Fe3O4 and γ-Fe2O3 Particles. Chem. Mater. 1996, 8, 2209–2211. [Google Scholar] [CrossRef]
- Oude Engberink, R.D.; van der Pol, S.M.A.; Blezer, E.L.A.; Döpp, E.A.; de Vries, H.E. Comparison of SPIO and USPIO for in Vitro Labeling of Human Monocytes: MR Detection and Cell Function. Radiology 2007, 243, 467–474. [Google Scholar] [CrossRef] [PubMed]
- Zlokovic, B.V. The Blood-Brain Barrier in Health and Chronic Neurodegenerative Disorders. Neuron 2008, 57, 178–201. [Google Scholar] [CrossRef] [PubMed]
- Re, F.; Gregori, M.; Masserini, M. Nanotechnology for neurodegenerative disorders. Maturitas 2012, 8, S51–S58. [Google Scholar]
- Masserini, M. Nanoparticles for Brain Drug Delivery. ISRN Biochem. 2013, 2013, 1–18. [Google Scholar] [CrossRef]
- Thomsen, L.B.; Linemann, T.; Pondman, K.M.; Lichota, J.; Kim, K.S.; Pieters, R.J.; Visser, G.M.; Moos, T. Uptake and transport of superparamagnetic iron oxide nanoparticles through human brain capillary endothelial cells. ACS Chem. Neurosci. 2013, 4, 1352–1360. [Google Scholar] [CrossRef]
- Mahmoudi, M.; Sant, S.; Wang, B.; Laurent, S.; Sen, T. Superparamagnetic iron oxide nanoparticles (SPIONs): Development, surface modification and applications in chemotherapy. Adv. Drug Deliv. Rev. 2011, 63, 24–46. [Google Scholar] [CrossRef]
- Singh, N.; Jenkins, G.J.; Asadi, R.; Doak, S.H. Potential toxicity of superparamagnetic iron oxide nanoparticles (SPION). Nano Rev. 2010, 1, 5358. [Google Scholar] [CrossRef]
- Eustaquio, T.; Leary, J.F. Single-cell nanotoxicity assays of superparamagnetic iron oxide nanoparticles. Methods Mol. Biol. 2012, 926, 69–85. [Google Scholar] [PubMed]
- Bashir, M.R.; Bhatti, L.; Marin, D.; Nelson, R.C. Emerging applications for ferumoxytol as a contrast agent in MRI. J. Magn. Reson. Imaging 2015, 41, 884–898. [Google Scholar] [CrossRef] [PubMed]
- Wang, C.; Ravi, S.; Martinez, G.V.; Chinnasamy, V.; Raulji, P.; Howell, M.; Davis, Y.; Mallela, J.; Seehra, M.S.; Mohapatra, S. Dual-purpose magnetic micelles for MRI and gene delivery. J. Control. Release 2012, 163, 82–92. [Google Scholar] [CrossRef] [PubMed]
- Varallyay, P.; Nesbit, G.; Muldoon, L.L.; Nixon, R.R.; Delashaw, J.; Cohen, J.I.; Petrillo, A.; Rink, D.; Neuwelt, E.A. Comparison of two superparamagnetic viral-sized iron oxide particles ferumoxides and ferumoxtran-10 with a gadolinium chelate in imaging intracranial tumors. Am. J. Neuroradiol. 2002, 23, 510–519. [Google Scholar] [PubMed]
- Rausch, M.; Sauter, A.; Frohlich, J.; Neubacher, U.; Radu, E.W.; Rudin, M. Dynamic patterns of USPIO enhancement can be observed in macrophages after ischemic brain damage. Magn. Reson. Med. 2001, 46, 1018–1022. [Google Scholar] [CrossRef] [PubMed]
- Yang, L.; Cao, Z.; Sajja, H.K.; Mao, H.; Wang, L.; Geng, H.; Xu, H.; Jiang, T.; Wood, W.C.; Nie, S.; et al. Development of receptor targeted magnetic iron oxide nanoparticles for efficient drug delivery and tumor imaging. J. Biomed. Nanotechnol. 2008, 4, 439–449. [Google Scholar] [CrossRef]
- Yang, H.H.; Zhang, S.Q.; Chen, X.L.; Zhuang, Z.X.; Xu, J.G.; Wang, X.R. Magnetite-Containing Spherical Silica Nanoparticles for Biocatalysis and Bioseparations. Anal. Chem. 2004, 76, 1316–1321. [Google Scholar] [CrossRef]
- Steitz, B.; Hofmann, H.; Kamau, S.W.; Hassa, P.O.; Hottiger, M.O.; von Rechenberg, B.; Hofmann-Amtenbrink, M.; Petri-Fink, A. Characterization of PEI-coated superparamagnetic iron oxide nanoparticles for transfection: Size distribution, colloidal properties and DNA interaction. J. Magn. Magn. Mater. 2007, 311, 300–305. [Google Scholar] [CrossRef]
- Estelrich, J.; Escribano, E.; Queralt, J.; Busquets, M.A. Iron oxide nanoparticles for magnetically-guided and magnetically-responsive drug delivery. Int. J. Mol. Sci. 2015, 16, 8070–8101. [Google Scholar] [CrossRef]
- Cheong, S.J.; Lee, C.M.; Kim, S.L.; Jeong, H.J.; Kim, E.M.; Park, E.H.; Kim, D.W.; Lim, S.T.; Sohn, M.H. Superparamagnetic iron oxide nanoparticles-loaded chitosan-linoleic acid nanoparticles as an effective hepatocyte-targeted gene delivery system. Int. J. Pharm. 2009, 372, 169–176. [Google Scholar] [CrossRef]
- Pöttler, M.; Fliedner, A.; Schreiber, E.; Janko, C.; Friedrich, R.P.; Bohr, C.; Döllinger, M.; Alexiou, C.; Dürr, S. Impact of Superparamagnetic Iron Oxide Nanoparticles on Vocal Fold Fibroblasts: Cell Behavior and Cellular Iron Kinetics. Nanoscale Res. Lett. 2017, 12, 284. [Google Scholar] [CrossRef] [PubMed][Green Version]
- Hong, H.; Yang, Y.; Zhang, Y.; Cai, W. Non-Invasive Cell Tracking in Cancer and Cancer Therapy. Curr. Top. Med. Chem. 2010, 10, 1237–1248. [Google Scholar] [CrossRef] [PubMed]
- De Leõn-Rodríguez, L.M.; Martins, A.F.; Pinho, M.C.; Rofsky, N.M.; Sherry, A.D. Basic MR relaxation mechanisms and contrast agent design. J. Magn. Reson. Imaging 2015, 42, 545–565. [Google Scholar] [CrossRef] [PubMed]
- Kirsch, J.K. Basic principles of magnetic resonance contrast agents. Top. Magn. Reson. Imaging 1991, 3, 1–18. [Google Scholar] [CrossRef] [PubMed]
- Yin, X.; Russek, S.E.; Zabow, G.; Sun, F.; Mohapatra, J.; Keenan, K.E.; Boss, M.A.; Zeng, H.; Liu, J.P.; Viert, A.; et al. Large T1contrast enhancement using superparamagnetic nanoparticles in ultra-low field MRI. Sci. Rep. 2018, 8, 11863. [Google Scholar] [CrossRef] [PubMed]
- Mendonca Dias, M.H.; Lauterbur, P.C. Ferromagnetic particles as contrast agents for magnetic resonance imaging of liver and spleen. Magn. Reson. Med. 1986, 3, 328–330. [Google Scholar] [CrossRef] [PubMed]
- Gupta, A.K.; Gupta, M. Cytotoxicity suppression and cellular uptake enhancement of surface modified magnetic nanoparticles. Biomaterials 2005, 26, 1565–1573. [Google Scholar] [CrossRef]
- Petri-Fink, A.; Chastellain, M.; Juillerat-Jeanneret, L.; Ferrari, A.; Hofmann, H. Development of functionalized superparamagnetic iron oxide nanoparticles for interaction with human cancer cells. Biomaterials 2005, 26, 2685–2694. [Google Scholar] [CrossRef]
- Fu, T.; Kong, Q.; Sheng, H.; Gao, L. Value of Functionalized Superparamagnetic Iron Oxide Nanoparticles in the Diagnosis and Treatment of Acute Temporal Lobe Epilepsy on MRI. Neural Plast. 2016, 2016, 1–12. [Google Scholar] [CrossRef]
- Wang, Y.; Wang, Y.; Sun, R.; Wu, X.; Chu, X.; Zhou, S.; Hu, X.; Gao, L.; Kong, Q. The treatment value of IL-1β monoclonal antibody under the targeting location of alpha-methyl-l-tryptophan and superparamagnetic iron oxide nanoparticles in an acute temporal lobe epilepsy model 11 Medical and Health Sciences 1109 Neurosciences. J. Transl. Med. 2018, 16, 337. [Google Scholar] [CrossRef]
- Corchero, J.L.; Villaverde, A. Biomedical applications of distally controlled magnetic nanoparticles. Trends Biotechnol. 2009, 27, 468–476. [Google Scholar] [CrossRef]
- Phukan, G.; Shin, T.H.; Shim, J.S.; Paik, M.J.; Lee, J.K.; Choi, S.; Kim, Y.M.; Kang, S.H.; Kim, H.S.; Kang, Y.; et al. Silica-coated magnetic nanoparticles impair proteasome activity and increase the formation of cytoplasmic inclusion bodies in vitro. Sci. Rep. 2016, 6, 29095. [Google Scholar] [CrossRef] [PubMed]
- Wuest, D.M.; Lee, K.H. Optimization of endothelial cell growth in a murine in vitro blood-brain barrier model. Biotechnol. J. 2012, 7, 409–417. [Google Scholar] [CrossRef]
- Helms, H.C.; Abbott, N.J.; Burek, M.; Cecchelli, R.; Couraud, P.O.; Deli, M.A.; Förster, C.; Galla, H.J.; Romero, I.A.; Shusta, E.V.; et al. In vitro models of the blood-brain barrier: An overview of commonly used brain endothelial cell culture models and guidelines for their use. J. Cereb. Blood Flow Metab. 2016, 36, 862–890. [Google Scholar] [CrossRef] [PubMed]
- Shi, D.; Mi, G.J.; Bhattacharya, S.; Nayar, S.; Webster, T.J. Optimizing superparamagnetic iron oxide nanoparticles as drug carriers using an in vitro blood-brain barrier model. Int. J. Nanomed. 2016, 11, 5371–5379. [Google Scholar] [CrossRef] [PubMed]
- Jiang, C.; Yang, S.; Gan, N.; Pan, H.; Liu, H. A method for determination of [Fe3+]/[Fe2+] ratio in superparamagnetic iron oxide. J. Magn. Magn. Mater. 2017, 439, 126–134. [Google Scholar] [CrossRef]
- Huber, D.L. Synthesis, properties, and applications of iron nanoparticles. Small 2005, 1, 482–501. [Google Scholar] [CrossRef] [PubMed]
- Li, L.H.; Xiao, J.; Liu, P.; Yang, G.W. Super adsorption capability from amorphousization of metal oxide nanoparticles for dye removal. Sci. Rep. 2015, 5, 9028. [Google Scholar] [CrossRef]
- Maurizi, L.; Claveau, A.; Hofmann, H. Polymer adsorption on iron oxide nanoparticles for one-step amino-functionalized silica encapsulation. J. Nanomater. 2015, 16, 239. [Google Scholar] [CrossRef]
- Vermeij, E.A.; Koenders, M.I.; Bennink, M.B.; Crowe, L.A.; Maurizi, L.; Vallée, J.P.; Hofmann, H.; Van Den Berg, W.B.; Van Lent, P.L.E.M.; Van De Loo, F.A.J. The in-vivo use of superparamagnetic iron oxide nanoparticles to detect inflammation elicits a cytokine response but does not aggravate experimental arthritis. PLoS ONE 2015, 10, e0126687. [Google Scholar] [CrossRef]
- Galuppo, L.D.; Kamau, S.W.; Steitz, B.; Hassa, P.O.; Hilbe, M.; Vaughan, L.; Koch, S.; Fink-Petri, A.; Hofman, M.; Hofman, H.; et al. Gene expression in synovial membrane cells after intraarticular delivery of plasmid-linked superparamagnetic iron oxide particles—A preliminary study in sheep. J. Nanosci. Nanotechnol. 2006, 6, 2841–2852. [Google Scholar] [CrossRef] [PubMed]
- Polikov, V.; Block, M.; Zhang, C.; Reichert, W.M.; Hong, J.S. In Vitro Models for Neuroelectrodes: A Paradigm for Studying Tissue–Materials Interactions in the Brain. In Indwelling Neural Implants: Strategies for Contending with the In Vivo Environment; CRC Press/Taylor & Francis: Boca Raton, FL, USA, 2008. [Google Scholar]
- Påhlman, S.; Mamaeva, S.; Meyerson, G.; Mattsson, M.E.; Bjelfman, C.; Ortoft, E.; Hammerling, U. Human neuroblastoma cells in culture: A model for neuronal cell differentiation and function. Acta Physiol. Scand. Suppl. 1990, 592, 25–37. [Google Scholar] [PubMed]
- Rall, W. Electrophysiology of a Dendritic Neuron Model. Biophys. J. 1962, 2, 145–167. [Google Scholar] [CrossRef]
- Petri-Fink, A.; Steitz, B.; Finka, A.; Salaklang, J.; Hofmann, H. Effect of cell media on polymer coated superparamagnetic iron oxide nanoparticles (SPIONs): Colloidal stability, cytotoxicity, and cellular uptake studies. Eur. J. Pharm. Biopharm. 2008, 68, 129–137. [Google Scholar] [CrossRef] [PubMed]
- Safi, M.; Courtois, J.; Seigneuret, M.; Conjeaud, H.; Berret, J.F. The effects of aggregation and protein corona on the cellular internalization of iron oxide nanoparticles. Biomaterials 2011, 32, 9353–9363. [Google Scholar] [CrossRef]
- Hauser, A.K.; Mitov, M.I.; Daley, E.F.; McGarry, R.C.; Anderson, K.W.; Hilt, J.Z. Targeted iron oxide nanoparticles for the enhancement of radiation therapy. Biomaterials 2016, 105, 127–135. [Google Scholar] [CrossRef] [PubMed]
- Wiogo, H.T.R.; Lim, M.; Bulmus, V.; Yun, J.; Amal, R. Stabilization of magnetic iron oxide nanoparticles in biological media by fetal bovine serum (FBS). Langmuir 2011, 27, 843–850. [Google Scholar] [CrossRef]
- Singh, S.; Kumar, S.; Yata, V.K. Health Benefits and Potential Risks of Nanostructured Materials. In Environmental Chemistry for a Sustainable World; Dasgupta, N., Ranjan, S., Lichtfouse, E., Eds.; Springer: Cham, Germany, 2019; Volume 21, pp. 109–142. [Google Scholar]
- Lesniak, A.; Salvati, A.; Santos-Martinez, M.J.; Radomski, M.W.; Dawson, K.A.; Åberg, C. Nanoparticle adhesion to the cell membrane and its effect on nanoparticle uptake efficiency. J. Am. Chem. Soc. 2013, 135, 1438–1444. [Google Scholar] [CrossRef]
- Aggarwal, P.; Hall, J.B.; McLeland, C.B.; Dobrovolskaia, M.A.; McNeil, S.E. Nanoparticle interaction with plasma proteins as it relates to particle biodistribution, biocompatibility and therapeutic efficacy. Adv. Drug Deliv. Rev. 2009, 61, 428–437. [Google Scholar] [CrossRef]
- Verma, A.; Stellacci, F. Effect of surface properties on nanoparticle-cell interactions. Small 2010, 6, 12–21. [Google Scholar] [CrossRef]
- Schütz, I.; Lopez-Hernandez, T.; Gao, Q.; Puchkov, D.; JaBerlinbs, S.; Nordmeyer, D.; Schmudde, M.; Rühl, E.; Graf, C.M.; Haucke, V. Lysosomal dysfunction caused by cellular accumulation of silica nanoparticles. J. Biol. Chem. 2016, 291, 14170–14184. [Google Scholar] [CrossRef] [PubMed]
- Karataş, Ö.F.; Sezgin, E.; Aydin, Ö.; Çulha, M. Interaction of gold nanoparticles with mitochondria. Colloids Surf. B Biointerfaces 2009, 71, 315–318. [Google Scholar] [CrossRef] [PubMed]
- Xu, C.; Xie, J.; Kohler, N.; Walsh, E.G.; Chin, Y.E.; Sun, S. Monodisperse magnetite nanoparticles coupled with nuclear localization signal peptide for cell-nucleus targeting. Chem. Asian J. 2008, 3, 548–552. [Google Scholar] [CrossRef] [PubMed]
- McNamara, A.L.; Kam, W.W.Y.; Scales, N.; McMahon, S.J.; Bennett, J.W.; Byrne, H.L.; Schuemann, J.; Paganetti, H.; Banati, R.; Kuncic, Z. Dose enhancement effects to the nucleus and mitochondria from gold nanoparticles in the cytosol. Phys. Med. Biol. 2016, 61, 5993–6010. [Google Scholar] [CrossRef] [PubMed]
- Baranes, K.; Shevach, M.; Shefi, O.; Dvir, T. Gold Nanoparticle-Decorated Scaffolds Promote Neuronal Differentiation and Maturation. Nano Lett. 2016, 16, 2916–2920. [Google Scholar] [CrossRef] [PubMed]
- Chen, H.; Sun, J.; Wang, Z.; Zhou, Y.; Lou, Z.; Chen, B.; Wang, P.; Guo, Z.; Tang, H.; Ma, J.; et al. Magnetic Cell-Scaffold Interface Constructed by Superparamagnetic IONP Enhanced Osteogenesis of Adipose-Derived Stem Cells. ACS Appl. Mater. Interfaces 2018, 10, 44279–44289. [Google Scholar] [CrossRef] [PubMed]
- Poot, M.; Rosato, M.; Rabinovitch, P.S. Analysis of Cell Proliferation and Cell Survival by Continuous BrdU Labeling and Multivariate Flow Cytometry. Curr. Protoc. Cytom. 2001, 15, 7–14. [Google Scholar]
- Rothaeusler, K.; Baumgarth, N. Assessment of cell proliferation by 5-bromodeoxyuridine (BrdU) labeling for multicolor flow cytometry. Curr. Protoc. Cytom. 2007, 40, 7–31. [Google Scholar]
- Strober, W. Trypan blue exclusion test of cell viability. Curr. Protoc. Immunol. 2001, 21, A.3B.1–A.3B.2. [Google Scholar]
- Fritzsche, M.; Fredriksson, J.M.; Carlsson, M.; Mandenius, C.F. A cell-based sensor system for toxicity testing using multiwavelength fluorescence spectroscopy. Anal. Biochem. 2009, 387, 271–275. [Google Scholar] [CrossRef]
- Moczko, E.; Mirkes, E.M.; Cáceres, C.; Gorban, A.N.; Piletsky, S. Fluorescence-based assay as a new screening tool for toxic chemicals. Sci. Rep. 2016, 6, 33922. [Google Scholar] [CrossRef] [PubMed]
- Ceriotti, L.; Ponti, J.; Colpo, P.; Sabbioni, E.; Rossi, F. Assessment of cytotoxicity by impedance spectroscopy. Biosens. Bioelectron. 2007, 22, 3057–3063. [Google Scholar] [CrossRef] [PubMed]
- Ceriotti, L.; Ponti, J.; Broggi, F.; Kob, A.; Drechsler, S.; Thedinga, E.; Colpo, P.; Sabbioni, E.; Ehret, R.; Rossi, F. Real-time assessment of cytotoxicity by impedance measurement on a 96-well plate. Sens. Actuators B Chem. 2007, 123, 769–778. [Google Scholar] [CrossRef]
- Zhang, X.; Li, F.; Nordin, A.N.; Tarbell, J.; Voiculescu, I. Toxicity studies using mammalian cells and impedance spectroscopy method. Sens. Bio-Sens. Res. 2015, 3, 112–121. [Google Scholar] [CrossRef]
- Newbold, C.; Richardson, R.; Millard, R.; Huang, C.; Milojevic, D.; Shepherd, R.; Cowan, R. Changes in biphasic electrode impedance with protein adsorption and cell growth. J. Neural Eng. 2010, 7, 056011. [Google Scholar] [CrossRef] [PubMed]
- Zhu, X.; Hondroulis, E.; Liu, W.; Li, C.Z. Biosensing approaches for rapid genotoxicity and cytotoxicity assays upon nanomaterial exposure. Small 2013, 9, 1821–1830. [Google Scholar] [CrossRef] [PubMed]
- Sadik, O.A.; Zhou, A.L.; Kikandi, S.; Du, N.; Wang, Q.; Varner, K. Sensors as tools for quantitation, nanotoxicity and nanomonitoring assessment of engineered nanomaterials. J. Environ. Monit. 2009, 11, 1782. [Google Scholar] [CrossRef]
- Özel, R.E.; Liu, X.; Alkasir, R.S.J.; Andreescu, S. Electrochemical methods for nanotoxicity assessment. TrAC Trends Anal. Chem. 2014, 59, 112–120. [Google Scholar] [CrossRef]
- Marcus, M.; Karni, M.; Baranes, K.; Levy, I.; Alon, N.; Margel, S.; Shefi, O. Iron oxide nanoparticles for neuronal cell applications: Uptake study and magnetic manipulations. J. Nanobiotechnol. 2016, 14, 37. [Google Scholar] [CrossRef]
- Mahmoudi, M.; Simchi, A.; Imani, M.; Shokrgozar, M.A.; Milani, A.S.; Häfeli, U.O.; Stroeve, P. A new approach for the in vitro identification of the cytotoxicity of superparamagnetic iron oxide nanoparticles. Colloids Surf. B Biointerfaces 2010, 75, 300–309. [Google Scholar] [CrossRef]
- Jarockyte, G.; Daugelaite, E.; Stasys, M.; Statkute, U.; Poderys, V.; Tseng, T.C.; Hsu, S.H.; Karabanovas, V.; Rotomskis, R. Accumulation and toxicity of superparamagnetic iron oxide nanoparticles in cells and experimental animals. Int. J. Mol. Sci. 2016, 17, 1193. [Google Scholar] [CrossRef] [PubMed]
- Magdolenova, Z.; Drlickova, M.; Henjum, K.; Rundén-Pran, E.; Tulinska, J.; Bilanicova, D.; Pojana, G.; Kazimirova, A.; Barancokova, M.; Kuricova, M.; et al. Coating-dependent induction of cytotoxicity and genotoxicity of iron oxide nanoparticles. Nanotoxicology 2015, 9, 44–56. [Google Scholar] [CrossRef]
- Ying, E.; Hwang, H.M. In vitro evaluation of the cytotoxicity of iron oxide nanoparticles with different coatings and different sizes in A3 human T lymphocytes. Sci. Total Environ. 2010, 408, 4475–4481. [Google Scholar] [CrossRef]
- Sun, Z.; Yathindranath, V.; Worden, M.; Thliveris, J.A.; Chu, S.; Parkinson, F.E.; Hegmann, T.; Miller, D.W. Characterization of cellular uptake and toxicity of aminosilane-coated iron oxide nanoparticles with different charges in central nervous system-relevant cell culture models. Int. J. Nanomed. 2013, 8, 961–970. [Google Scholar] [CrossRef] [PubMed]
- Mbeh, D.A.; Mireles, L.K.; Stanicki, D.; Tabet, L.; Maghni, K.; Laurent, S.; Sacher, E.; Yahia, L. Human Alveolar Epithelial Cell Responses to Core-Shell Superparamagnetic Iron Oxide Nanoparticles (SPIONs). Langmuir 2015, 31, 3829–3839. [Google Scholar] [CrossRef]
- Invitrogen. PrestoBlue Cell Viability Reagent Documentation. A13261. 2010. Available online: http://tools.thermofisher.com/content/sfs/manuals/PrestoBlue_Reagent_PIS_15Oct10.pdf (accessed on 6 June 2019).
- Soenen, S.J.H.; Himmelreich, U.; Nuytten, N.; De Cuyper, M. Cytotoxic effects of iron oxide nanoparticles and implications for safety in cell labelling. Biomaterials 2011, 32, 195–205. [Google Scholar] [CrossRef] [PubMed]
- Petters, C.; Dringen, R. Accumulation of iron oxide nanoparticles by cultured primary neurons. Neurochem. Int. 2015, 81, 1–9. [Google Scholar] [CrossRef] [PubMed]
- Munnier, E.; Cohen-Jonathan, S.; Hervé, K.; Linassier, C.; Soucé, M.; Dubois, P.; Chourpa, I. Doxorubicin delivered to MCF-7 cancer cells by superparamagnetic iron oxide nanoparticles: Effects on subcellular distribution and cytotoxicity. J. Nanopart. Res. 2011, 13, 959–971. [Google Scholar] [CrossRef]
- Calero, M.; Chiappi, M.; Lazaro-Carrillo, A.; Rodríguez, M.J.; Chichón, F.J.; Crosbie-Staunton, K.; Prina-Mello, A.; Volkov, Y.; Villanueva, A.; Carrascosa, J.L. Characterization of interaction of magnetic nanoparticles with breast cancer cells. J. Nanobiotechnol. 2015, 13, 16. [Google Scholar] [CrossRef]
- K’Owino, I.O.; Sadik, O.A. Impedance spectroscopy: A powerful tool for rapid biomolecular screening and cell culture monitoring. Electroanalysis 2005, 17, 2101–2113. [Google Scholar] [CrossRef]
- Giaever, I.; Keese, C.R. Monitoring fibroblast behavior in tissue culture with an applied electric field. Proc. Natl. Acad. Sci. USA 1984, 81, 3761–3764. [Google Scholar] [CrossRef] [PubMed]
- Rahman, A.R.A.; Register, J.; Vuppala, G.; Bhansali, S. Cell culture monitoring by impedance mapping using a multielectrode scanning impedance spectroscopy system (CellMap). Physiol. Meas. 2008, 29, S227–S239. [Google Scholar] [CrossRef] [PubMed]
- Sarro, E.; Lecina, M.; Fontova, A.; Sola, C.; Godia, F.; Cairo, J.J.; Bragos, R. Electrical impedance spectroscopy measurements using a four-electrode configuration improve on-line monitoring of cell concentration in adherent animal cell cultures. Biosens. Bioelectron. 2012, 31, 257–263. [Google Scholar] [CrossRef]
- Valero, T.; Jacobs, T.; Moschopoulou, G.; Naumann, M.; Hauptmann, P.; Kintzios, S. Electrical impedance analysis of N2a neuroblastoma cells in gel matrices after ACh-receptor triggering with an impedimetric biosensor. Procedia Chem. 2009, 1, 734–737. [Google Scholar] [CrossRef]
- Seriburi, P.; McGuire, S.; Shastry, A.; Böhringer, K.F.; Meldrum, D.R. Measurement of the cell-substrate separation and the projected area of an individual adherent cell using electric cell-substrate impedance sensing. Anal. Chem. 2008, 80, 3677–3683. [Google Scholar] [CrossRef] [PubMed]
- Witzel, F.; Fritsche-Guenther, R.; Lehmann, N.; Sieber, A.; Blüthgen, N. Analysis of impedance-based cellular growth assays. Bioinformatics 2015, 31, 2705–2712. [Google Scholar] [CrossRef] [PubMed]
- Lo, C.M.; Keese, C.R.; Giaever, I. Impedance analysis of MDCK cells measured by electric cell-substrate impedance sensing. Biophys. J. 1995, 69, 2800–2807. [Google Scholar] [CrossRef]
- Wang, W.; Foley, K.; Shan, X.; Wang, S.; Eaton, S.; Nagaraj, V.J.; Wiktor, P.; Patel, U.; Tao, N. Single cells and intracellular processes studied by a plasmonic-based electrochemical impedance microscopy. Nat. Chem. 2011, 3, 249–255. [Google Scholar] [CrossRef]
- Collins, A.R.; Annangi, B.; Rubio, L.; Marcos, R.; Dorn, M.; Merker, C.; Estrela-Lopis, I.; Cimpan, M.R.; Ibrahim, M.; Cimpan, E.; et al. High throughput toxicity screening and intracellular detection of nanomaterials. Wiley Interdiscip. Rev. Nanomed. Nanobiotechnol. 2017, 9, e1413. [Google Scholar] [CrossRef]
- Moe, B.; Gabos, S.; Li, X.F. Real-time cell-microelectronic sensing of nanoparticle-induced cytotoxic effects. Anal. Chim. Acta 2013, 789, 83–90. [Google Scholar] [CrossRef]
- Ghafar-Zadeh, E.; Sawan, M.; Chodavarapu, V.P. Micro-Organism-on-Chip: Emerging direct-write CMOS-Based platform for biological applications. IEEE Trans. Biomed. Circuits Syst. 2009, 3, 212–219. [Google Scholar] [CrossRef] [PubMed]
- Williams, J.C.; Hippensteel, J.A.; Dilgen, J.; Shain, W.; Kipke, D.R. Complex impedance spectroscopy for monitoring tissue responses to inserted neural implants. J. Neural Eng. 2007, 4, 410–423. [Google Scholar] [CrossRef] [PubMed]
- Szulcek, R.; Bogaard, H.J.; van Nieuw Amerongen, G.P. Electric Cell-substrate Impedance Sensing for the Quantification of Endothelial Proliferation, Barrier Function, and Motility. J. Vis. Exp. 2014, 85, e51300. [Google Scholar] [CrossRef] [PubMed]
- Arias, L.R.; Perry, C.A.; Yang, L. Real-time electrical impedance detection of cellular activities of oral cancer cells. Biosens. Bioelectron. 2010, 25, 2225–2231. [Google Scholar] [CrossRef] [PubMed]
- Asphahani, F.; Wang, K.; Thein, M.; Veiseh, O.; Yung, S.; Xu, J.; Zhang, M. Single-cell bioelectrical impedance platform for monitoring cellular response to drug treatment. Phys. Biol. 2011, 8, 015006. [Google Scholar] [CrossRef] [PubMed]
- Peters, M.F.; Lamore, S.D.; Guo, L.; Scott, C.W.; Kolaja, K.L. Human Stem Cell-Derived Cardiomyocytes in Cellular Impedance Assays: Bringing Cardiotoxicity Screening to the Front Line. Cardiovasc. Toxicol. 2015, 15, 127–139. [Google Scholar] [CrossRef]
- Kuzmanov, I.; Herrmann, A.M.; Galla, H.-J.; Meuth, S.G.; Wiendl, H.; Klotz, L. An In Vitro Model of the Blood-brain Barrier Using Impedance Spectroscopy: A Focus on T Cell-endothelial Cell Interaction. J. Vis. Exp. 2016, 118, e54592. [Google Scholar] [CrossRef]
- Klebe, R.J. Klebe and Ruddle Neuroblastoma: Cell culture analysis of a differentiating stem cell system. J. Cell Biol. 1969, 43, 69A. [Google Scholar]
- SkySpring Nanomaterials Inc. Iron Oxide Nanoparticles/Nanopowder (Fe3O4, 10~15 nm, 98+%). 2016. Available online: https://ssnano.com/inc/sdetail/iron-oxide-nanoparticles---nanopowder---fe3o4--10-15nm--98---/123/8881 (accessed on 6 June 2019).
- Jiang, L.; Liu, J.; Shi, J.; Li, X.; Li, H.; Liu, J.; Ye, J.; Chen, Y. Impedance monitoring of cell adhesion and growth on mesoporous membrane. Microelectron. Eng. 2011, 88, 1722–1725. [Google Scholar] [CrossRef]
- Naqvi, S.; Samim, M.; Abdin, M.Z.; Ahmed, F.J.; Maitra, A.N.; Prashant, C.K.; Dinda, A.K. Concentration-dependent toxicity of iron oxide nanoparticles mediated by increased oxidative stress. Int. J. Nanomed. 2010, 5, 983–989. [Google Scholar] [CrossRef]
- Tan, S. Toward A High Throughput Label-Free Platform for Monitoring Interaction Between Cells and Superparamagnetic Iron Oxide Nanoparticles. In Proceedings of the 2018 IEEE Life Sciences Conference (LSC), Montreal, QC, Canada, 28–30 October 2018. [Google Scholar]
- Lindemann, A.; Lüdtke-Buzug, K.; Fräderich, B.M.; Gräfe, K.; Pries, R.; Wollenberg, B. Biological impact of superparamagnetic iron oxide nanoparticles for magnetic particle imaging of head and neck cancer cells. Int. J. Nanomed. 2014, 9, 5025–5040. [Google Scholar] [CrossRef] [PubMed]
- Chen, C.S.; Mrksich, M.; Huang, S.; Whitesides, G.M.; Ingber, D.E. Geometric control of cell life and death. Science 1997, 276, 1425–1428. [Google Scholar] [CrossRef] [PubMed]


| Cell | Type | Coat | Size nm | Qualitative Effects | Characterization | Ref. |
|---|---|---|---|---|---|---|
| 1R-PC12 | MNP | No | 10 | The increase of MNPs does not affect cell viability. MNPs were attached on the outer membrane of the cell and did not penetrate the cells. No cytotoxic effect up to 0.1 mg/mL but at a high concentration of 0.25 mg/mL, 51% of the PC12 cells remained viable after 72 h | XTT cell viability assay, Imaging, and morphometric analysis, 2Elec. | [71] |
| NR-PC12 | MNP | Starch | 10 | The slight decrease in cell viability after 72 h MNPs concentration increased (80 and 70% viability at 0.02 and 0.1 mg/mL, respectively). At 0.25 mg/mL, MNPs were toxic to PC12 cells. After 24 h no cells remained viable | ||
| R-PC12 | MNP | Dextran | 10 | Cell viability decreased at an MNP concentration of 0.25 mg/mL | ||
| R-PC12 | MNP | NO | 20 | MNPs penetrated the cell without any toxic effect. Morphology patterns of cells are not affected | ||
| 3L929 | SPION | 4PVA | 20–30 | 17.8% uncoated & 34.6% modified SPIONs viability, Affects viability, Bubble formation | Ultraviolet visible spectroscopy (UV/vis), MTT Assay, Optical Microscopy | [72] |
| 5NIH3T3 | SPION | 10–50 | 95% of the cells were viable within 3–24 h of incubation and a slight decrease in viability was observed after 48 h of incubation. A slight reduction of viability, Localization of SPIONs in the vesicle, No functionalized SPIONs accumulation in cells, nucleus, and none are toxic at a desirable concentration, negative contrast in the MRI | XTT cell viability assay, bright-field microscopy, MR Imaging | [73] | |
| 6TK6 | Iron oxide U-Fe3O4 | No | 5–13 | U-Fe3O4 NPs did not show a toxic effect, The TBE assay showed slightly reduced cell viability, of TK6 cells at 45 mg/cm2 (76% after 0.5 h; 66% after 2 h) whereas 75 mg/cm2 strongly decreased cell viability (42.5% after 0.5 h; 48% after 2 h) | Trypan blue exclusion. Relative Growth Activity Assay using Automated Cell Counter (Invitrogen). CBPI and by incorporation of 3H-TdR into DNA of proliferating blood cells. Electron Microscopy | [74] |
| 6TK6 | iron oxide OC-Fe3O4 | Oleate | 5–12 | OC-Fe3O4 NPs were found to be toxic and affected DNA and morphology of the cells, Viability was reduced to 7.5% for those that were exposed to 30 mg/cm2 OC-Fe3O4 NPs | ||
| 7A3 | Iron oxide | 8Car/A-G | 10–50 | LC50 of A3 on 1hr-FDA, 24hr FDA, and WST-1 assay, Toxicity vary with the mass concentration, the total number of particles per well, and the total surface area of particles per well | Fluorescein diacetate (FDA) uptake based cytotoxicity assay, WST-1 Assay | [75] |
| 9bEnd.3 | AmS-IONPs | 10AminS | 27 | Toxicity is dependent on surface coating. At concentration above 200 µg/mL reduced neuron viability by 50% in the presence or absence of a magnetic field, 20% reductions in viability were observed with COOH-AmS-IONPs. With an applied magnetic field, AmS-IONPs reduced viability to 75% in astrocyte cultures. COOH-AmS-IONPs caused 65% and 35% viability reduction in the absence and presence of a magnetic field, respectively | MTT Assay, Electron Microscopy | [76] |
| 11A549 | SPIONs | No | 9.3 ± 1.4 | Viability Fe3O4@COOH is greater than 80% at 1000 μg/mL compared to control cells, while bare Fe3O4 and Fe3O4@NH2 displayed viability higher than 80% at a concentration of 100 μg/mL and less. No mortality was observed, Decreased cell Proliferation, Effect was dose-dependent | Trypan Blue Dye Exclusion Assay, MTT Assay, Resazurin based PrestoBlue (PB) assay | [77] |
| 11A549 | SPIONs | @NH2 | 9 ± 1.3 | |||
| 11A549 | SPIONs | @COOH | 10.4 ± 1.6 | |||
| 12C17.2/PC12 | iron oxide | 13DexE | 14 | Endorem uptake = 46.59 ± 4.70 μg Fe/cell. | lactate dehydrogenase assay, CytoTox 96 non-radioactive cytotoxicity assay, manual counting using a Bürker Chamber was used for cell proliferation, No significant changes in cell surface area between control cells and IONP-treated cells could be observed, High intracellular IONP concentrations affect focal adhesions and proliferation, (slows cell cycle progression and decrease proliferation) | [79] |
| 12C17.2/PC12 | iron oxide | 14CarXR | 14 | Resovist uptake = 31.99 ± 2.99 μg Fe/cell. | ||
| 12C17.2/PC12 | iron oxide | lipid-coated 15MLs and | 14 | Cationic MLs = 67.37 ± 5.98 pg Fe/cell | ||
| 12C17.2/PC12 | iron oxide | 16VSOP | 14 | VSOPs uptake = 18.65 ± 2.07 pg Fe/cell Control = 100% viability The NPs value being uptaken | ||
| 17RCGC | MNPs | 18DMSA | 80/120 | alter the cell morphology nor compromise cell viability, concentration and time-dependent, DMSA-coated IONPs are not acutely toxic to cultured neurons and that a protein corona around the particles strongly affects their interaction with neurons, cell viability indicated by the low extracellular LDH activity (around 20% of total), while 80% of the LDH remained cellular | lactate dehydrogenase (LDH), MTT assay | [80] |
| 19MCF-7 | SPIONs | 20DOX | 10 ± 2 | DOX-SPION suspension was significantly more active against MCF-7 cells than DOX solution, DOX in solution = 10% mortality, DOX-SPION suspension cell mortality = nearly 40%, | tetrazolium dye (MTT) assay | [81] |
| 19MCF-7 | SPIONs | 18DMSA | 15 | At 24 h MTT Assay ≥ 96% viability about the control, Trypan Blue Assay ≥ 90% cell survival. There was no significant effect on cell morphology, cytoskeleton organization, cell cycle distribution, reactive oxygen species generation, and cell viability compared to the control | MTT Assay, Trypan Blue Assay, Bright field, and fluorescence microscopy | [82] |
| Cells/tissue | Types of Impedance-Based Assay | Cellular Analysis | Ref. |
|---|---|---|---|
| 1S1barrel cortex | Impedance spectra using HP4284 LCR meter with Implanted electrodes | Identify changes of impedance magnitude at 1kHz. Results suggested that change in impedance is due to the distribution and reactions of cells around the implanted electrodes. | [95] |
| 2MVEC | 7ECIS | Quantify cell behavior such as adhesion, proliferation, cell migration, formation, and maturation of a confluent cell barrier, and wound healing after the application of an electrical wound | [96] |
| 3OSCC | ECIS | Monitor cell adhesion, spreading, proliferation and apoptosis after the addition of anti-cancer drug-cisplatin. | [97] |
| 4MBMEC | Impedance spectroscopy using cellZscope | Investigate the integrity and permeability of endothelial cells. | [100] |
| 5U87MG | Single-cell bioelectrical impedance using single and multi-cell electrodes | Monitor change in shape and impedance after introducing chlorotoxin, an ion channel inhibitor. | [98] |
| 6hESC-CMs | Cardiomyocytes Impedance Assay using gold film electrodes and MEA | Detection of beating and toxicity of drugs to cardiomyocytes | [99] |
| f | T1 | T2 | … | T8 | ZMAX(f) | ZMIN(f) | ZMAX−ZMIN(f) |
|---|---|---|---|---|---|---|---|
| f1 | Z0(f1) | Z1(f1) | … | Z72(f1) | Max (Z0(f1) … Z72(f1)) | Min (Z0(f1) … Z72(f1)) | ZMax−ZMIN(f1) |
| f2 | Z0(f2) | Z1(f2) | … | Z72(f2) | Max (Z0(f2) … Z72(f2)) | Min (Z0(f1) … Z72(f1)) | ZMax−ZMIN(f2) |
| … | … | … | … | … | … | … | … |
| fN | Z0(fN) | Z1(fN) | … | Z72(fN) | Max (Z0(fN) … Z72(fN)) | Min (Z0(f1) … Z72(f1)) | Zmaz−ZMIN(fN) |
| f | T1 | T2 | … | T8 |
|---|---|---|---|---|
| f1 | Z0(f1) | Z1(f1) | … | Z72(f1) |
| f2 | Z0(f2) | Z1(f2) | … | Z72(f2) |
| … | … | … | … | … |
| fN | Z0(fN) | Z1(fN) | … | Z72(fN) |
| f1–fN | C0, R1,0, R2,0 | C1,1, R1,1, R2,1 | … | C 72, R1,72, R2,72 |
| F | AVG (f) | STD(f) | ZMAX−ZMIN(f)/AVG(f) |
|---|---|---|---|
| f1 | AVG (Z0(f1) … Z72(f1)) | STD (Z0(f1) … Z72(f1)) | ZMax−ZMIN(f1)/AVG(f1) |
| f2 | AVG (Z0(f2) … Z72(f2)) | STD (Z0(f1) … Z72(f1)) | ZMax−ZMIN(f2)/AVG(f2) |
| … | … | … | … |
| fN | AVG (Z0(fN) … Z72(fN)) | STD (Z0(f1) … Z72(fN)) | Zmaz−ZMIN(fN))/AVG(fN) |
| Frequency | T1 | T2 | T3 | T4 | T5 | T6 | T7 | T8 |
|---|---|---|---|---|---|---|---|---|
| 0.1 | 1,591,311 | 1,788,090 | 1,845,433 | 1,905,271 | 1,936,466 | 2,551,464 | 2,646,480 | 2,483,508 |
| 0.12589 | 1,392,229 | 1,613,690 | 1,654,271 | 1,705,281 | 1,740,582 | 2,358,748 | 2,393,614 | 2,261,709 |
| 0.15849 | 1,229,815 | 1,444,350 | 1,489,574 | 1,552,677 | 1,580,039 | 2,194,239 | 2,242,218 | 2,077,649 |
| 0.19953 | 1,100,665 | 1,306,554 | 1,349,952 | 1,402,120 | 1,420,733 | 2,052,875 | 2,064,253 | 1,917,803 |
| 0.25119 | 986,997.7 | 1,195,129 | 1,236,538 | 1,279,733 | 1,300,714 | 1,897,634 | 1,919,006 | 1,770,034 |
| 0.31623 | 895,652.1 | 1,091,249 | 1,135,028 | 1,172,615 | 1,195,926 | 1,761,568 | 1,799,637 | 1,629,005 |
| 0.39811 | 822,172.1 | 1,018,880 | 1,057,300 | 1,087,263 | 1,113,011 | 1,680,547 | 1,677,912 | 1,525,727 |
| 0.50119 | 751,371.5 | 952,111 | 990,455.9 | 1,019,149 | 1,046,336 | 1,594,401 | 1,576,466 | 1,419,292 |
| 0.63096 | 712,562.2 | 900,056 | 938,485.5 | 977,048.7 | 990,141.5 | 1,478,979 | 1,491,643 | 1,323,400 |
| 0.79433 | 664,134.2 | 856,963.1 | 892,184.2 | 915,849.7 | 946,656.1 | 1,457,470 | 1,394,427 | 1,232,235 |
| 1 | 627,103.2 | 818,777.4 | 853,829.3 | 883,702.3 | 904,551.5 | 1,357,505 | 1,305,211 | 1,147,258 |
| … | … | … | … | … | … | … | … | … |
| 25,119 | 2644.421 | 2698.195 | 2725.695 | 2741.836 | 2736.834 | 3013.611 | 3282.717 | 3493.791 |
| 31,623 | 2424.111 | 2486.919 | 2519.135 | 2537.534 | 2534.271 | 2838.178 | 3113.052 | 3330.472 |
| 39,811 | 2247.619 | 2316.085 | 2352.01 | 2371.349 | 2370.603 | 2688.499 | 2965.835 | 3184.751 |
| 50,119 | 2103.743 | 2173.723 | 2209.435 | 2232.546 | 2232.609 | 2555.514 | 2826.027 | 3048.819 |
| 63,096 | 1984.099 | 2052.586 | 2089.326 | 2112.155 | 2113.513 | 2429.64 | 2689.563 | 2913.769 |
| 79,433 | 1881.111 | 1947.183 | 1981.887 | 2004.221 | 2006.622 | 2307.667 | 2551.561 | 2773.715 |
| 100,000 | 1789.252 | 1848.986 | 1882.076 | 1903.488 | 1906.164 | 2183.312 | 2401.9 | 2619.237 |
© 2019 by the authors. Licensee MDPI, Basel, Switzerland. This article is an open access article distributed under the terms and conditions of the Creative Commons Attribution (CC BY) license (http://creativecommons.org/licenses/by/4.0/).
Share and Cite
Abad Tan, S.; Zoidl, G.; Ghafar-Zadeh, E. A Multidisciplinary Approach toward High Throughput Label-Free Cytotoxicity Monitoring of Superparamagnetic Iron Oxide Nanoparticles. Bioengineering 2019, 6, 52. https://doi.org/10.3390/bioengineering6020052
Abad Tan S, Zoidl G, Ghafar-Zadeh E. A Multidisciplinary Approach toward High Throughput Label-Free Cytotoxicity Monitoring of Superparamagnetic Iron Oxide Nanoparticles. Bioengineering. 2019; 6(2):52. https://doi.org/10.3390/bioengineering6020052
Chicago/Turabian StyleAbad Tan, Sonia, Georg Zoidl, and Ebrahim Ghafar-Zadeh. 2019. "A Multidisciplinary Approach toward High Throughput Label-Free Cytotoxicity Monitoring of Superparamagnetic Iron Oxide Nanoparticles" Bioengineering 6, no. 2: 52. https://doi.org/10.3390/bioengineering6020052
APA StyleAbad Tan, S., Zoidl, G., & Ghafar-Zadeh, E. (2019). A Multidisciplinary Approach toward High Throughput Label-Free Cytotoxicity Monitoring of Superparamagnetic Iron Oxide Nanoparticles. Bioengineering, 6(2), 52. https://doi.org/10.3390/bioengineering6020052