3D Printing for Bio-Synthetic Biliary Stents

 , , , ,
Abstract
1. Introduction
2. Materials and Methods
2.1. PVA Stent Fabrication and Crosslinking
2.2. Collagen Injection Mold Chamber Fabrication
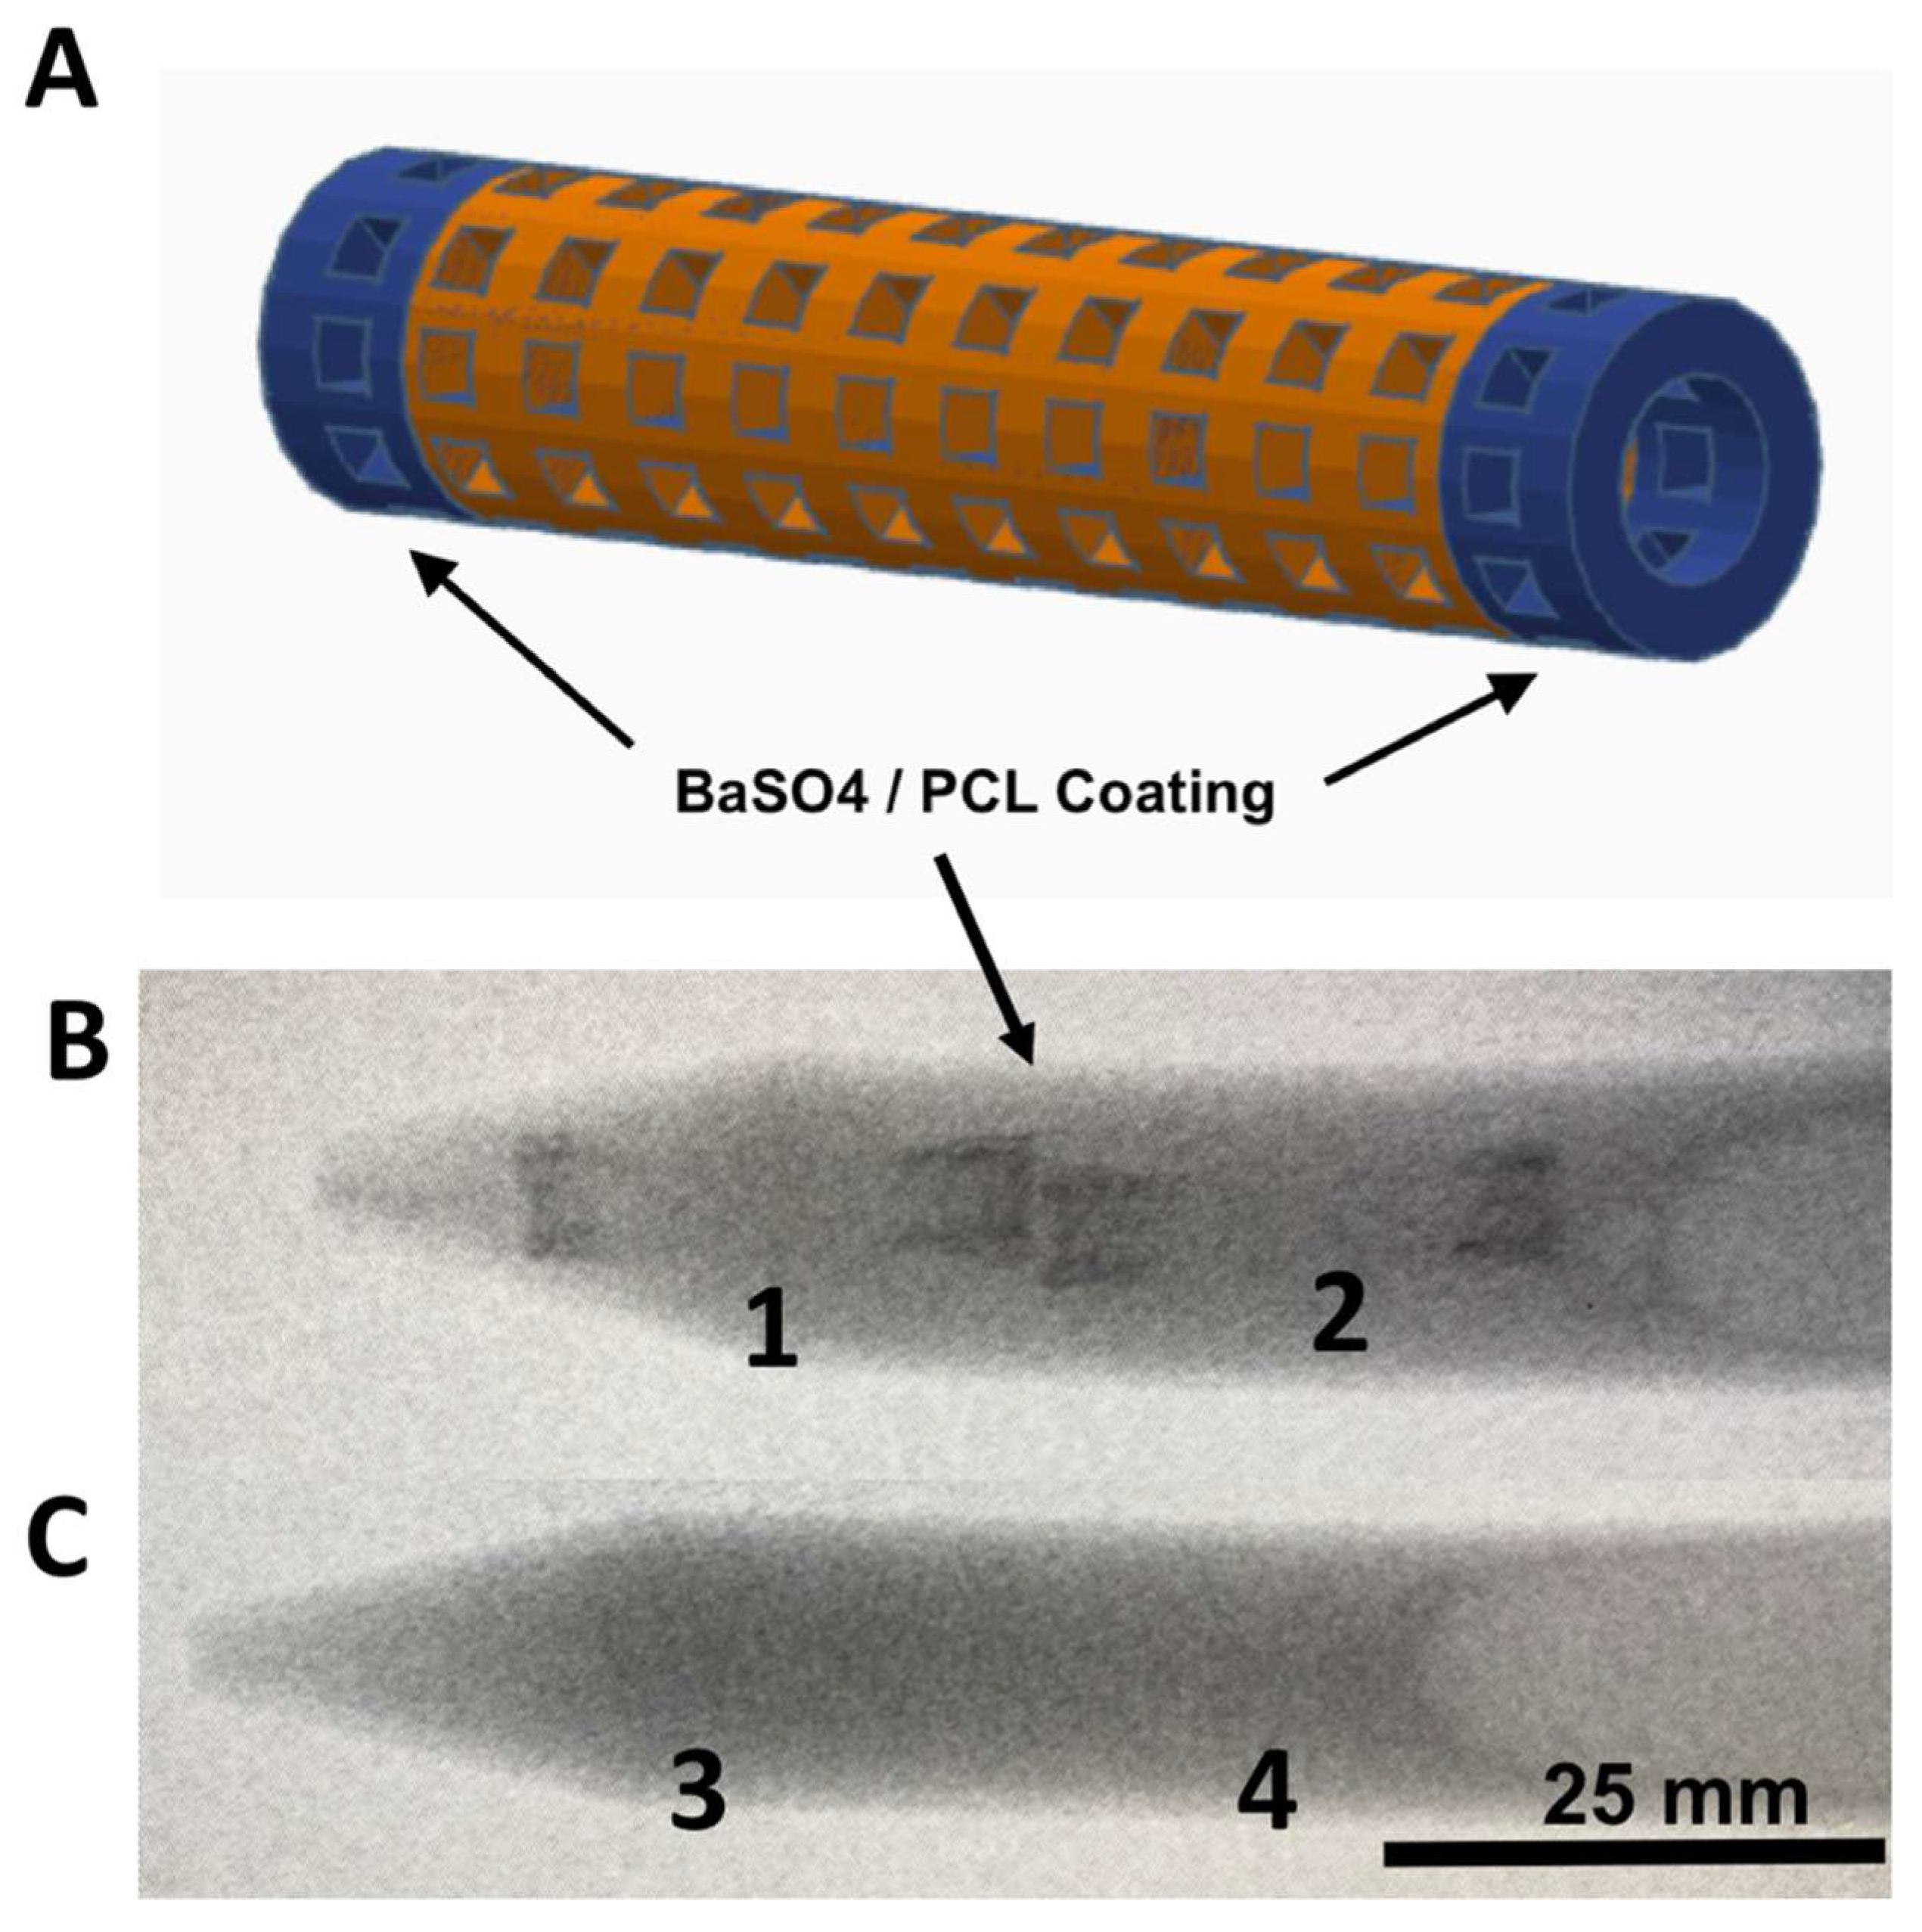
2.3. Barium Sulfate Coating and X-Ray Imaging
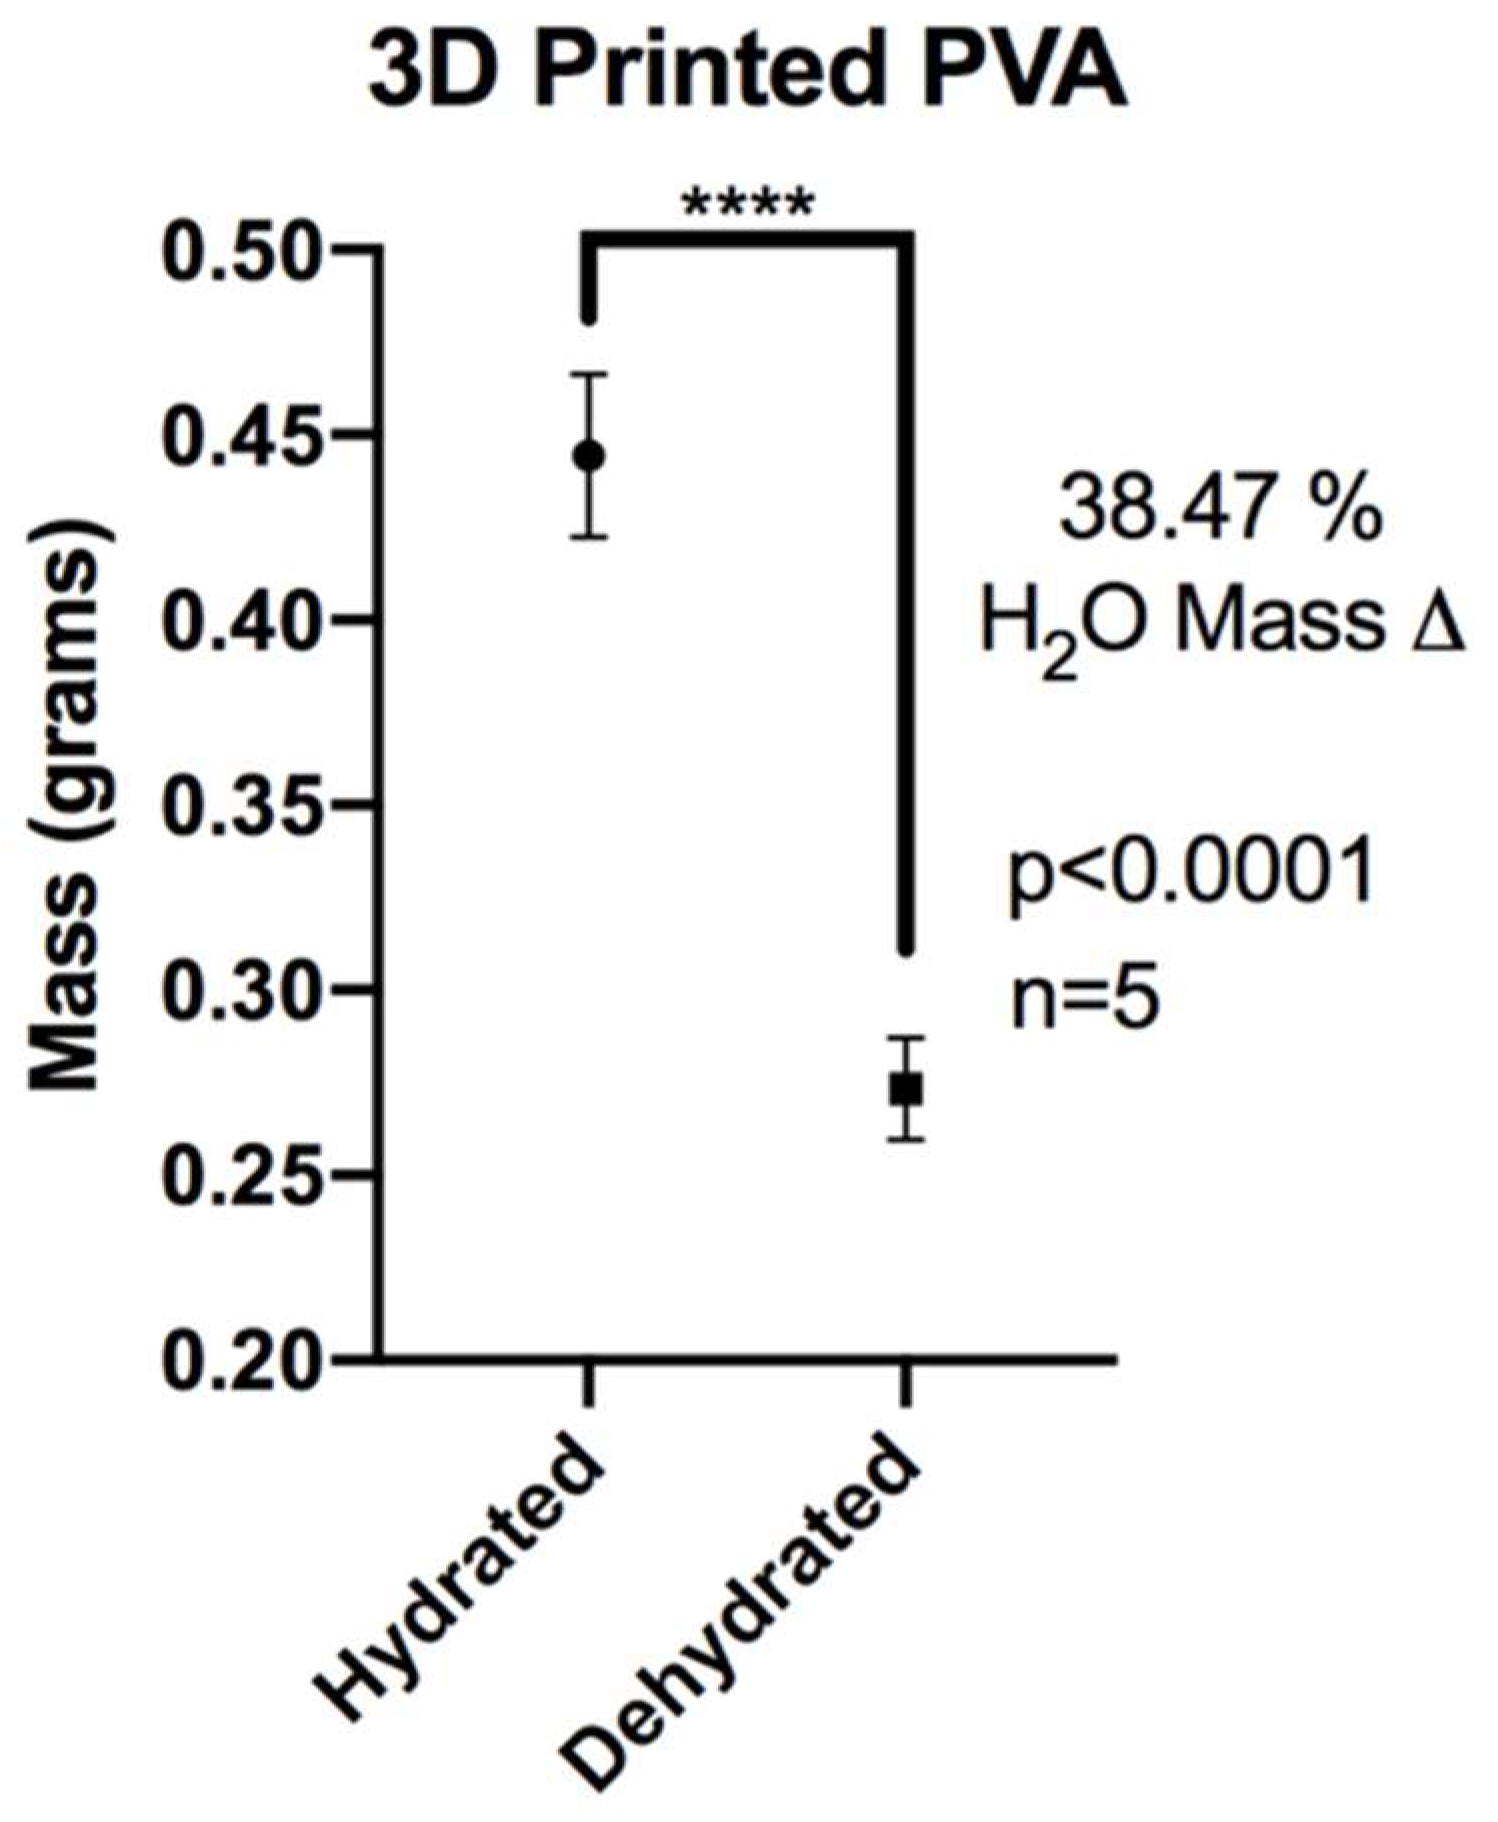
2.4. XL-PVA Swelling Analysis
2.5. Collagen Preparation
2.6. Isolation of Mesenchymal Stem Cells
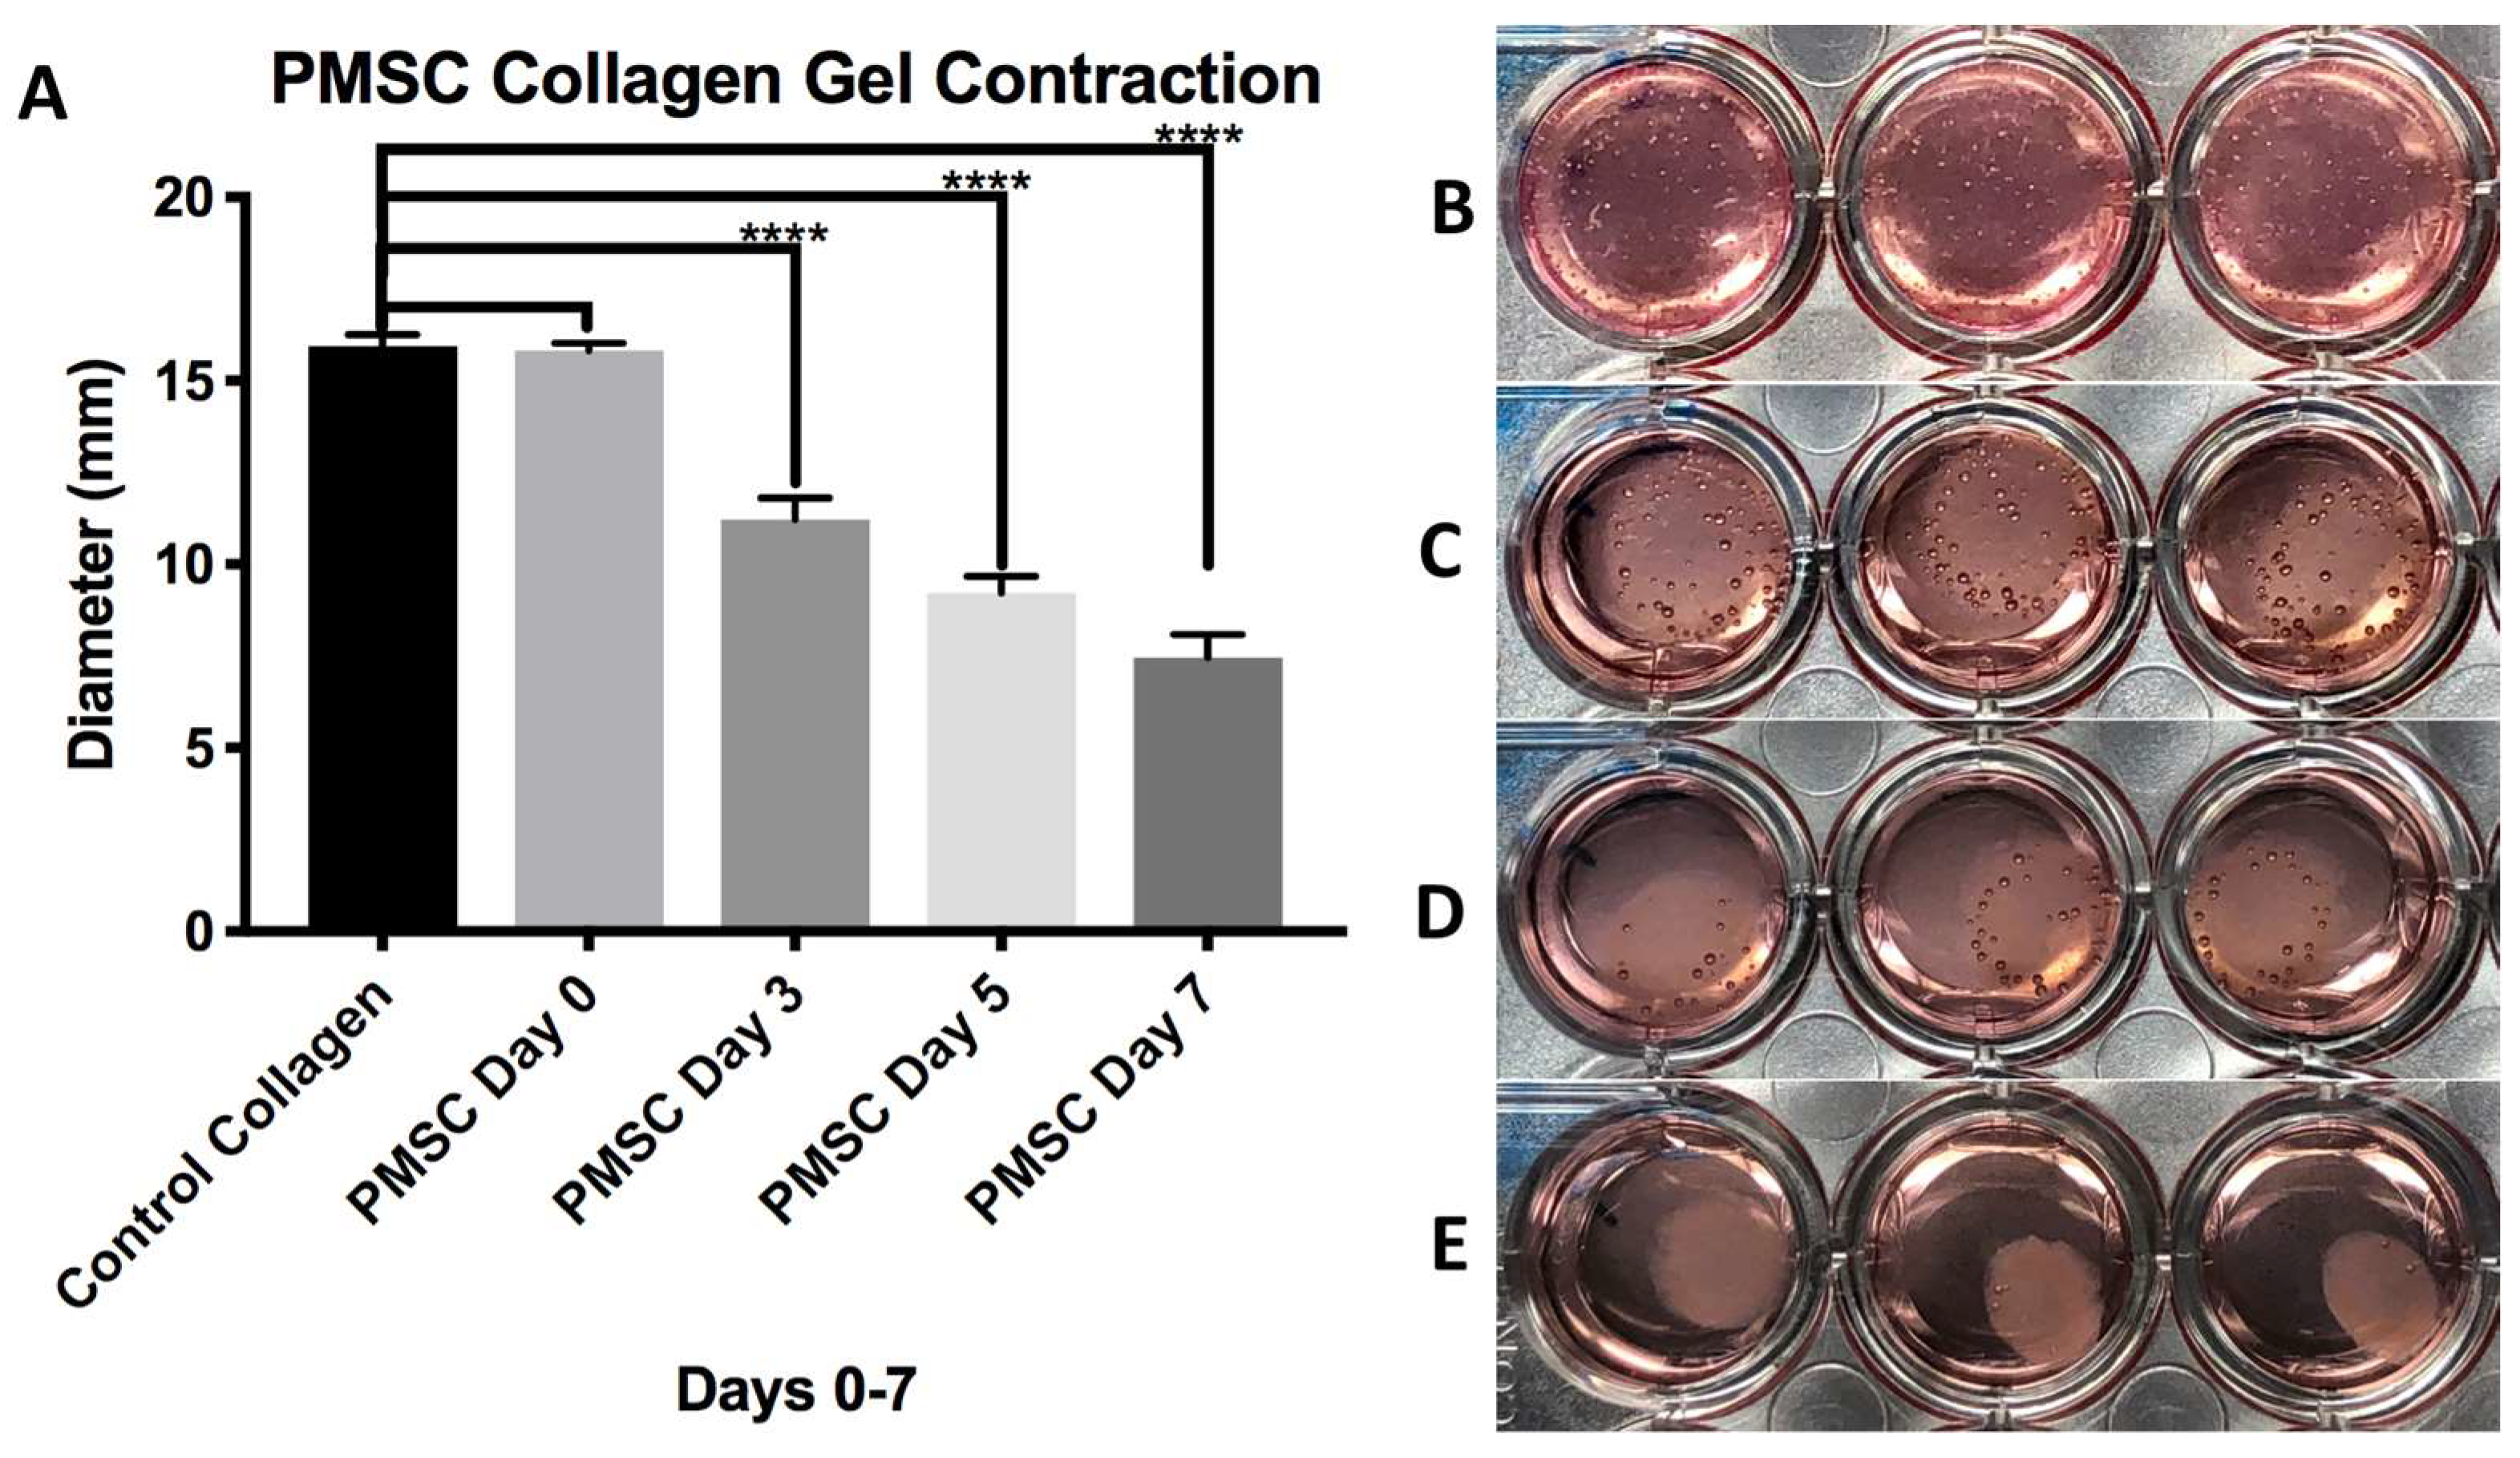
2.7. Stem Cell Collagen Injection Molding and Stent Maturation
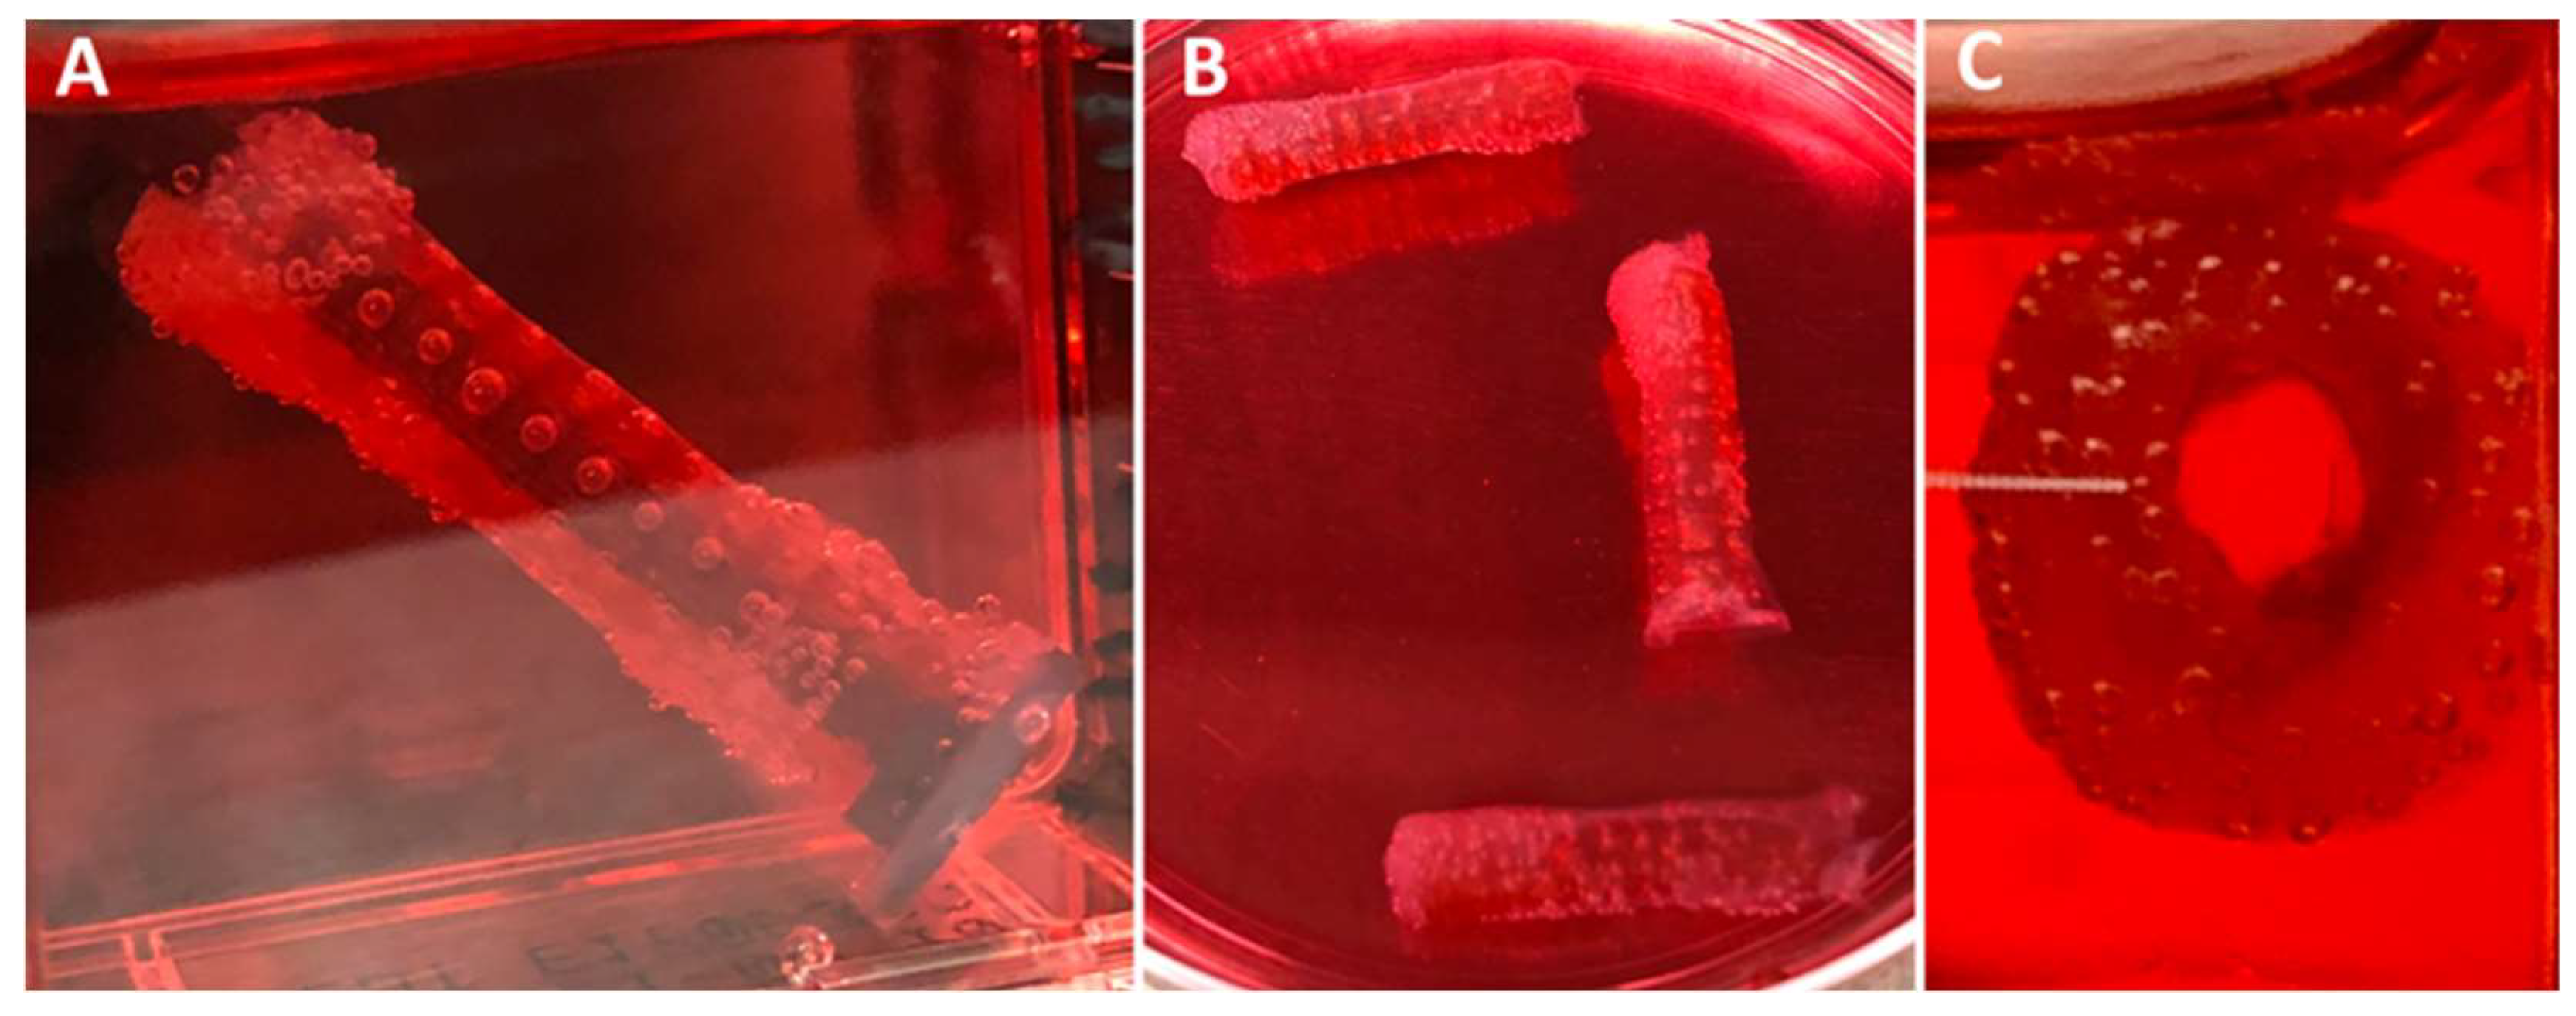
2.8. Cholangiocyte Seeding
2.9. Imaging
3. Results
3.1. Fabrication of XL-PVA Stents and Collagen Injection Molding Chamber
3.2. XL-PVA Swelling Analysis
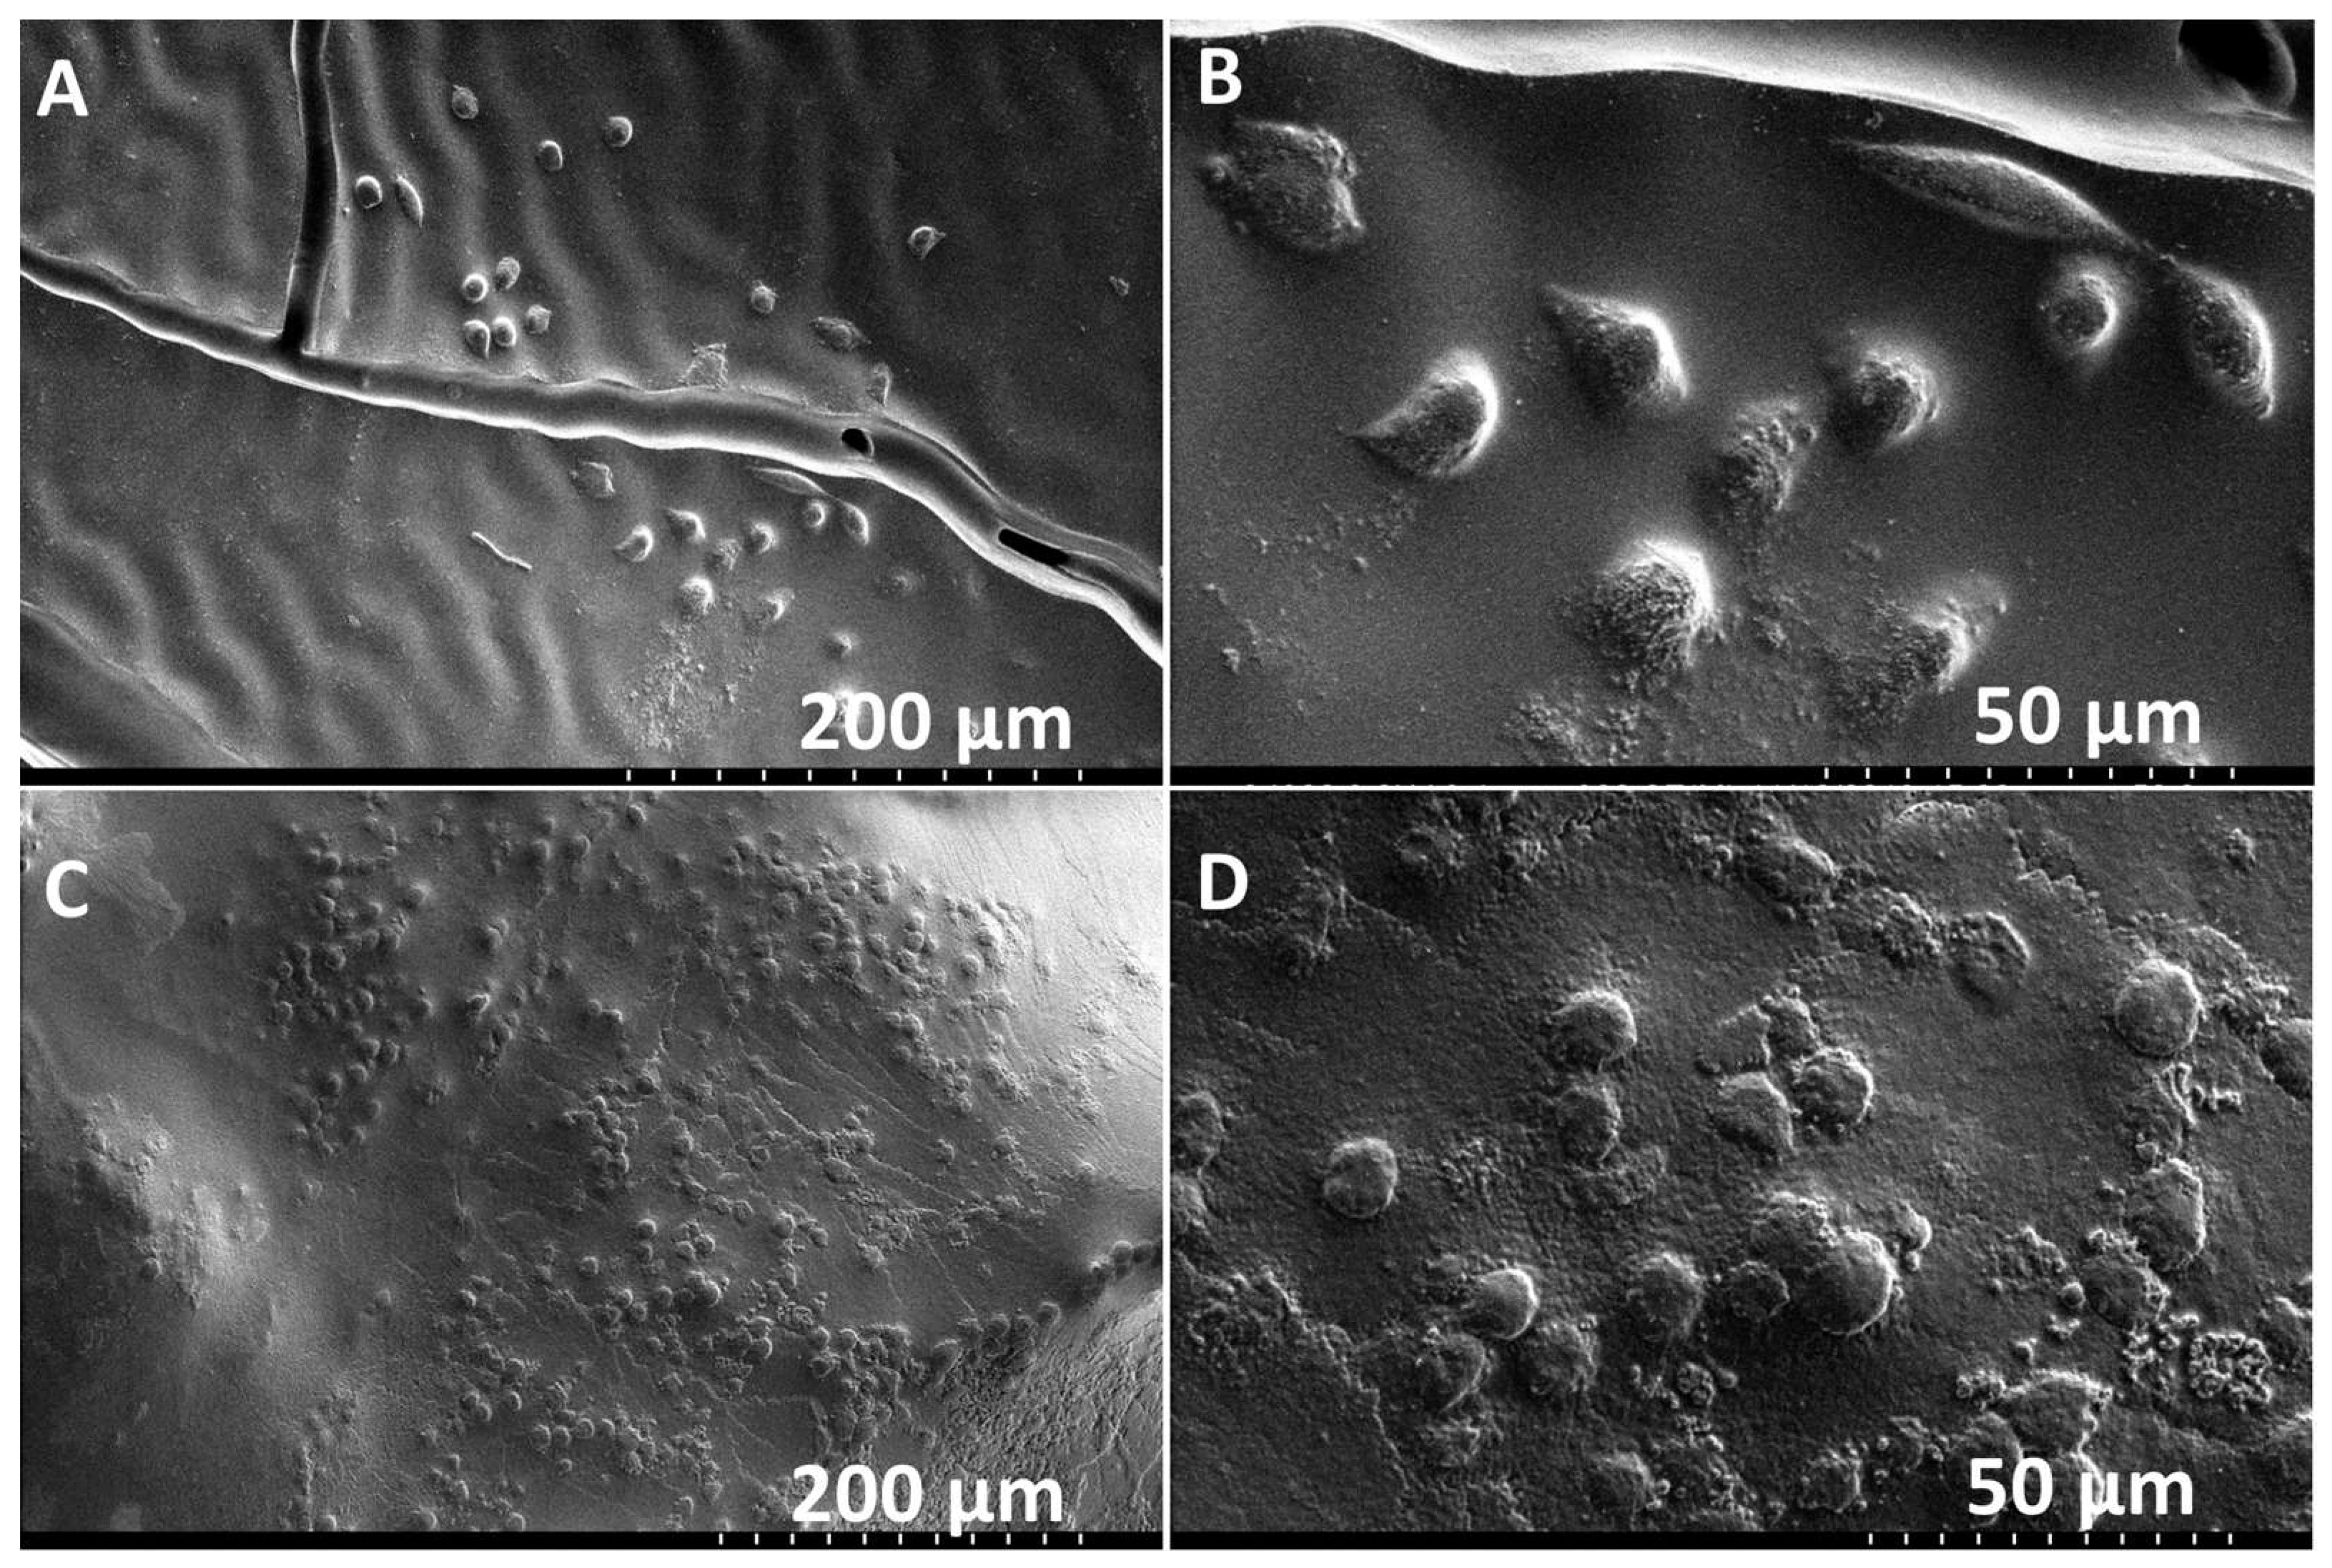
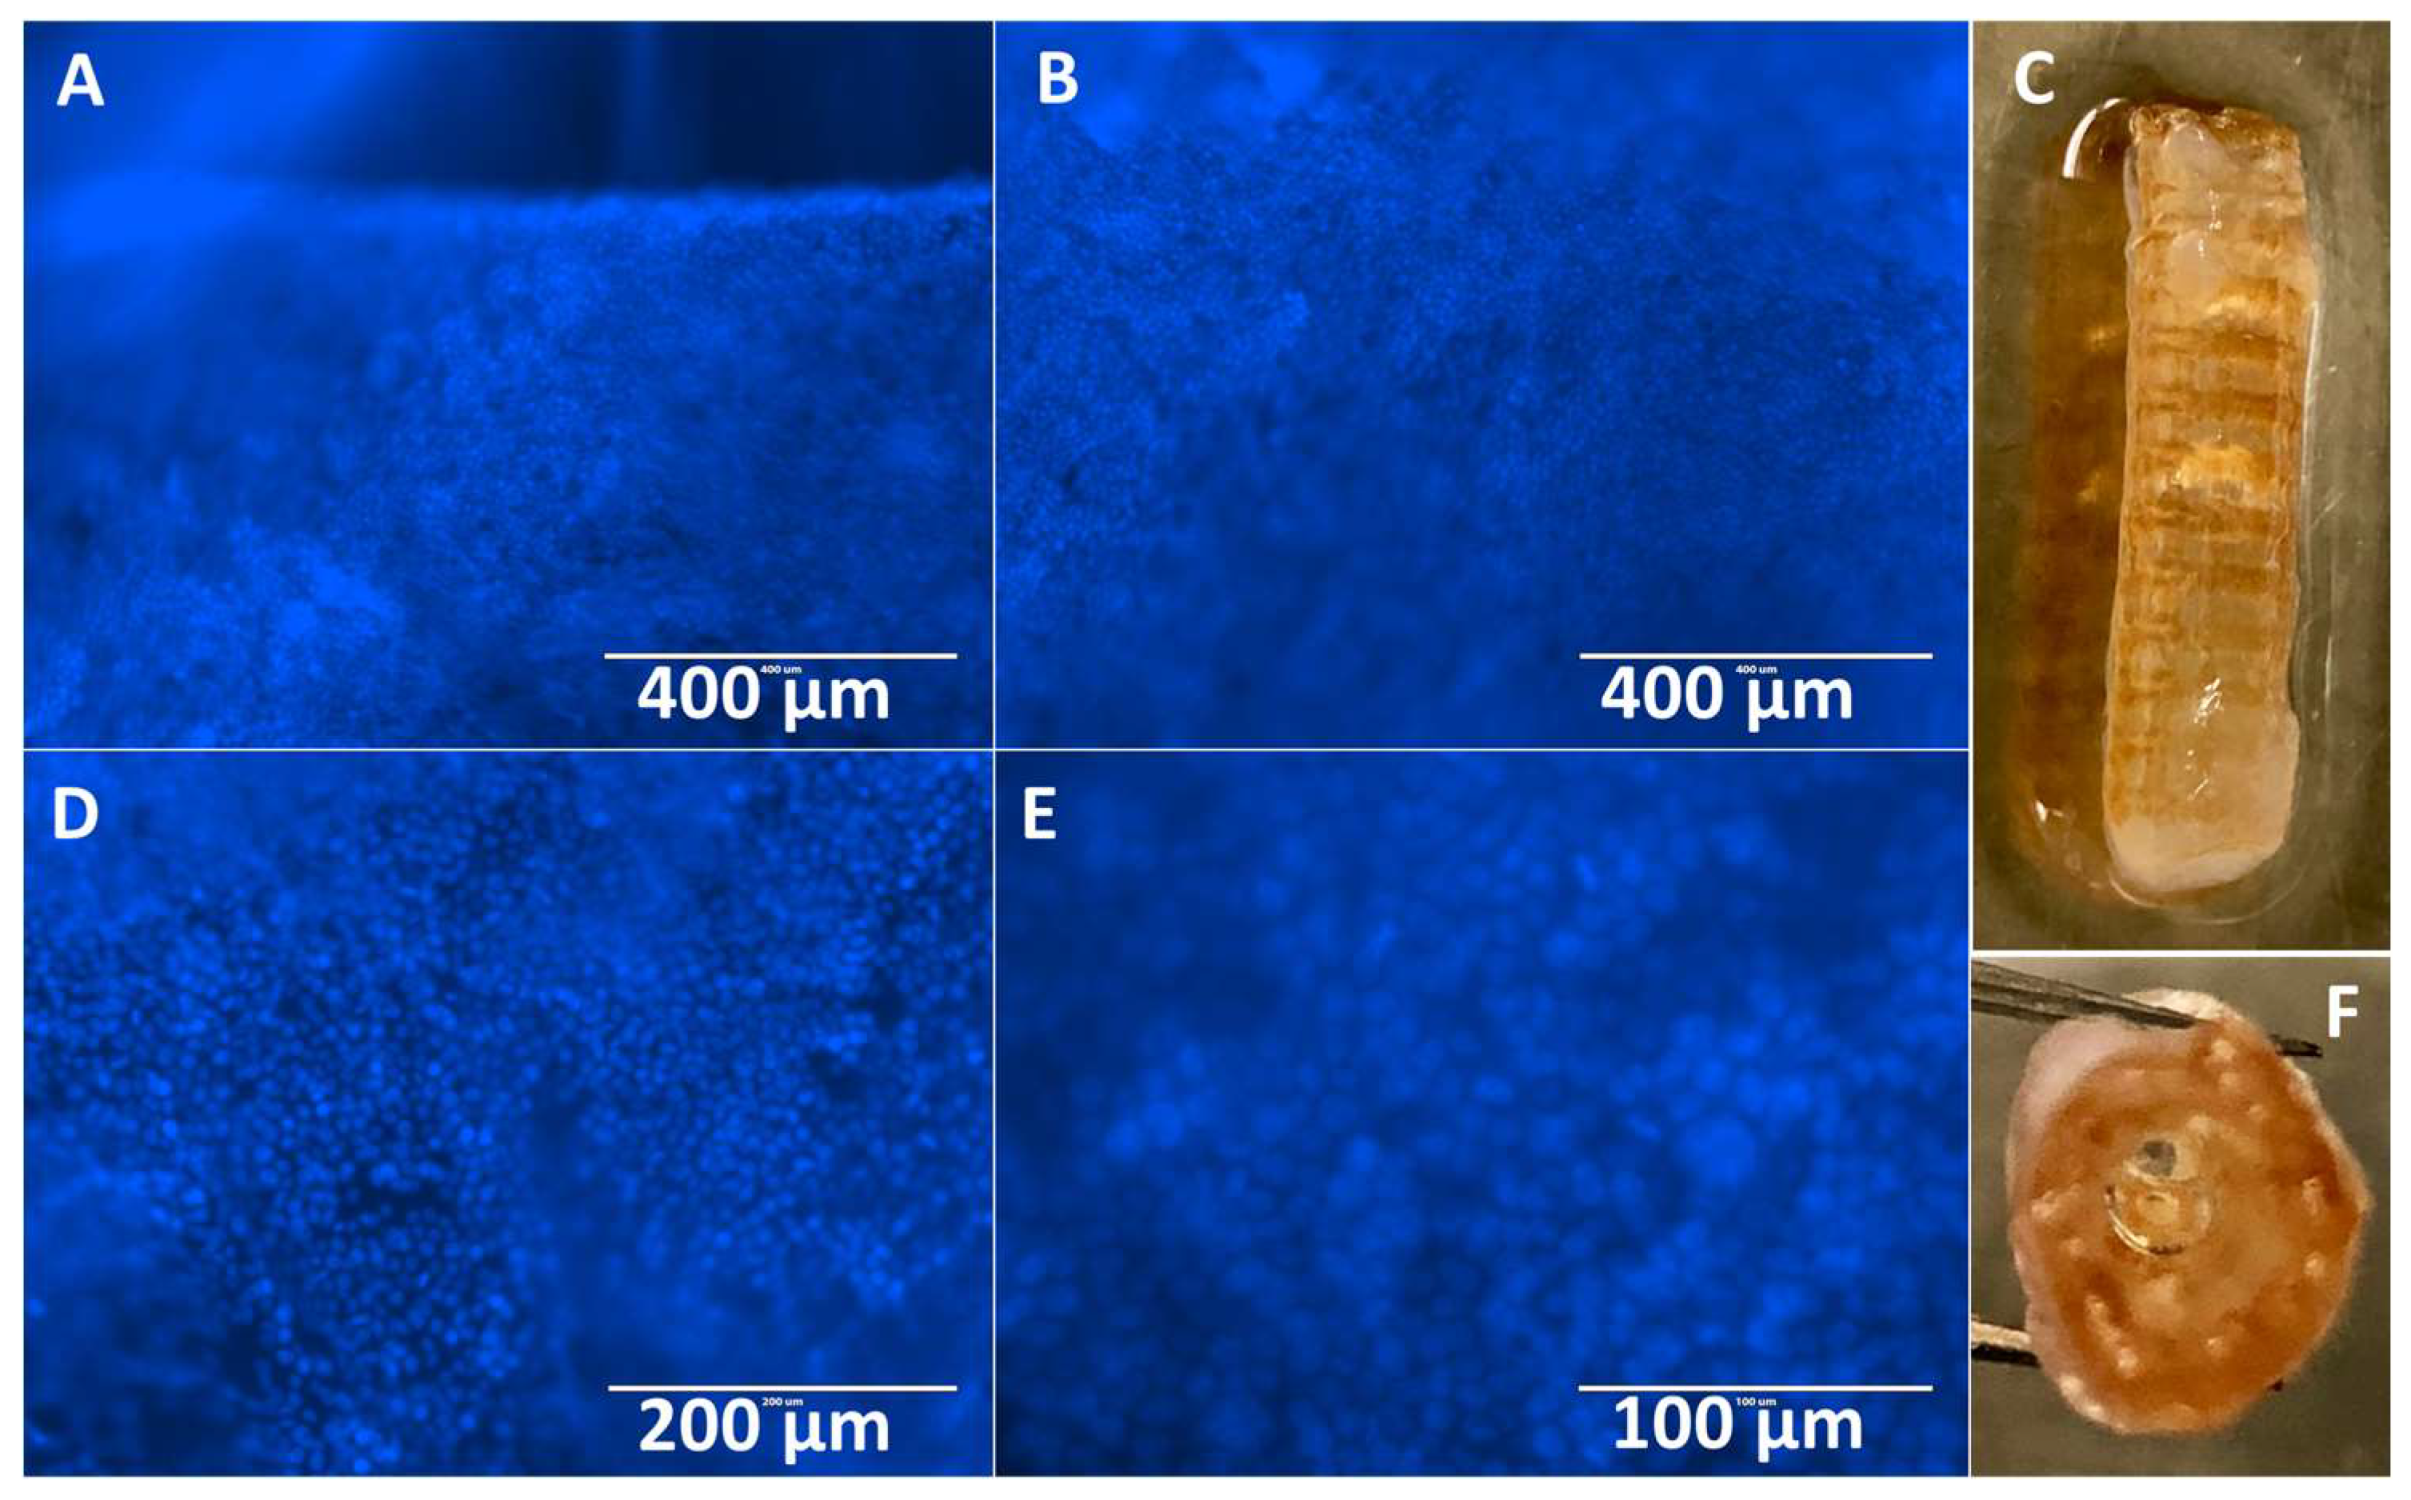
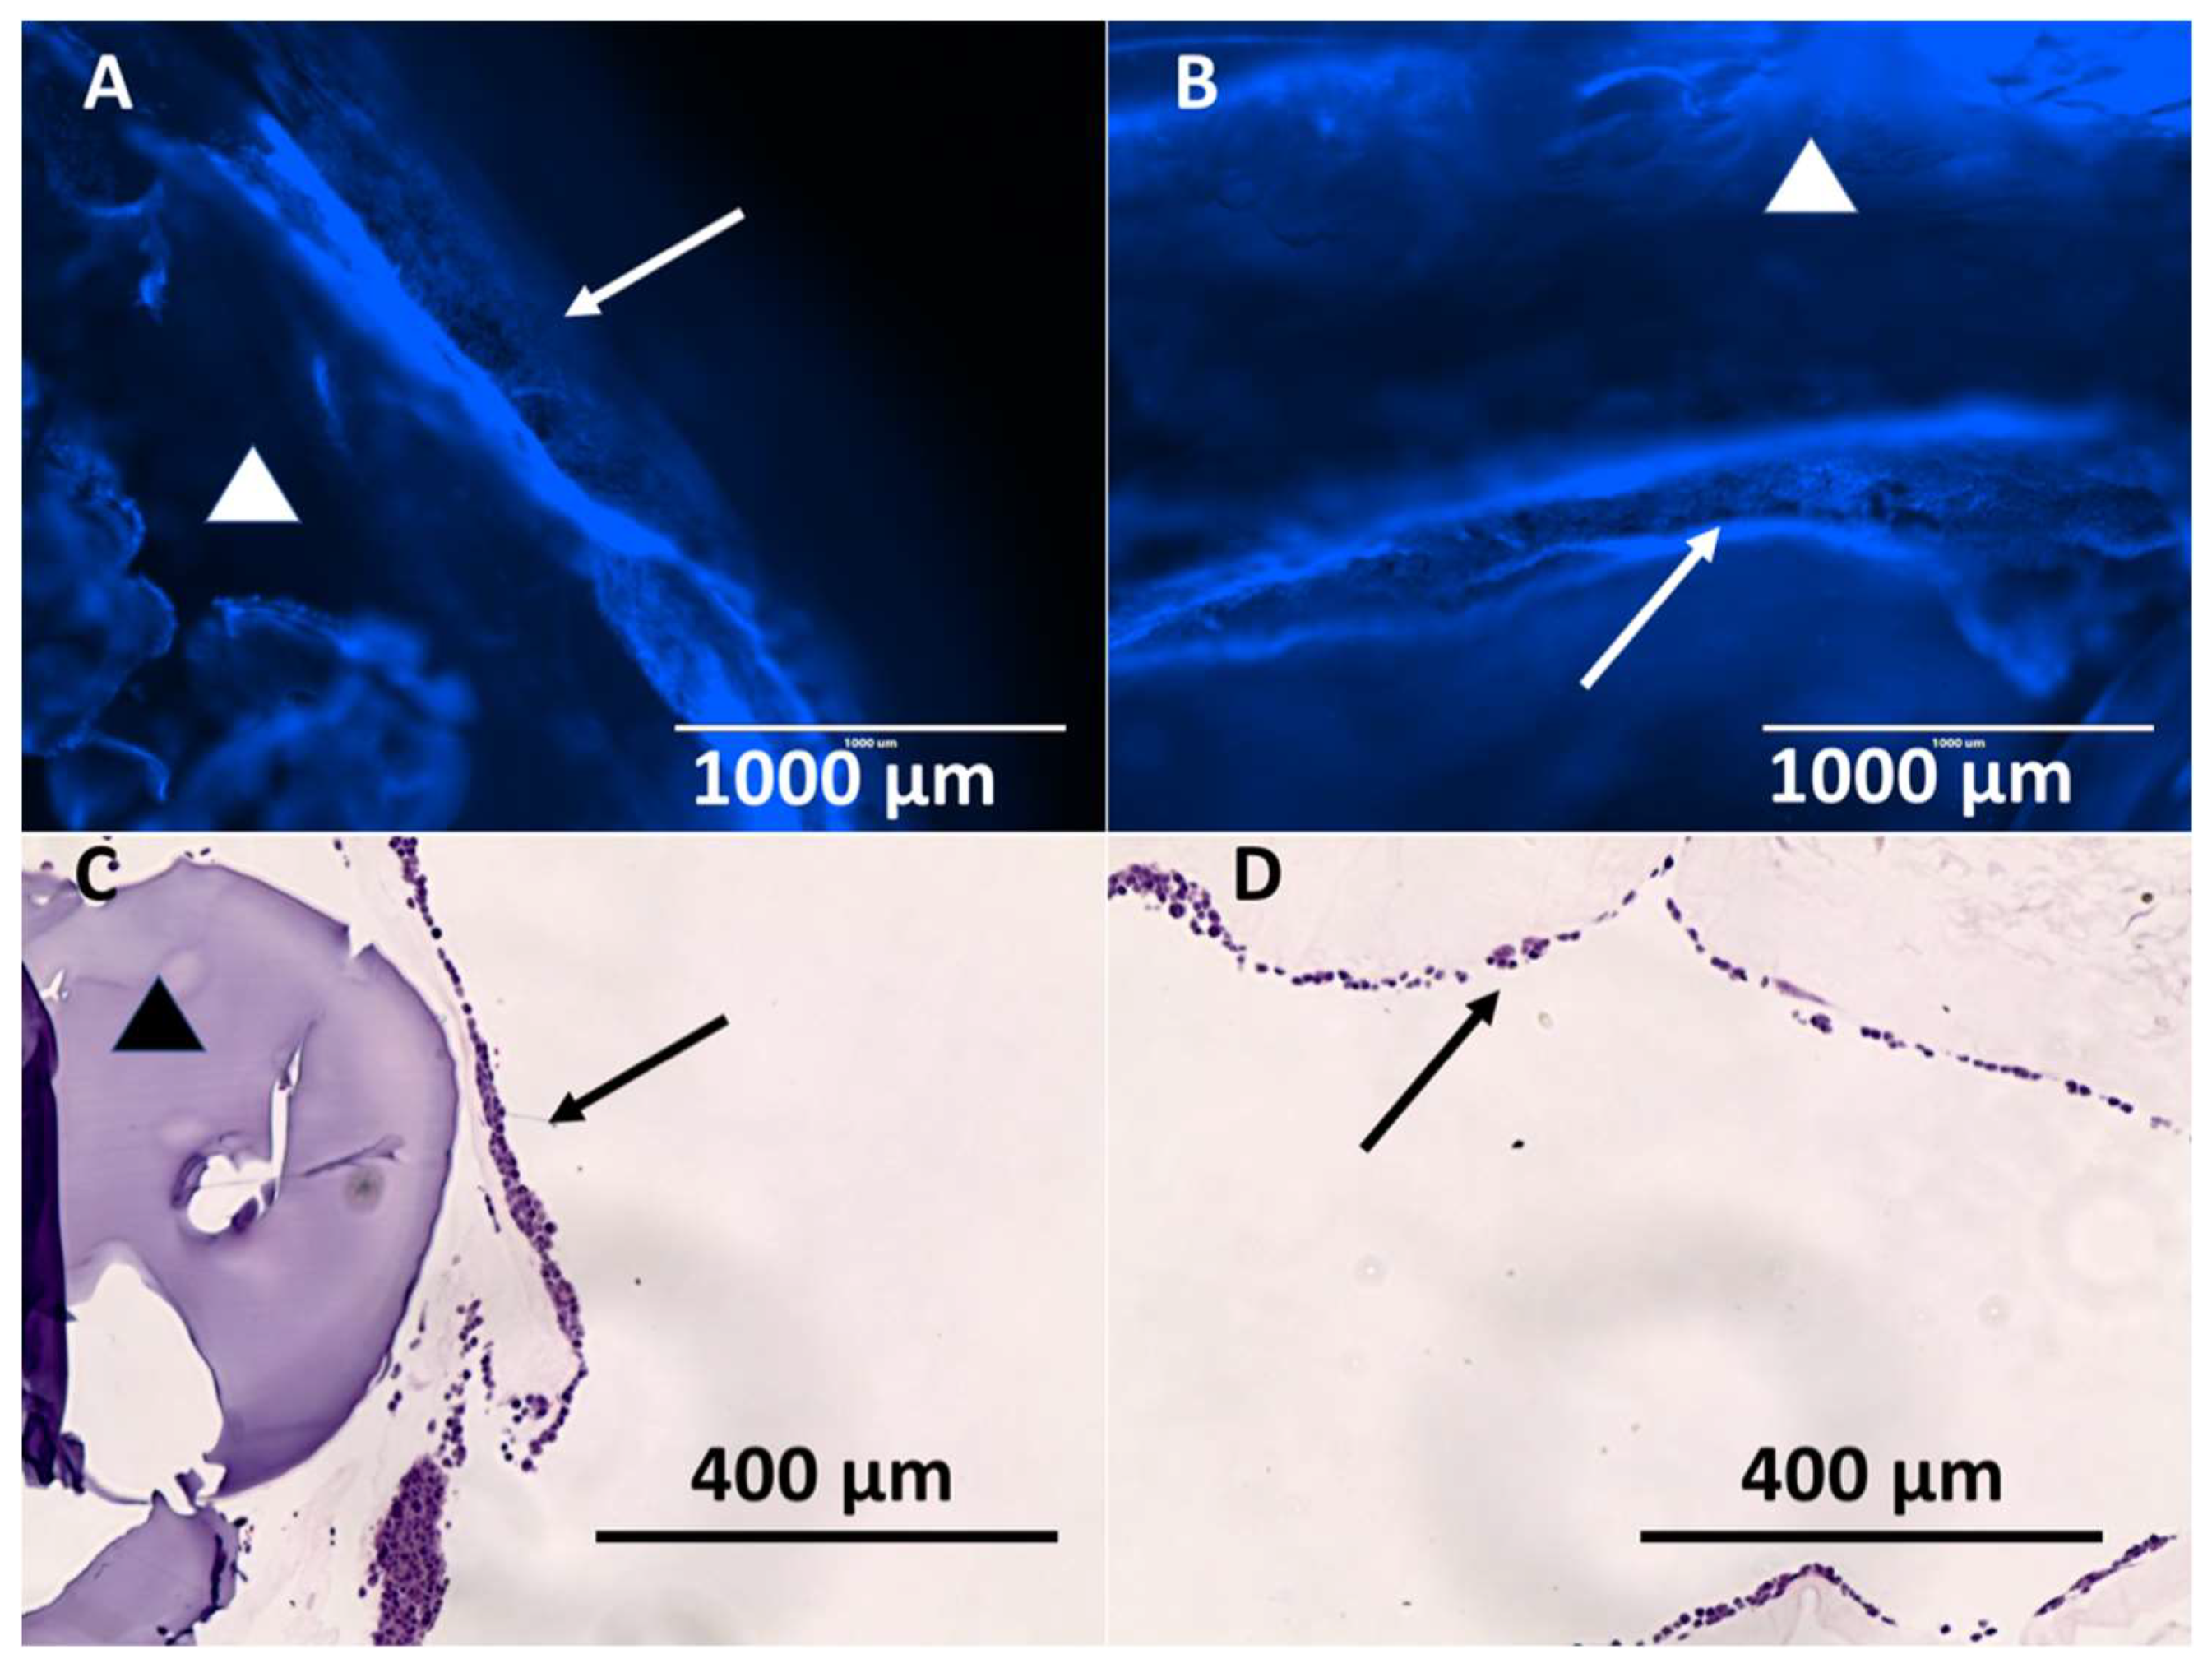
3.3. Hybrid Stent Cell Culture and Imaging
4. Discussion
5. Conclusions
6. Patents
Author Contributions
Funding
Acknowledgments
Conflicts of Interest
References
- Moy, B.T.; Birk, J.W. An Update to Hepatobiliary Stents. J. Clin. Transl. Hepatol. 2015, 3, 67–77. [Google Scholar] [CrossRef] [PubMed]
- Costamagna, G.; Boškoski, I. Current treatment of benign biliary strictures. Ann. Gastroenterol. 2013, 26, 37–40. [Google Scholar] [PubMed]
- Lee, J.; DaVee, T. Biliary Obstruction: Endoscopic Approaches. Semin. Interv. Radiol. 2017, 34, 369–375. [Google Scholar]
- Dumonceau, J.M.; Tringali, A.; Papanikolaou, I.; Blero, D.; Mangiavillano, B.; Schmidt, A.; Vanbiervliet, G.; Costamagna, G.; Deviere, J.; Garcia-Cano, J. Endoscopic biliary stenting: Indications, choice of stents, and results: European Society of Gastrointestinal Endoscopy (ESGE) Clinical Guideline—Updated October 2017. Endoscopy 2018, 50, 910–930. [Google Scholar] [CrossRef] [PubMed]
- Soehendra, N.; Reynders-Frederix, V. Palliative bile duct drainage—A new endoscopic method of introducing a transpapillary drain. Endoscopy 1980, 12, 8–11. [Google Scholar] [CrossRef] [PubMed]
- Laurence, B.H.; Cotton, P.B. Decompression of malignant biliary obstruction by duodenoscopic intubation of bile duct. Br. Med. J. 1980, 280, 522–523. [Google Scholar] [CrossRef] [PubMed]
- Davids, P.H.; Tanka, A.K.; Rauws, E.A.; Gulik, T.M.; Leeuwen, D.J.; Wit, L.T.; Verbeek, P.C.; Huibregtse, K.; Heyde, M.N.; Tytgat, G.N. Benign biliary strictures. Surgery or endoscopy? Ann. Surg. 1993, 217, 237–243. [Google Scholar] [CrossRef] [PubMed]
- Irving, J.D.; Adam, A.; Dick, R.; Dondelinger, R.F.; Lunderquist, A.; Roche, A. Gianturco expandable metallic biliary stents: Results of a European clinical trial. Radiology 1989, 172, 321–326. [Google Scholar] [CrossRef] [PubMed]
- Neuhaus, H.; Hagenmüller, F.; Classen, M. Self-expanding biliary stents: Preliminary clinical experience. Endoscopy 1989, 21, 225–228. [Google Scholar] [CrossRef] [PubMed]
- Huibregtse, K.; Cheng, J.; Coene, P.P.; Fockens, P.; Tytgat, G.N. Endoscopic placement of expandable metal stents for biliary strictures—A preliminary report on experience with 33 patients. Endoscopy 1989, 21, 280–282. [Google Scholar] [CrossRef] [PubMed]
- Suk, K.T.; Kim, J.W.; Kim, H.S.; Baik, S.K.; Oh, S.J.; Lee, S.J.; Kim, H.G.; Lee, D.H.; Won, Y.H.; Lee, D.K. Human application of a metallic stent covered with a paclitaxel-incorporated membrane for malignant biliary obstruction: Multicenter pilot study. Gastrointest. Endosc. 2007, 66, 798–803. [Google Scholar] [CrossRef] [PubMed]
- Hair, C.D.; Sejpal, D.V. Future developments in biliary stenting. Clin. Exp. Gastroenterol. 2013, 6, 91–99. [Google Scholar] [PubMed]
- Siiki, A.; Rinta-Kiikka, I.; Sand, J.; Laukkarinen, J. Endoscopic biodegradable biliary stents in the treatment of benign biliary strictures: First report of clinical use in patients: Biodegradable stents in ERCP. Dig. Endosc. 2017, 29, 118–121. [Google Scholar] [CrossRef] [PubMed]
- Mauri, G.; Michelozzi, C.; Melchiorre, F.; Poretti, D.; Pedicini, V.; Salvetti, M.; Criado, E.; Falco Fages, J.; De Gregorio, M.A.; Laborda, A. Benign biliary strictures refractory to standard bilioplasty treated using polydoxanone biodegradable biliary stents: Retrospective multicentric data analysis on 107 patients. Eur. Radiol. 2016, 26, 4057–4063. [Google Scholar] [CrossRef] [PubMed]
- Sung, J.Y.; Leung, J.W.C.; Shaffer, E.A.; Lam, K.; Olson, M.E.; Costerton, J.W. Ascending infection of the biliary tract after surgical sphincterotomy and biliary stenting. J. Gastroenterol. Hepatol. 1992, 7, 240–245. [Google Scholar] [CrossRef] [PubMed]
- Guaglianone, E.; Cardines, R.; Vuotto, C.; Di Rosa, R.; Babini, V.; Mastrantonio, P.; Donelli, G. Microbial biofilms associated with biliary stent clogging. FEMS Immunol. Med. Microbiol. 2010, 59, 410–420. [Google Scholar] [CrossRef] [PubMed]
- Ventola, C.L. Medical Applications for 3D Printing: Current and Projected Uses. P T Peer-Rev. J. Formul. Manag. 2014, 39, 704–711. [Google Scholar]
- Misra, S.K.; Ostadhossein, F.; Babu, R.; Kus, J.; Tankasala, D.; Sutrisno, A.; Walsh, K.A.; Bromfield, C.R.; Pan, D. 3D-Printed Multidrug-Eluting Stent from Graphene-Nanoplatelet-Doped Biodegradable Polymer Composite. Adv. Healthc. Mater. 2017, 6, 11. [Google Scholar] [CrossRef] [PubMed]
- Xu, J.; Ong, H.X.; Traini, D.; Byrom, M.; Williamson, J.; Young, P.M. The utility of 3D-printed airway stents to improve treatment strategies for central airway obstructions. Drug Dev. Ind. Pharm. 2018, 45, 1–10. [Google Scholar] [CrossRef] [PubMed]
- Lin, M.; Firoozi, N.; Tsai, C.T.; Wallace, M.B.; Kang, Y. 3D-printed flexible polymer stents for potential applications in inoperable esophageal malignancies. Acta Biomater. 2018, 83, 119–129. [Google Scholar] [CrossRef] [PubMed]
- Del Junco, M.; Yoon, R.; Okhunov, Z.; Abedi, G.; Hwang, C.; Dolan, B.; Landman, J. Comparison of Flow Characteristics of Novel Three-Dimensional Printed Ureteral Stents Versus Standard Ureteral Stents in a Porcine Model. J. Endourol. 2015, 29, 1065–1069. [Google Scholar] [CrossRef] [PubMed]
- Ballard, D.H.; Jammalamadaka, U.; Tappa, K.; Weisman, J.A.; Boyer, C.J.; Alexander, J.S.; Woodard, P.K. 3D printing of surgical hernia meshes impregnated with contrast agents: In vitro proof of concept with imaging characteristics on computed tomography. 3D Print. Med. 2018, 4, 13. [Google Scholar] [CrossRef] [PubMed]
- Boyer, C.J.; Ballard, D.H.; Barzegar, M.; Yun, J.W.; Woerner, J.E.; Ghali, G.E.; Boktor, M.; Wang, Y.; Alexander, J.S. High-throughput scaffold-free microtissues through 3D printing. 3D Print. Med. 2018, 4, 9. [Google Scholar] [CrossRef] [PubMed]
- Boyer, C.J.; Ballard, D.H.; Yun, J.W.; Xiao, A.Y.; Weisman, J.A.; Barzegar, M.; Alexander, J.S. Three-dimensional printing of cell exclusion spacers (CES) for use in motility assays. Pharm. Res. 2018, 35, 155. [Google Scholar] [CrossRef] [PubMed]
- Boyer, C.J.; Galea, C.; Woerner, J.E.; Gatlin, C.A.; Ghali, G.E.; Mills, D.K.; Weisman, J.A.; McGee, D.J.; Alexander, J.S. Personalized bioactive nasal supports for postoperative cleft rhinoplasty. J. Oral Maxillofac. Surg. 2018, 76, 1562.e1–1562.e5. [Google Scholar] [CrossRef] [PubMed]
- Boyer, C.J.; Ballard, D.H.; Weisman, J.A.; Hurst, S.; McGee, D.J.; Mills, D.K.; Woerner, J.E.; Jammalamadaka, U.; Tappa, K.; Alexander, J.S. Three-Dimensional Printing Antimicrobial and Radiopaque Constructs. 3D Print Addit. Manuf. 2018, 5, 29–35. [Google Scholar] [CrossRef]
- Benoit, C.; Gu, Y.; Zhang, Y.; Alexander, J.S.; Wang, Y. Contractility of placental vascular smooth muscle cells in response to stimuli produced by the placenta: Roles of ACE vs. non-ACE and AT1 vs. AT2 in placental vessel cells. Placenta 2008, 29, 503–509. [Google Scholar] [CrossRef] [PubMed]
- Shoseyov, O.; Posen, Y.; Grynspan, F. Human Recombinant Type I Collagen Produced in Plants. Tissue Eng. Part A 2013, 19, 1527–1533. [Google Scholar] [CrossRef] [PubMed]
- Yaari, A.; Schilt, Y.; Tamburu, C.; Raviv, U.; Shoseyov, O. Wet Spinning and Drawing of Human Recombinant Collagen. ACS Biomat. Sci. Eng. 2016, 2, 349–360. [Google Scholar] [CrossRef]
- Trunec, M.; Chlup, Z. Substractive manufacturing of customized hydroxyapatite scaffolds for bone regeneration. Ceram. Int. 2017, 43, 11265–11273. [Google Scholar] [CrossRef]
- Jang, T.H.; Park, S.C.; Yang, H.J.; Kim, J.Y.; Seok, J.H.; Park, U.S.; Choi, C.W.; Lee, S.R.; Han, J. Cryopreservation and its clinical applications. Integr. Med. Res. 2017, 6, 12–18. [Google Scholar] [CrossRef] [PubMed]
- Karlsson, J.O.M.; Toner, M. Long-term storage of tissues by cryopreservation: Critical issues. Biomaterials 1996, 17, 243–256. [Google Scholar] [CrossRef]
- Costa, P.F.; Dias, A.F.; Reis, R.L.; Gomes, M.E. Cryopreservation of cell/scaffold tissue-engineered constructs. Tissue Eng. Part C Method 2012, 18, 852–858. [Google Scholar] [CrossRef] [PubMed]


© 2019 by the authors. Licensee MDPI, Basel, Switzerland. This article is an open access article distributed under the terms and conditions of the Creative Commons Attribution (CC BY) license (http://creativecommons.org/licenses/by/4.0/).
Share and Cite
Boyer, C.J.; Boktor, M.; Samant, H.; White, L.A.; Wang, Y.; Ballard, D.H.; Huebert, R.C.; Woerner, J.E.; Ghali, G.E.; Alexander, J.S. 3D Printing for Bio-Synthetic Biliary Stents. Bioengineering 2019, 6, 16. https://doi.org/10.3390/bioengineering6010016
Boyer CJ, Boktor M, Samant H, White LA, Wang Y, Ballard DH, Huebert RC, Woerner JE, Ghali GE, Alexander JS. 3D Printing for Bio-Synthetic Biliary Stents. Bioengineering. 2019; 6(1):16. https://doi.org/10.3390/bioengineering6010016
Chicago/Turabian StyleBoyer, Christen J., Moheb Boktor, Hrishikesh Samant, Luke A. White, Yuping Wang, David H. Ballard, Robert C. Huebert, Jennifer E. Woerner, Ghali E. Ghali, and Jonathan S. Alexander. 2019. "3D Printing for Bio-Synthetic Biliary Stents" Bioengineering 6, no. 1: 16. https://doi.org/10.3390/bioengineering6010016
APA StyleBoyer, C. J., Boktor, M., Samant, H., White, L. A., Wang, Y., Ballard, D. H., Huebert, R. C., Woerner, J. E., Ghali, G. E., & Alexander, J. S. (2019). 3D Printing for Bio-Synthetic Biliary Stents. Bioengineering, 6(1), 16. https://doi.org/10.3390/bioengineering6010016