1. Introduction
Ultra-widefield (UWF) retinal images have emerged as a revolutionary modality in ophthalmology [
1,
2]. As depicted in
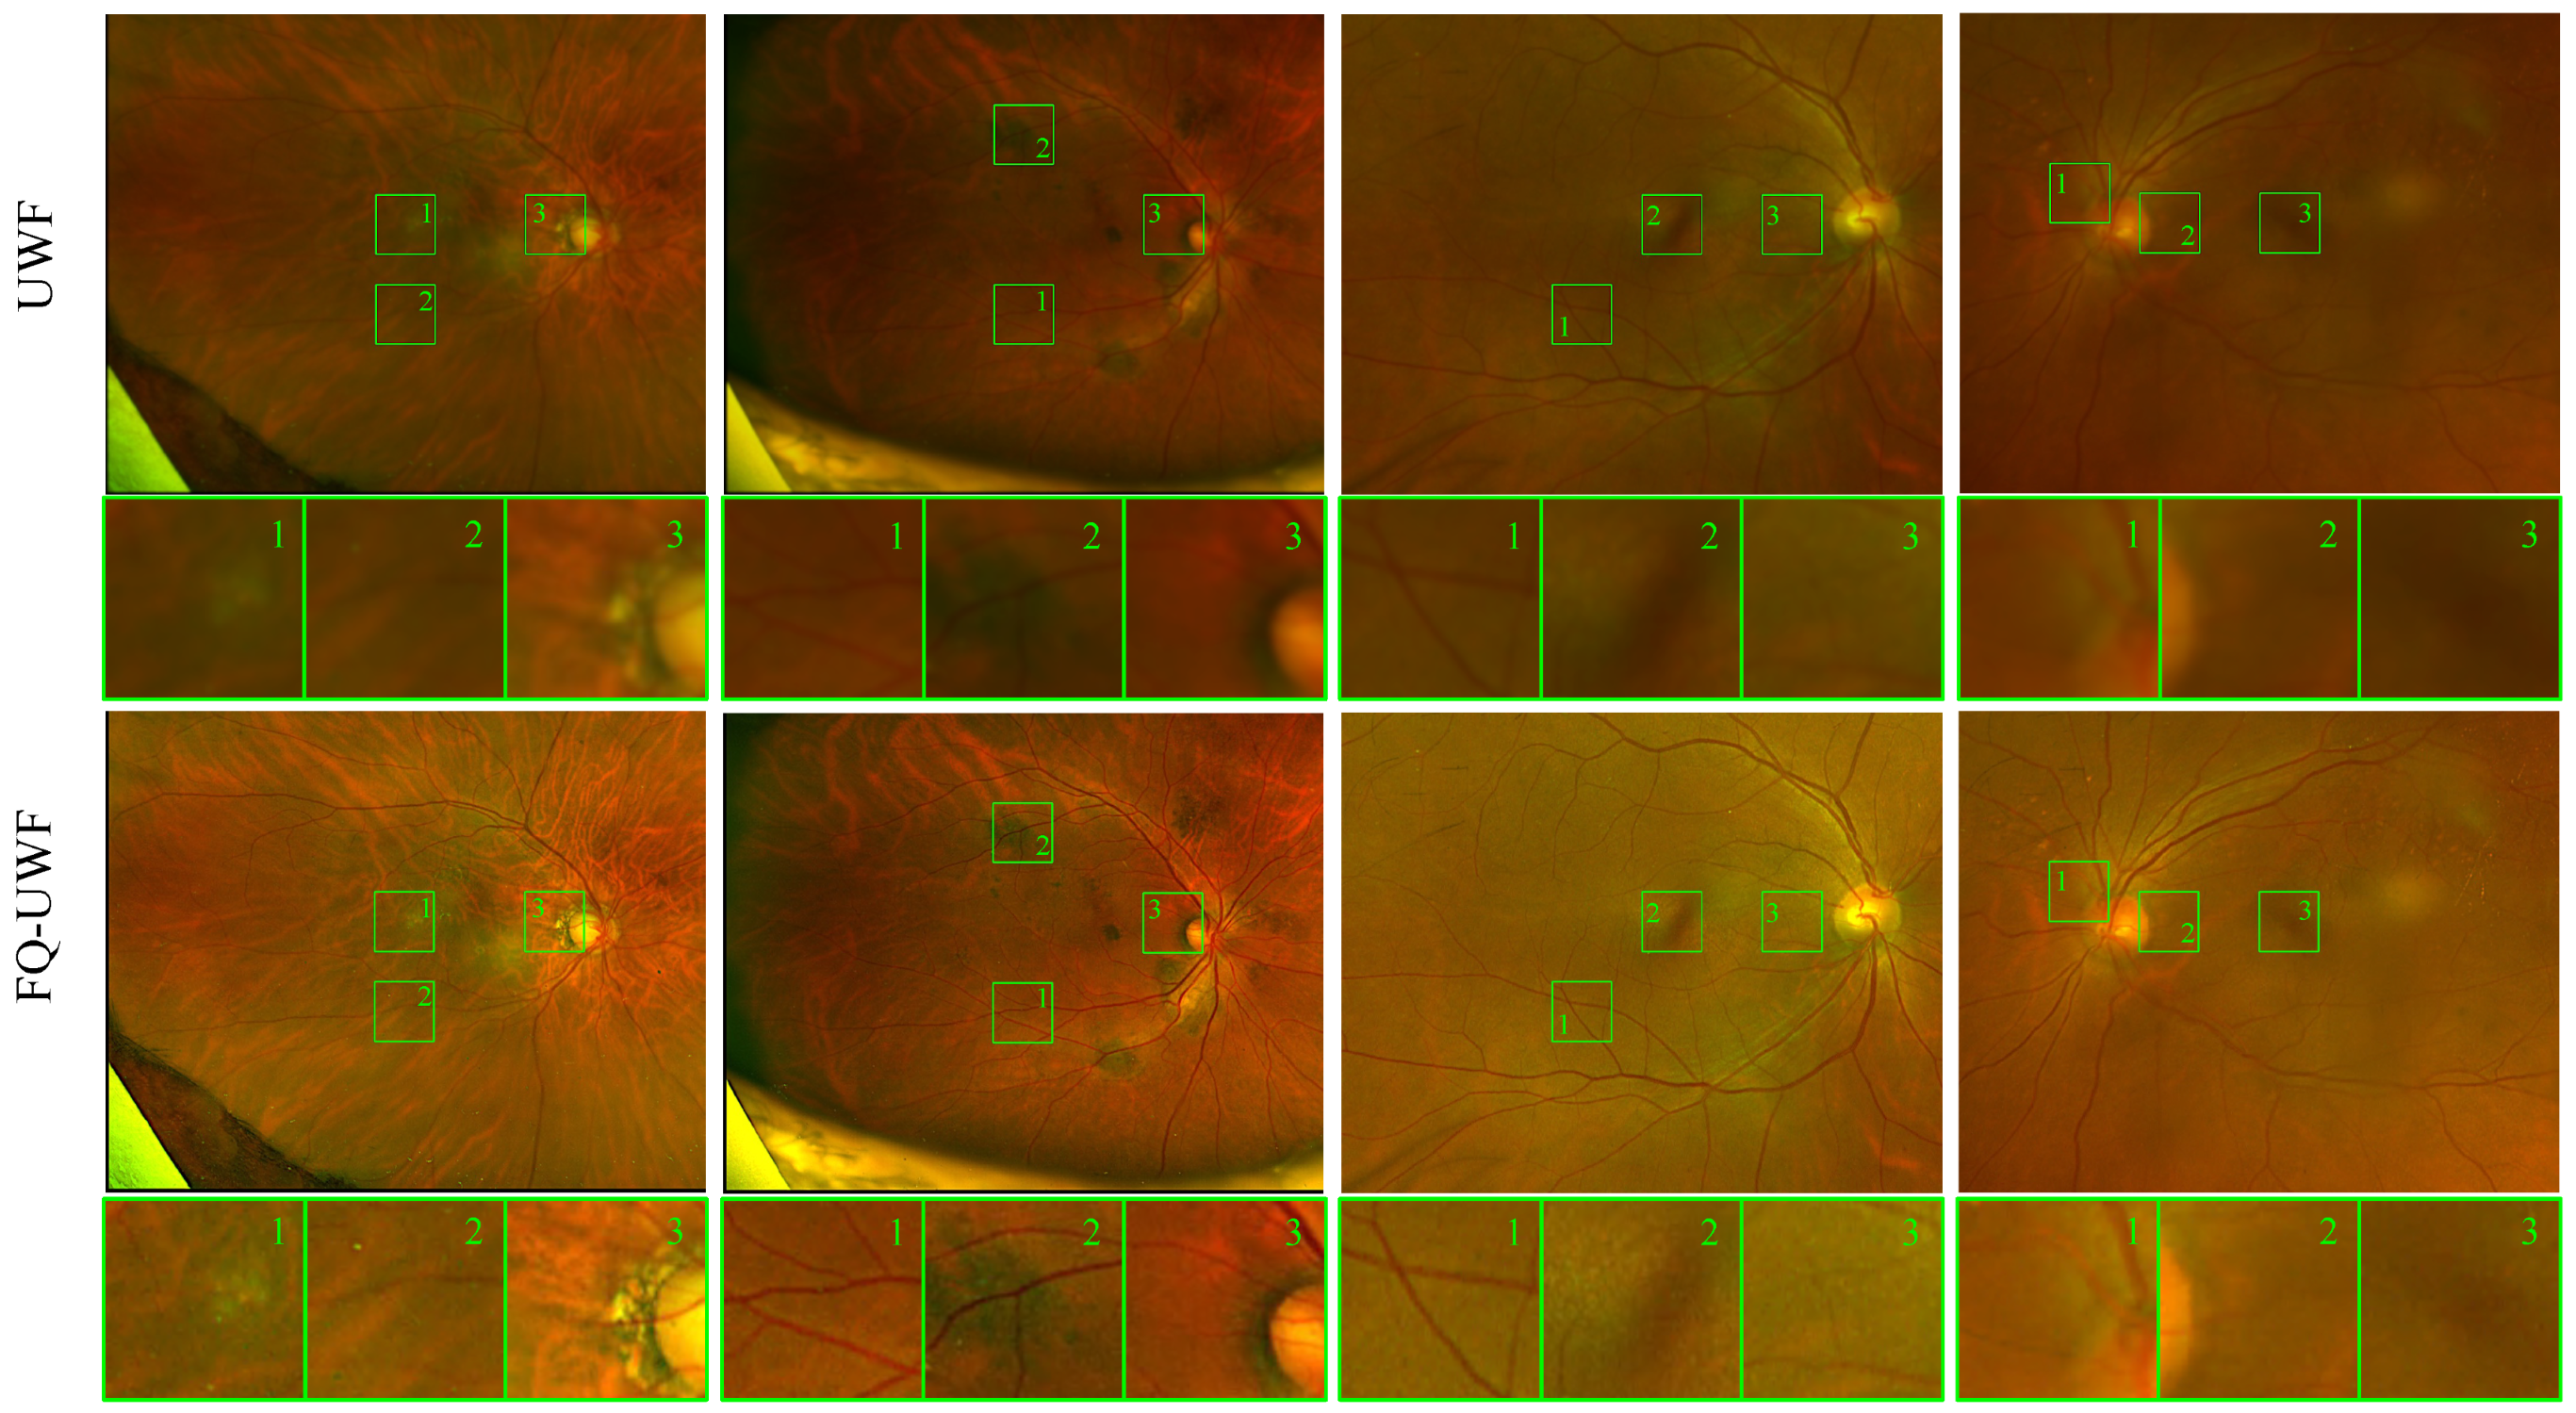
Figure 1, UWF provides an extensive field of view that enables the visualization of both central and peripheral retinal areas. This enables early detection and monitoring of peripheral retinal conditions that are often missed in standard fundus images. However, various artifacts, low macular area resolution, large data size, and lack of interpretation standardization act as impediments to widespread clinical use of UWF images.
Image enhancement techniques have the potential to improve UWF image quality, empowering healthcare professionals to make more accurate diagnoses and treatment plans. Ophthalmologists may better detect subtle early changes in the macular area and identify peripheral early signs of disease, leading to better patient outcomes. But since UWF images contain multiple degradation factors scattered throughout the fundus in a complex manner, image enhancement is a significant challenge. Many recent conventional image enhancement techniques are based on supervised learning and require a ground truth (GT) dataset of well-aligned low- and high-quality image pairs for training. Achieving this paired dataset is a significant challenge in the case of UWF, where precise alignment between image pairs is extremely difficult.
The application of deep learning algorithms has facilitated promising results in a wide range of image enhancement tasks, including super-resolution, image denoising, and image deblurring [
3]. A variety of methods tailored for enhancement of retinal fundus images have also been proposed [
4,
5]. These methods can automatically learn and apply complex transformations to improve the visualization of critical structures such as blood vessels, the optic disc, and the macula. Despite the necessity, there has yet to be a comprehensive deep-learning-based enhancement method for UWF images.
We thus propose a comprehensive image enhancement method for UWF images, with the specific goal of improving the quality of conventional fundus images.
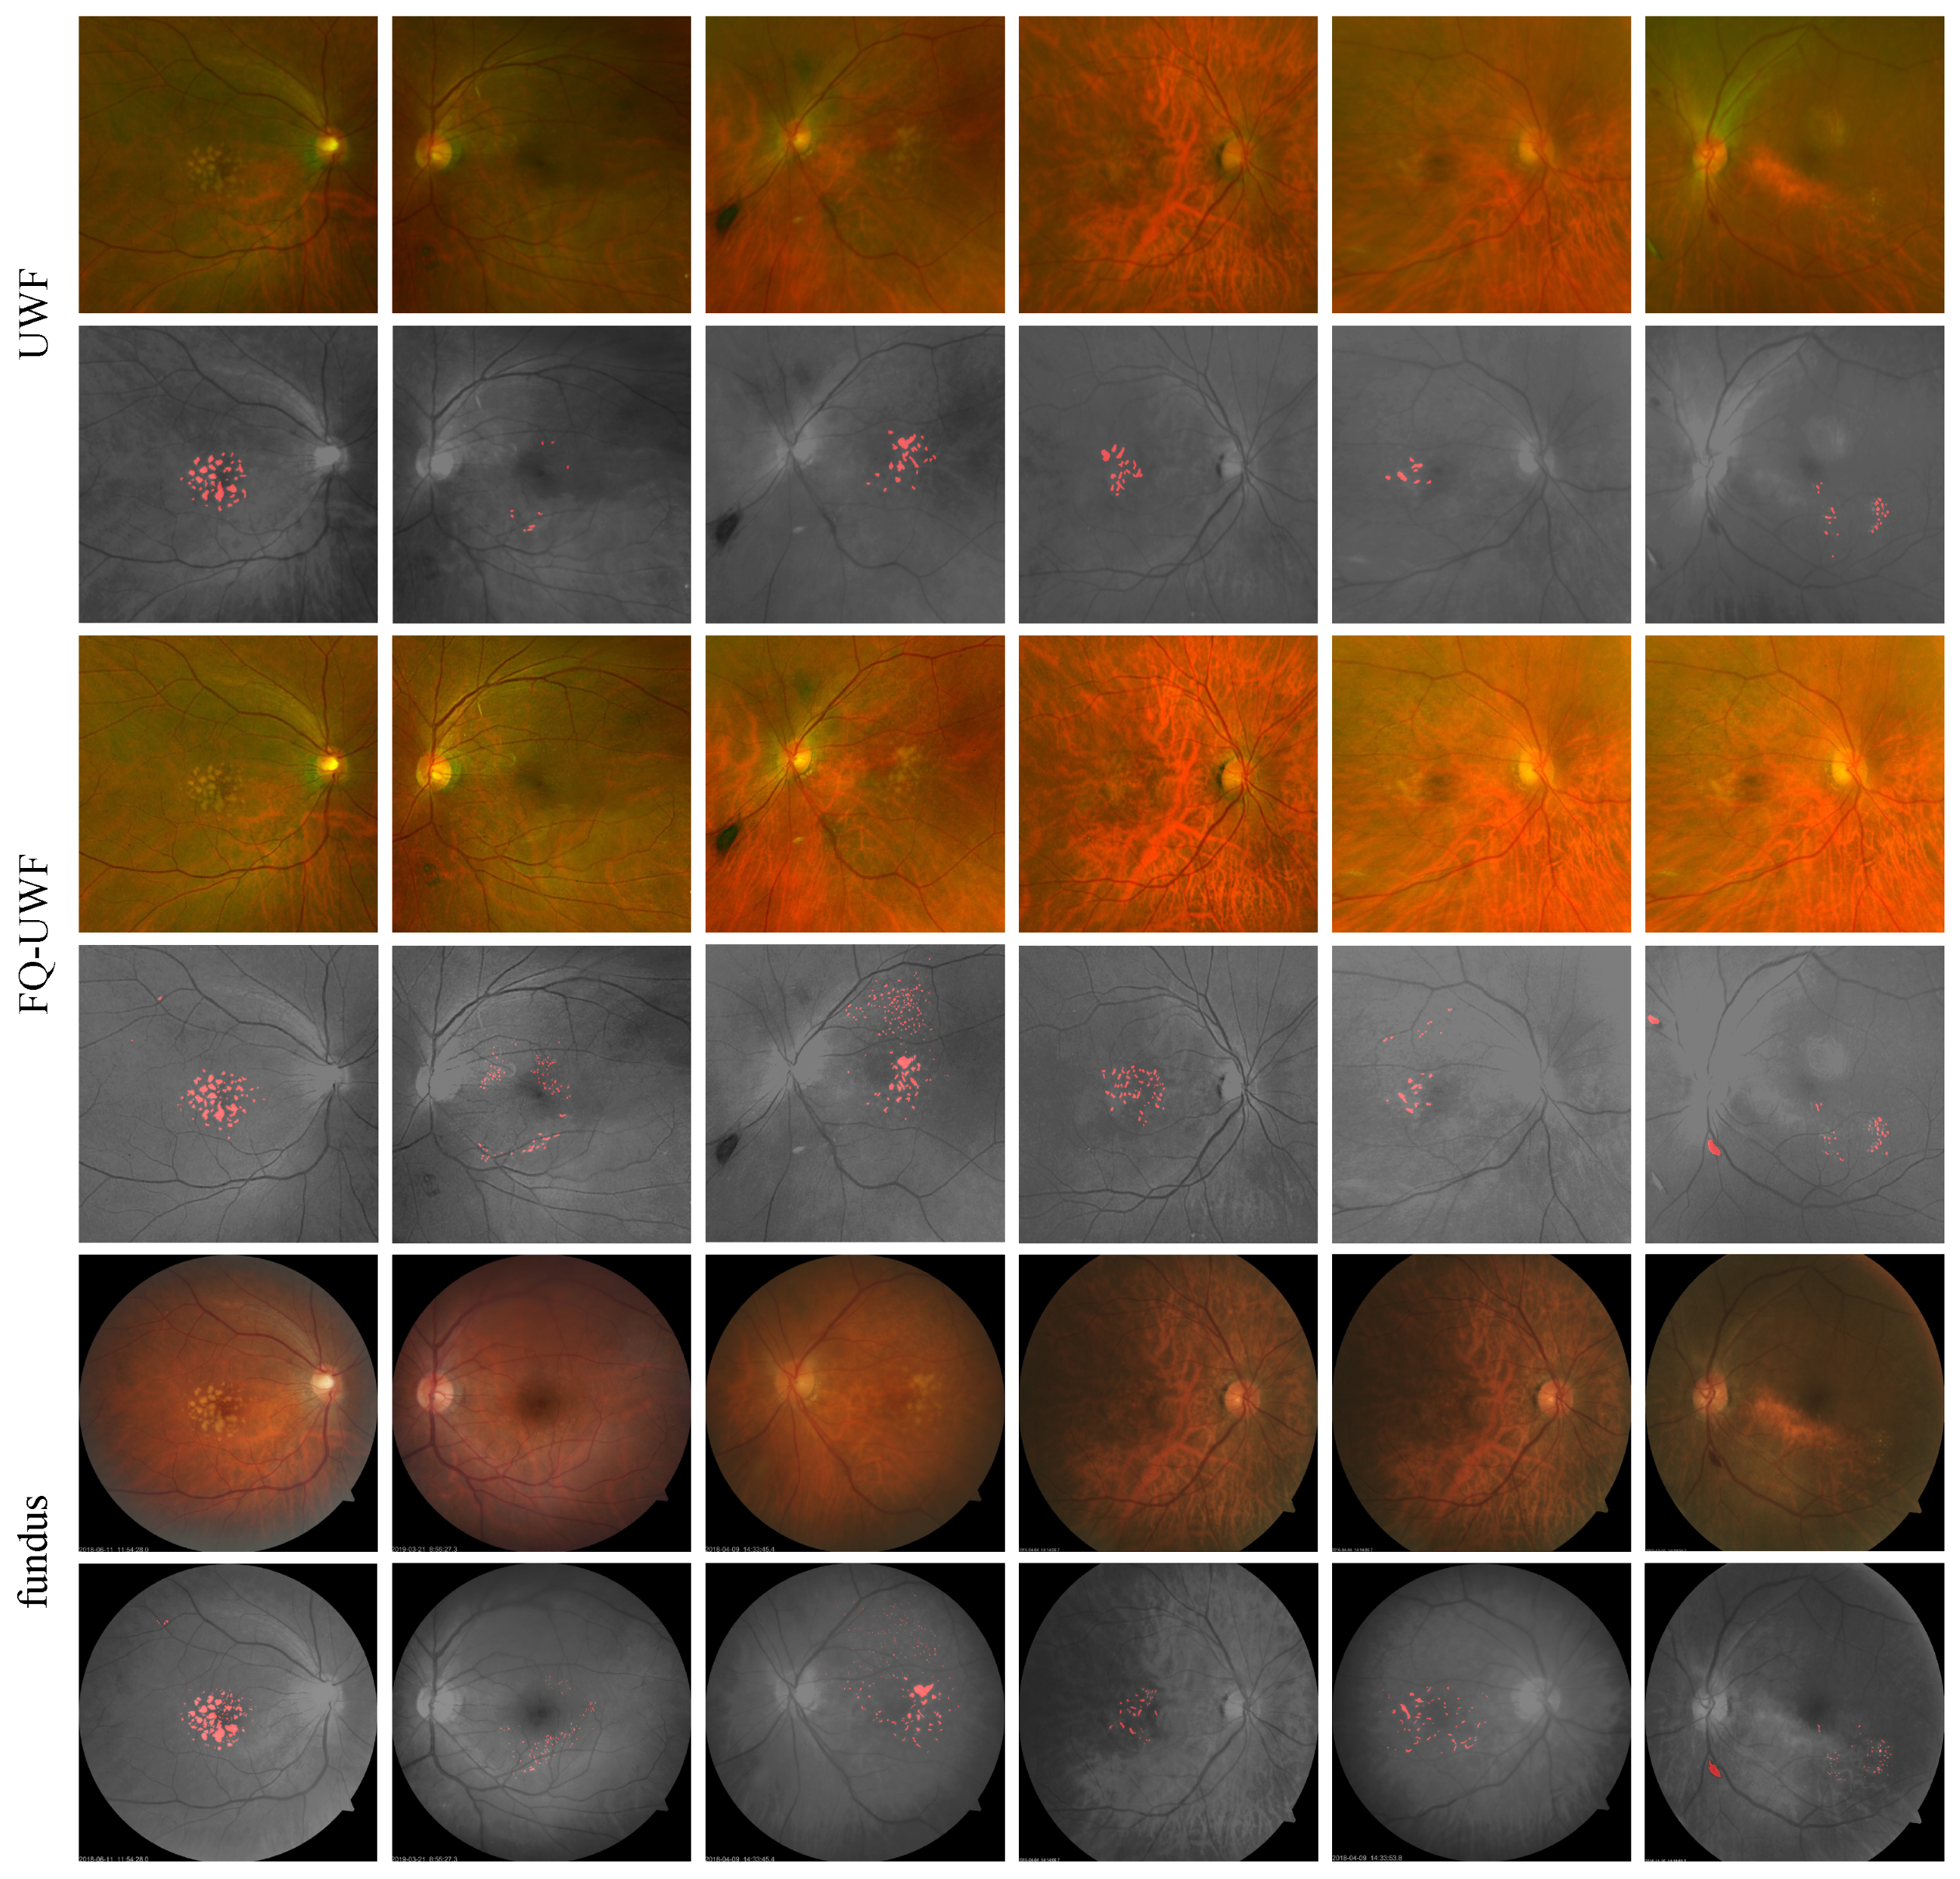
Figure 2 presents sample results of the proposed method. As image quality can be subjective, we compare manual annotations of drusen from fundus images and UWF images after applying our enhancement method. Experimental evaluation demonstrates that the similarity between annotations after enhancement is considerably improved compared to annotations made on images before enhancement. Quantitative measurements of image quality are also assessed, demonstrating state-of-the-art results on several datasets. Based on our goal and the experimental findings, we refer to the enhanced images as fundus quality (FQ)-UWF images. We believe that our approach has the potential to improve the accuracy of clinical assessments and treatments, ultimately leading to better patient outcomes.
The proposed method is based on the generative adversarial network (GAN) framework to avoid the requirement of pairs of aligned high-quality images in pixelwise supervision. We employ a dual-GAN structure to jointly perform super-resolution, enhancing the low resolution of the macula in UWF, which has a critical impact on clinical practice. As image pairs are not required, training data are acquired by simply collecting sets of UWF and fundus images. We also incorporate appropriate attention mechanisms in the network for enhancement with regard to various degradations such as noise, blurring, and artifacts scattered throughout the UWF.
We summarize our contributions as follows:
We establish a method for UWF image enhancement and super-resolution from unpaired UWF and fundus image sets. We evaluate the clinical utility in the context of detecting and localizing drusen in the macula.
We propose a novel dual-GAN network architecture capable of effectively addressing diverse degradations in the retina while simultaneously enhancing the resolution of UWF images.
The proposed method is designed to be trained on unpaired sets of UWF and fundus images. We further present a corresponding multi-step training scheme that combines transfer learning and end-to-end dataset adaptation, leading to enhanced performance in both quantitative and qualitative evaluations.
2. Related Works
2.1. Retinal Image Enhancement
Due to the relatively invariable appearance, methods based on traditional image processing techniques continue to be proposed [
6,
7]. But the majority of methods leverage deep neural networks, as in [
5,
8], and especially GANs in particular [
4].
Pham and Shin [
9] considered additional factors such as drusen segmentation masks to not only improve image quality but also preserve crucial disease information during the enhancement process, addressing a common challenge in existing image enhancement techniques. To overcome the challenges of constructing a clean true ground truth (GT) dataset for retinal image data, particularly due to factors such as alignment, Yang et al. [
4] introduced an unpaired image generation method for enhancing low-quality retinal fundus images. Lee et al. [
5] proposed an attention module designed to automatically enhance low-quality retinal fundus images afflicted by complex degradation based on the specific nature of their degradation.
2.2. Blind and Unpaired Image Restoration
Blind image restoration is a computational process aimed at enhancing or recovering degraded images without prior knowledge of the degradation model or parameters. Traditionally, methods for blind image restoration have employed approaches involving the prediction of the estimation of degradation model parameters [
10] or the degradation kernels [
11]. Recently, there has been a trend towards directly generating high-quality images through training using deep learning models [
12]. Shocher et al. [
13] conducted super-resolution without relying on specific training examples of the target resolution during the model’s training phase. Yu et al. [
14] proposed a blind image restoration toolchain for multiple tasks with reinforcement learning.
Unpaired image restoration focuses on learning the difference between pairs of image domains rather than pairs of individual images. Multiple methods using GAN-based models [
15] have been proposed [
16,
17] to learn the mapping between the low-quality and high-quality images while also incorporating a cycle-consistency constraint [
18] to improve the quality of the generated images.
2.3. Hierarchical or Multi-Structured GAN
Recently, there has been significant progress in mitigating the instability associated with GAN training, leading to the emergence of various proposed approaches that involve connecting two or more GANs for joint learning. Several works showed stable translation between two different image domains using coupled-GAN architectures [
19]. Further works extended their usage to multiple domains or modalities [
20,
21]. And more works extended this approach beyond random image generation to tasks such as image restoration [
16], and exploration into more complex architectures has also been proposed [
22].
2.4. Transfer Learning for GANs
Pre-trained GAN models have demonstrated considerable efficacy across various computer vision tasks, particularly in scenarios characterized by limited training data [
23,
24]. Typically trained on extensive datasets comprising millions of annotated images, these models offer a foundation of learned features. Through the process of fine-tuning on novel datasets, one can capitalize on these pre-trained features, leading to the attainment of state-of-the-art performance across a diverse spectrum of tasks.
Early works confirmed successful generation in a new domain by transferring a pre-trained GAN to a new dataset [
25,
26]. Other works enabled transfer learning for GANs with datasets of limited size [
27,
28]. Li et al. [
29] proposed an optimization method for transfer learning for GAN that was free from biases towards specific classes and resilient to mode collapse and achieved by fine-tuning only the class embedding layer, which is part of the GAN architecture. Mo et al. [
30] proposed a method wherein the lower layers of the discriminator are fixed; then, it is partitioned into a feature extractor and a classifier. Subsequently, only the classifier is fine-tuned. Fregier and Gouray [
26] performed transfer learning for GAN on a new dataset by freezing the low-level layers of the encoder, thereby preserving pre-trained knowledge to the maximum extent possible.
3. Methods
3.1. Overview of FQ-UWF Generation
To get a final enhanced FQ-UWF result
, we split the process of FQ-UWF generation into two steps: (i) degradation enhancement (DE) and (ii) super-resolution (SR).
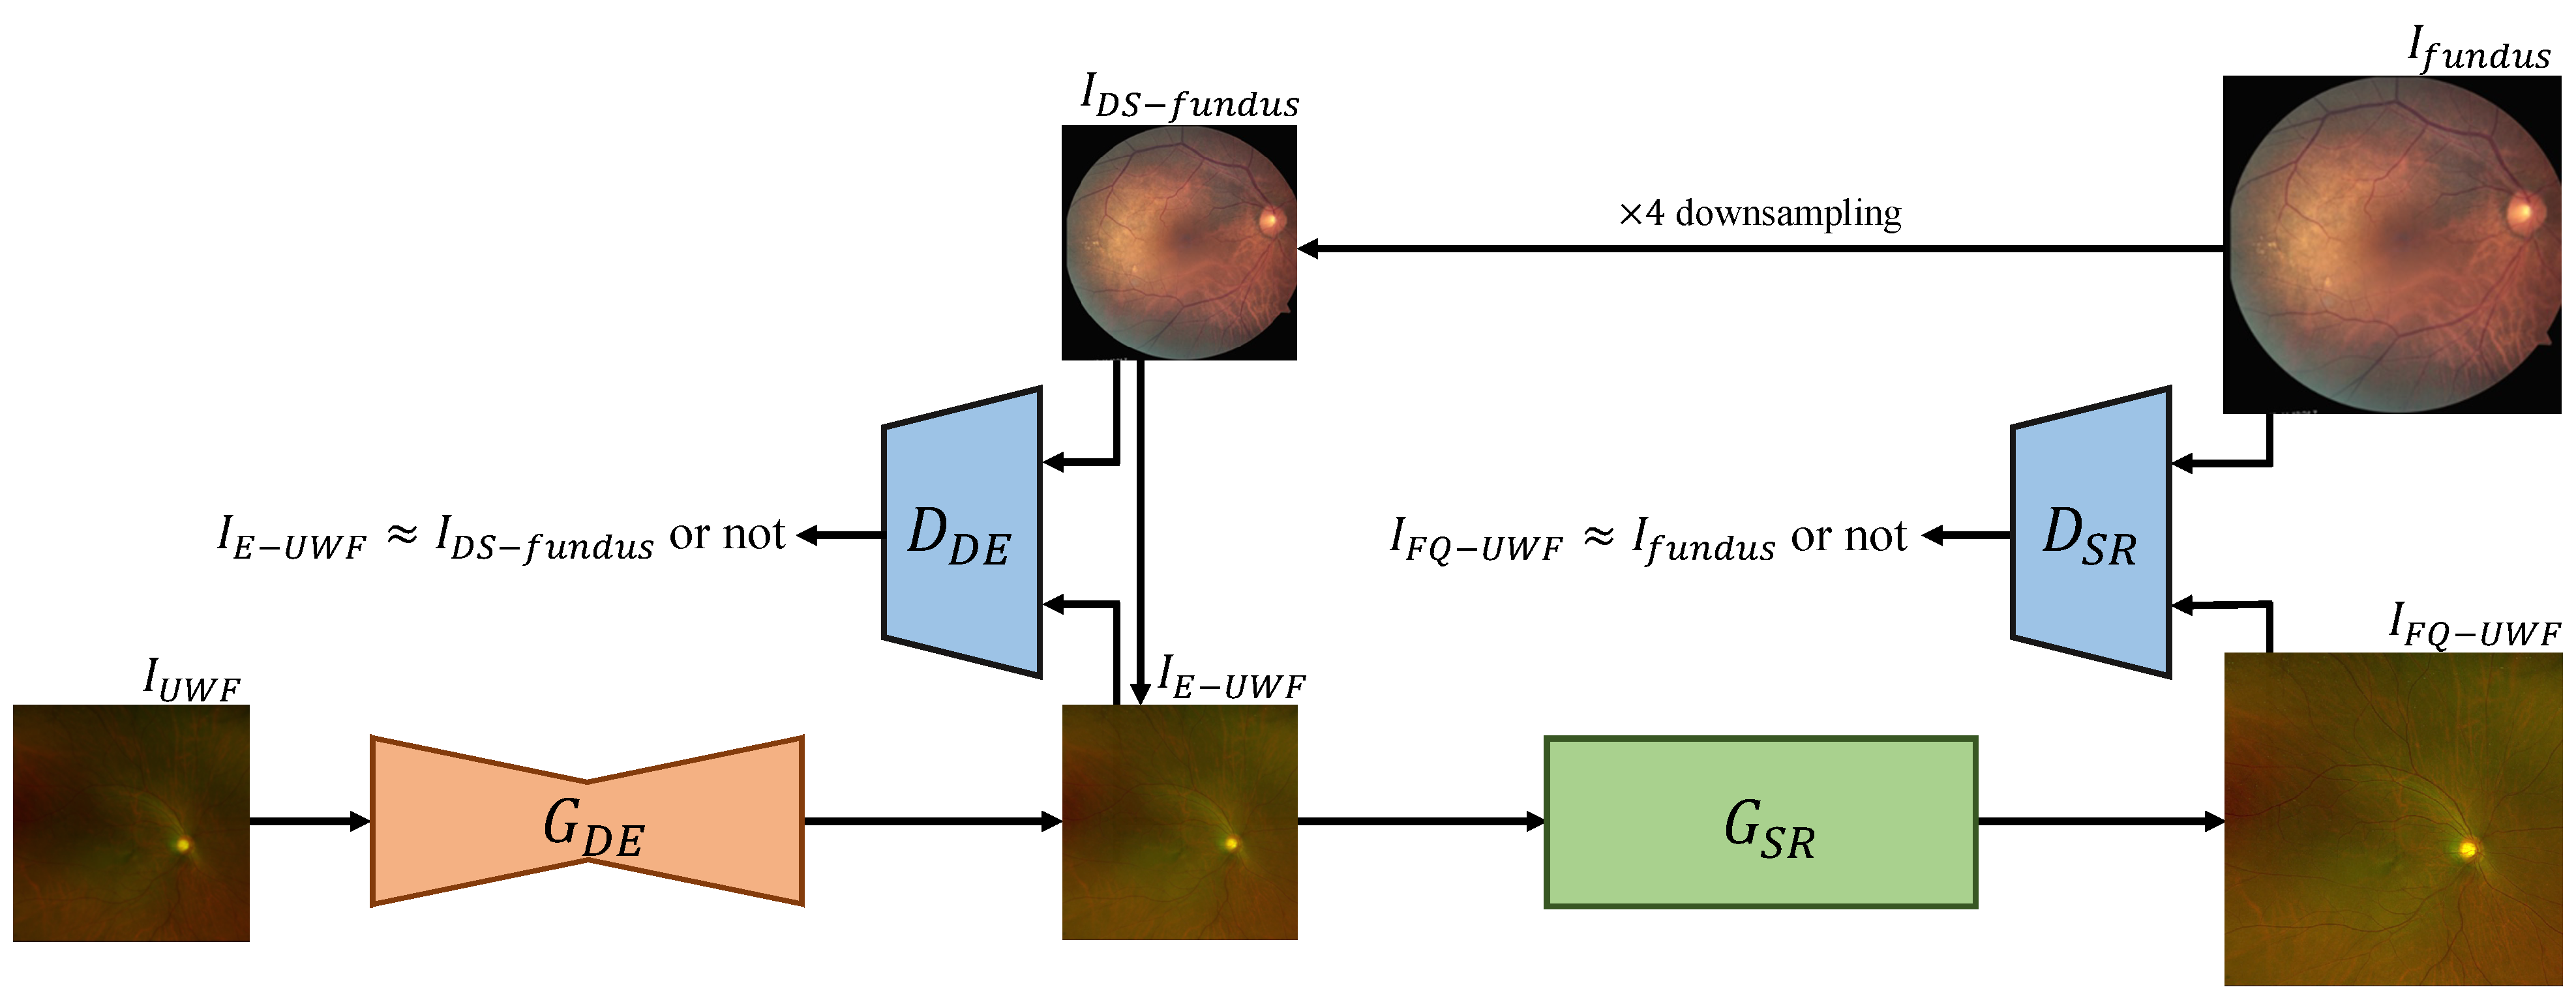
Figure 3 presents a visual overview of the framework. The order of the processes is tailored to maximize the quality of the output FQ-UWF images. The generator networks of each process, which we respectively denote as
and
, are coupled with adversarial discriminator networks
and
that are designed to enforce that the generators’ output images have similar image characteristics as the fundus images from the training set.
performs degradation enhancement on input image to get . Training of is guided by so that the output score values are similar for the given pair of and , which is a bicubically downsampled version of . is trained to make the score value of the given pair of images significantly differ.
performs
super-resolution on
to get
.
and
are trained in the same manner as
and
, respectively, with the pair of
and
. For
, we also impose cyclic constraints, as in [
18,
31], by applying the
operation to not only
but to
as well. For each module, we empirically determined appropriate network architectures. The following subsections describe further details of each module.
3.2. Architecture Details
3.2.1.
We apply U-net [
32] as the base architecture, as U-net has been proven to be effective for medical image enhancement [
33]. Within the encoder–decoder structure of U-net, we embed attention modules to better enhance local degradation or artifacts scattered throughout the input image. We apply the attention layer structure proposed by [
5], as it has been demonstrated to be effective for retinal image enhancement. The network structure is depicted in the top row of
Figure 4.
The box comprises a convolutional layer so that the spatial size of the feature is reduced to , where both the height and the width of the feature are reduced to , and the channel dimension is doubled. The box comprises a deconvolutional layer so that the spatial size of the feature is quadrupled, where both the height and the width of the feature are doubled, and the channel dimension is halved. The attention (Att) box comprises a sequentially connected batch normalization, activation, operation-wise attention module, and activation, where the operation-wise attention module enables the degradations to be better attended.
3.2.2.
The network structure is depicted in the middle row of
Figure 4. The
box comprises a
convolutional layer followed by activation. The
box comprises a
convolutional layer followed by batch normalization. The
box comprises a
convolutional layer followed by a pixel shuffler for expanding the height and width of the feature by a factor of two each. Channel calibration is designed for reducing the dimension of the feature to three, maintaining the spatial dimension of the feature. The Residual Block comprises series of
, activation,
, and residual connections for element-wise summing. We note that this structure is adopted from [
15].
Figure 4.
The detailed structure of generators and discriminators. The detailed structure of generator , , and the discriminator shared between and is illustrated. Note that even though and utilize the same structure, they are fundamentally distinct discriminative networks.
Figure 4.
The detailed structure of generators and discriminators. The detailed structure of generator , , and the discriminator shared between and is illustrated. Note that even though and utilize the same structure, they are fundamentally distinct discriminative networks.
3.2.3.
The structures of the discriminator models
and
are depicted in
Figure 4. The
box comprises a
convolutional layer followed by activation. The
box comprises a
convolutional layer followed by batch normalization. The Conv Block comprises series of
and activation. At the final layer of the network, there exists a score function for evaluating the similarity of input images, accompanied by a
layer aimed at reducing the dimension of the feature to a single scalar score value. We follow the structure of the discriminator in [
15] for
. The input images for
are pairs of downsampled real fundus images
and generated enhanced low-resolution UWF images
. The input images for
are pairs of real fundus images
and generated FQ-UWF images
.
3.3. Loss Functions and Training Details
Given that end-to-end training of an architecture composed of multiple networks is highly challenging, we take three steps to train the full network architecture composed of (i) training, (ii) training, and (iii) overall fine-tuning.
3.3.1. Training
We first impose adversarial loss on
and
as follows:
The identity mapping loss is important when performing tasks such as super-resolution or enhancement, as it helps to maintain the style (color, structure, etc.) of the source domain’s image while applying the target domain’s information [
18]. Thus, we use the loss function defined as:
We especially impose L2 regularization [
34] loss
on the weight of
to retain knowledge by preventing the abrupt change of the weight as much as possible when we use pre-trained
with other datasets. Finally, the loss function
to adapt the
to the fundus-UWF retinal image dataset is defined as:
where
and
control the relative importance of
and
, respectively.
For more efficient adversarial training, we initialize the network parameters by pretraining using [
5]. We then freeze the encoder parameters and only update the decoder parameters.
3.3.2. Training
In this step, we freeze all trainable parameters in
to generate
from
. After the adaptation process for
is done, we apply adversarial loss to
, which takes
from
as an input and outputs the FQ-UWF result
, which is defined as:
We also impose a cycle constraint [
18], which maintains consistency between the two domains, resulting in more realistic and coherent image translations on
→
→
. This can be denoted as follows:
As mentioned in [
17], by applying one-way cycle loss, the network can learn to handle various degradations by opening up the possibility of one-to-many generation mapping.
Overall, the loss function for
training is expressed as follows:
where
controls the relative importance of
.
3.3.3. Overall Fine-Tuning
In the previous training steps,
and
are trained independently. But to ensure stability and integration between the two generators, a final calibration process is performed on the entire architecture. Additionally, to improve the network’s performance in clinical situations, where the diagnosis of lesions is mainly based on the macular region rather than the periphery of the fundus, we again employ the same loss combinations as follows, only using patches from the macular region to fine-tune the entire model:
4. Experiments
4.1. Datasets and Settings
We used 3744 UWF images and 3744 fundus images acquired from the Kangbuk Samsung Medical Center (KBSMC) Ophthalmology Department from 2017 to 2019. Although UWF and fundus images were acquired in pairs, we anonymized and shuffled the image sets and did not use information of paired images during training. To train the model proposed in this paper, we used 3370 UWF and 3370 fundus images (unpaired). We set the scaling factor for super-resolution to 4, which was close to the approximate average difference in resolution between the UWF and fundus images. To test the model, we used 374 UWF images that were not used during training.
4.2. Implementation Details
We use the AdamW [
35] optimizer with learning rate
,
,
, and
to train
and
, with weight decay every 100K iterations with a decay rate of
. We set the learning rate to be halved every 200K iterations and the batch size as 16, and we train the model for more than
iterations using an NVIDIA RTX 2080Ti GPU. We feed two
-sized
and
patches that are randomly extracted from the UWF and fundus retinal images, respectively. During training, we apply additional dataset augmentations using rotation and flipping for
and
.
We set , , and , which adjust the degree of importance of , , and to be , , and , respectively.
4.3. Baselines for Comparison
We choose the following baselines to compare with the proposed method on the KBSMC dataset: (i) ZSSR [
13], (ii)
cycle-in-cycle GAN [
36], (iii) KMSR [
37], (iv) CinCGAN [
16], and (v) RLrestore [
14] + bicubic upsampling. We train these five baselines on the KBSMC dataset from scratch.
4.4. Evaluation Metrics
As we do not assume paired images for training, we avoid the use of reference-based metrics such as the PSNR [
38] or SSIM [
39] that require paired GTs. Instead, we measure the LPIPS [
40] and the FID [
41]. Both metrics indicate a closer distance between the two images when their values are smaller.
Additionally, given the nature of retinal images with various degradations, achieving sharp images is also an important consideration. To measure this, we measure
[
42,
43]. A lower value of the
metric implies a higher level of sharpness in the generated images, and therefore, the model is considered to deliver higher performance. We further substantiate the statistical validity of our comparisons by employing two-sided tests. We first utilize ANOVA [
44] to ascertain whether there were significant differences in the means among groups. Subsequently, to identify specific groups where differences exist, we employ Bonferroni’s correction [
45]. These analyses are conducted using
p-values for confirmation.
Furthermore, we attempt to measure the clinical impact of our method by comparative evaluation of the visibility of drusen in the images before improvement, the images after improvement, and the images. In this process, medical practitioners annotated drusen masks in the order of to minimize potential biases that might arise.
4.5. Experiments on the KBSMC Dataset
Figure 2 depicts samples of the enhancement by the proposed method. Improved clarity of vessel lines and background patterns can be observed.
4.5.1. Domain Distance Measurement Results
Table 1 shows the
, LPIPS, and FID results of the baselines for comparison and our method. The proposed method yields the best results in terms of the
and LPIPS metrics and the second-best results in terms of the FID.
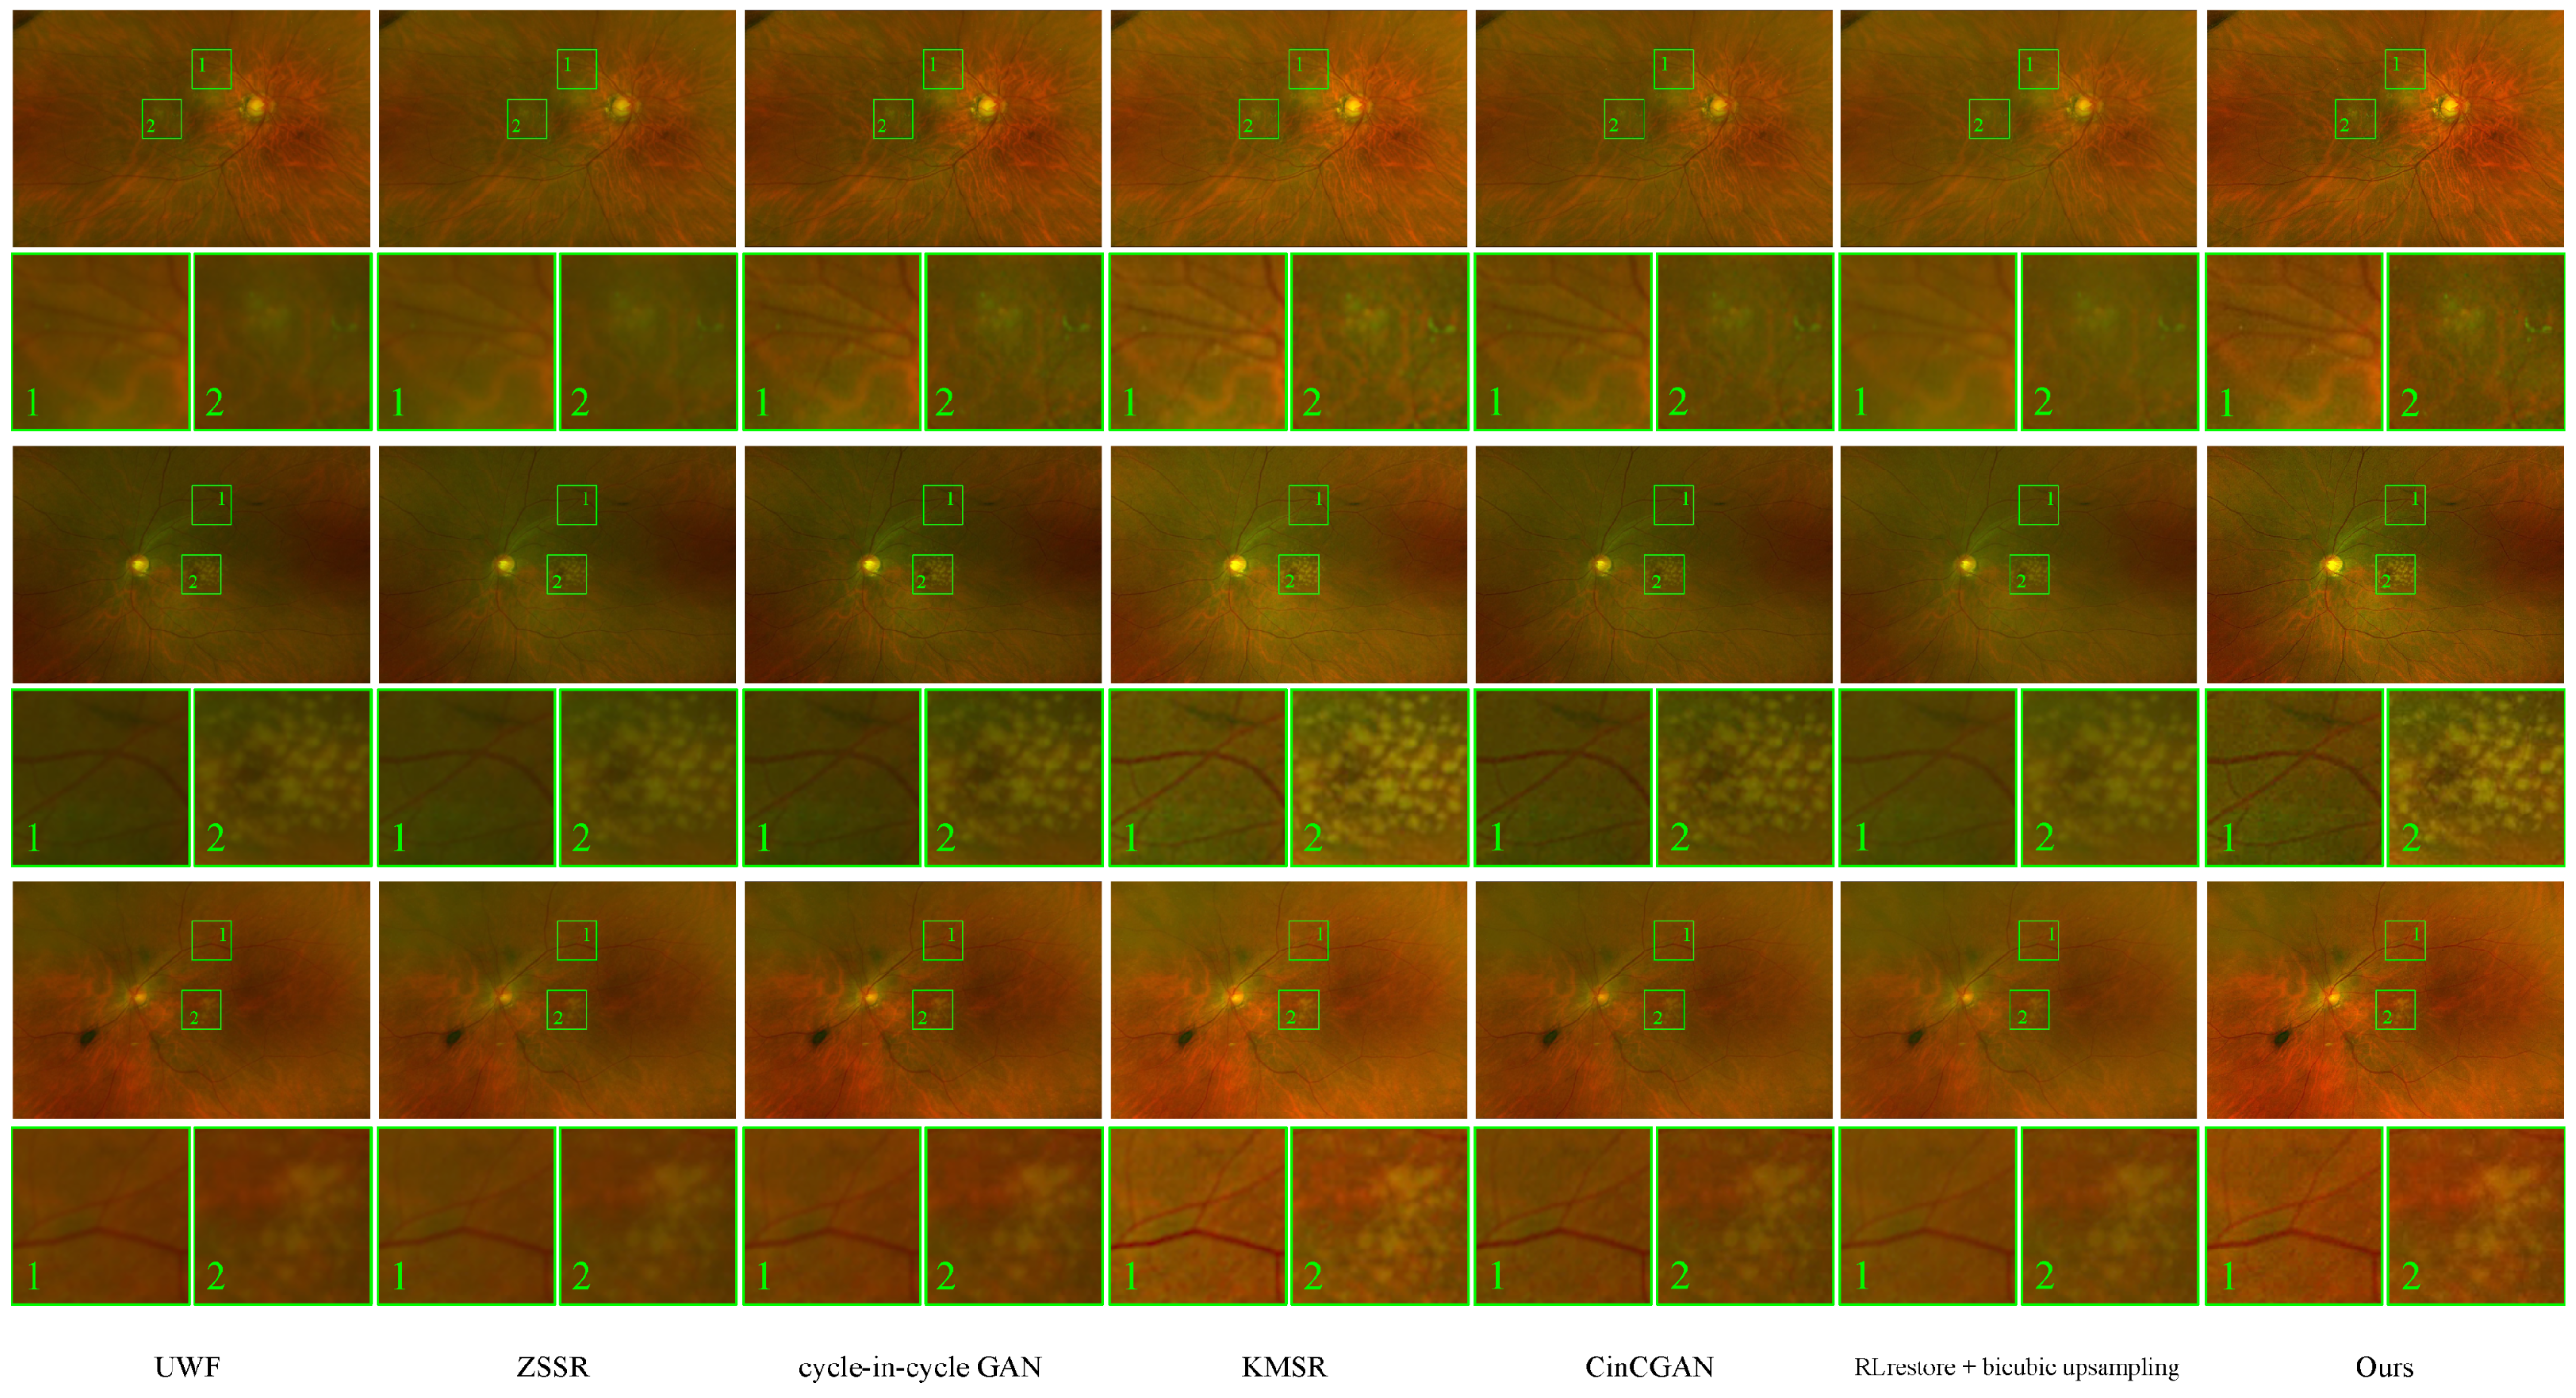
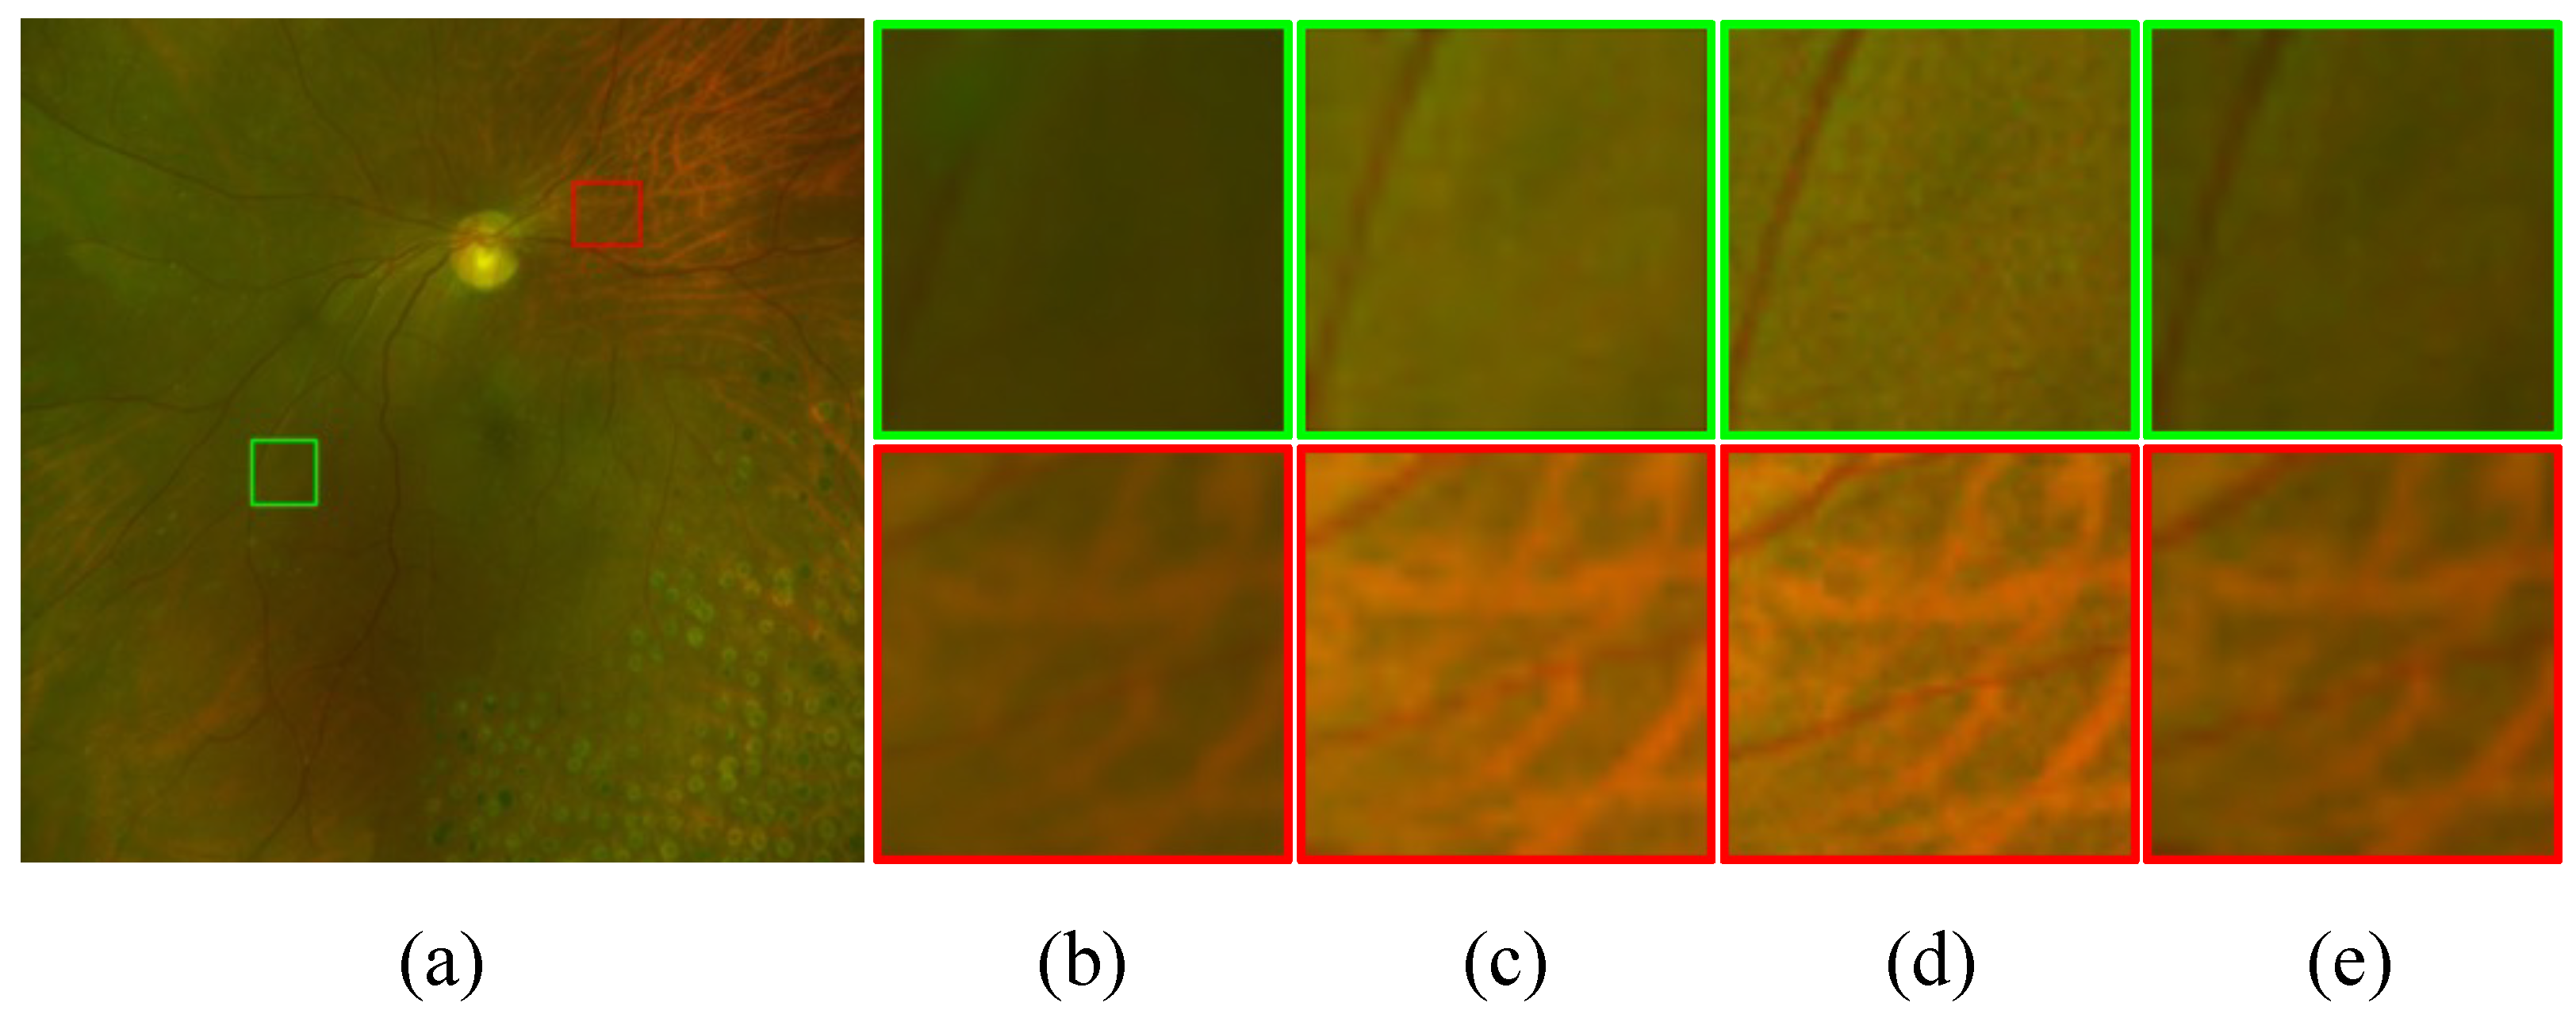
Figure 5 shows the corresponding sample results before and after the improvements with the given methods. We can see visible improvements in the patterns of vessels and the macula. This is corroborated by the
values in
Table 1. The low
p-values
in the table show the statistical significance of our method in terms of LPIPS, FID, and
.
4.5.2. Enhancement Results for Severe Degradations
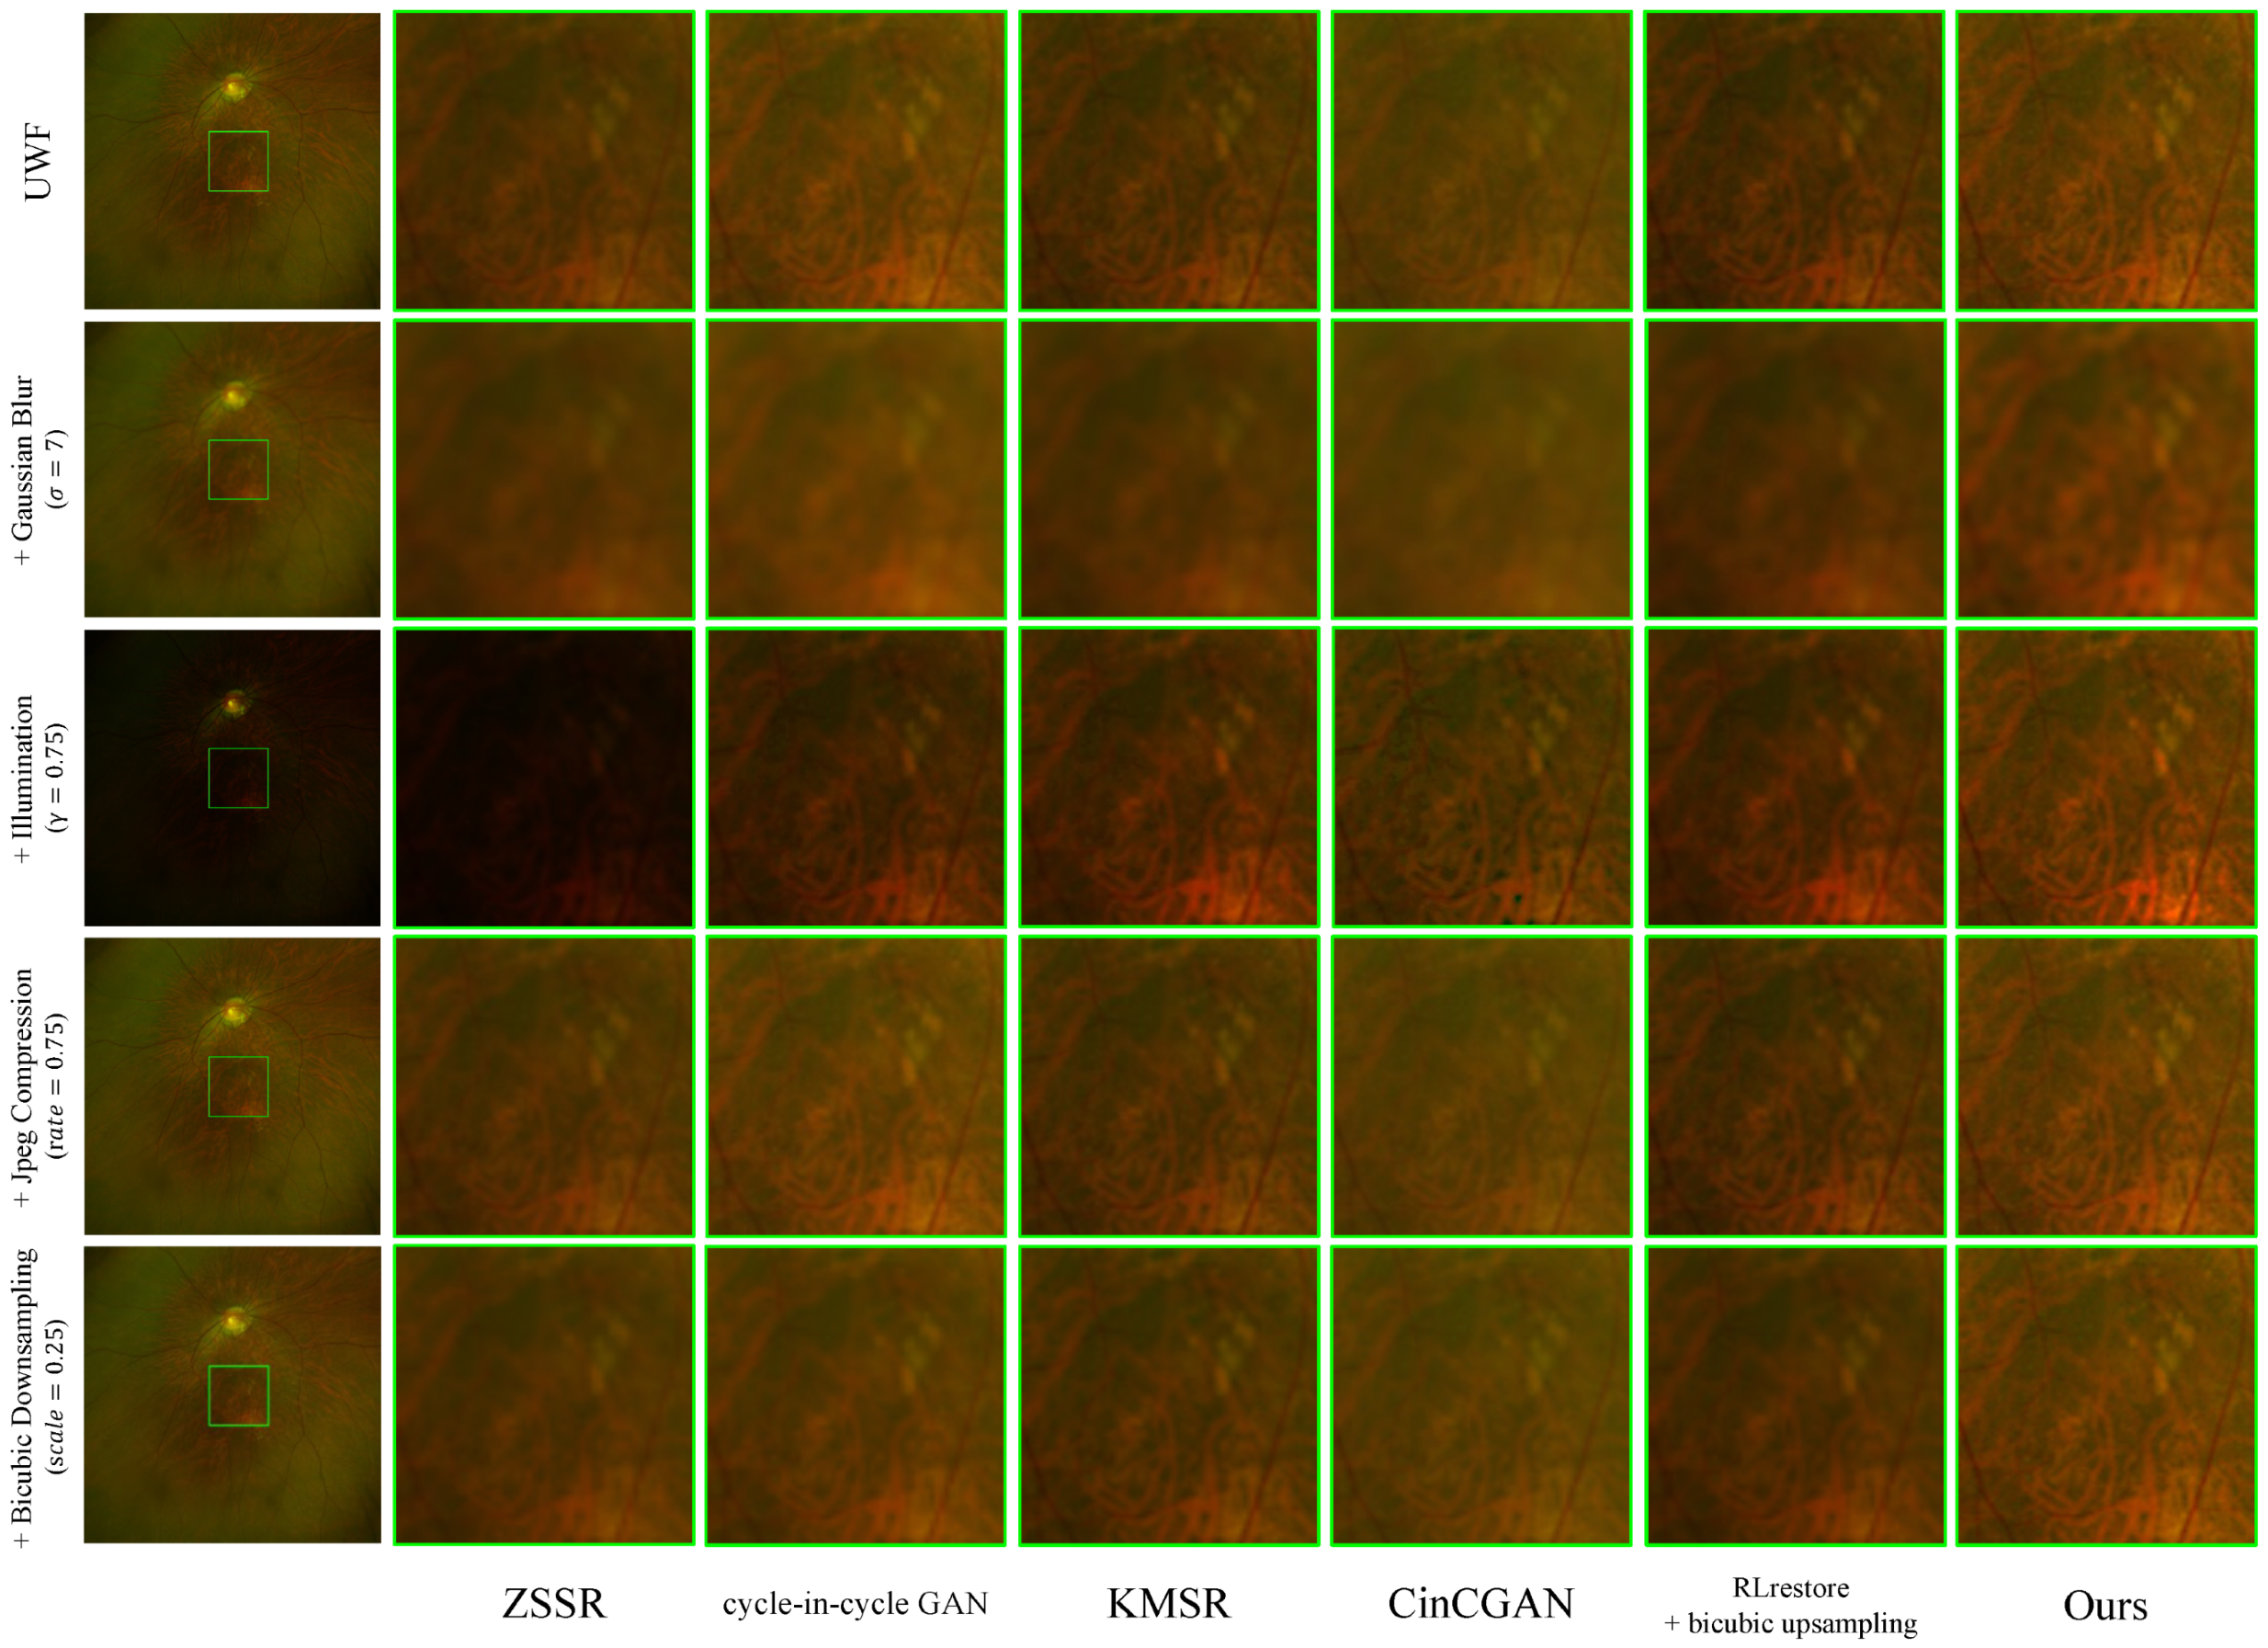
Figure 6 illustrates the comparison with various unpaired super-resolution methods and our method for the challenging scenario wherein the input image is corrupted with the following synthetic degradations: (i) Gaussian blur with
, where the image is degraded with a Gaussian blur kernel of size
×
as in [
46]; (ii) Illumination with
, where the brightness of the image is unevenly illuminated by gamma correction with
as in [
47]; (iii) JPEG compression with
, where the
as in [
48]; (iv) Bicubic downsampling with
, where the size of neighborhoods for interpolation is
×
as in [
49].
Table 2 presents the corresponding results in terms of the
r, LPIPS, and FID metrics. When considering these results collectively, our method demonstrates the most consistent and effective improvement across the majority of degradation types.
4.5.3. Drusen Detection Results
Figure 7 presents samples of
,
, and
images with corresponding manually annotated drusen region masks. Quantitative comparative evaluations of the drusen region masks for
and
are presented in
Table 3. Assuming the
drusen mask as GT, we measure the mean average precision (mAP) as the intersection over union (IoU) [
50] averaged across the number of images. The increase in mAP highlights the improved diagnostic capabilities through the enhanced
images.
4.6. Ablation Study
Table 1 illustrates the performance results of method variations such as the inclusion of pre-trained
through
for training, the utilization of
and
, and the consideration of their configuration order. When utilizing pre-trained
before super-resolution without a separate degradation enhancement process, significantly better results in terms of
, LPIPS, and FID metrics were observed compared to cases where only super-resolution was performed. And training
via
and utilizing it for super-resolution led to overwhelmingly superior results. Also, the configuration order of
and
shows a substantial numerical difference, justifying the subsequent structure of the modules.
Table 4 shows the performance changes when specific components of the loss functions that constitute the entire network are used. According to these results, the most significant performance improvement in our model, which is composed of both
and
, is achieved when fine-tuning
to suit the
image domain. Furthermore, we can observe that utilizing
, even when employing the bicubic upsampling method, outperformed the results using only the SRM network. This suggests that super-resolution without adequate degradation removal has limitations in enhancing retinal images.
Figure 8 illustrates the importance of the process for removing degradations before super-resolution. We can see that using the improved
through the
to generate
showcases a significantly superior enhancement capability compared to generating
directly from
without the prior degradation removal process.
5. Discussion
The proposed method can be trained on unpaired UWF and fundus image sets. By reducing dependency on paired and annotated data, our method becomes more pragmatic for integration into real-world medical settings, where the acquisition of such data is often a logistical challenge. The enhanced image quality facilitated by our approach holds the potential to significantly improve diagnostic accuracy. The ability to detect subtle changes in the retinal structure, often indicative of early-stage pathologies, is critical for timely interventions and effective disease management.
Despite the promising outcomes, our study prompts further investigation into several critical areas. The robustness and generalizability of our model need to be rigorously examined across a spectrum of imaging conditions, including instances with various ocular pathologies and diverse qualities of image acquisition. The influence of different imaging devices and settings on our model’s performance demands scrutiny to ensure broad applicability in clinical settings.
To validate the real-world impact of our enhancement method, collaboration with domain experts and comprehensive clinical validation are imperative. Ophthalmologists’ insights will provide essential perspectives on how the enhanced image quality translates into improved diagnostic accuracy and treatment planning. The feasibility of implementation in diverse clinical settings warrants further exploration considering factors such as computational requirements, integration with existing diagnostic workflows, and user-friendly interfaces for healthcare professionals.
Author Contributions
All authors have participated in the conception and design, analysis and interpretation of the data, and drafting the article and revising it critically for important intellectual content. All authors have read and agreed to the published version of the manuscript.
Funding
This research received no external funding.
Institutional Review Board Statement
This study adhered to the tenets of the Declaration of Helsinki, and the protocol was reviewed and approved by the Institutional Review Board (IRB) of Kangbuk Samsung Hospital (No. KBSMC 2019-08-031).
Informed Consent Statement
Our study is retrospective using medical records, and our data were fully anonymized before processing. The IRB waived the requirement for informed consent.
Data Availability Statement
The original contributions presented in the study are included in the article, further inquiries can be directed to the corresponding authors.
Conflicts of Interest
None of the authors have any proprietary interest or conflicts of interests related to this submission.
Abbreviations
The following abbreviations are used in this manuscript:
| UWF | Ultra-Widefield |
| FQ | Fundus Quality |
| GAN | Generative Adversarial Network |
| DE | Degradation Enhancement |
| SR | Super Resolution |
| KBSMC | Kangbuk Samsung Medical Center |
| IoU | Intersection over Union |
| GT | Ground Truth |
References
- Kumar, V.; Surve, A.; Kumawat, D.; Takkar, B.; Azad, S.; Chawla, R.; Shroff, D.; Arora, A.; Singh, R.; Venkatesh, P. Ultra-wide field retinal imaging: A wider clinical perspective. Indian J. Ophthalmol. 2021, 69, 824–835. [Google Scholar] [CrossRef] [PubMed]
- Midena, E.; Marchione, G.; Di Giorgio, S.; Rotondi, G.; Longhin, E.; Frizziero, L.; Pilotto, E.; Parrozzani, R.; Midena, G. Ultra-wide-field fundus photography compared to ophthalmoscopy in diagnosing and classifying major retinal diseases. Sci. Rep. 2022, 12, 19287. [Google Scholar] [CrossRef] [PubMed]
- Fei, B.; Lyu, Z.; Pan, L.; Zhang, J.; Yang, W.; Luo, T.; Zhang, B.; Dai, B. Generative Diffusion Prior for Unified Image Restoration and Enhancement. arXiv 2023, arXiv:2304.01247. [Google Scholar]
- Yang, B.; Zhao, H.; Cao, L.; Liu, H.; Wang, N.; Li, H. Retinal image enhancement with artifact reduction and structure retention. Pattern Recognit. 2023, 133, 108968. [Google Scholar] [CrossRef]
- Lee, K.G.; Song, S.J.; Lee, S.; Yu, H.G.; Kim, D.I.; Lee, K.M. A deep learning-based framework for retinal fundus image enhancement. PLoS ONE 2023, 18, e0282416. [Google Scholar] [CrossRef] [PubMed]
- Li, D.; Zhang, L.; Sun, C.; Yin, T.; Liu, C.; Yang, J. Robust Retinal Image Enhancement via Dual-Tree Complex Wavelet Transform and Morphology-Based Method. IEEE Access 2019, 7, 47303–47316. [Google Scholar] [CrossRef]
- Román, J.C.M.; Noguera, J.L.V.; García-Torres, M.; Benítez, V.E.C.; Matto, I.C. Retinal Image Enhancement via a Multiscale Morphological Approach with OCCO Filter. In Proceedings of the Information Technology and Systems, Libertad City, Ecuador, 4–6 February 2021; Rocha, Á., Ferrás, C., López-López, P.C., Guarda, T., Eds.; Springer: Cham, Switzerland, 2021; pp. 177–186. [Google Scholar]
- Abbood, S.H.; Hamed, H.N.A.; Rahim, M.S.M.; Rehman, A.; Saba, T.; Bahaj, S.A. Hybrid Retinal Image Enhancement Algorithm for Diabetic Retinopathy Diagnostic Using Deep Learning Model. IEEE Access 2022, 10, 73079–73086. [Google Scholar] [CrossRef]
- Pham, Q.T.M.; Shin, J. Generative Adversarial Networks for Retinal Image Enhancement with Pathological Information. In Proceedings of the 2021 15th International Conference on Ubiquitous Information Management and Communication (IMCOM), Seoul, Republic of Korea, 4–6 January 2021; pp. 1–4. [Google Scholar] [CrossRef]
- Yang, J.; Wright, J.; Huang, T.; Ma, Y. Image super-resolution as sparse representation of raw image patches. In Proceedings of the 2008 IEEE Conference on Computer Vision and Pattern Recognition, Anchorage, AK, USA, 23–28 June 2008; pp. 1–8. [Google Scholar] [CrossRef]
- Yang, C.Y.; Ma, C.; Yang, M.H. Single-Image Super-Resolution: A Benchmark. In Proceedings of the Computer Vision—ECCV 2014, Cham, Switzerland, 6–12 September 2014; pp. 372–386. [Google Scholar]
- Zheng, Z.; Nie, N.; Ling, Z.; Xiong, P.; Liu, J.; Wang, H.; Li, J. DIP: Deep Inverse Patchmatch for High-Resolution Optical Flow. arXiv 2022, arXiv:2204.00330. [Google Scholar]
- Shocher, A.; Cohen, N.; Irani, M. “Zero-Shot” Super-Resolution using Deep Internal Learning. arXiv 2017, arXiv:1712.06087. [Google Scholar]
- Yu, K.; Dong, C.; Lin, L.; Loy, C.C. Crafting a Toolchain for Image Restoration by Deep Reinforcement Learning. In Proceedings of the IEEE Conference on Computer Vision and Pattern Recognition, Salt Lake City, UT, USA, 18–23 June 2018; pp. 2443–2452. [Google Scholar]
- Ledig, C.; Theis, L.; Huszar, F.; Caballero, J.; Aitken, A.P.; Tejani, A.; Totz, J.; Wang, Z.; Shi, W. Photo-Realistic Single Image Super-Resolution Using a Generative Adversarial Network. arXiv 2016, arXiv:1609.04802. [Google Scholar]
- Yuan, Y.; Liu, S.; Zhang, J.; Zhang, Y.; Dong, C.; Lin, L. Unsupervised Image Super-Resolution using Cycle-in-Cycle Generative Adversarial Networks. arXiv 2018, arXiv:1809.00437. [Google Scholar]
- Maeda, S. Unpaired Image Super-Resolution using Pseudo-Supervision. arXiv 2020, arXiv:2002.11397. [Google Scholar]
- Zhu, J.; Park, T.; Isola, P.; Efros, A.A. Unpaired Image-to-Image Translation using Cycle-Consistent Adversarial Networks. arXiv 2017, arXiv:1703.10593. [Google Scholar]
- Yi, Z.; Zhang, H.; Tan, P.; Gong, M. DualGAN: Unsupervised Dual Learning for Image-to-Image Translation. arXiv 2018, arXiv:1704.02510. [Google Scholar]
- Xu, T.; Zhang, P.; Huang, Q.; Zhang, H.; Gan, Z.; Huang, X.; He, X. AttnGAN: Fine-Grained Text to Image Generation with Attentional Generative Adversarial Networks. arXiv 2017, arXiv:1711.10485. [Google Scholar]
- Choi, Y.; Choi, M.; Kim, M.; Ha, J.W.; Kim, S.; Choo, J. StarGAN: Unified Generative Adversarial Networks for Multi-Domain Image-to-Image Translation. arXiv 2018, arXiv:1711.09020. [Google Scholar]
- Ye, L.; Zhang, B.; Yang, M.; Lian, W. Triple-translation GAN with multi-layer sparse representation for face image synthesis. Neurocomputing 2019, 358, 294–308. [Google Scholar] [CrossRef]
- Brock, A.; Donahue, J.; Simonyan, K. Large Scale GAN Training for High Fidelity Natural Image Synthesis. In Proceedings of the International Conference on Learning Representations, New Orleans, LA, USA, 6–9 May 2019. [Google Scholar]
- Kang, M.; Shin, J.; Park, J. StudioGAN: A Taxonomy and Benchmark of GANs for Image Synthesis. IEEE Trans. Pattern Anal. Mach. Intell. (TPAMI) 2023, 45, 15725–15742. [Google Scholar] [CrossRef] [PubMed]
- Tzeng, E.; Hoffman, J.; Saenko, K.; Darrell, T. Adversarial Discriminative Domain Adaptation. arXiv 2017, arXiv:1702.05464. [Google Scholar]
- Fregier, Y.; Gouray, J.B. Mind2Mind: Transfer Learning for GANs. In Proceedings of the Geometric Science of Information, Paris, France, 21–23 July 2021; Nielsen, F., Barbaresco, F., Eds.; Springer: Cham, Switzerland, 2021; pp. 851–859. [Google Scholar]
- Wang, Y.; Wu, C.; Herranz, L.; van de Weijer, J.; Gonzalez-Garcia, A.; Raducanu, B. Transferring GANs: Generating images from limited data. arXiv 2018, arXiv:1805.01677. [Google Scholar]
- Elaraby, N.; Barakat, S.; Rezk, A. A conditional GAN-based approach for enhancing transfer learning performance in few-shot HCR tasks. Sci. Rep. 2022, 12, 16271. [Google Scholar] [CrossRef]
- Li, Q.; Mai, L.; Alcorn, M.A.; Nguyen, A. A cost-effective method for improving and re-purposing large, pre-trained GANs by fine-tuning their class-embeddings. arXiv 2020, arXiv:1910.04760. [Google Scholar]
- Mo, S.; Cho, M.; Shin, J. Freeze the Discriminator: A Simple Baseline for Fine-Tuning GANs. arXiv 2020, arXiv:2002.10964. [Google Scholar]
- Mertikopoulos, P.; Papadimitriou, C.H.; Piliouras, G. Cycles in adversarial regularized learning. arXiv 2017, arXiv:1709.02738. [Google Scholar]
- Ronneberger, O.; Fischer, P.; Brox, T. U-Net: Convolutional Networks for Biomedical Image Segmentation. In Proceedings of the Medical Image Computing and Computer-Assisted Intervention—MICCAI 2015, Munich, Germany, 5–9 October 2015; Navab, N., Hornegger, J., Wells, W.M., Frangi, A.F., Eds.; Springer: Cham, Switzerland, 2015; pp. 234–241. [Google Scholar]
- Azad, R.; Aghdam, E.K.; Rauland, A.; Jia, Y.; Avval, A.H.; Bozorgpour, A.; Karimijafarbigloo, S.; Cohen, J.P.; Adeli, E.; Merhof, D. Medical Image Segmentation Review: The success of U-Net. arXiv 2022, arXiv:2211.14830. [Google Scholar]
- Cortes, C.; Mohri, M.; Rostamizadeh, A. L2 Regularization for Learning Kernels. arXiv 2012, arXiv:1205.2653. [Google Scholar]
- Loshchilov, I.; Hutter, F. Decoupled Weight Decay Regularization. arXiv 2019, arXiv:1711.05101. [Google Scholar]
- Kim, G.; Park, J.; Lee, K.; Lee, J.; Min, J.; Lee, B.; Han, D.K.; Ko, H. Unsupervised Real-World Super Resolution with Cycle Generative Adversarial Network and Domain Discriminator. In Proceedings of the 2020 IEEE/CVF Conference on Computer Vision and Pattern Recognition Workshops (CVPRW), Seattle, WA, USA, 14–19 June 2020; pp. 1862–1871. [Google Scholar] [CrossRef]
- Zhou, R.; Süsstrunk, S. Kernel Modeling Super-Resolution on Real Low-Resolution Images. In Proceedings of the 2019 IEEE/CVF International Conference on Computer Vision (ICCV), Seoul, Republic of Korea, 27 October–2 November 2019; pp. 2433–2443. [Google Scholar] [CrossRef]
- Horé, A.; Ziou, D. Image Quality Metrics: PSNR vs. SSIM. In Proceedings of the 2010 20th International Conference on Pattern Recognition, Istanbul, Turkey, 23–26 August 2010; pp. 2366–2369. [Google Scholar] [CrossRef]
- Wang, Z.; Bovik, A.; Sheikh, H.; Simoncelli, E. Image quality assessment: From error visibility to structural similarity. IEEE Trans. Image Process. 2004, 13, 600–612. [Google Scholar] [CrossRef]
- Zhang, R.; Isola, P.; Efros, A.A.; Shechtman, E.; Wang, O. The Unreasonable Effectiveness of Deep Features as a Perceptual Metric. In Proceedings of the 2018 IEEE/CVF Conference on Computer Vision and Pattern Recognition, Salt Lake City, UT, USA, 18–23 June 2018; pp. 586–595. [Google Scholar] [CrossRef]
- Heusel, M.; Ramsauer, H.; Unterthiner, T.; Nessler, B.; Hochreiter, S. GANs Trained by a Two Time-Scale Update Rule Converge to a Local Nash Equilibrium. arXiv 2018, arXiv:1706.08500. [Google Scholar]
- Bai, X.; Zhou, F.; Xue, B. Image enhancement using multi scale image features extracted by top-hat transform. Opt. Laser Technol. 2012, 44, 328–336. [Google Scholar] [CrossRef]
- Lai, R.; Yang, Y.T.; Wang, B.J.; Zhou, H.X. A quantitative measure based infrared image enhancement algorithm using plateau histogram. Opt. Commun. 2010, 283, 4283–4288. [Google Scholar] [CrossRef]
- St»hle, L.; Wold, S. Analysis of variance (ANOVA). Chemom. Intell. Lab. Syst. 1989, 6, 259–272. [Google Scholar] [CrossRef]
- Bonferroni, C. Teoria Statistica delle Classi e Calcolo delle Probabilità; Pubblicazioni del R. Istituto superiore di scienze economiche e commerciali di Firenze; Seeber: Florence, Italy, 2010. [Google Scholar] [CrossRef]
- Gedraite, E.S.; Hadad, M. Investigation on the effect of a Gaussian Blur in image filtering and segmentation. In Proceedings of the ELMAR-2011, Zadar, Croatia, 14–16 September 2011; pp. 393–396. [Google Scholar]
- Shi, Y.; Yang, J.; Wu, R. Reducing Illumination Based on Nonlinear Gamma Correction. In Proceedings of the 2007 IEEE International Conference on Image Processing, San Antonio, TX, USA, 16 September–19 October 2007; Volume 1, pp. I-529–I-532. [Google Scholar] [CrossRef]
- Wallace, G. The JPEG still picture compression standard. IEEE Trans. Consum. Electron. 1992, 38, xviii–xxxiv. [Google Scholar] [CrossRef]
- Rad, M.S.; Yu, T.; Musat, C.; Ekenel, H.K.; Bozorgtabar, B.; Thiran, J.P. Benefiting from Bicubically Down-Sampled Images for Learning Real-World Image Super-Resolution. arXiv 2020, arXiv:2007.03053. [Google Scholar]
- He, K.; Gkioxari, G.; Dollár, P.; Girshick, R. Mask R-CNN. arXiv 2018, arXiv:1703.06870. [Google Scholar]
| Disclaimer/Publisher’s Note: The statements, opinions and data contained in all publications are solely those of the individual author(s) and contributor(s) and not of MDPI and/or the editor(s). MDPI and/or the editor(s) disclaim responsibility for any injury to people or property resulting from any ideas, methods, instructions or products referred to in the content. |
© 2024 by the authors. Licensee MDPI, Basel, Switzerland. This article is an open access article distributed under the terms and conditions of the Creative Commons Attribution (CC BY) license (https://creativecommons.org/licenses/by/4.0/).


