1. Introduction
Jiaolong’s deep-sea submarine voyages have been expanding, and there is a growing need for the workload evaluation of oceanauts due to China’s rapid development of deep-sea resource exploration and development. An oceanaut operates manned submarine equipment and works in a complex deep-sea environment; the main workload they bear is mental workload [
1]. The classification of mental burden is one of main topics in investigations on the operating jobs of deep-sea manipulator oceanauts. In an effort to categorize and forecast levels of mental burden, current research efforts often use the subjective scale technique, primary task method, supported task method, and psychophysiological measurements [
2,
3,
4]. The four indexes—the accurate reaction time for a primary task, the variation rate of the accurate reaction time for a subsidiary task, the weighted subjective workload rating, and the variation rate of heart rate variance—were used and tested [
5] in Zhang’s two mathematical models of comprehensive mental workload indexes. Hancock et al. put predictions from a model of mental effort to the test using the Time Pools performance challenge. Data from the experiment showed that when perceived distance from a task objective rises and the effective time for action decreases, mental burden increases [
6]. According to Noel et al.’s research, a tiny subset of integrated and calibrated psycho-physiological variables obtained from a single pilot on a particular day may properly categorize the mental effort for a different pilot on a different day [
7]. Cantin et al. used the probing reaction time (RT) approach to quantify workload and looked at how young and older active drivers’ mental effort changed depending on how challenging the driving environment was [
8]. To determine if subjective time perception might be utilized as a gauge of cognitive effort during simulated automobile driving, Baldauf et al. employed electrodermal activity and subjective assessments of mental workload (SWAT) [
9].
To evaluate the mental workload related to agricultural spraying, Dey et al. compared and chose the best variants of NASA-TLX and SSWAT. The study looked at the various variants of two widely used workload rating scales in terms of their sensitivity and diagnosticity and chose the best variants of each scale for upcoming mental workload research [
10]. According to Jo et al.’s proposed mathematical model in relation to the activated time of ACT-R modules, the participants’ average NASA-TLX ratings were highly correlated with the predicted values of mental workload attained using the proposed method [
11]. In order to evaluate mental effort, Mouzé-Amady et al. devised a novel technique for calculating weights from qualitative fuzzy integrals and applied it to the NASA-TLX subscales of the National Aeronautics and Space Administration-Task load index [
12]. To measure mental workload, Klein et al. utilized the multiple resources questionnaire (MRQ) and the Dundee stress state questionnaire (DSSQ) [
13]. The results suggested a potentially applicable method to brain computer interface systems that adapt to human mental workload [
14]. In a municipal traffic control center, Majid et al. employed the NASA-Task load index (TLX) to assess operators’ mental effort while observing traffic density. The findings revealed that the operators had a greater mental burden during high traffic density than during low traffic density [
15]. These approaches have significant systematic mistakes, applicability restrictions, and are often contaminated by the subjective preferences of decision makers [
16,
17,
18]. Different machine learning algorithms have been presented in this field in an effort to find an appropriate way to measure mental strain and have shown competitive performance [
19,
20,
21]. Ke developed a comprehensive mental workload recognition model using feature selection and regression modeling. The cross-task regression performance was greatly improved [
22] when the model was trained and evaluated using the most robust feature subset chosen by cross-task RFE. According to the classification findings (with the greatest five-class accurate classification rate of 88%), the location projection preservation approach can retain high enough MWL classification accuracy [
23]. In order to evaluate operator workload, Grassmann et al. integrated physiological and self-report measures of mental effort. The findings indicated that including individual characteristics may minimize unexplained variance and boost the validity of workload assessments [
24]. By repeatedly adding misclassified instances from the test set to the training set, Zhang et al. developed an adaptive support-vector-machine-based technique to categorize operator mental workload (MWL) into a few discrete levels to adjust the model’s performance to a new participant [
25].
So et al. looked into the viability of assessing the dynamic changes in mental effort using short-term frontal EEG [
26]. Despite the fact that the aforementioned studies have examined and debated the mental workload and have produced many successes, they have not yet been used to recognize the mental burden of oceanauts. In order to obtain the EEG signals of the individuals while they were driving, feature extraction and analysis were performed on deep-sea driving simulation trials. It was suggested to use QGA-MSVM to efficiently categorize the mental burden experienced by drivers.
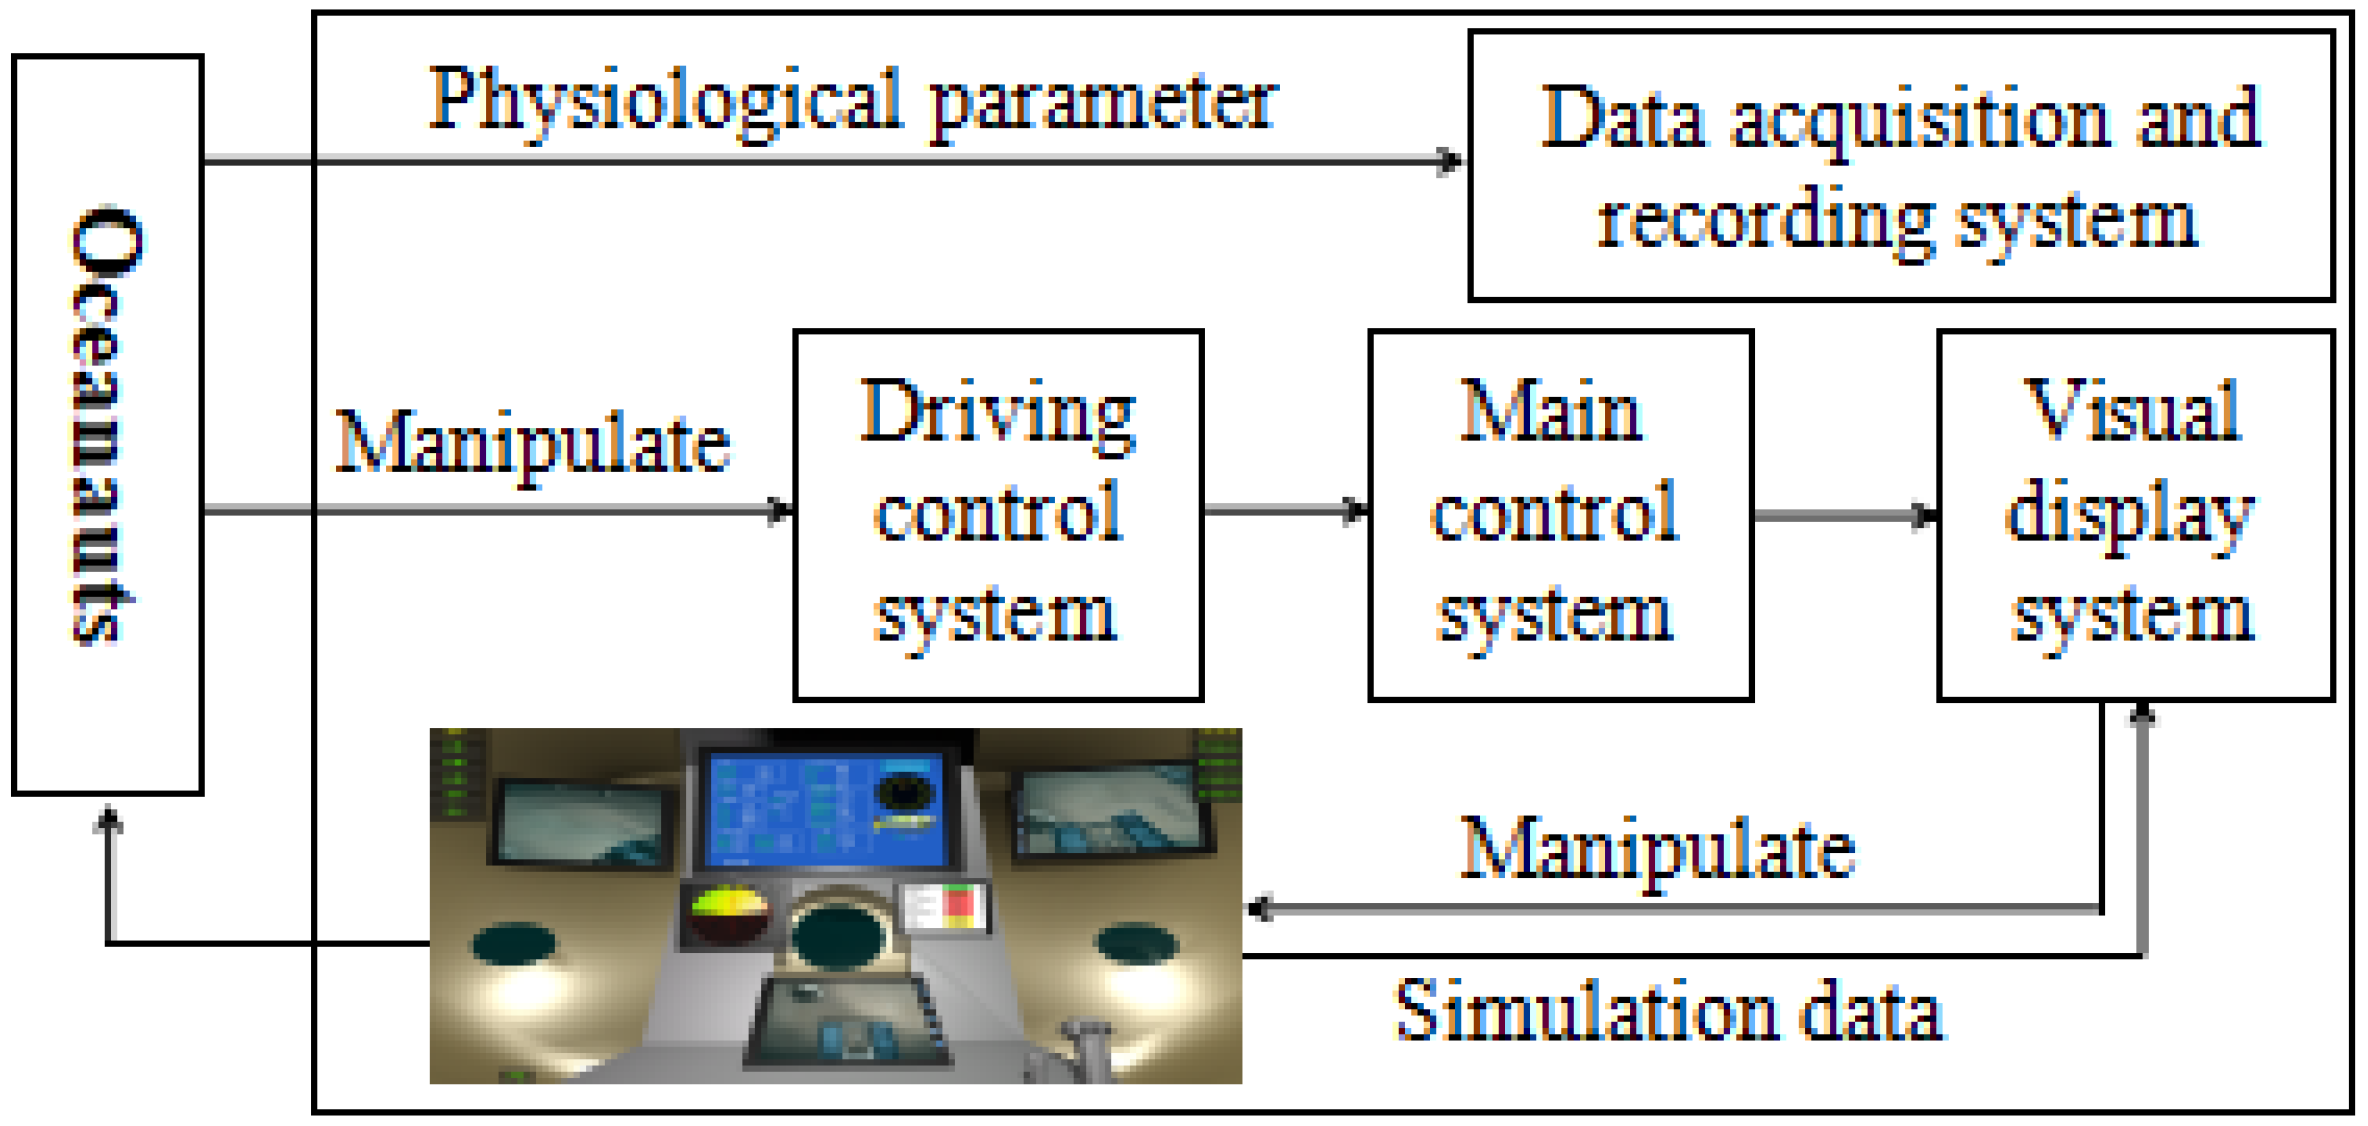
Currently, there is not much research on measuring mental strain for oceanauts; it mostly focuses on application industries like pilots and drivers of cars. The manned submersible simulation operating system is created using 3dsMax and Unity3D.
The remainder of this essay is structured as follows. EEG signal extraction and data processing are described in
Section 2. In
Section 3, a kernel function parameter optimization strategy based on a quantum evolutionary algorithm is suggested along with a mathematical explanation of data categorization. The task is designed and the platform for the simulation experiment is built in
Section 4. In
Section 5, the findings are examined and discussed. The key points of the text are outlined in
Section 6.
In order to develop a reasonable operation process and to take action when the mental load of the underwater crew is either too small or too large (man–machine function redistribution, the responsibility redistribution of the chief and co-pilot, and task strategy re-selection), physiological indicators are used to effectively assess the mental load of the underwater crew.
2. EEG Signals and Processing
2.1. EEG Signals
EEG is a technique used to electrophysiologically record brain activity, including mental effort during job activities. Thirty-two Ag/AgCl scalp electrodes were placed in accordance with the worldwide 10/20 standard on a Neu-roscan Quik-Cap, which has 40 channels. A Neuroscan NuAmps device was used to collect EEG data at a sampling rate of 1000 Hz. Initially, the electrodes were grounded to the vertex and referenced to the right mastoid (A2 channel).
2.2. Data Processing
The amplitude of the high-frequency band increases and the amplitude of the low-frequency band decreases. EEG signals reflect the activity state of the brain. The state of the oceanaut’s mental burden may be indicated by variations in the amplitude of each frequency band of EEG activity.
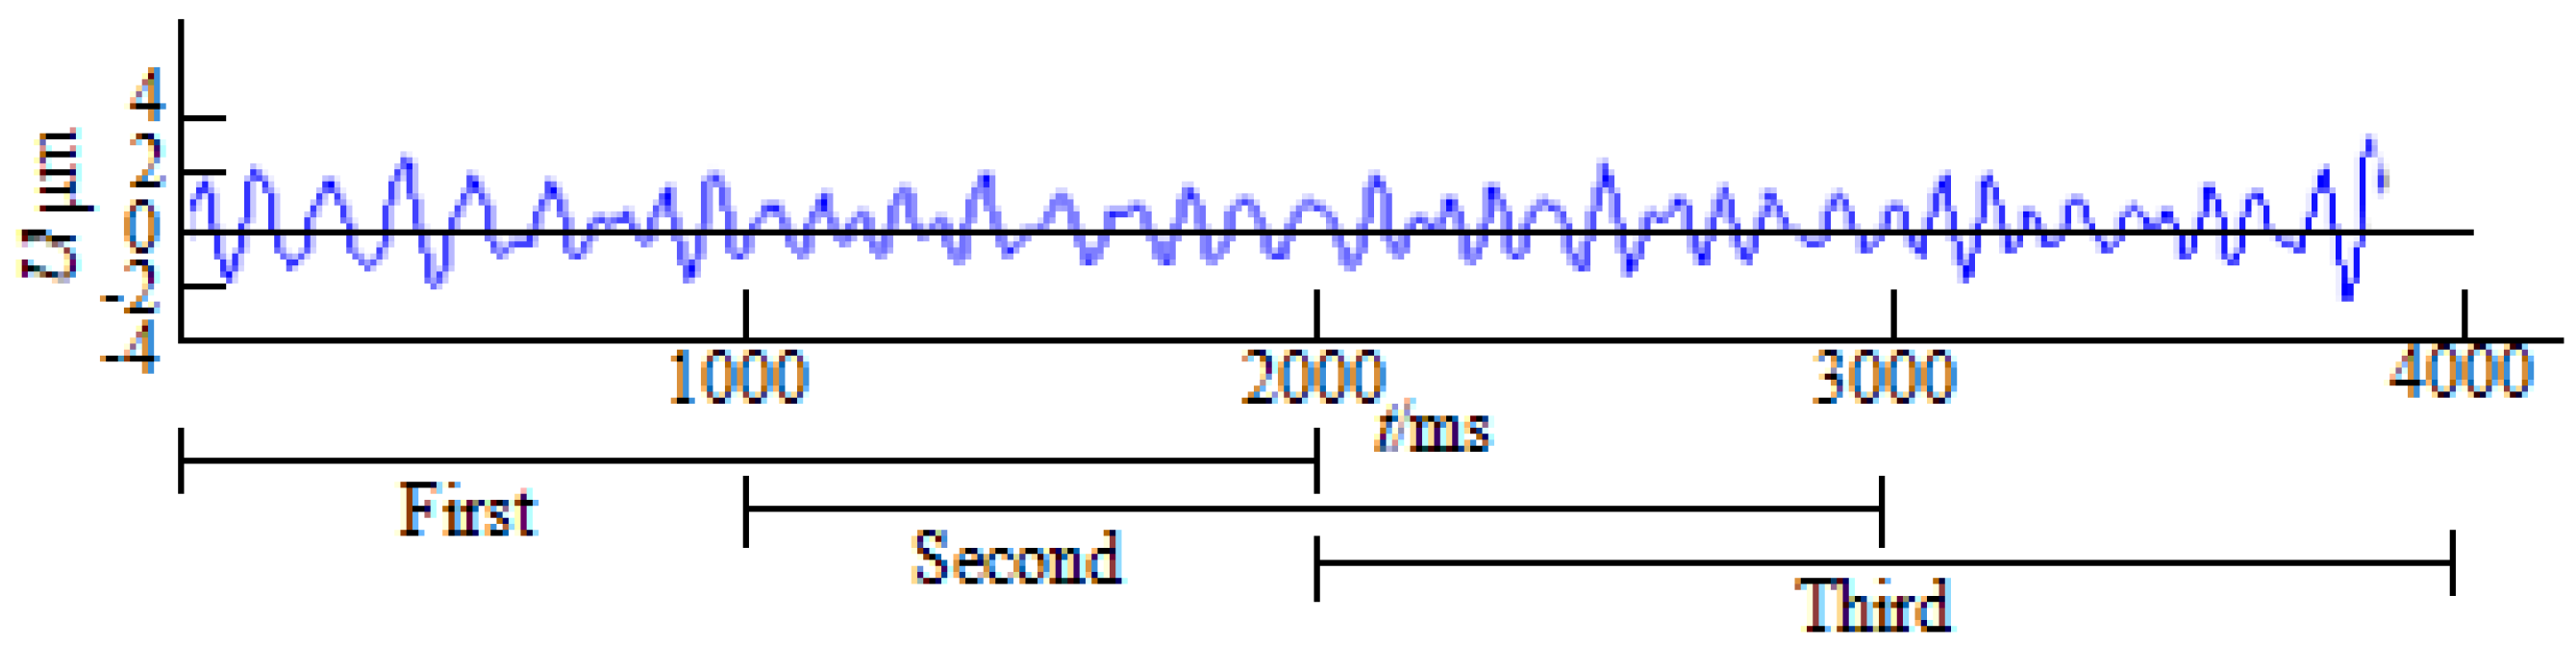
EEG Signal Processing: The EEG signals were filtered using a 0.5–35 Hz bandpass digital filter, and the data were segmented into 2 s epochs with 50% overlap (1024 points per epoch). The ocular artifact rejection method [
27] was used to automatically eliminate the eye blink artifacts, and the remaining epochs were manually rejected (see
Figure 1).
where
, and
n is the sample size of EEG signal.
Delta (0.5–4 Hz), Theta (4–7 Hz), Alpha (7–13 Hz), and Beta (13–30 Hz) are the four types of wave amplitude sequences extracted from f[k]. The amplitude of the four bands in one time window was obtained; this average value was then used as the representative value of the frequency band across fifty-nine time windows. Similarly, the EEG signals of the electrodes were all processed using the abovementioned method; then, the corresponding EEG parameters were obtained, denoted as .
3. Methodology
3.1. Support Vector Machine
An SVM training method [
28,
29,
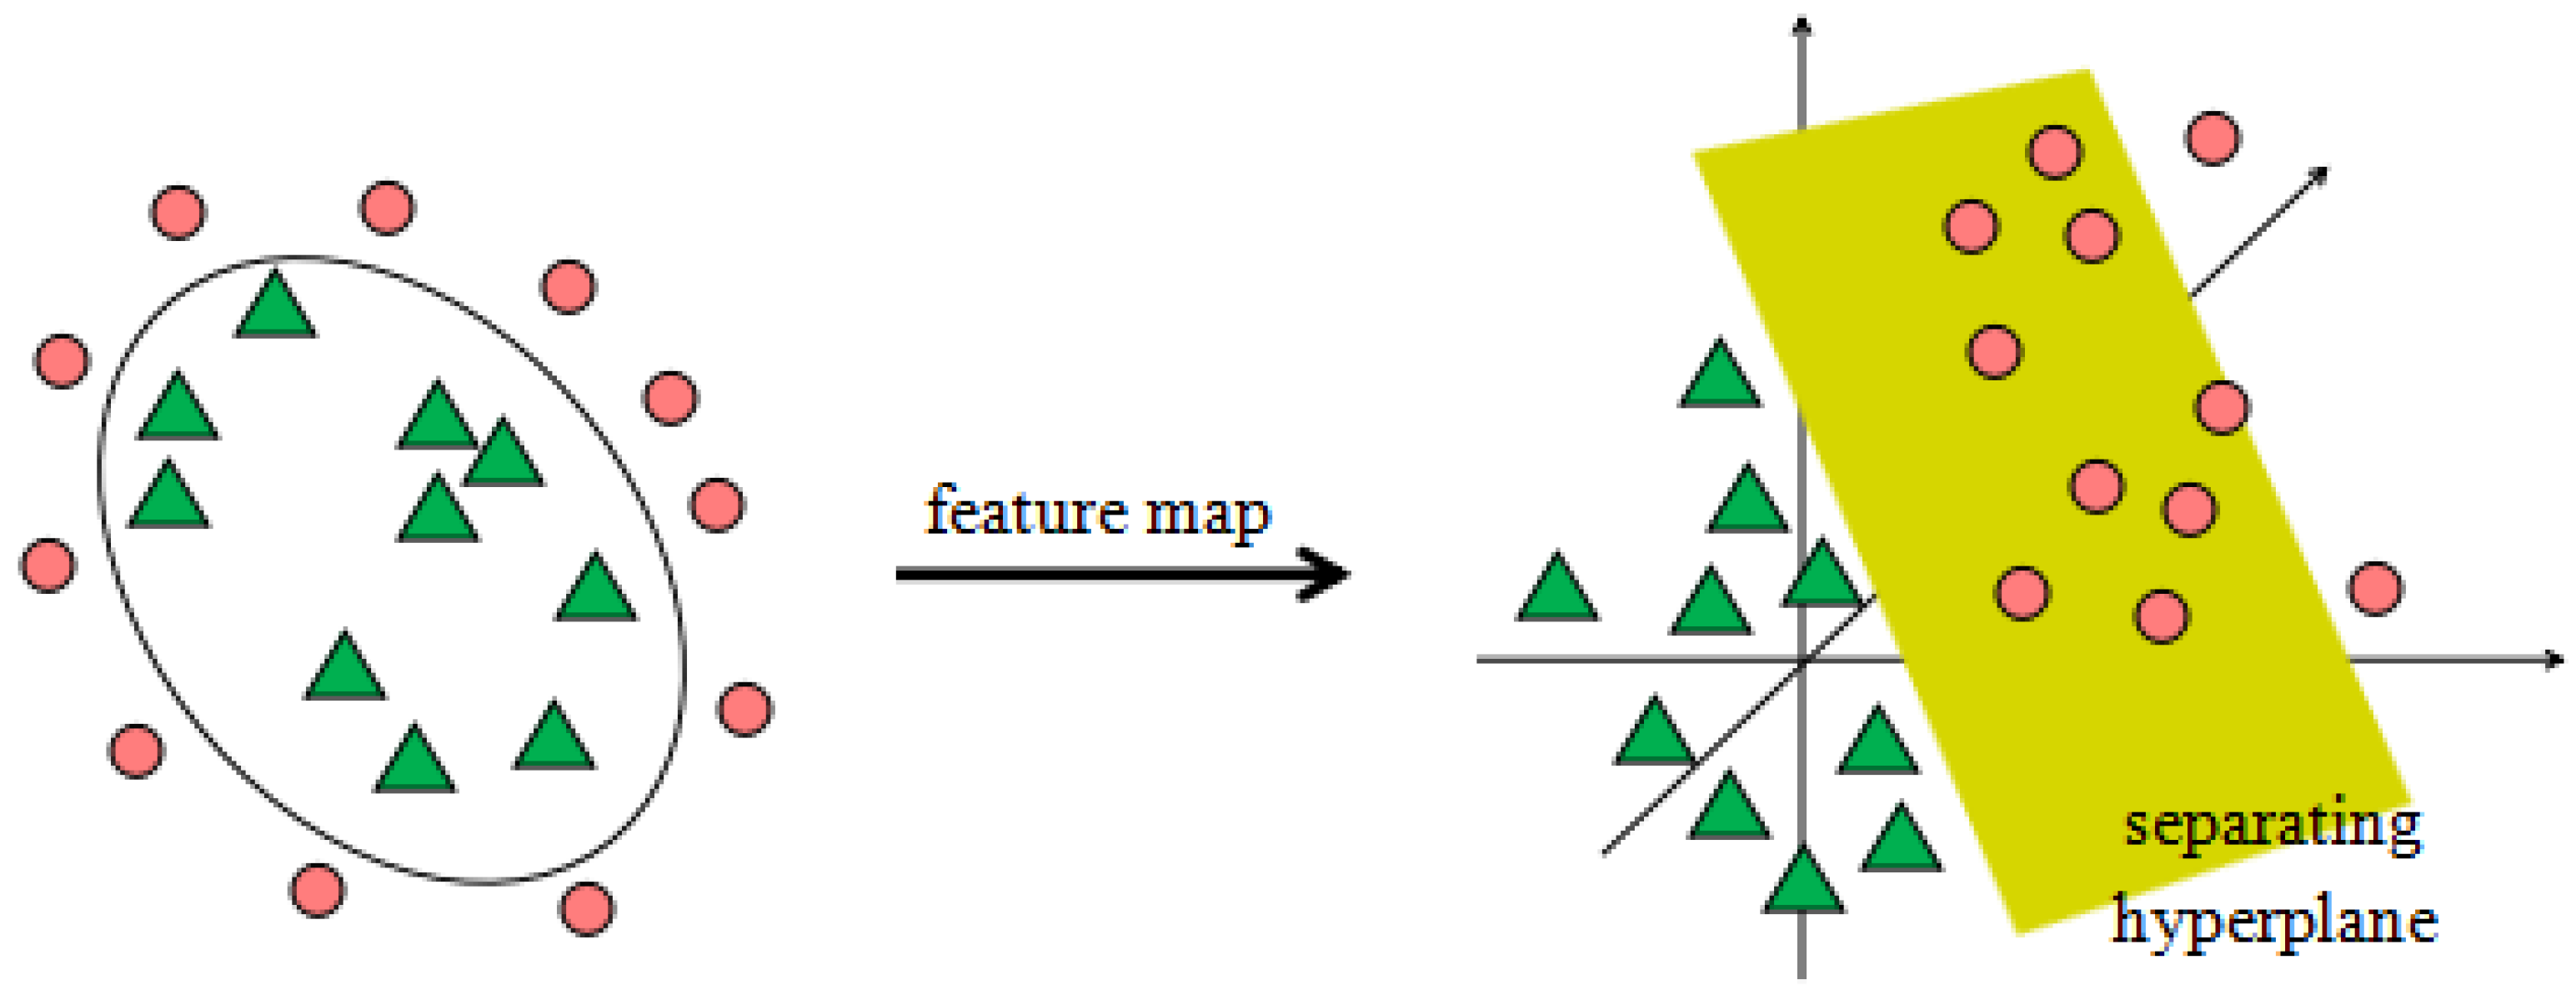
30] creates a model that categorizes fresh instances according to one of two categories given a series of training examples that have each been tagged as belonging to one of the categories. This makes the algorithm a non-probabilistic binary linear classifier. An SVM model is a mapping of the instances as points in space with as much space between the examples of the various categories as feasible. Then, depending on which side of the gap they fall, new samples are projected into that same area and are predicted to belong to a category [
31,
32,
33]. A linearly separable problem is shown in
Figure 2.
Given sample set , where is the input vector, , m is the sample number.
The input data are mapped from the original space to high-dimensional feature space via the nonlinear mapping function, and the optimal classification hyperplane is constructed in high-dimensional feature space.
where
is the normal vector to the hyperplane and
is the offset vector of the classification hyperplane. To ensure the accuracy of the classification, the slack variable is introduced. Then, the optimization problem can be expressed as:
where
is the slack variable and
C is the penalty factor.
Introducing kernel function
,
is satisfied with Mercer conditions, and the original problem of solving the optimal hyperplane is transformed into solving the quadratic optimization problem.
The constraint condition is:
Then, the decision function can be written as:
3.2. Multiclass Support Vector Machines
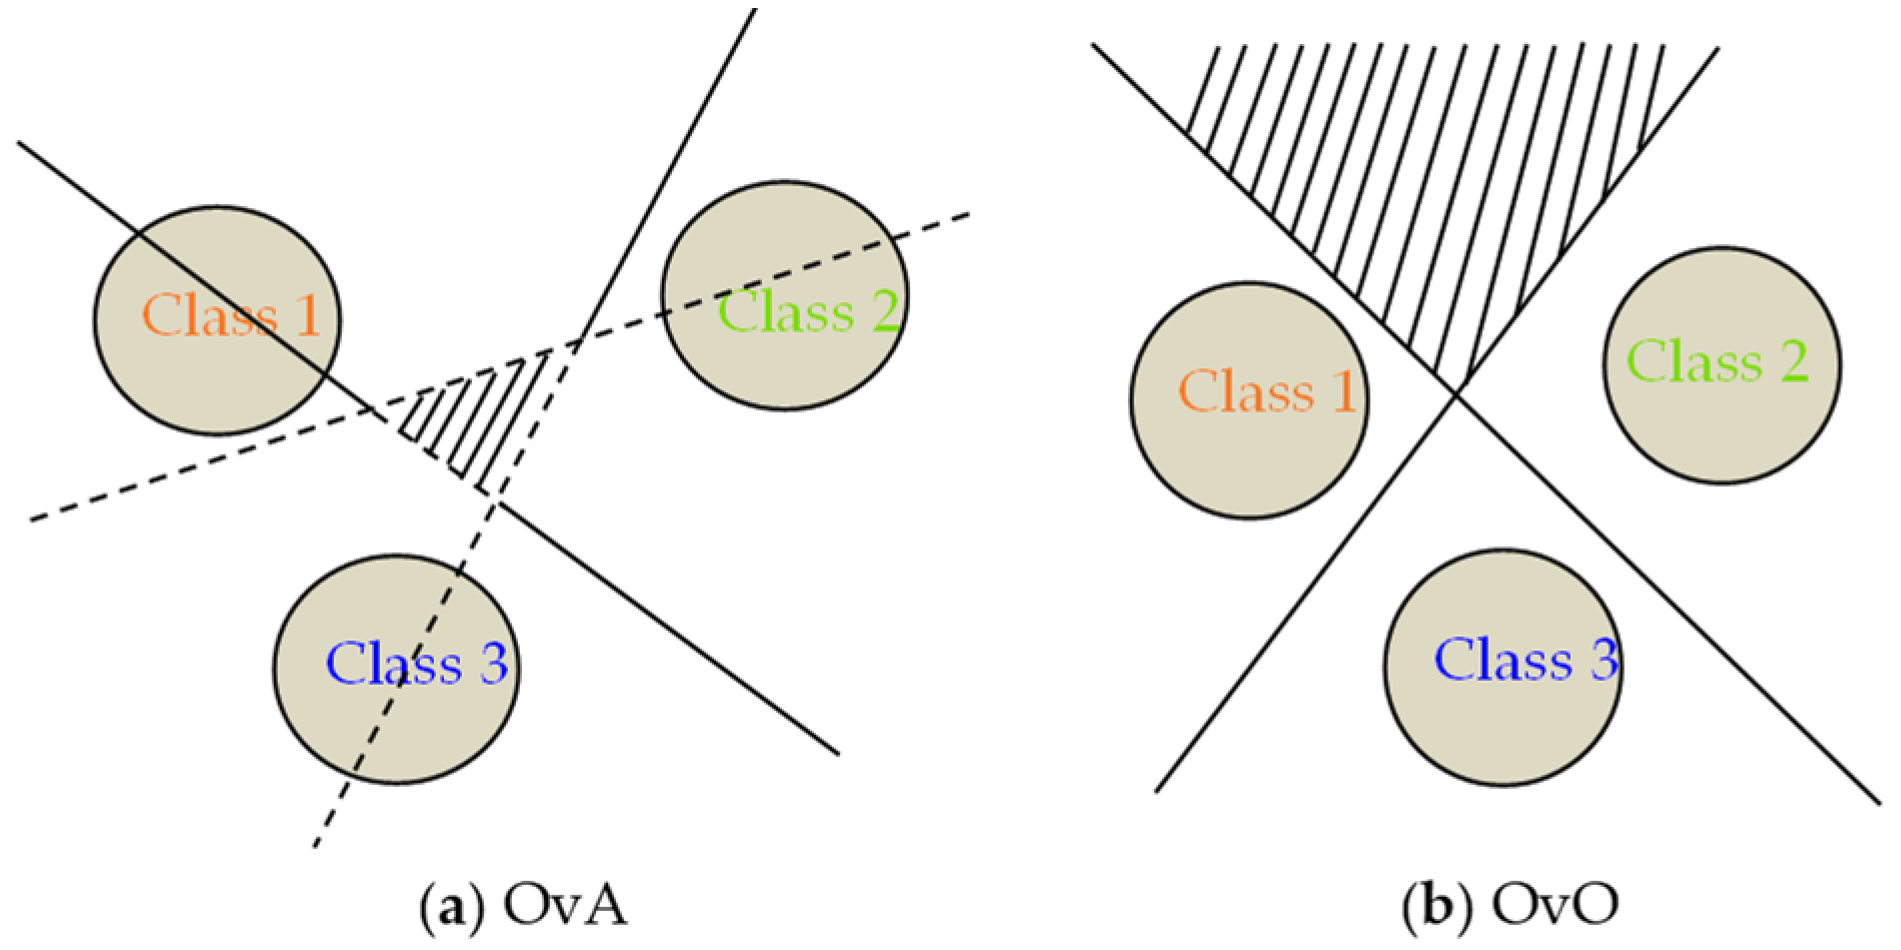
The SVM was initially intended to be a binary classifier. In the literature, one-versus-one (OvO) and one-versus-all (OvA) are the most popular multiclass approaches [
34]. By building N binary classifiers using the OvA technique, each classifier is trained to differentiate between two of the N possible classes. In this method, a single classifier is trained for each class, with the samples belonging to that class serving as positive samples and the others serving as negative samples. The unknown sample is then categorized as the sample with the highest classification function value. For an N-way multiclass issue, the OvO builds binary classifiers that are
N(N-1)/2 in size. Each classifier must learn to differentiate between the positive and negative classifications after being trained on two classes of data. At prediction time, a voting procedure is used: all
N(N-1)/2 classifiers are applied to an unseen sample, and the combined classifier predicts the class that received the most “+1” predictions. Graphical representations of OvA binarization and OvO binarization are shown in
Figure 3a,b, respectively. Typically, OvO outperforms OvA in terms of categorization accuracy. OvO is utilized in this context to identify mental strain.
3.3. Kernel Function Parameter Optimization Based on Quantum Genetic Algorithm
3.3.1. Procedure Description
Although the final classification accuracy is significantly influenced by the choice of kernel function parameter, no comprehensive theory to address the issue has yet been developed. The algorithm of swarm intelligent optimization is used to choose kernel parameters. The best kernel function parameters, like GA and PSO, are adaptively chosen by the swarm intelligence algorithm by using its superior optimization capabilities. Although PSO also has certain drawbacks, such as weak local optimization capabilities, GA has the problems of sluggish convergence and easy local optimum trapping [
32,
33]. A novel method called QGA combines classical GA with the probability and workings of quantum computing. Chromosome representation in QGA is carried out using quantum bit coding, and the evolutionary search is finished using the quantum gate function and updates. Fast convergence speed, powerful global optimization, and a small population size without hurting algorithm performance are some of its characteristics. As a result, the QGA technique is utilized to adaptively choose the best kernel parameters [
35,
36]. The specific steps of kernel parameter optimization are as follows:
The kernel parameters are seen as a chromosome by QGA in step 1. The first population is created by generating N chromosomes at random and encoding the kernel parameters using quantum bits.
where
represents the
i individual of the population that evolved to the t generation.
One of the quantum bits is represented as:
, satisfying the normalization condition:
Step 2 entails measuring each member of the original population Q(t) in binary and transforming it into a population P(t) made up of binary strings of length m.
Step 3 is to evaluate the population P(t)’s fitness. The kernel function is changed to accommodate each kernel parameter value, and the MSVM is then used to categorize the tested data set and assess the fitness. The values of the kernel parameters and the corresponding fitness under the current optimal fitness (optimum classification accuracy) are kept, i.e., the current ideal person.
Step 4.
Q(t) is updated to create a fresh population using the quantum gate operation. Choosing a quantum rotating gate directs the program to look in the right place for the best answer. The quantum rotating gate’s updating procedure is as follows:
is the quantum revolving gate; it is expressed as follows:
is the rotation angle; its size and direction are determined by the rotation angle adjustment strategy.
Step 5. Let the evolution algebra be t = t + 1 and return to step 3 to continue.
Step 6. Output the optimal parameters and test the test data with the optimal parameters.
3.3.2. Key Parameter Setting
Some important algorithmic parameters, such as the following ones, need to be initialized before utilizing QGA to achieve the best MSVM kernel function settings. For the initialization population, each in is initialized to , and all states of a chromosome are superimposed with the same probability at the time of initial evolution.
For the fitness function, the purpose of using QGA to optimize MSVM is to obtain the optimal classification accuracy. Therefore, the accuracy of classification is selected as the fitness function in the parameters of the QGA optimization kernel function.
where
is the final classification accuracy of MSVM.
For the quantum spinning gate’s angle, a general adjustment method is used to alter the value of the rotation angle since it impacts how quickly the optimization algorithm converges [
37,
38,
39]. The data table of rotation angle adjustment is shown in
Table 1. For the algorithm’s final condition, the optimization procedure for the kernel parameter ends when the maximum number of iterations exceeds the original set algebra or when the absolute value of the difference between the best fitness (classification accuracy) for 10 successive generations is less than 0.001.
3.3.3. Simulation Analysis
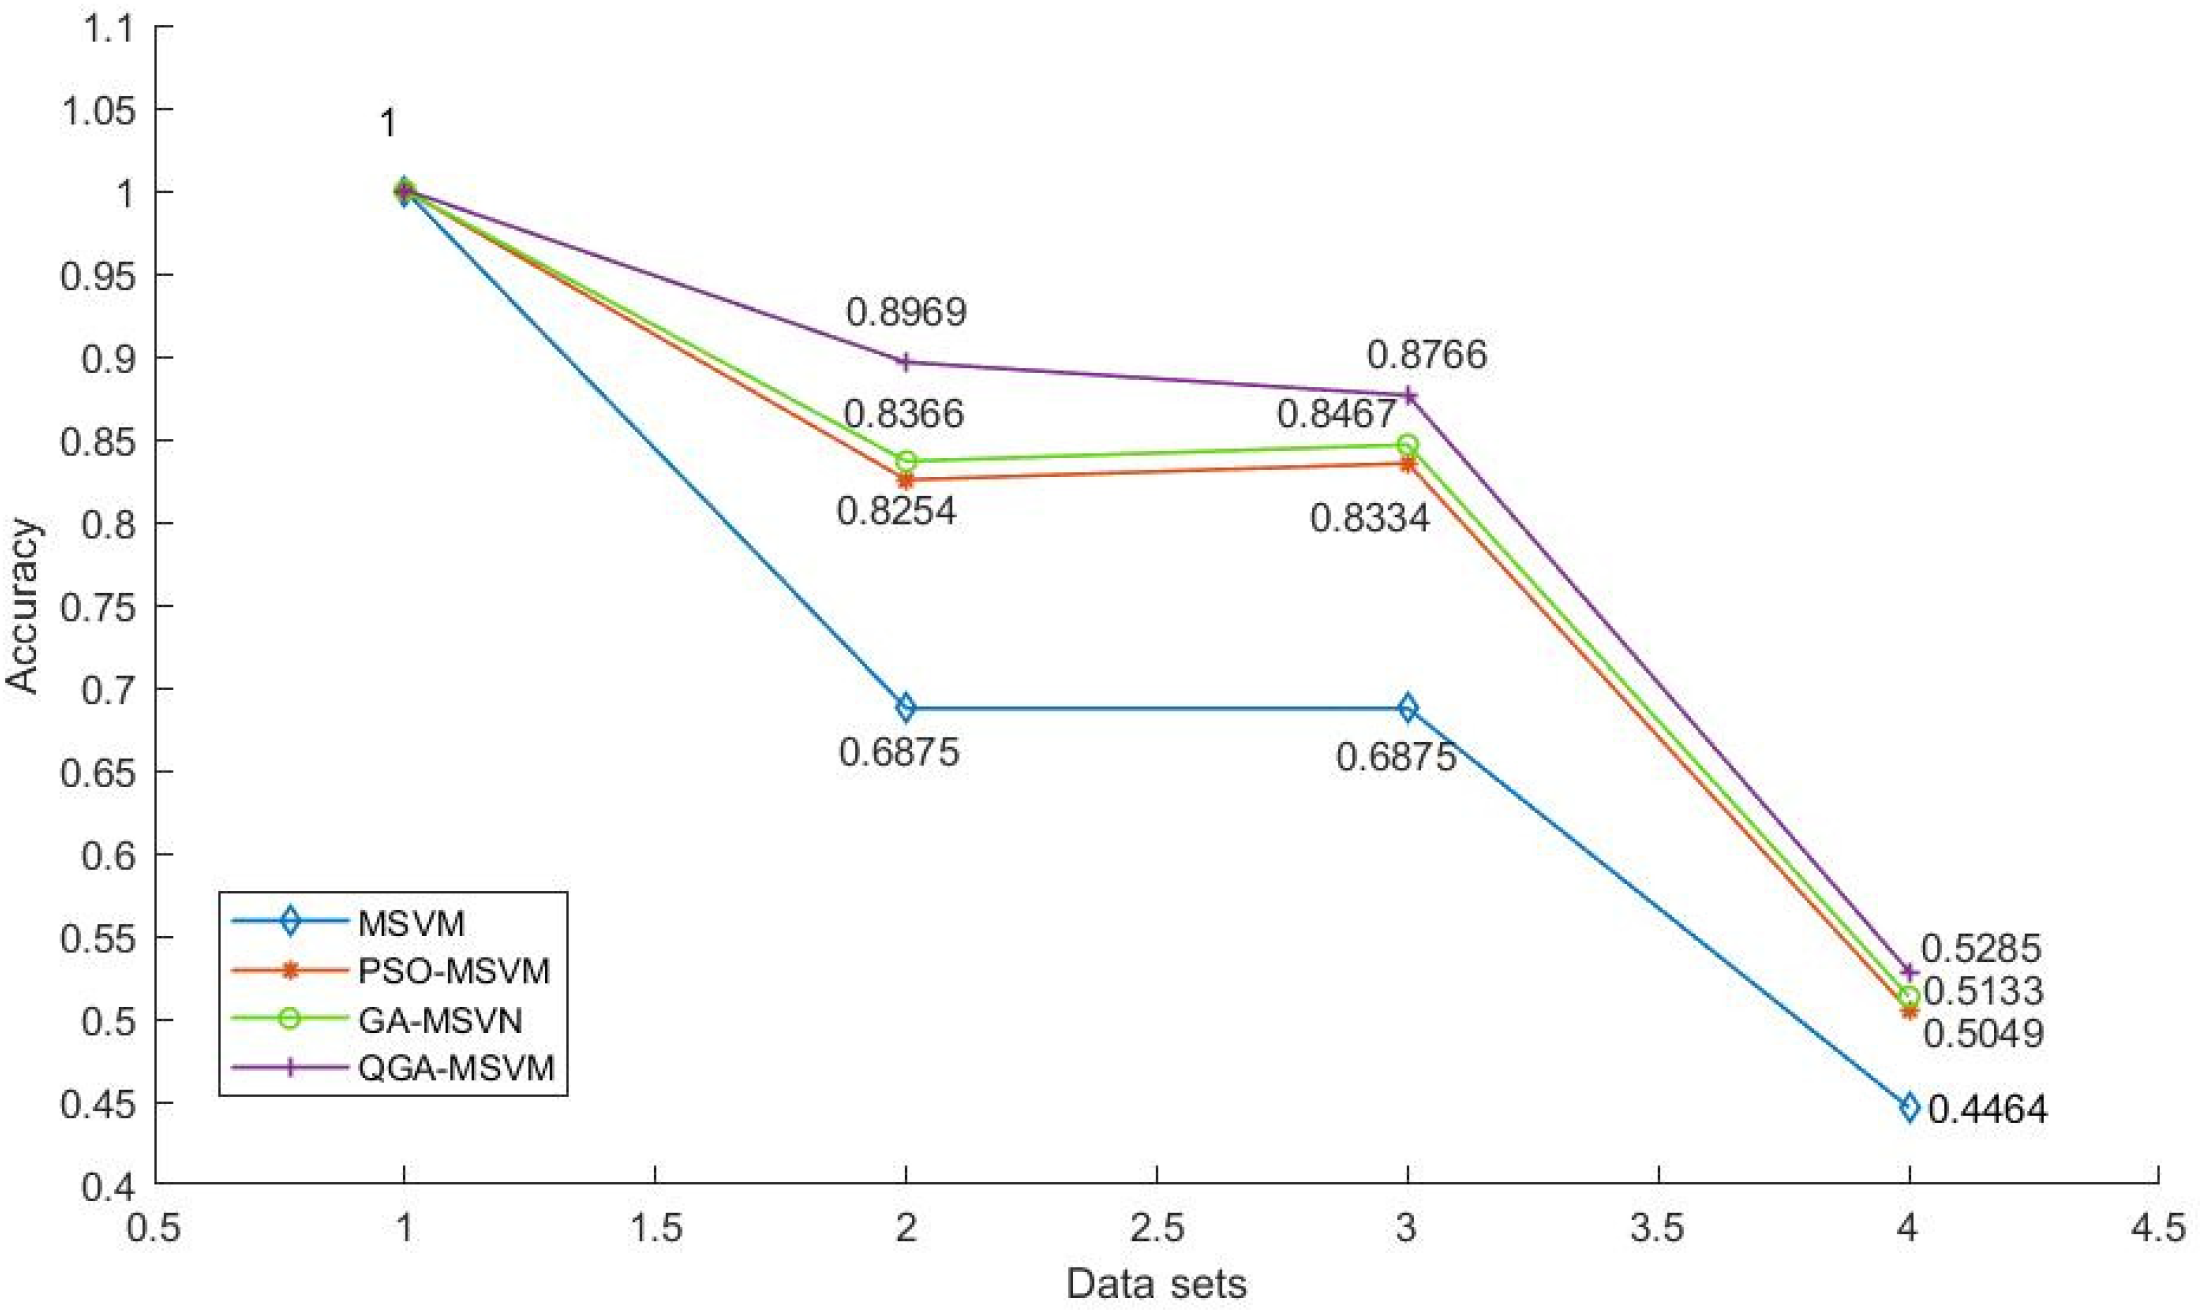
Four standard data sets from the UCI standard database—wine, iris, appendicitis, and glass—were chosen as experimental data in order to assess the efficacy of QGA in the optimization of MSVM kernel parameters. The experimental data were categorized using QGA, GA, and PSO, respectively. The quantity of samples, dimensions, and categories for the four-test data in the UCI data sets are shown in
Table 2.
The average classification accuracy after 50 classification simulations of four test data from the UCI data sets is shown in
Figure 4.
Figure 4 shows the accuracy of the MSVM classification optimized by the three distinct methods for the four test data sets of wine, iris, appendicitis, and glass. While GA-MSVM and PSO-MSVM have varying test results for various types of data, QGA-MSVM has the greatest average classification accuracy. This result showed that, while the GA and PSO algorithms have some issues, such as kernel function parameter values falling into the local optimum, premature convergence, which do not converge to the optimal kernel parameter value, the QGA algorithm can adaptively select the best kernel function parameters each and every time during the testing process.
4. Experimental Method
4.1. Participants
Eight healthy people (eight men, mean age 24.8 ± 1.8 years, average height 171.8 ± 6.7 cm, middleweight 651 ± 0.4 kg) took part in our research. All individuals had normal or corrected-to-normal eyesight and were right-handed. None of them had a history of neurological or mental illnesses [
40,
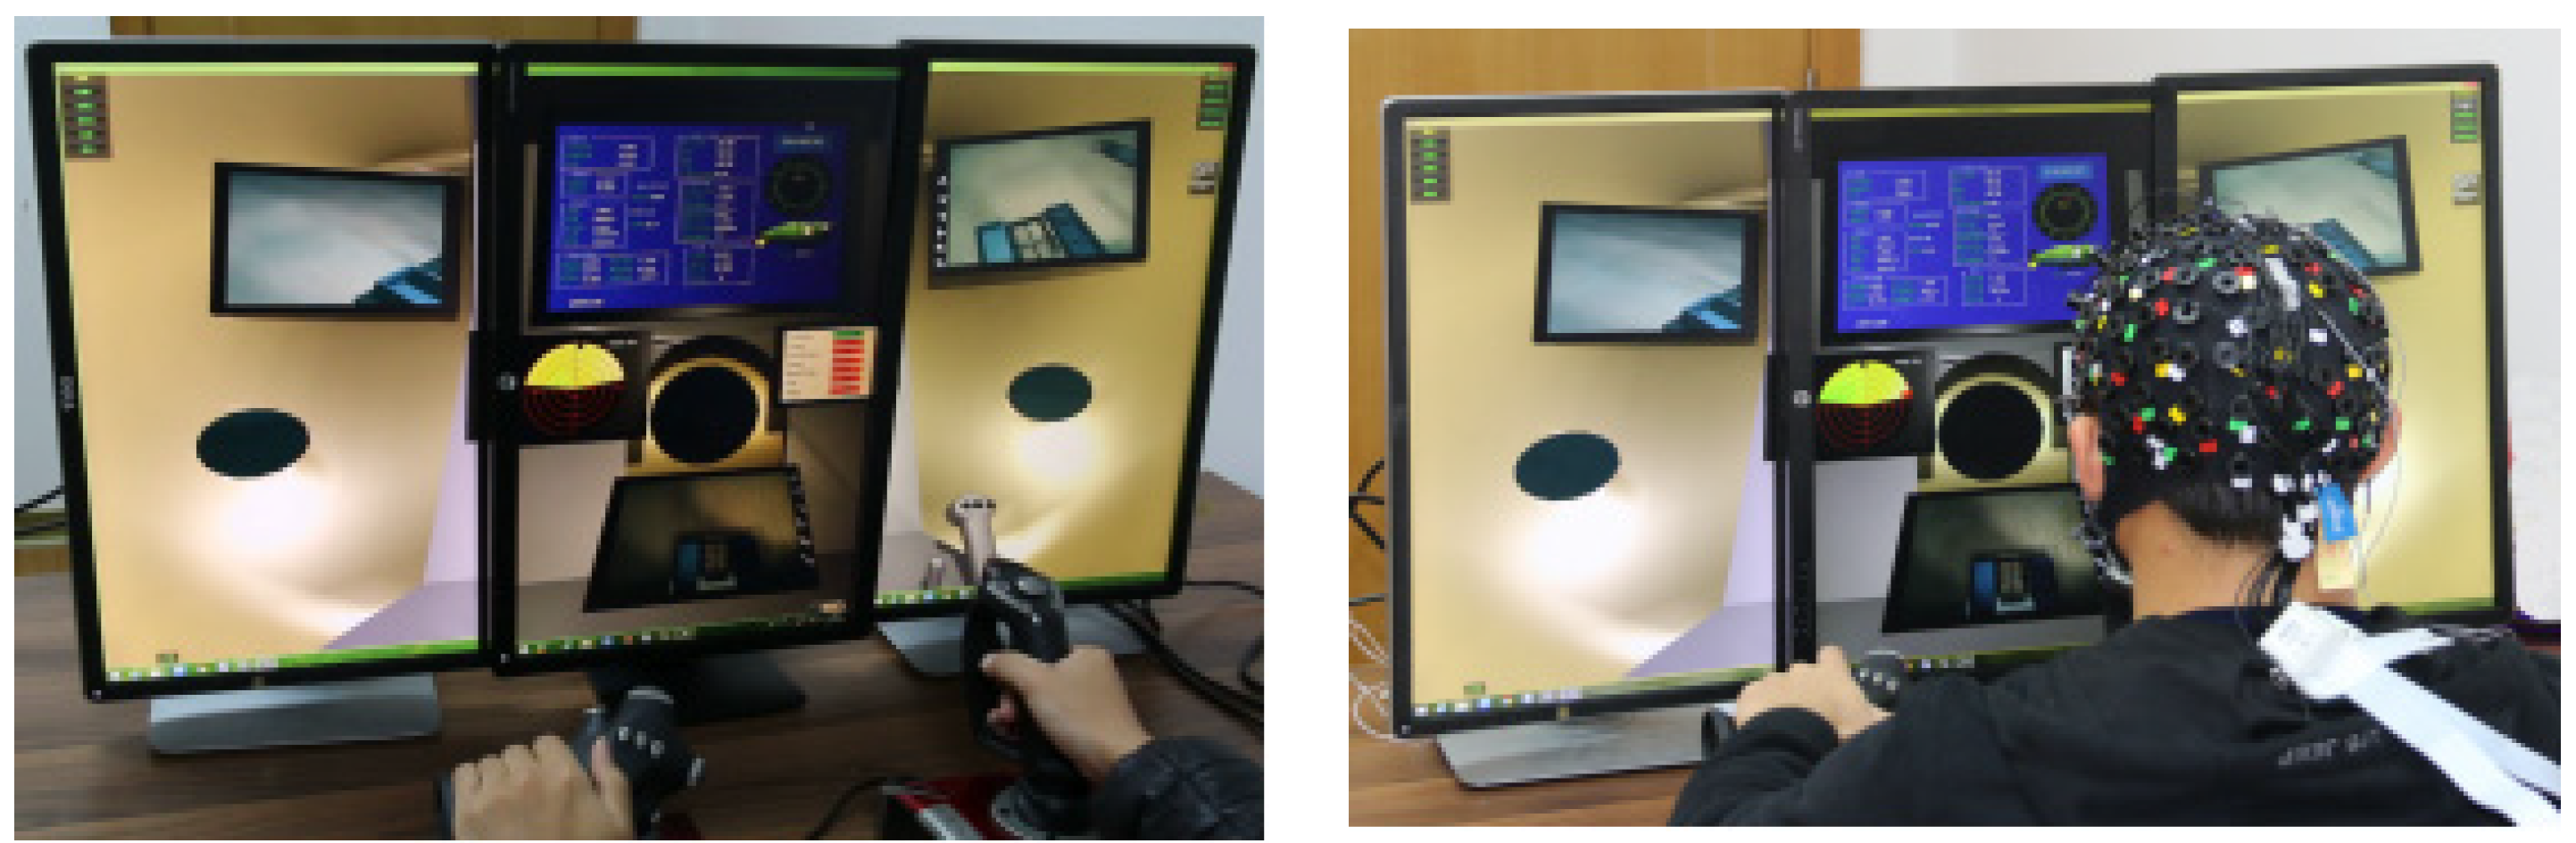
41]. In the experiment, the Ag-AgCI disc-like electrode was applied using Neuroscan, and the EEG data were recorded using the worldwide standard 10–20 system electrode insertion technique. The sampling rate was 1000 hertz (Hz). The potential change on the scalp during the measurement traveled via the wire from the electrode to the electroencephalograph through the conductive paste. The electrode put on the body, such as the earlobe, served as the reference electrode. The working electrode placed on the scalp served as the working electrode, and the difference value between the working electrode and the reference electrode was the final EEG signal that was recorded (see
Figure 5).
4.2. Design of the Task
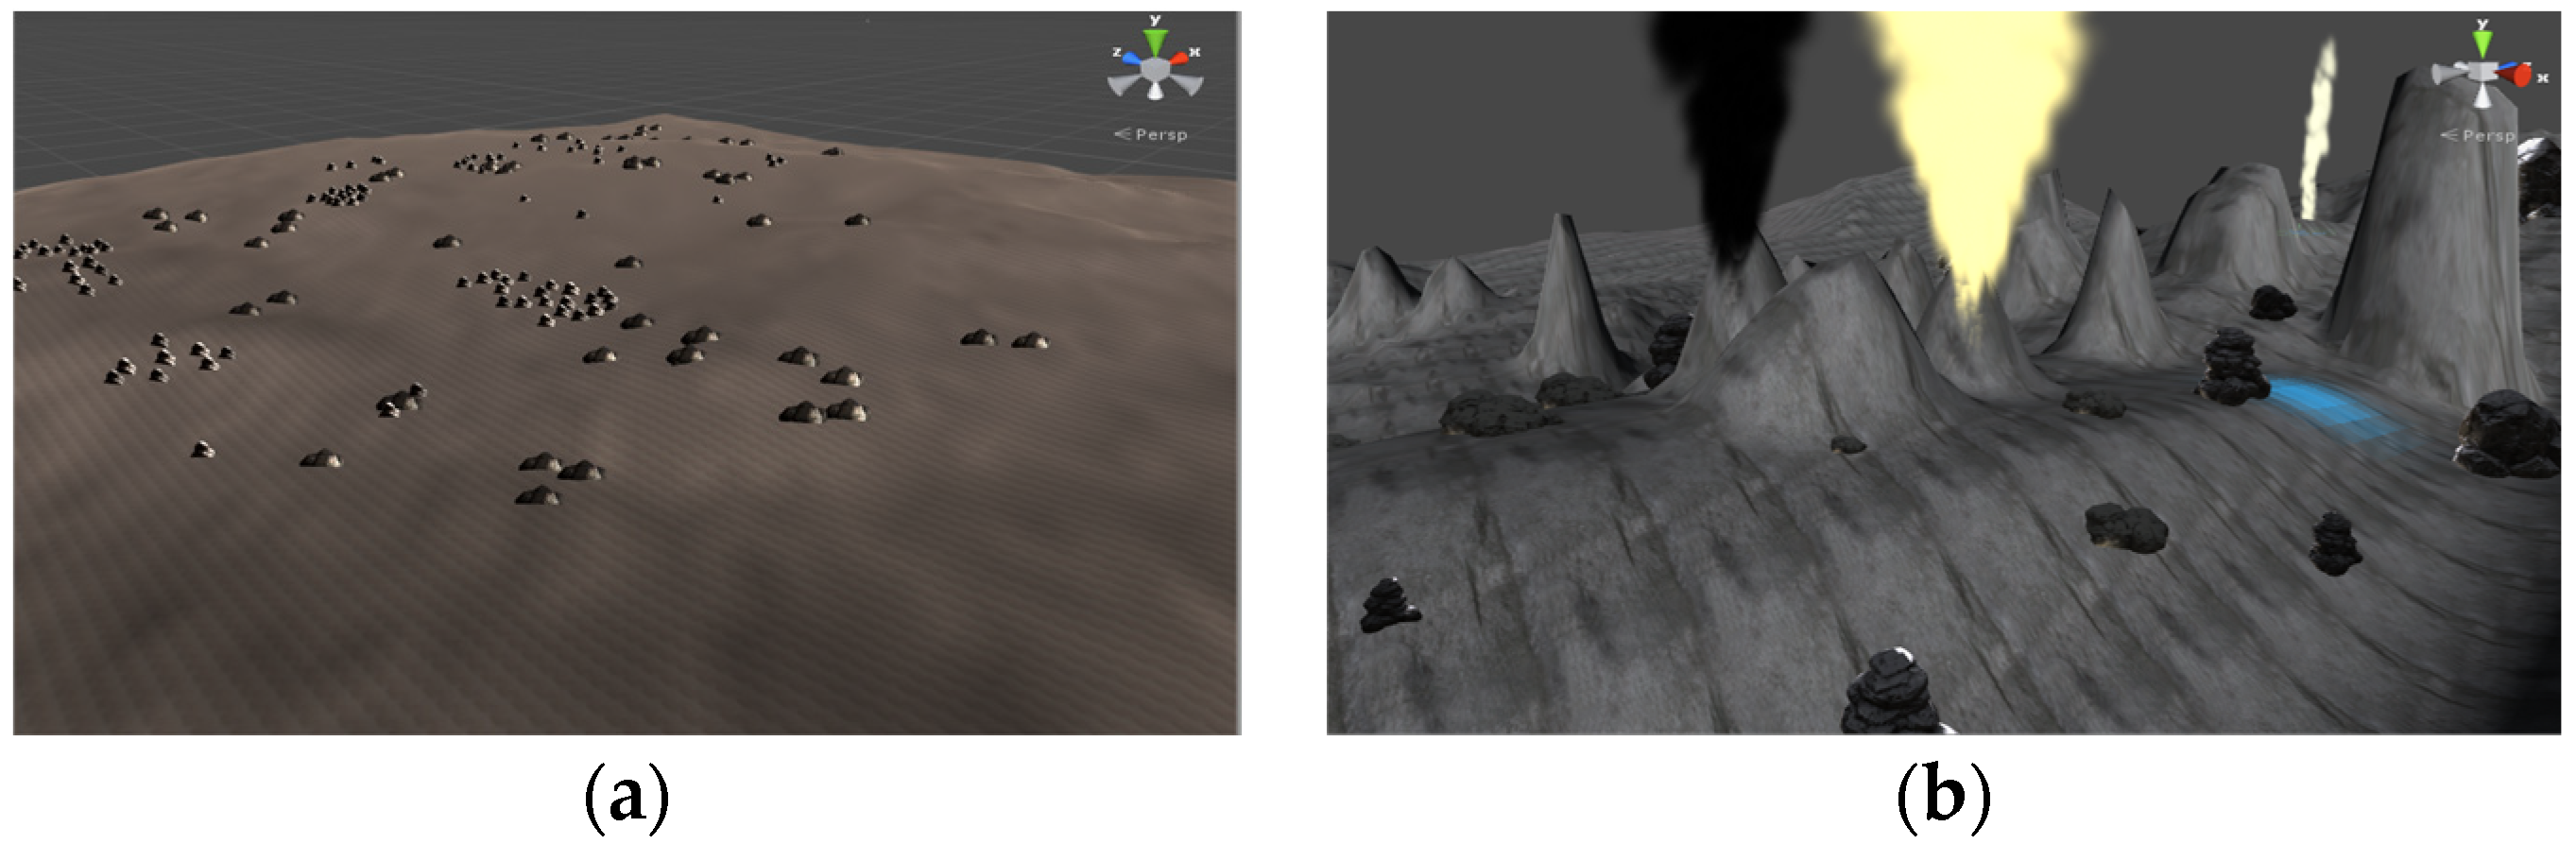
Driving duties were split up into three separate scenarios throughout the experiment: the sea basin region, the seamounts area, and the hydrothermal area. The hydrothermal region requires additional hydrothermal vents and other impediments since the landscape there is hilly with significant changes, unlike the sea basin area, which has a relatively level plain topography (see
Figure 6).
Participants had to operate the submersible to avoid obstacles, arrive at the stated location within the allotted time, and attempt to maintain a height above the ground between 2 and 6 m. On the imaging sonar, the target’s position was dynamically presented. The mission was completed when the indicated site was reached or after the allotted three minutes. On the first day, the fifth day, and the tenth day, the same exam was given to each participant three times.
Figure 7 depicts the experiment platform for the driving operation task.
According to subjective assessments of the mental burden, task complexity levels were categorized into three groups. The mental effort levels of the three conditions were created using the three-task experiment. Driving in the sea basin region has a low workload, driving near seamounts takes medium effort, and driving near hydrothermal areas has a high workload.
5. Results and Discussion
EEG physiological data were obtained and evaluated for this investigation. Various EEG workload indicators may be used to diagnose various elements of a participant’s cognitive–energetic status. As a result, in order to employ EEG indices for assessing operator state, it is necessary to understand what each indicator means in connection to the relevant task. Before EEG indices may be routinely used for applications, the further investigation of the fluctuation of diagnosticity with task demands is required (see
Table 3).
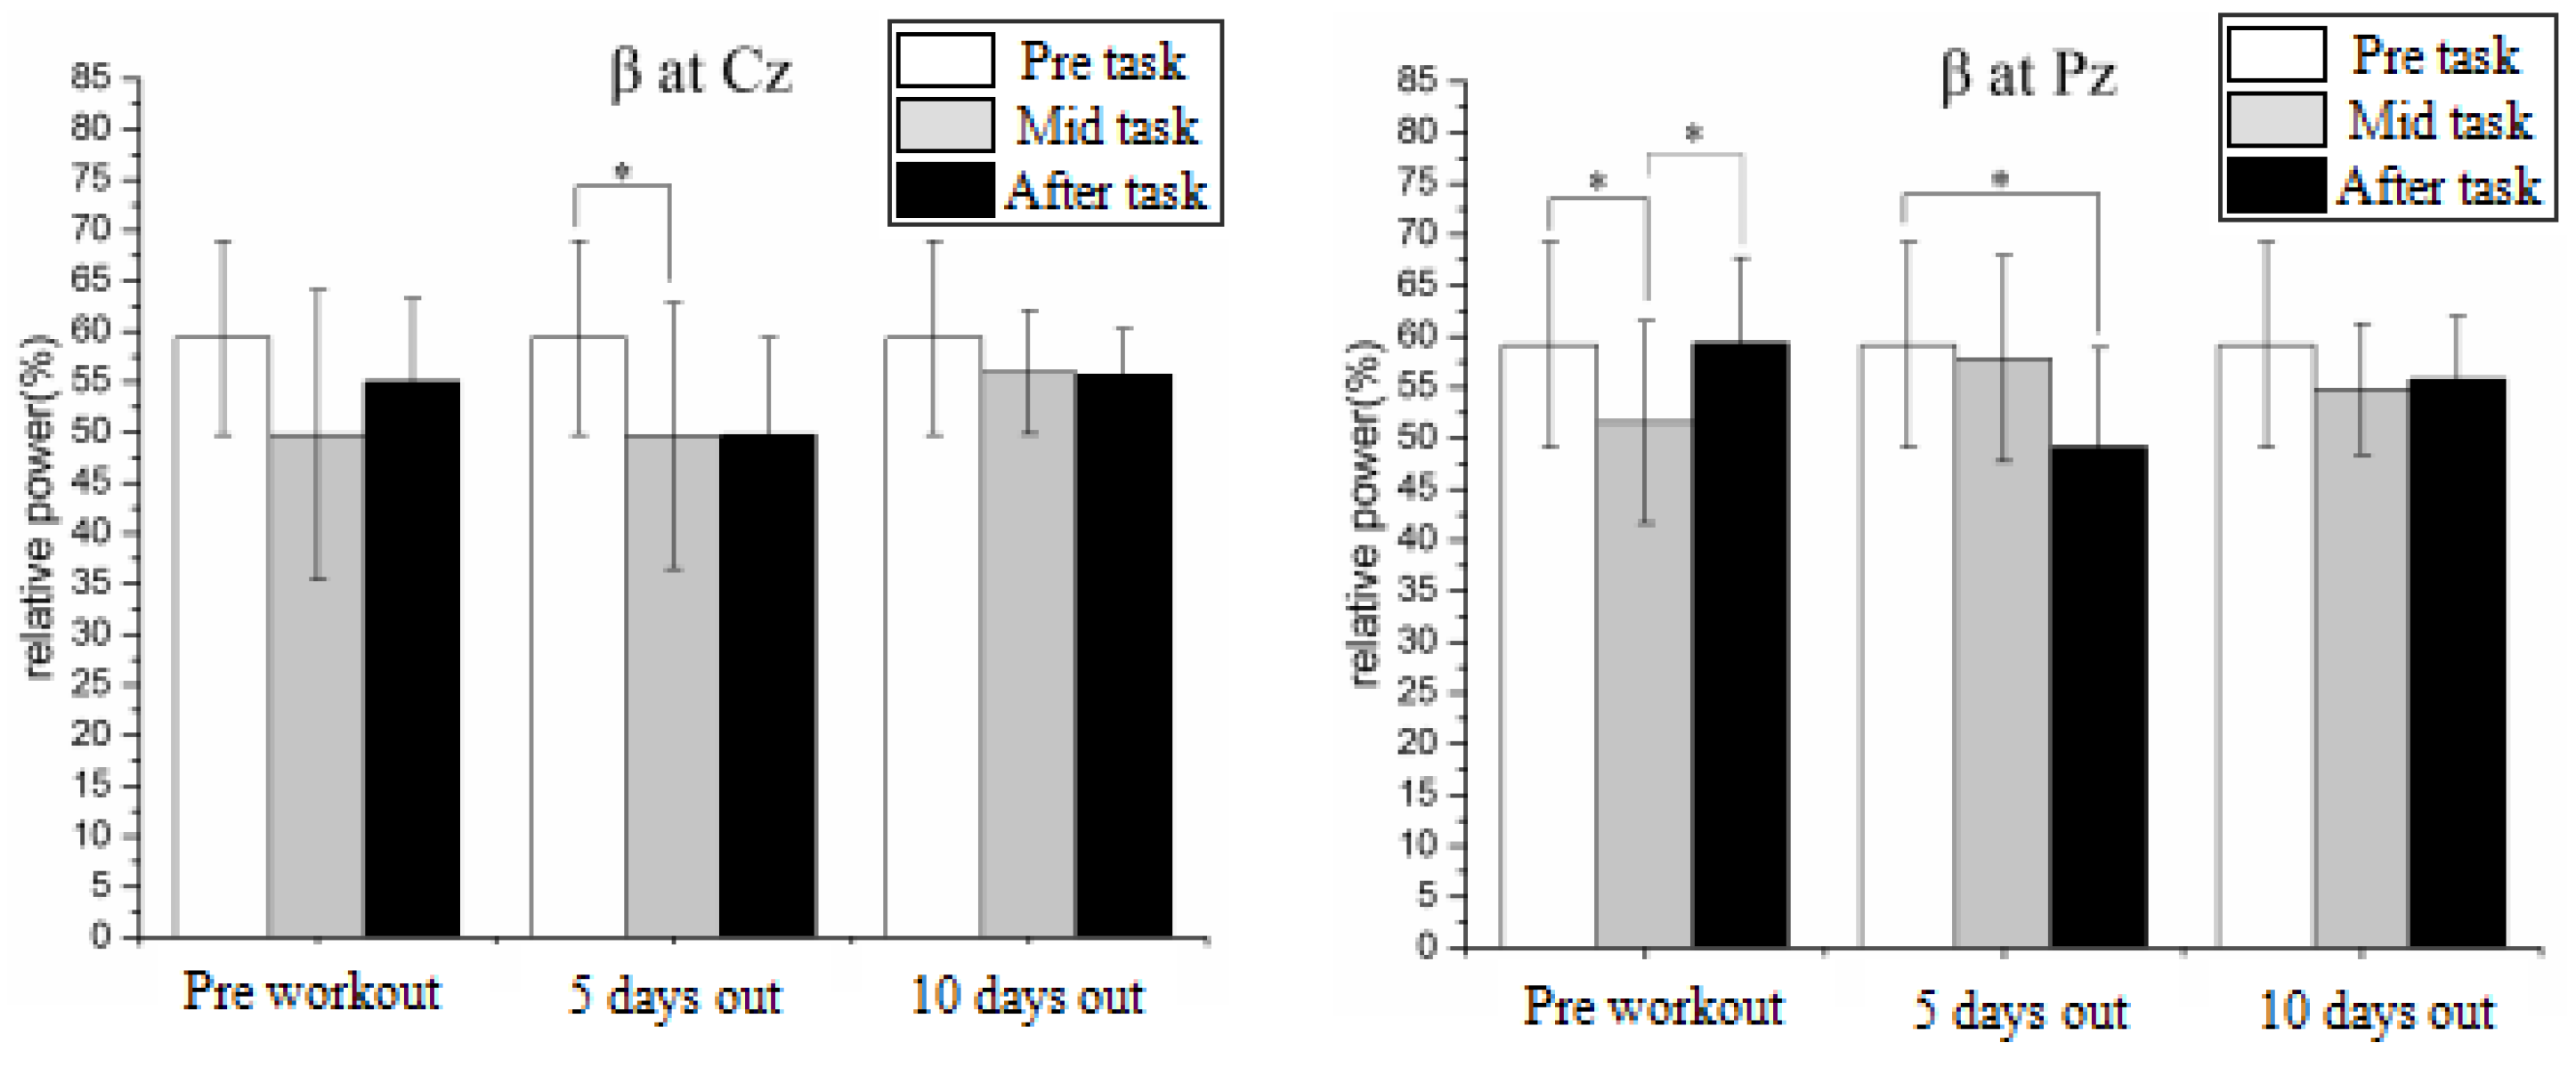
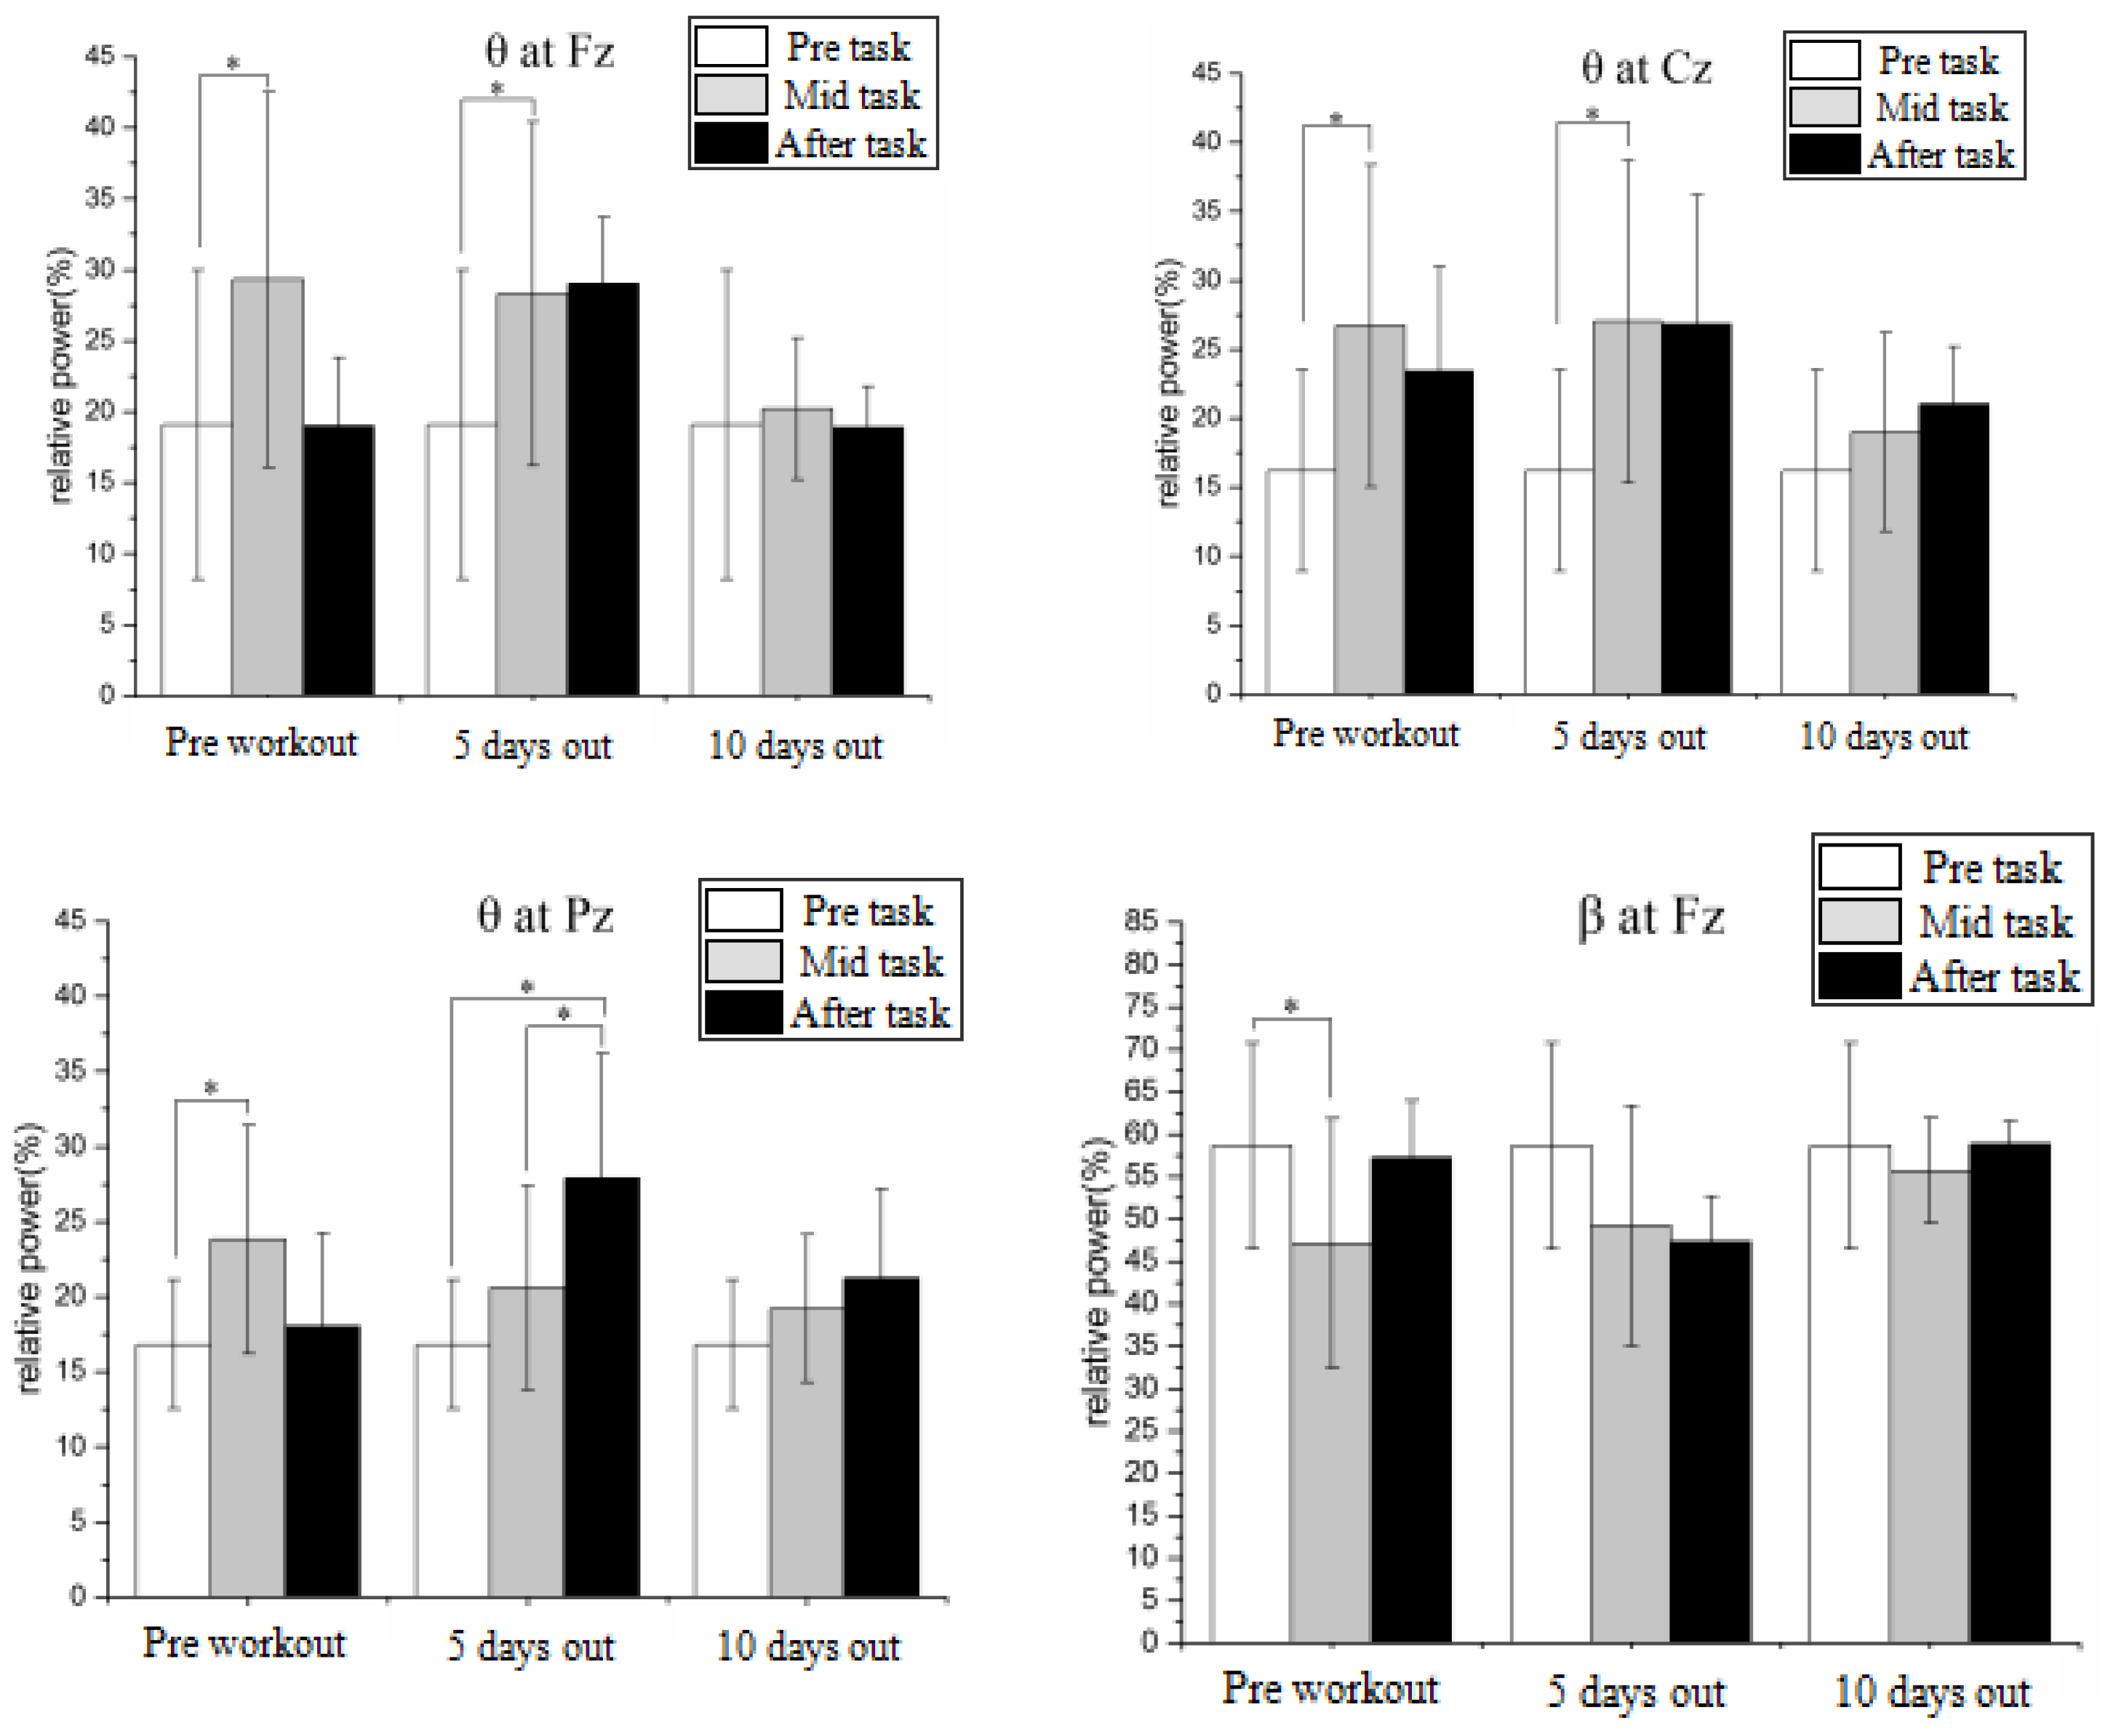
Physiological index changes were measured before, during, and after the simulated operation.
There is a statistically significant increase in the relative power of the wave of Fz in the operation compared to both pre- and post-training levels (
p < 0.05), an increase in the relative power of the wave of Cz and Pz compared to pre-training levels (
p < 0.05), and a statistically significant decrease in the power of the wave of Fz and Pz compared to pre-training levels (
p < 0.05). The strength of the wave of Cz is substantially lower than before the surgery after 5 days of training (
p < 0.05), whereas the waves of Fz and Cz are both significantly greater. After the operation, the relative power of the Pz wave is much greater than it was before, and during the operation (
p < 0.05), the relative power of the wave is significantly higher than it was before. None of these modifications took place after 10 days of training. With the help of the aforementioned analysis, we could classify the mental burden of oceanauts using the EEG after five days of training. We then chose the training and test data and used KNN, BP, Random Forest, SVM, and QGA-MSVM (see
Figure 8).
Table 4 makes clear that there are obvious individual variances among the eight patients. KNN has the greatest classification accuracy (73.6%), BP has the highest classification accuracy (80.2%), RF has the best classification accuracy (75.9%), and SVM has the highest classification accuracy (73.6%). The average classification accuracy for each model is SVM > BP > RF > KNN, with a classification accuracy rate of 79.6%. The SVM classification impact is superior in terms of accuracy rate. Even if the SVM classification model’s classification has improved, the average accuracy still needs to be raised. The penalty parameter C and the kernel width g have a major role in the success of the SVM algorithm. The proper C and g values are difficult to predict in advance. The findings show that the QGA-MSVM model’s recognition accuracy is much better than that of KNN, BP, RF, and SVM; the model’s average accuracy is 91.8%. As a result, the QGA-MSVM model is better suited for identifying mental burden based on the data presented above.
6. Conclusions
This research proposes a QGA-based technique for MSVM kernel function parameter optimization. QGA adaptively selects the best kernel parameters because of its great global search capability, variety of population, quick convergence speed, and quick parallel processing time. The simulation results demonstrate that the performance of QGA-MSVM is superior to that of PSO and GA using the four data sets from the UCI standard data set as measured data. Statistics were used to analyze EEG data from driving simulation operating experiments conducted in sea basin, seamount, and hydrothermal areas. After 5 days of training, EEG data were chosen, and QGA-MSVM was used to determine the mental burden of oceanauts. The findings demonstrate that the QGA-MSVM algorithm is capable of accurately detecting the oceanauts’ mental workload while they are operating a vehicle. The average accuracy of the QGA-MSVM model is 91.8%, and it serves as a foundation for an intelligent evaluation of the oceanauts’ mental workload.
In addition to navigating past hazards and risky locations when diving, oceanauts must also use complicated equipment within the manned compartment to carry out duties like setting up markers and collecting sediment and water samples. Oceanauts must also perform diving activities, create and modify dive plans depending on the topography of the seabed, and continuously check system status.
During deep diving missions lasting more than 10 hours, Oceanauts dive many kilometers down in a cramped and small workspace inside the manned compartment, necessitating extended hours of observation and unbroken operating. They continue to labor in a very stressful condition, mostly carrying cognitive burdens.
Time constraints, safety concerns (complicated deep-sea topography), environmental considerations (abnormal temperature, vibration, acceleration, or noise), and the difficulty of the jobs all affect how much cognitive work they must do. Their productivity is greatly reduced when the cognitive load is too high or too low, which may result in a variety of operational mistakes, neglect, disorder, physio-logical stress, and even serious safety mishaps.
It is crucial to accurately gauge the cognitive load level of oceanauts in order to minimize human mistakes, ensure diving safety, improve the design of human–machine interfaces, and select and train oceanauts. Additionally, this offers helpful references for the creation of portable oceanauts for the real-time cognitive load monitoring of divers.
Future research will include more thorough physiological data collection from submarine divers during actual diving operations. This study may further our understanding of the physiological, psychological, and cognitive demands placed on submarine divers in real-world operational settings.
The more precise measurement and assessment of the cognitive load of submarine divers in undersea robotic systems may be aided by the creation of an individual database on submarine divers, which can be established; the Submarine Simulator Operating System’s improvement; the use of mechanical arms and submarine motion equations to more accurately calculate their movements; increasing the visual effects’ realism by further optimizing them both inside and outside the submarine’s cabin; and making the simulation operating system more realistic and immersive thanks to VR design. The following are particular ways to improve the cognitive load recognition model: increasing the amount of data and parameters used to quantify cognitive load and train the recognition model; and increasing the precision of load categorization, considering and enhancing more complicated machine learning techniques. Currently, the tasks in the simulated tests do not completely cover all the execution processes since operating and driving mechanical arms is a difficult undertaking. The cognitive burden of operators will vary depending on the work; hence, more difficult tasks need additional research.
7. Contributions
In order to develop a reasonable operation process and to effectively intervene when the mental load of the underwater crew is too small or too large (man–machine function redistribution, the responsibility redistribution of the chief and co-pilot, and task strategy reselection), physiological indicators are used. Preventing occupational illnesses and pilot weariness, safeguarding their physical and mental health, lowering human mistake rates, and enhancing the safety of underwater navigation are all very important aspects.
Author Contributions
Conceptualization, X.L.; methodology, X.L.; investigation, L.S.; resources, C.Y.; data curation, Y.L. and J.W.; writing—original draft preparation, X.L.; writing—review and editing, X.L. All authors have read and agreed to the published version of the manuscript.
Funding
This work was supported by the National Key Research and Development of China “General Design, Construction and Sea trial of Full Ocean Deep Manned Submersible” (2016YFC0300600).
Institutional Review Board Statement
The study does not require ethical approval and I choose to exclude this statement.
Informed Consent Statement
Informed consent has been obtained from all subjects for this study. The paper experiment did not cause any harm to people.
Data Availability Statement
The data that support the findings of this study are available on request fromthe corresponding author The data arenot publicly available due to privacy orethical restrictions.
Conflicts of Interest
The authors declare no conflict of interest.
References
- Miao, F.; Li, Y.; Shi, L. Vital Signs Analysis for Oceanauts in Deep Sea Submerged Environment: A Case Study. Int. Conf. Biomed. Health Inform. 2015, 64, 179–180. [Google Scholar]
- Wilson, G.F. An Analysis of Mental Workload in Pilots During Flight Using Multiple Psychophysiological Measures. Int. J. Aviat. Psychol. 2001, 12, 3–18. [Google Scholar] [CrossRef]
- Recarte, M.A.; Nunes, L.M. Mental workload while driving: Effects on visual search, discrimination, and decision making. J. Exp. Psychol. Appl. 2003, 9, 119–137. [Google Scholar] [CrossRef] [PubMed]
- Bai, J.; Feng, C.Y.; Yang, K. Research Progress of Physiological Measurement of Mental Workload in Pilots. Space Med. Med. Eng. 2016, 29, 150–156. [Google Scholar]
- Zhang, Z. Multiple measures of monitoring mental workload. J. Zhejiang Univ. Sci. A 2000, 1, 337–341. [Google Scholar] [CrossRef]
- Hancock, P.A.; Caird, J.K. Caird, Experimental Evaluation of a Model of Mental Workload. Hum. Factors 1993, 35, 413–429. [Google Scholar] [CrossRef]
- Noel, J.B.; Bauer, K.W., Jr.; Lanning, J.W. Lanning, Improving pilot mental workload classification through feature exploitation and combination: A feasibility study. Comput. Oper. Res. 2005, 32, 2713–2730. [Google Scholar] [CrossRef]
- Cantin, V.; Lavallière, M.; Simoneau, M.; Teasdale, N. Mental workload when driving in a simulator: Effects of age and driving complexity. Accid. Anal. Prev. 2009, 41, 763–771. [Google Scholar] [CrossRef]
- Baldauf, D.; Burgard, E.; Wittmann, M. Time perception as a workload measure in simulated car driving. Appl. Ergon. 2009, 40, 929–935. [Google Scholar] [CrossRef]
- Dey, A.; Mann, D.D. Sensitivity and diagnosticity of NASA-TLX and simplified SWAT to assess the mental workload associated with operating an agricultural sprayer. Ergonomics 2010, 53, 848–857. [Google Scholar] [CrossRef]
- Jo, S.; Myung, R.; Yoon, D. Quantitative prediction of mental workload with the ACT-R cognitive architecture. Int. J. Ind. Ergon. 2012, 42, 359–370. [Google Scholar] [CrossRef]
- Mouzé-Amady, M.; Raufaste, E.; Prade, H.; Meyer, J.P. Fuzzy-TLX: Using fuzzy integrals for evaluating human mental workload with NASA-Task Load index in laboratory and field studies. Ergonomics 2013, 56, 752–763. [Google Scholar] [CrossRef] [PubMed]
- Klein, M.I.; Warm, J.S.; Riley, M.A.; Matthews, G.; Doarn, C.; Donovan, J.F.; Gaitonde, K. Mental Workload and Stress Perceived by Novice Operators in the Laparoscopic and Robotic Minimally Invasive Surgical Interfaces. J. Endourol. 2012, 26, 1089–1094. [Google Scholar] [CrossRef] [PubMed]
- Reiner, M.; Gelfeld, T.M. Estimating mental workload through event-related fluctuations of pupil area during a task in a virtual world. Int. J. Psychophysiol. 2014, 93, 38–44. [Google Scholar] [CrossRef]
- Fallahi, M.; Motamedzade, M.; Heidarimoghadam, R.; Soltanian, A.R.; Miyake, S. Effects of mental workload on physiological and subjective responses during traffic density monitoring: A field study. Appl. Ergon. 2016, 52, 95–103. [Google Scholar] [CrossRef] [PubMed]
- Kramer, A.F. Assessment of mental workload with task-irrelevant auditoryprobes. Biol. Psychol. 1995, 40, 83–100. [Google Scholar] [CrossRef] [PubMed]
- Kang, W.; Yuan, X.; Liu, Z.; Liu, W. Synthetic Evaluation Method of Mental Workload on Visual Display Interface in Airplane Cockpit. Space Med. Med. Eng. 2008, 21, 103–107. [Google Scholar]
- Liu, W.P.; Zhao, K.X.; Nie, J.F. Typical subjective evaluation method of mental workload of occupant based on task. Sci. Technol. Eng. 2018, 18, 136–140. [Google Scholar]
- Zhang, J.; Li, S. A deep learning scheme for mental workload classification based on restricted Boltzmann machines. Cogn. Technol. Work. 2017, 19, 607–631. [Google Scholar] [CrossRef]
- Caywood, M.S.; Roberts, D.M.; Colombe, J.B.; Greenwald, H.S.; Weiland, M.Z. Gaussian Process Regression for Predictive But Interpretable Machine Learning Models: An Example of Predicting Mental Workload across Tasks. Front. Hum. Neurosci. 2017, 10, 647. [Google Scholar] [CrossRef]
- Wu, C.T.; Dillon, D.G.; Hsu, H.C.; Huang, S.; Barrick, E.; Liu, Y.H. Depression Detection Using Relative EEG Power Induced by Emotionally Positive Images and a Conformal Kernel Support Vector Machine. Appl. Sci. 2017, 8, 1244. [Google Scholar] [CrossRef]
- Ke, Y.; Qi, H.; Zhang, L.; Chen, S.; Jiao, X.; Zhou, P.; Zhao, X.; Wan, B.; Ming, D. Towards an effective cross-task mental workload recognition model using electroencephalography based on feature selection and support vector machine regression. Int. J. Psychophysiol. 2015, 98, 157–166. [Google Scholar] [CrossRef] [PubMed]
- Zhang, J.; Yin, Z.; Wang, R. Nonlinear Dynamic Classification of Momentary Mental Workload Using Physiological Features and NARX-Model-Based Least-Squares Support Vector Machines. IEEE Trans. Hum. Mach. Syst. 2017, 99, 1–14. [Google Scholar] [CrossRef]
- Grassmann, M.; Vlemincx, E.; von Leupoldt, A.; Van den Bergh, O. Individual differences in cardiorespiratory measures of mental workload: An investigation of negative affectivity and cognitive avoidant coping in pilot candidates. Appl. Ergon. 2017, 59, 274–282. [Google Scholar] [CrossRef]
- Zhang, J.; Yin, Z.; Wang, R. Recognition of Mental Workload Levels Under Complex Human–Machine Collaboration by Using Physiological Features and Adaptive Support Vector Machines. IEEE Trans. Hum. Mach. Syst. 2017, 45, 200–214. [Google Scholar] [CrossRef]
- So, W.K.; Wong, S.W.; Mak, J.N.; Chan, R.H. An evaluation of mental workload with frontal EEG. PLoS ONE 2017, 12, e0174949. [Google Scholar] [CrossRef] [PubMed]
- Krishnaveni, V.; Jayaraman, S.; Anitha, L.; Ramadoss, K. Removal of ocular artifacts from EEG using adaptive thresholding of wavelet coefficients. J. Neural Eng. 2006, 3, 338–346. [Google Scholar] [CrossRef]
- Hekmatmanesh, A.; Zhidchenko, V.; Kauranen, K.; Siitonen, K.; Handroos, H.; Soutukorva, S.; Kilpeläinen, A. Biosignals in human factors research for heavy equipment operators: A review of available methods and their feasibility in laboratory and ambulatory studies. IEEE Access 2021, 9, 97466–97482. [Google Scholar] [CrossRef]
- Cardone, D.; Perpetuini, D.; Filippini, C.; Mancini, L.; Nocco, S.; Tritto, M.; Rinella, S.; Giacobbe, A.; Fallica, G.; Ricci, F.; et al. Classification of Drivers’ Mental Workload Levels: Comparison of Machine Learning Methods Based on ECG and Infrared Thermal Signals. Sensors 2022, 22, 7300. [Google Scholar] [CrossRef]
- Perpetuini, D.; Filippini, C.; Nocco, S.; Tritto, M.; Cardone, D.; Merla, A. A Machine Learning Approach to Classify Driver Mental Workload as Assessed by Electroencephalography through Infrared Thermal Imaging. In Proceedings of the 2022 E-Health and Bioengineering Conference (EHB), Iasi, Romania, 17–18 November 2022. [Google Scholar]
- Sriranga, A.K.; Lu, Q.; Birrell, S. A systematic review of in-vehicle physiological indices and sensor technology for driver mental workload monitoring. Sensors 2023, 23, 2214. [Google Scholar] [CrossRef]
- Cortes, C.; Vapnik, V. Support-vector networks. Mach. Learn. 1995, 20, 273–297. [Google Scholar] [CrossRef]
- Cherkassky, V.; Ma, Y. Practical selection of SVM parameters and noise estimation for SVM regression. Neural Netw. 2004, 17, 113–126. [Google Scholar] [CrossRef] [PubMed]
- Gao, J.B.; Gunn, S.R.; Harris, C.J.; Brown, M. A Probabilistic Framework for SVM Regression and Error Bar Estimation. Mach. Learn. 2002, 46, 71–89. [Google Scholar] [CrossRef]
- Zhou, X.; Tuck, D.P. MSVM-RFE: Extensions of SVM-RFE for multiclass gene selection on DNA microarray data. Bioinformatics 2007, 23, 1106–1114. [Google Scholar] [CrossRef]
- Wang, A.; Yuan, W.; Liu, J.; Yu, Z.; Li, H. A novel pattern recognition algorithm: Combining ART network with SVM to reconstruct a multi-class classifier. Comput. Math. Appl. 2009, 57, 1908–1914. [Google Scholar] [CrossRef]
- Wei, X.K.; Shao, W.; Zhang, C.; Li, J.L.; Wang, B.Z. Improved self-adaptive genetic algorithm with quantum scheme for electromagnetic optimisation. IET Microw. Antennas Propag. 2014, 8, 965–972. [Google Scholar] [CrossRef]
- Li, K.; Wang, L.; Wu, J.; Zhang, Q.; Liao, G.; Su, L. Using GA-SVM for defect inspection of flip chips based on vibration signals. Microelectron. Reliab. 2018, 81, 159–166. [Google Scholar] [CrossRef]
- Phan, A.V.; Nguyen, M.L.; Bui, L.T. Feature weighting and SVM parameters optimization based on genetic algorithms for classification problems. Appl. Intell. 2016, 46, 1–15. [Google Scholar] [CrossRef]
- Zhou, X.; Gao, X.; Wang, J.; Yu, H.; Wang, Z.; Chi, Z. Eye Tracking Data Guided Feature Selection for Image Classification. Pattern Recognit. 2017, 63, 56–70. [Google Scholar] [CrossRef]
- Yang, J.A.; Zhuang, Z.Q.; Shi, L. Multi-universe parallel quantum genetic algorithm. Acta Electonica Sin. 2004, 6, 923–928. [Google Scholar]
| Disclaimer/Publisher’s Note: The statements, opinions and data contained in all publications are solely those of the individual author(s) and contributor(s) and not of MDPI and/or the editor(s). MDPI and/or the editor(s) disclaim responsibility for any injury to people or property resulting from any ideas, methods, instructions or products referred to in the content. |
© 2023 by the authors. Licensee MDPI, Basel, Switzerland. This article is an open access article distributed under the terms and conditions of the Creative Commons Attribution (CC BY) license (https://creativecommons.org/licenses/by/4.0/).


