


A Comparison of Inertial Measurement Units and Overnight Videography to Assess Sleep Biomechanics

 , , ,
, , , 
Abstract
1. Introduction
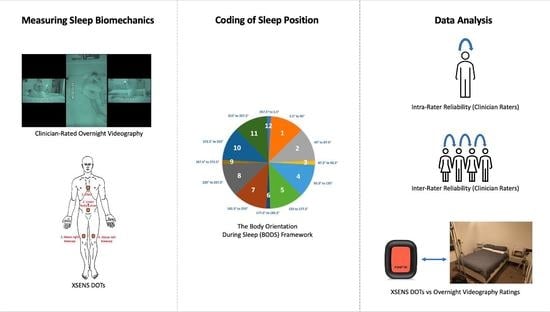
2. Methods
2.1. Working Definitions
2.2. Ethics
Participants
2.3. Assessment Instruments
2.3.1. XSENS DOT Platform
2.3.2. Body Orientation during Sleep Framework (BODS)
2.3.3. Video Cameras
2.4. Data Collection Procedure
2.5. Data Processing
2.5.1. Camera Footage
2.5.2. Rating of Camera Footage
2.5.3. XSENS Data
2.6. Statistical Analysis
2.6.1. Intra-Rater Reliability
2.6.2. Inter-Rater Reliability
2.6.3. Raters vs. DOTS
3. Results
3.1. Participant Characteristics
3.1.1. Intra-Rater Reliability
3.1.2. Inter-Rater Reliability
3.1.3. Raters vs. DOTS
4. Discussion
5. Conclusions
Supplementary Materials
Author Contributions
Funding
Institutional Review Board Statement
Informed Consent Statement
Data Availability Statement
Conflicts of Interest
References
- Joosten, S.A.; O’Driscoll, D.M.; Berger, P.J.; Hamilton, G.S. Supine position related obstructive sleep apnea in adults: Pathogenesis and treatment. Sleep Med. Rev. 2014, 18, 7–17. [Google Scholar] [CrossRef] [PubMed]
- Sommerauer, M.; Werth, E.; Poryazova, R.; Gavrilov, Y.; Hauser, S.; Valko, P.O. Bound to supine sleep: Parkinson’s disease and the impact of nocturnal immobility. Park. Relat. Disord. 2015, 21, 1269–1272. [Google Scholar] [CrossRef] [PubMed]
- Fulford, F.E.; Brown, J.K. Position as a cause of deformity in children with cerebral palsy. Dev. Med. Child Neurol. 1976, 18, 305–314. [Google Scholar] [CrossRef]
- Palisano, R.J.; Rosenbaum, P.; Bartlett, D.; Livingston, M.H. Content validity of the expanded and revised Gross Motor Function Classification System. Dev. Med. Child Neurol. 2008, 50, 744–750. [Google Scholar] [CrossRef] [PubMed]
- Sato, H.; Iwasaki, T.; Yokoyama, M.; Inoue, T. Monitoring of body position and motion in children with severe cerebral palsy for 24 hours. Disabil. Rehabil. 2014, 36, 1156–1160. [Google Scholar] [CrossRef]
- Hill, S.; Goldsmith, J. Biomechanics and prevention of body shape distortion. Tizard Learn. Disabil. Rev. 2010, 15, 15–32. [Google Scholar] [CrossRef]
- McIntyre, S.; Morgan, C.; Walker, K.; Novak, I. Cerebral Palsy—Don’t Delay. Dev. Disabil. Res. Rev. 2011, 17, 114–129. [Google Scholar] [CrossRef]
- Poirot, I.; Laudy, V.; Rabilloud, M.; Roche, S.; Ginhoux, T.; Kassaï, B.; Vuillerot, C. Prevalence of pain in 240 non-ambulatory children with severe cerebral palsy. Ann. Phys. Rehabil. Med. 2017, 60, 371–375. [Google Scholar] [CrossRef]
- Littleton, S.R.; Heriza, C.B.; Mullens, P.A.; Moerchen, V.A.; Bjornson, K. Effects of Positioning on Respiratory Measures in Individuals with Cerebral Palsy and Severe Scoliosis. Pediatr. Phys. Ther. 2011, 23, 159–169. [Google Scholar] [CrossRef]
- Novak, I. Evidence-Based Diagnosis, Health Care, and Rehabilitation for Children with Cerebral Palsy. J. Child Neurol. 2014, 29, 1141–1156. [Google Scholar] [CrossRef]
- Casey, J.; Rosenblad, A.; Rodby-Bousquet, E. Postural asymmetries, pain, and ability to change position of children with cerebral palsy in sitting and supine: A cross-sectional study. Disabil. Rehabil. 2020, 44, 2363–2371. [Google Scholar] [CrossRef] [PubMed]
- Gordon, S.J.; Grimmer, K.A.; Trott, P. Self-Reported versus Recorded Sleep Position: An Observational Study. Internet J. Allied Health Sci. Pract. 2004, 2, 7. [Google Scholar] [CrossRef]
- Zahradka, N.; Jeong, I.C.; Searson, P.C. Distinguishing positions and movements in bed from load cell signals. Physiol. Meas. 2018, 39, 125001. [Google Scholar] [CrossRef] [PubMed]
- Sato, H.; Ikura, D.; Tsunoda, M. Assessing head and trunk symmetry during sleep using tri-axial accelerometers. Disabil. Rehabil. Assist. Technol. 2015, 10, 113–117. [Google Scholar] [CrossRef] [PubMed]
- Russo, K.; Bianchi, M.T. How Reliable Is Self-Reported Body Position during Sleep? J. Clin. Sleep Med. 2016, 12, 127–128. [Google Scholar] [CrossRef]
- Cary, D.; Collinson, R. Examining the Relationship between Sleep Posture and Morning Spinal Symptoms in the Habitual Environment Using Infrared Cameras. J. Sleep Disord. Treat. Care 2016, 5, 2. [Google Scholar] [CrossRef]
- Masek, M.; Lam, C.P.; Tranthim-Fryer, C.; Jansen, B.; Baptist, K. Sleep monitor: A tool for monitoring and categorical scoring of lying position using 3D camera data. SoftwareX 2018, 7, 341–346. [Google Scholar] [CrossRef]
- Aaronson, S.T.; Rashed, S.; Biber, M.P.; Hobson, J.A. Brain State and Body Position: A Time-lapse Video Study of Sleep. Arch. Gen. Psychiatry 1982, 39, 330–335. [Google Scholar] [CrossRef]
- Wrzus, C.; Brandmaier, A.; Von Oertzen, T.; Müller, V.; Wagner, G.G.; Riediger, M. A New Approach for Assessing Sleep Duration and Postures from Ambulatory Accelerometry. PLoS ONE 2012, 7, e48089. [Google Scholar] [CrossRef]
- Warrens, M.J. The effect of combining categories on Bennett, Alpert and Goldstein’s S. Stat. Methodol. 2012, 9, 341–352. [Google Scholar] [CrossRef]
- DelRosso, L.M.; Jackson, C.V.; Trotter, K.; Bruni, O.; Ferri, R. Video-polysomnographic characterization of sleep movements in children with restless sleep disorder. Sleep 2019, 42, zsy269. [Google Scholar] [CrossRef] [PubMed]
- Abbott, E.; Campbell, A.; Wise, E.; Tidman, S.J.; Lay, B.S.; Kent, P. Physiotherapists could detect changes of 12 degrees or more in single-plane movement when observing forward bending, squat or hand-over-head: A cross-sectional experiment. Musculoskelet. Sci. Pract. 2022, 61, 102594. [Google Scholar] [CrossRef] [PubMed]
- Brown, D.L.; Lisabeth, L.D.; Zupancic, M.J.; Concannon, M.; Martin, C.; Chervin, R.D. High Prevalence of Supine Sleep in Ischemic Stroke Patients. Stroke 2008, 39, 2511–2514. [Google Scholar] [CrossRef]
- Buckley, N.; Davey, P.; Jensen, L.; Baptist, K.; Jansen, B.; Campbell, A.; Downs, J. Can Wearable Inertial Measurement Units Be Used to Measure Sleep Biomechanics? Establishing Initial Feasibility and Validity. Biomimetics 2023, 8, 2. [Google Scholar] [CrossRef] [PubMed]
- Humphreys, G.; King, T.; Jex, J.; Rogers, M.; Blake, S.; Thompson-Coon, J.; Morris, C. Sleep positioning systems for children and adults with a neurodisability: A systematic review. Br. J. Occup. Ther. 2019, 82, 5–14. [Google Scholar] [CrossRef]
- McCambridge, J.; Witton, J.; Elbourne, D.R. Systematic review of the Hawthorne effect: New concepts are needed to study research participation effects. J. Clin. Epidemiol. 2014, 67, 267–277. [Google Scholar] [CrossRef]


| Sternum | Pelvis | Left Leg | Right Leg | ||||||
|---|---|---|---|---|---|---|---|---|---|
| Frequency | Percent | Frequency | Percent | Frequency | Percent | Frequency | Percent | ||
| Rater A Difference Scores | 0 | 21 | 53% | 26 | 65% | 23 | 58% | 19 | 48% |
| 1 | 15 | 38% | 11 | 28% | 15 | 38% | 17 | 43% | |
| 2 | 1 | 3% | 2 | 5% | 1 | 3% | 2 | 5% | |
| 3 | 1 | 3% | 0 | 0% | 0 | 0% | 1 | 3% | |
| 4 | 1 | 3% | 0 | 0% | 0 | 0% | 0 | 0% | |
| 5 | 0 | 0% | 0 | 0% | 0 | 0% | 0 | 0% | |
| 6 | 1 | 3% | 1 | 3% | 1 | 3% | 1 | 3% | |
| Total | 40 | 100% | 40 | 100% | 40 | 100% | 40 | 100% | |
| Rater B Difference Scores | 0 | 24 | 60% | 33 | 83% | 26 | 65% | 29 | 73% |
| 1 | 16 | 40% | 7 | 18% | 13 | 33% | 9 | 23% | |
| 2 | 0 | 0% | 0 | 0% | 1 | 3% | 2 | 5% | |
| 3 | 0 | 0% | 0 | 0% | 0 | 0% | 0 | 0% | |
| 4 | 0 | 0% | 0 | 0% | 0 | 0% | 0 | 0% | |
| 5 | 0 | 0% | 0 | 0% | 0 | 0% | 0 | 0% | |
| 6 | 0 | 0% | 0 | 0% | 0 | 0% | 0 | 0% | |
| Total | 40 | 100% | 40 | 100% | 40 | 100% | 40 | 100% | |
| Rater C Difference Scores | 0 | 22 | 55% | 37 | 93% | 27 | 68% | 28 | 70% |
| 1 | 17 | 43% | 3 | 8% | 12 | 30% | 9 | 23% | |
| 2 | 0 | 0% | 0 | 0% | 1 | 3% | 3 | 8% | |
| 3 | 1 | 3% | 0 | 0% | 0 | 0% | 0 | 0% | |
| 4 | 0 | 0% | 0 | 0% | 0 | 0% | 0 | 0% | |
| 5 | 0 | 0% | 0 | 0% | 0 | 0% | 0 | 0% | |
| 6 | 0 | 0% | 0 | 0% | 0 | 0% | 0 | 0% | |
| Total | 40 | 100% | 40 | 100% | 40 | 100% | 40 | 100% | |
| Rater D Difference Scores | 0 | 27 | 68% | 34 | 85% | 26 | 65% | 32 | 80% |
| 1 | 12 | 30% | 6 | 15% | 13 | 33% | 7 | 18% | |
| 2 | 0 | 0% | 0 | 0% | 1 | 3% | 1 | 3% | |
| 3 | 1 | 3% | 0 | 0% | 0 | 0% | 0 | 0% | |
| 4 | 0 | 0% | 0 | 0% | 0 | 0% | 0 | 0% | |
| 5 | 0 | 0% | 0 | 0% | 0 | 0% | 0 | 0% | |
| 6 | 0 | 0% | 0 | 0% | 0 | 0% | 0 | 0% | |
| Total | 40 | 100% | 40 | 100% | 40 | 100% | 40 | 100% | |
| Rater E Difference Scores | 0 | 22 | 55% | 37 | 93% | 27 | 68% | 27 | 68% |
| 1 | 17 | 43% | 3 | 8% | 13 | 33% | 10 | 25% | |
| 2 | 0 | 0% | 0 | 0% | 0 | 0% | 3 | 8% | |
| 3 | 1 | 3% | 0 | 0% | 0 | 0% | 0 | 0% | |
| 4 | 0 | 0% | 0 | 0% | 0 | 0% | 0 | 0% | |
| 5 | 0 | 0% | 0 | 0% | 0 | 0% | 0 | 0% | |
| 6 | 0 | 0% | 0 | 0% | 0 | 0% | 0 | 0% | |
| Total | 40 | 100% | 40 | 100% | 40 | 100% | 40 | 100% | |
| Rater F Difference Scores | 0 | 30 | 75% | 31 | 78% | 27 | 68% | 26 | 65% |
| 1 | 10 | 25% | 9 | 23% | 12 | 30% | 11 | 28% | |
| 2 | 0 | 0% | 0 | 0% | 0 | 0% | 2 | 5% | |
| 3 | 0 | 0% | 0 | 0% | 1 | 3% | 1 | 3% | |
| 4 | 0 | 0% | 0 | 0% | 0 | 0% | 0 | 0% | |
| 5 | 0 | 0% | 0 | 0% | 0 | 0% | 0 | 0% | |
| 6 | 0 | 0% | 0 | 0% | 0 | 0% | 0 | 0% | |
| Total | 40 | 100% | 40 | 100% | 40 | 100% | 40 | 100% | |
| Cohen’s Kappa | ||||||
| A | B | C | D | E | F | |
| A | 0.254 | 0.350 | 0.336 | 0.310 | 0.264 | |
| B | 0.433 | 0.413 | 0.344 | 0.397 | ||
| C | 0.482 | 0.378 | 0.352 | |||
| D | 0.470 | 0.351 | ||||
| E | 0.364 | |||||
| F | ||||||
| Bennett’s S Score | ||||||
| A | B | C | D | E | F | |
| A | 0.487 | 0.525 | 0.565 | 0.493 | 0.466 | |
| B | 0.576 | 0.606 | 0.509 | 0.563 | ||
| C | 0.632 | 0.553 | 0.508 | |||
| D | 0.622 | 0.539 | ||||
| E | 0.518 | |||||
| F | ||||||
| Sternum | Pelvis | Left Leg | Right Leg | ||||||
|---|---|---|---|---|---|---|---|---|---|
| Frequency | Percent | Frequency | Percent | Frequency | Percent | Frequency | Percent | ||
| Rater A Difference Scores | 0 | 73 | 37% | 89 | 45% | 49 | 25% | 62 | 31% |
| 1 | 122 | 61% | 104 | 52% | 126 | 63% | 99 | 50% | |
| 2 | 1 | 1% | 4 | 2% | 23 | 12% | 33 | 17% | |
| 3 | 1 | 1% | 2 | 1% | 1 | 1% | 5 | 3% | |
| 4 | 2 | 1% | 0 | 0% | 0 | 0% | 0 | 0% | |
| 5 | 1 | 1% | 1 | 1% | 1 | 1% | 1 | 1% | |
| 6 | 0 | 0% | 0 | 0% | 0 | 0% | 0 | 0% | |
| Total | 200 | 100% | 200 | 100% | 200 | 100% | 200 | 100% | |
| Rater B Difference Scores | 0 | 89 | 37% | 111 | 56% | 51 | 26% | 63 | 32% |
| 1 | 93 | 61% | 81 | 41% | 118 | 59% | 114 | 57% | |
| 2 | 15 | 1% | 6 | 3% | 26 | 13% | 18 | 9% | |
| 3 | 2 | 1% | 0 | 0% | 3 | 2% | 3 | 2% | |
| 4 | 1 | 1% | 1 | 1% | 1 | 1% | 0 | 0% | |
| 5 | 0 | 1% | 0 | 0% | 1 | 1% | 1 | 1% | |
| 6 | 0 | 0% | 0 | 0% | 0 | 0% | 0 | 0% | |
| Missing | 0 | 0% | 1 | 1% | 0 | 0% | 1 | 1% | |
| Total | 200 | 100% | 200 | 100% | 200 | 100% | 200 | 100% | |
| Rater C Difference Scores | 0 | 61 | 31% | 109 | 55% | 55 | 28% | 60 | 30% |
| 1 | 135 | 68% | 86 | 43% | 118 | 59% | 123 | 62% | |
| 2 | 3 | 2% | 4 | 2% | 24 | 12% | 14 | 7% | |
| 3 | 1 | 1% | 1 | 1% | 3 | 2% | 3 | 2% | |
| 4 | 0 | 0% | 0 | 0% | 0 | 0% | 0 | 0% | |
| 5 | 0 | 0% | 0 | 0% | 0 | 0% | 0 | 0% | |
| 6 | 0 | 0% | 0 | 0% | 0 | 0% | 0 | 0% | |
| Total | 200 | 100% | 200 | 100% | 200 | 100% | 200 | 100% | |
| Rater D Difference Scores | 0 | 61 | 31% | 104 | 52% | 60 | 30% | 56 | 28% |
| 1 | 136 | 68% | 91 | 46% | 121 | 61% | 122 | 61% | |
| 2 | 1 | 1% | 3 | 2% | 12 | 6% | 18 | 9% | |
| 3 | 0 | 0% | 0 | 0% | 3 | 2% | 0 | 0% | |
| 4 | 1 | 1% | 1 | 1% | 1 | 1% | 3 | 2% | |
| 5 | 1 | 1% | 0 | 0% | 3 | 2% | 1 | 1% | |
| 6 | 0 | 0% | 1 | 1% | 0 | 0% | 0 | 0% | |
| Total | 200 | 100% | 200 | 100% | 200 | 100% | 200 | 100% | |
| Rater E Difference Scores | 0 | 75 | 38% | 104 | 52% | 51 | 26% | 68 | 34% |
| 1 | 118 | 59% | 90 | 45% | 130 | 65% | 113 | 57% | |
| 2 | 6 | 3% | 6 | 3% | 15 | 8% | 17 | 9% | |
| 3 | 1 | 1% | 0 | 0% | 4 | 2% | 2 | 1% | |
| 4 | 0 | 0% | 0 | 0% | 0 | 0% | 0 | 0% | |
| 5 | 0 | 0% | 0 | 0% | 0 | 0% | 0 | 0% | |
| 6 | 0 | 0% | 0 | 0% | 0 | 0% | 0 | 0% | |
| Total | 200 | 100% | 200 | 100% | 200 | 100% | 200 | 100% | |
| Rater F Difference Scores | 0 | 106 | 53% | 124 | 62% | 66 | 33% | 88 | 44% |
| 1 | 83 | 42% | 61 | 31% | 113 | 57% | 97 | 49% | |
| 2 | 11 | 6% | 15 | 8% | 19 | 10% | 13 | 7% | |
| 3 | 0 | 0% | 0 | 0% | 1 | 1% | 2 | 1% | |
| 4 | 0 | 0% | 0 | 0% | 1 | 1% | 0 | 0% | |
| 5 | 0 | 0% | 0 | 0% | 0 | 0% | 0 | 0% | |
| 6 | 0 | 0% | 0 | 0% | 0 | 0% | 0 | 0% | |
| Total | 200 | 100% | 200 | 100% | 200 | 100% | 200 | 100% | |
Disclaimer/Publisher’s Note: The statements, opinions and data contained in all publications are solely those of the individual author(s) and contributor(s) and not of MDPI and/or the editor(s). MDPI and/or the editor(s) disclaim responsibility for any injury to people or property resulting from any ideas, methods, instructions or products referred to in the content. |
© 2023 by the authors. Licensee MDPI, Basel, Switzerland. This article is an open access article distributed under the terms and conditions of the Creative Commons Attribution (CC BY) license (https://creativecommons.org/licenses/by/4.0/).
Share and Cite
Buckley, N.; Davey, P.; Jensen, L.; Baptist, K.; Jacques, A.; Jansen, B.; Campbell, A.; Downs, J. A Comparison of Inertial Measurement Units and Overnight Videography to Assess Sleep Biomechanics. Bioengineering 2023, 10, 408. https://doi.org/10.3390/bioengineering10040408
Buckley N, Davey P, Jensen L, Baptist K, Jacques A, Jansen B, Campbell A, Downs J. A Comparison of Inertial Measurement Units and Overnight Videography to Assess Sleep Biomechanics. Bioengineering. 2023; 10(4):408. https://doi.org/10.3390/bioengineering10040408
Chicago/Turabian StyleBuckley, Nicholas, Paul Davey, Lynn Jensen, Kevin Baptist, Angela Jacques, Bas Jansen, Amity Campbell, and Jenny Downs. 2023. "A Comparison of Inertial Measurement Units and Overnight Videography to Assess Sleep Biomechanics" Bioengineering 10, no. 4: 408. https://doi.org/10.3390/bioengineering10040408
APA StyleBuckley, N., Davey, P., Jensen, L., Baptist, K., Jacques, A., Jansen, B., Campbell, A., & Downs, J. (2023). A Comparison of Inertial Measurement Units and Overnight Videography to Assess Sleep Biomechanics. Bioengineering, 10(4), 408. https://doi.org/10.3390/bioengineering10040408