
Lumbar Kinematics Assessment of Patients with Chronic Low Back Pain in Three Bridge Tests Using Miniaturized Sensors

 , ,
, ,  , , , ,
Abstract
1. Introduction
2. Materials and Methods
2.1. Subjects
2.2. Clinical Examination
2.3. Clinical Tests
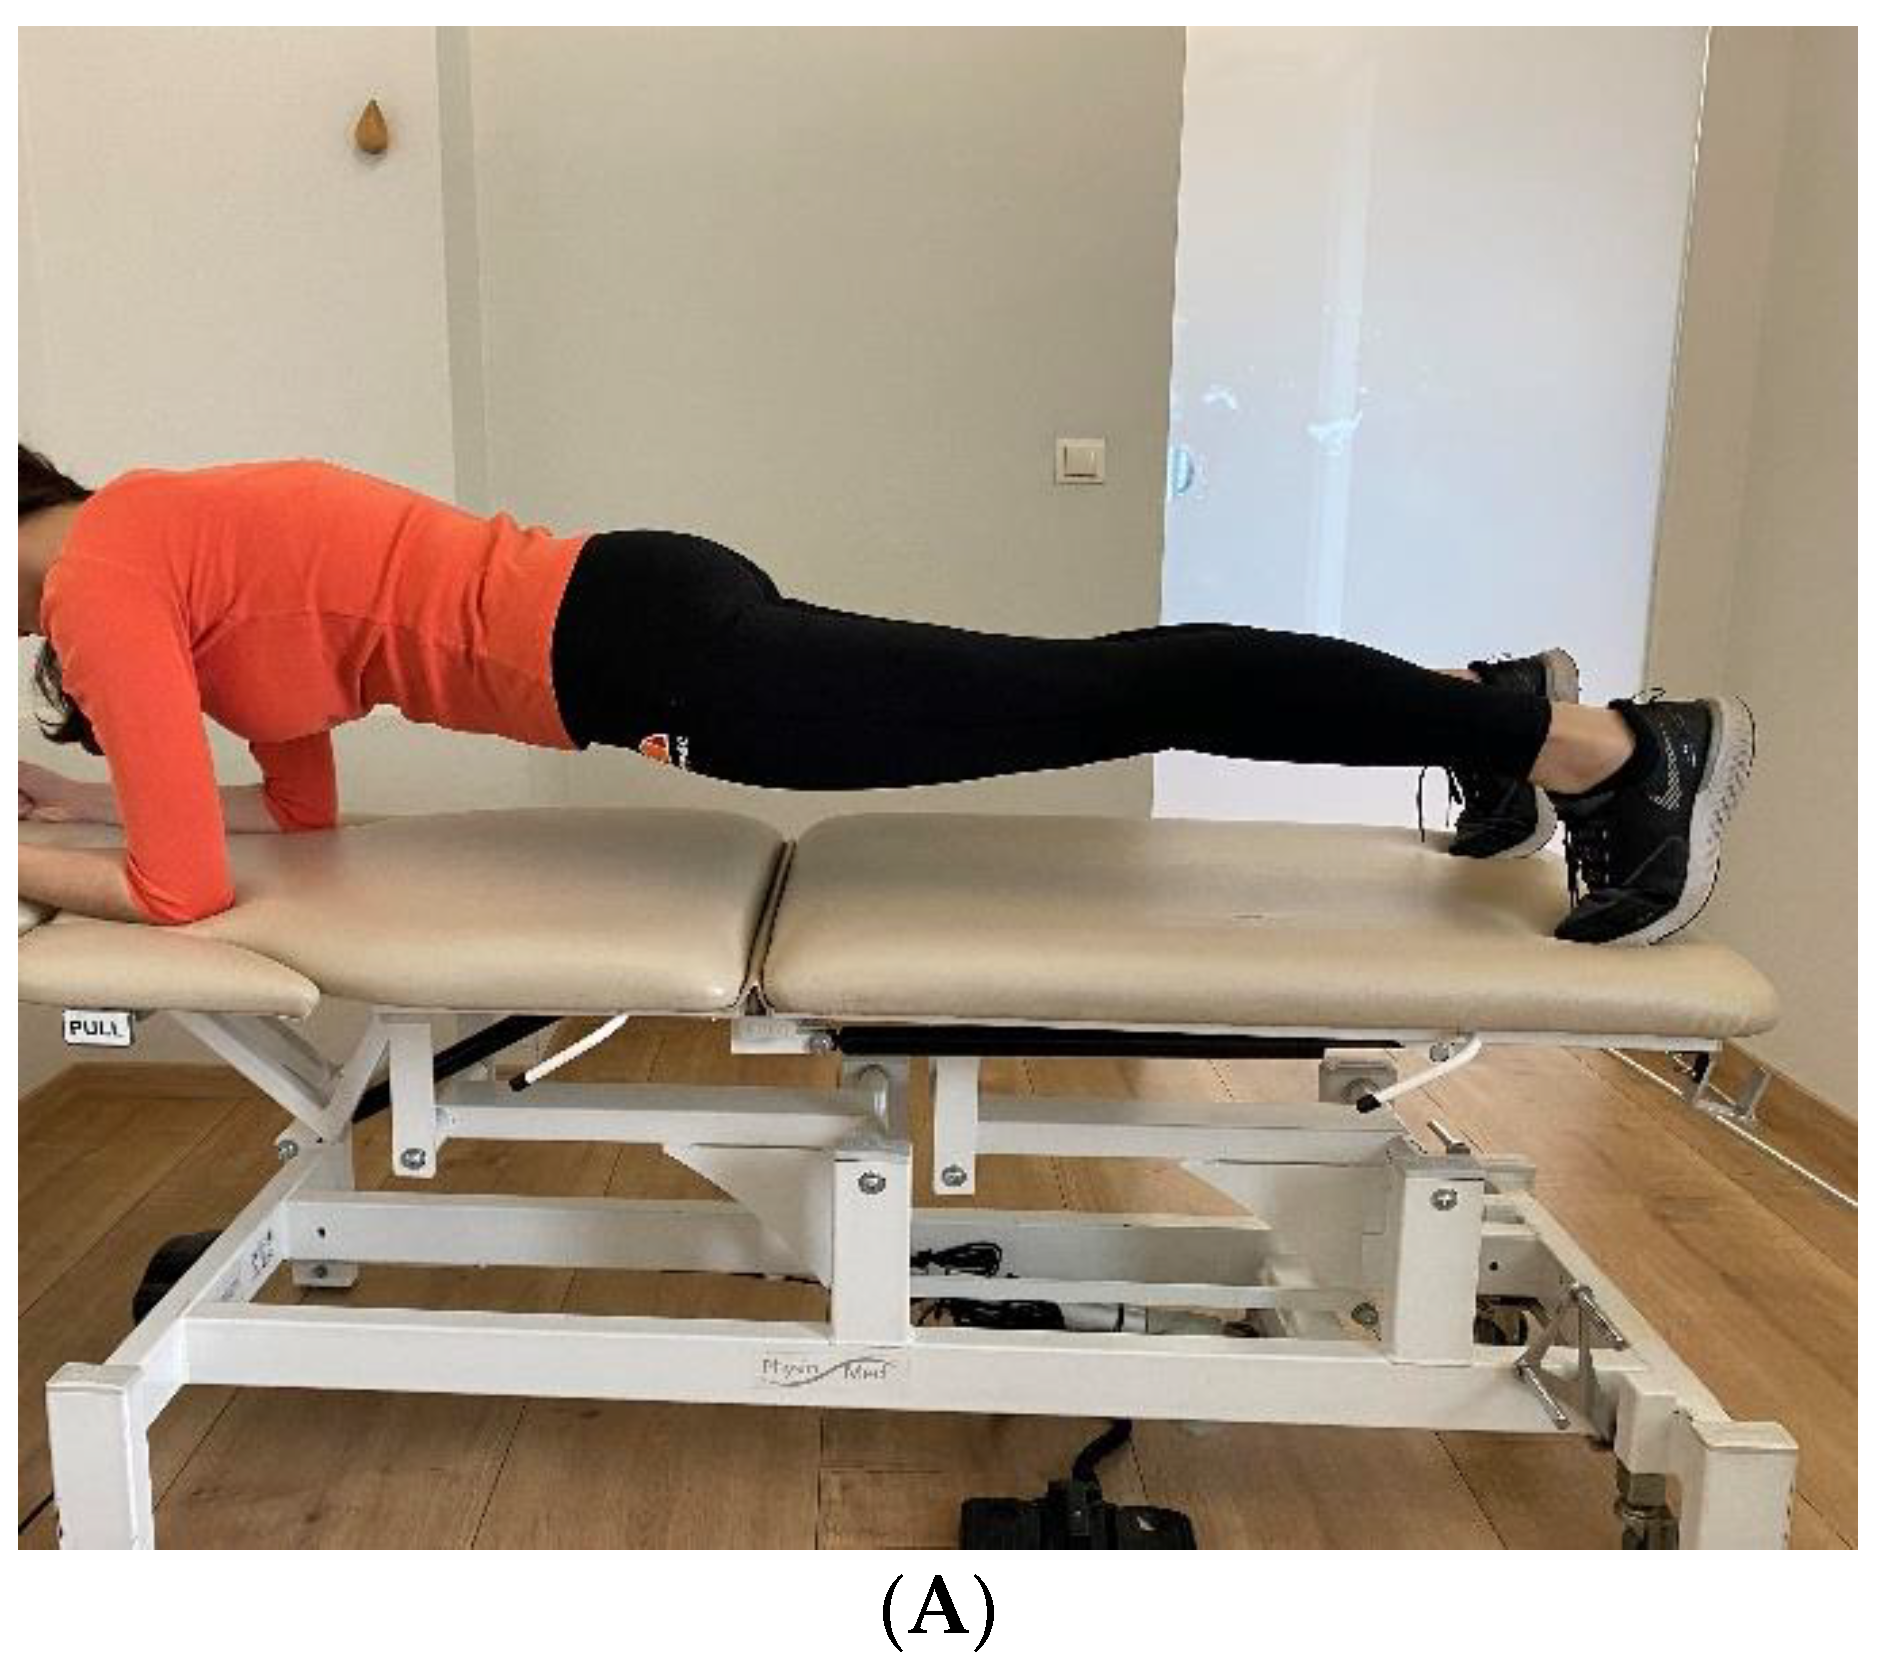
- Prone Bridge
- Supine Bridge
- Side Bridge Test
2.4. Instrumentation and Procedure
- BMI160 6-Axis Accelerometer + Gyroscope;
- LTR-329ALS Luminosity/Ambient Light;
- BMM150 3-Axis Magnetometer;
- BOSCH 9-Axis Sensor Fusion;
- 8 MB memory;
- Lithium-ion rechargeable battery;
- Vibrating coin motor;
- Low-energy Bluetooth, CPU, button, LED, and GPIOs.
2.4.1. Phase One—Calibration
2.4.2. Phase Two—Sensor Placement
2.4.3. Phase Three—Bluetooth Protocol and Data Streaming
2.4.4. Phase Four—Acquisition and Management of Test Measurements
2.4.5. Phase Five—Initial Material Observation
2.4.6. Phase Six—Bridge Test Measurement Collection
2.5. Data Gathering and Processing
3. Results
3.1. Clinical Examination
3.1.1. Passive Range of Motion
3.1.2. The Japanese Orthopaedic Association (JOA) Score
3.2. Wearable Sensors—IMU Data
- Supine Bridge Test
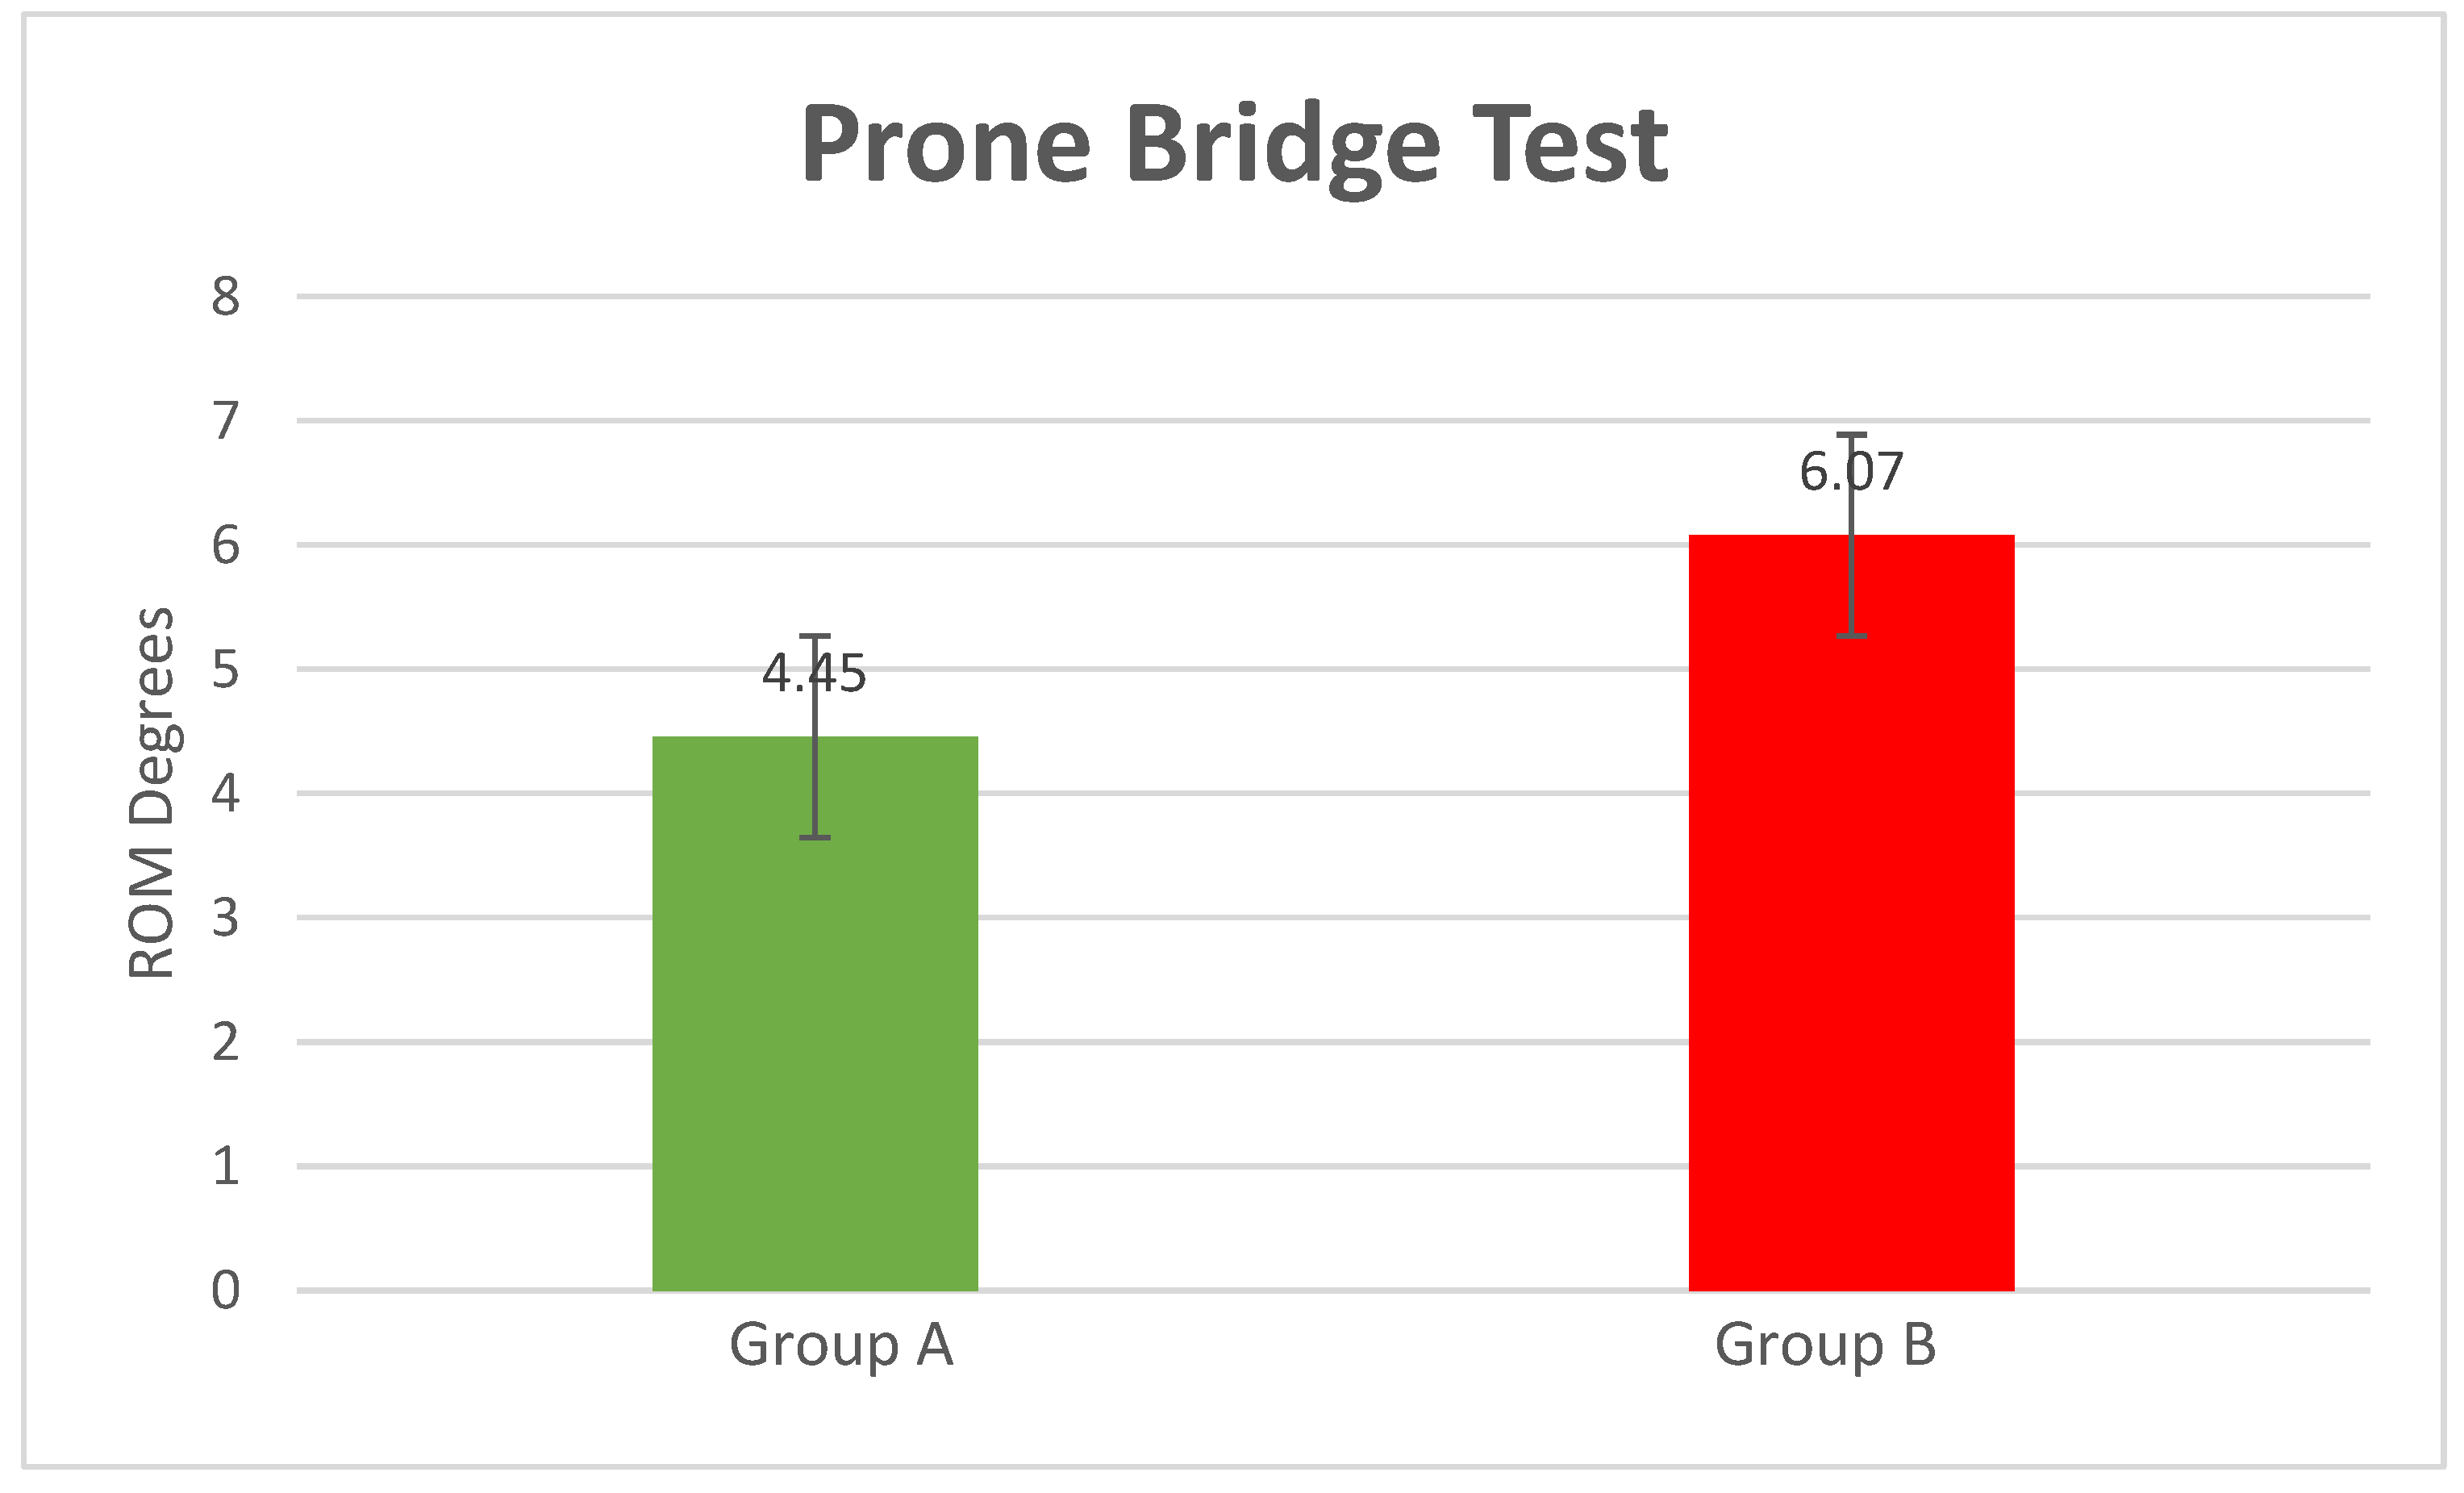
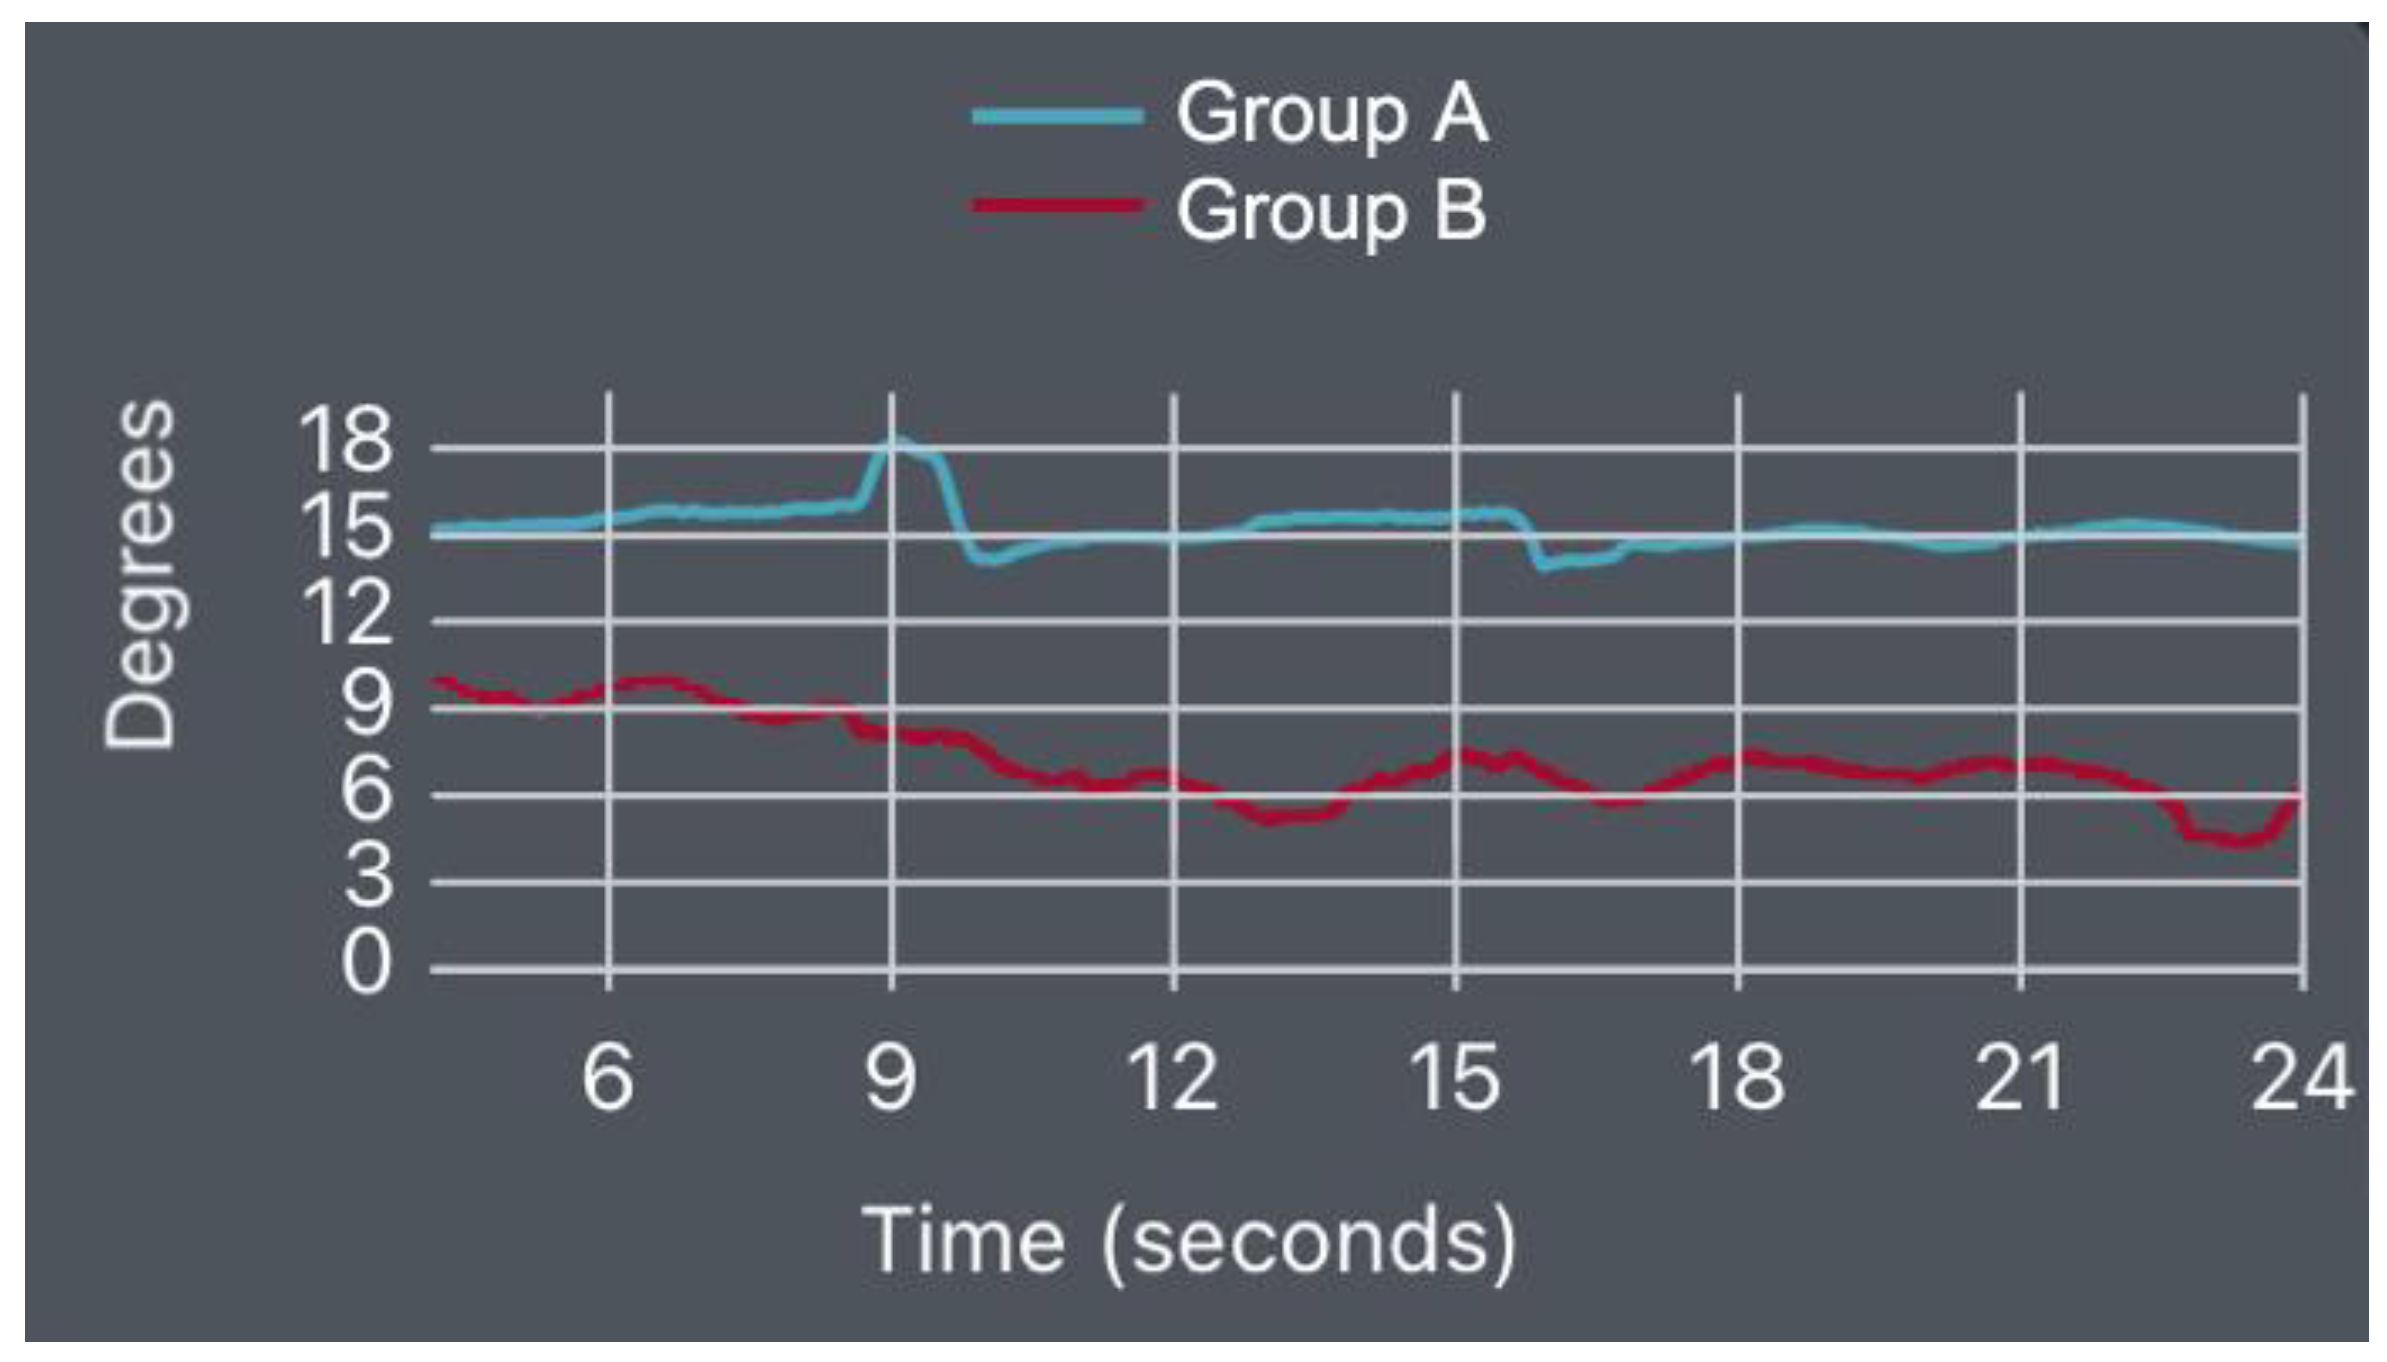
- Prone Bridge Test
- Left-Side Bridge Test
- Right-Side Bridge Test
4. Discussion
5. Limitations
6. Conclusions
Author Contributions
Funding
Institutional Review Board Statement
Informed Consent Statement
Data Availability Statement
Conflicts of Interest
References
- Kolář, P.; Šulc, J.; Kynčl, M.; Šanda, J.; Čakrt, O.; Andel, R.; Kumagai, K.; Kobesová, A. Postural function of the diaphragm in persons with and without chronic low back pain. J. Orthop. Sports Phys. Ther. 2012, 42, 352–362. [Google Scholar] [CrossRef] [PubMed]
- Kalichman, L.; Carmeli, E.; Been, E. The association between imaging parameters of the paraspinal muscles, spinal degeneration, and low back pain. BioMed Res. Int. 2017, 2017, 2562957. [Google Scholar] [CrossRef]
- Hildebrandt, M.; Fankhauser, G.; Meichtry, A.; Luomajoki, H. Correlation between lumbar dysfunction and fat infiltration in lumbar multifidus muscles in patients with low back pain. BMC Musculoskelet. Disord. 2017, 18, 12. [Google Scholar] [CrossRef] [PubMed]
- Freeman, M.D.; Woodham, M.A.; Woodham, A.W. The Role of the Lumbar Multifidus in Chronic Low Back Pain: A Review. Phys. Med. Rehabil. 2010, 2, 142–146. [Google Scholar] [CrossRef] [PubMed]
- Padwal, J.; Berry, D.B.; Hubbard, J.C.; Zlomislic, V.; Allen, R.T.; Garfin, S.R.; Ward, S.R.; Shahidi, B. Regional differences between superficial and deep lumbar multifidus in patients with chronic lumbar spine pathology. BMC Musculoskelet. Disord. 2020, 21, 1–9. [Google Scholar] [CrossRef] [PubMed]
- Steele, J.; Fisher, J.; Perrin, C.; Conway, R.; Bruce-Low, S.; Smith, D. Does change in isolated lumbar extensor muscle function correlate with good clinical outcome? A secondary analysis of data on change in isolated lumbar extension strength, pain, and disability in chronic low back pain. Disabil. Rehabil. 2018, 41, 1287–1295. [Google Scholar] [CrossRef]
- Steele, J.; Bruce-Low, S.; Smith, D. A reappraisal of the deconditioning hypothesis in low back pain: Review of evidence from a triumvirate of research methods on specific lumbar extensor deconditioning. Curr. Med. Res. Opin. 2014, 30, 865–911. [Google Scholar] [CrossRef]
- Imai, A.; Kaneoka, K. The relationship between trunk endurance plank tests and athletic performance tests in adolescent soccer players. Int. J. Sports Phys. Ther. 2016, 11, 718–724. [Google Scholar]
- Avers, D.; Brown, M. Daniels and Worthingham’s Muscle Testing: Techniques of Manual Examination and Performance Testing; Elsevier: Philadelphia, PA, USA, 2018; pp. 48–80. [Google Scholar]
- Witting, N.; Andersen, L.K.; Vissing, J. Axial myopathy: An overlooked feature of muscle diseases. Brain 2016, 139, 13–22. [Google Scholar] [CrossRef]
- Vlažná, D.; Krkoška, P.; Kuhn, M.; Dosbaba, F.; Batalik, L.; Vlčková, E.; Voháňka, S.; Adamová, B. Assessment of Lumbar Extensor Muscles in the Context of Trunk Function, a Pilot Study in Healthy Individuals. Appl. Sci. 2021, 11, 9518. [Google Scholar] [CrossRef]
- Saal, J.A.; Saal, J.S. Nonoperative treatment of herniated lumbar intervertebral disc with radiculopathy: An outcome study. Spine 1989, 14, 431–443. [Google Scholar] [CrossRef] [PubMed]
- Bullock-Saxton, J.E.; Janda, V.; Bullock, M.I. Reflex Activation of Gluteal Muscles in Walking. Spine 1993, 18, 704–708. [Google Scholar] [CrossRef] [PubMed]
- O’Sullivan, P.; Twomey, L.; Allison, G. Evaluation of specific stabilizing exercise in the treatment of chronic low back pain with radiologic diagnosis of spondylolysis or spondylolysthesis. Spine 1997, 24, 2959–2967. [Google Scholar] [CrossRef] [PubMed]
- Jørgensen, K. Human trunk extensor muscles physiology and ergonomics. Acta Physiol. Scand. Suppl. 1997, 637, 1–58. [Google Scholar]
- Wilder, D.G.; Aleksiev, A.R.; Magnusson, M.L.; Pope, M.H.; Spratt, K.F.; Goel, V.K. Muscular Response to Sudden Load. Spine 1996, 21, 2628–2639. [Google Scholar] [CrossRef]
- McGill, S.M.; Childs, A.; Liebenson, C. Endurance times for low back stabilization exercises: Clinical targets for testing and training from a normal database. Arch. Phys. Med. Rehabil. 1999, 80, 941–944. [Google Scholar] [CrossRef]
- Crawford, R.J.; Cornwall, J.; Abbott, R.; Elliott, J.M. Manually defining regions of interest when quantifying paravertebral muscles fatty infiltration from axial magnetic resonance imaging: A proposed method for the lumbar spine with ana-tomical cross-reference. BMC Musculoskelet. Disord. 2017, 18, 25. [Google Scholar] [CrossRef]
- Glowinski, S.; Blazejewski, A.; Krzyzynski, T. Inertial Sensors and Wavelets Analysis as a Tool for Pathological Gait Identification. In Innovations in Biomedical Engineering; Advances in Intelligent Systems and Computing; Springer: Cham, Switzerland, 2016; pp. 106–114. [Google Scholar]
- Bohannon, R.W.; Steffl, M.; Glenney, S.S.; Green, M.; Cashwell, L.; Prajerova, K.; Bunn, J. The prone bridge test: Performance, validity, and reliability among older and younger adults. J. Bodyw. Mov. Ther. 2018, 22, 385–389. [Google Scholar] [CrossRef]
- Ikezaki, F.; Krueger, E.; de Souza Guerino Macedo, C. Performance, reliability and fatigue in prone bridge test and supine unilateral bridge test. J. Bodyw. Mov. Ther. 2020, 26, 238–245. [Google Scholar] [CrossRef]
- Triantafyllou, A.; Papagiannis, G.; Stasi, S.; Bakalidou, D.; Kyriakidou, M.; Papathanasiou, G.; Papadopoulos, E.C.; Papagelopoulos, P.J.; Koulouvaris, P. Application of Wearable Sensors Technology for Lumbar Spine Kinematic Measurements during Daily Activities following Microdiscectomy Due to Severe Sciatica. Biology 2022, 11, 398. [Google Scholar] [CrossRef]
- Mok, F.P.; Samartzis, D.; Karppinen, J.; Fong, D.Y.; Luk, K.D.; Cheung, K.M. Modic changes of the lumbar spine: Prevalence, risk factors, and association with disc degeneration and low back pain in a large-scale population-based cohort. Spine J. 2016, 16, 32–41. [Google Scholar] [CrossRef] [PubMed]
- Griffith, J.F.; Wang, Y.X.; Antonio, G.E.; Choi, K.C.; Yu, A.; Ahuja, A.T.; Leung, P.C. Modified Pfirrmann grading system for lumbar intervertebral disc degeneration. Spine 2007, 32, E708–E712. [Google Scholar] [CrossRef] [PubMed]
- Urrutia, J.; Besa, P.; Campos, M.; Cikutovic, P.; Cabezon, M.; Molina, M.; Cruz, J.P. The Pfirrmann classification of lumbar intervertebral disc degeneration: An inde-pendent inter- and intra-observer agreement assessment. Eur. Spine J. 2016, 25, 2728–2733. [Google Scholar] [CrossRef] [PubMed]
- Kato, S.; Oshima, Y.; Oka, H.; Chikuda, H.; Takeshita, Y.; Miyoshi, K.; Kawamura, N.; Masuda, K.; Kunogi, J.; Okazaki, R.; et al. Comparison of the Japanese Orthopaedic Association (JOA) Score and Modified JOA (mJOA) Score for the Assessment of Cervical Myelopathy: A Multicenter Observational Study. PLoS ONE 2015, 10, e0123022. [Google Scholar] [CrossRef] [PubMed]
- Hislop, H.J.; Montgomery, J. Daniels and Worthingham’s Muscle Testing: Techniques of Manual Examination, 8th ed.; Saunders/Elsevier: St. Louis, MO, USA, 2017. [Google Scholar]
- Schellenberg, K.L.; Lang, J.M.; Chan, K.M.; Burnham, R.S. A clinical tool for office assessment of lumbar spine stabilization endurance: Prone and supine bridge maneuvers. Am. J. Phys. Med. Rehabil. 2007, 86, 380–386. [Google Scholar] [CrossRef]
- Juan-Recio, C.; Prat-Luri, A.; Galindo, A.; Manresa-Rocamora, A.; Barbado, D.; Vera-Garcia, F.J. Is the Side Bridge Test Valid and Reliable for Assessing Trunk Lateral Flexor Endurance in Recreational Female Athletes? Biology 2022, 11, 1043. [Google Scholar] [CrossRef]
- Cafolla, D.; Chen, I.-M.; Ceccarelli, M. An experimental characterization of human torso motion. Front. Mech. Eng. 2015, 10, 311–325. [Google Scholar] [CrossRef]
- Chaparro-Rico, B.D.M.; Cafolla, D. Test-Retest, Inter-Rater and Intra-Rater Reliability for Spatiotemporal Gait Parameters Using SANE (an eaSy gAte aNalysis systEm) as Measuring Instrument. Appl. Sci. 2020, 10, 5781. [Google Scholar] [CrossRef]
- Hoffman, S.L.; Johnson, M.B.; Zou, D.; Van Dillen, L.R. Differences in end-range lumbar flexion during slumped sitting and forward bending between low back pain subgroups and genders. Man Ther. 2012, 17, 157–163. [Google Scholar] [CrossRef]
- Borden, W.B.; Chiang, Y.-P.; Kronick, R. Bringing Patient-Centered Outcomes Research to Life. Value Health 2015, 18, 355–357. [Google Scholar] [CrossRef] [PubMed]
- Ludwig, S.A.; Burnham, K.D. Comparison of Euler estimate using extended Kalman filter, Madgwick and Mahony on quadcopter flight data. In Proceedings of the 2018 International Conference on Unmanned Aircraft Systems, Dallas, TX, USA, 12–15 June 2018. [Google Scholar]
- Zhou, Q.; Li, Z.; Yu, G.; Li, H.; Zhang, N. A novel adaptive Kalman filter for Euler-angle-based MEMS IMU/magnetometer attitude estimation. Meas. Sci. Technol. 2021, 32, 045104. [Google Scholar] [CrossRef]
- Bakhshi, S.; Mahoor, M.H.; Davidson, B.S. Development of a body joint angle measurement system using IMU sensors. In Proceedings of the 2011 Annual International Conference of the IEEE Engineering in Medicine and Biology Society, Boston, MA, USA, 30 August–3 September 2011. [Google Scholar]
- Sakaura, H.; Ikegami, D.; Fujimori, T.; Sugiura, T.; Owaki, H.; Fuji, T. Abdominal Aortic Calcification Is a Significant Poor Prognostic Factor for Clinical Outcomes After Decompressive Laminotomy for Lumbar Spinal Canal Stenosis. Glob. Spine J. 2019, 9, 724–728. [Google Scholar] [CrossRef] [PubMed]
- Milosavljevic, S.; Pal, P.; Bain, D.; Johnson, G. Kinematic and temporal interactions of the lumbar spine and hip during trunk extension in healthy male subjects. Eur. Spine J. 2007, 17, 122–128. [Google Scholar] [CrossRef]
- Arab, A.M.; Salavati, M.; Ebrahimi, I.; Mousavi, M.E. Sensitivity, specificity and predictive value of the clinical trunk muscle endurance tests in low back pain. Clin. Rehabil. 2007, 21, 640–647. [Google Scholar] [CrossRef] [PubMed]
- Carlsson, H.; Rasmussen-Barr, E. Clinical screening tests for assessing movement control in non-specific low-back pain. A systematic review of intra- and inter-observer reliability studies. Man. Ther. 2013, 18, 103–110. [Google Scholar] [CrossRef] [PubMed]
- Wong, T.K.T.; Lee, R.Y.W. Effects of low back pain on the relationship between the movements of the lumbar spine and hip. Hum. Mov. Sci. 2004, 23, 21–34. [Google Scholar] [CrossRef]
- Gombatto, S.P.; Collins, D.R.; Sahrmann, S.; Engsberg, J.R.; Van Dillen, L.R. Patterns of lumbar region movement during trunk lateral bending in 2 subgroups of people with low back pain. Phys. Ther. 2007, 87, 441–454. [Google Scholar] [CrossRef]
- Van Dillen, L.R.; Gombatto, S.P.; Collins, D.R.; Engsberg, J.R.; Sahrmann, S.A. Symmetry of timing of hip and lumbopelvic rotation motion in 2 different subgroups of people with low back pain. Arch. Phys. Med. Rehabil. 2007, 88, 351–360. [Google Scholar] [CrossRef]
- Lee, R.Y.W.; Wong, T.K.T. Relationship between the movements of the lumbar spine and hip. Hum. Mov. Sci. 2002, 21, 481–494. [Google Scholar] [CrossRef]
- García-Vaquero, M.P.; Moreside, J.M.; Brontons-Gil, E.; Peco-González, N.; Vera-Garcia, F.J. Trunk muscle activation during stabilization exercises with single and double leg support. J. Electromyogr. Kinesiol. 2012, 22, 398–406. [Google Scholar] [CrossRef]
- Anders, C.; Wenzel, B.; Scholle, H.C. Activation characteristics of trunk muscles during cyclic upper-body perturbations caused by an oscillating pole. Arch. Phys. Med. Rehabil. 2008, 89, 1314–1322. [Google Scholar] [CrossRef] [PubMed]
- Bjerkefors, A.; Ekblom, M.M.; Josefsson, K.; Thorstensson, A. Deep and superficial abdominal muscle activation during trunk stabilization exercises with and without instruction to hollow. Man. Ther. 2010, 15, 502–507. [Google Scholar] [CrossRef] [PubMed]
- Ekstrom, R.A.; Donatelli, R.A.; Carp, K.C. Electromyo-graphic analysis of core trunk, hip, and thigh muscles during 9 rehabilitation exercises. J. Orthop. Sports Phys. Ther. 2007, 37, 754–762. Available online: https://www.jospt.org/doi/abs/10.2519/jospt.2007.2471 (accessed on 7 July 2021). [CrossRef] [PubMed]
- McGill, S.M.; Karpowicz, A. Exercises for spine stabilization: Motion/motor patterns, stability progressions, and clinical technique. Arch. Phys. Med. Rehabil. 2009, 90, 118–126. [Google Scholar] [CrossRef] [PubMed]
- Vanti, C.; Ferrari, S.; Berjano, P.; Villafañe, J.H.; Monticone, M. Responsiveness of the bridge maneuvers in subjects with symptomatic lumbar spondylolisthesis: A prospective cohort study. Physiother. Res. Int. 2017, 22, e1682. [Google Scholar] [CrossRef]
- Kong, Y.-S.; Lee, W.-J.; Park, S.; Jang, G.-U. The effects of prone bridge exercise on trunk muscle thickness in chronic low back pain patients. J. Phys. Ther. Sci. 2015, 27, 2073–2076. [Google Scholar] [CrossRef] [PubMed]
- Guthrie, R.J.; Grindstaff, T.L.; Croy, T.; Ingersoll, C.D.; Saliba, S.A. The effect of traditional bridging or suspension-exercise bridging on lateral abdominal thickness in individuals with low back pain. J. Sport Rehabil. 2012, 21, 151–160. [Google Scholar] [CrossRef] [PubMed]
- Ferrari, S.; Vanti, C.; O’Reilly, C. Clinical presentation and physiotherapy treatment of 4 patients with low back pain and isthmic spondylolisthesis. J. Chiropr. Med. 2012, 11, 94–103. [Google Scholar] [CrossRef]
- Ekstrom, R.A.; Osborn, R.W.; Hauer, P.L. Surface electromyographic analysis of the low back muscles during rehabilitation exercises. J. Orthop. Sports Phys. Ther. 2008, 38, 736–745. [Google Scholar] [CrossRef]
- Xi, X.; Ling, Z.; Wang, C.; Gu, C.; Zhan, X.; Yu, H.; Lu, S.; Tsai, T.Y.; Yu, Y.; Cheng, L. Lumbar segment-dependent soft tissue ar-tifacts of skin markers during in vivo weight-bearing forward-Backward bending. Front. Bioeng. Biotechnol. 2022, 10, 960063. [Google Scholar] [CrossRef]
- Zemp, R.; List, R.; Gülay, T.; Elsig, J.P.; Naxera, J.; Taylor, W.R.; Lorenzetti, S. Soft tissue artefacts of the human back: Comparison of the sagittal curvature of the spine measured using skin markers and an open upright MRI. PLoS ONE 2014, 9, e95426. [Google Scholar] [CrossRef] [PubMed]
- Aylott, C.E.; Puna, R.; Robertson, P.A.; Walker, C. Spinous process morphology: The effect of ageing through adulthood on spinous process size and relationship to sagittal alignment. Eur. Spine J. 2012, 21, 1007–1012. [Google Scholar] [CrossRef] [PubMed]
- Chiou, W.-K.; Lee, Y.-H.; Chen, W.-J.; Lee, M.-Y.; Lin, Y.-H. A non-invasive protocol for the determination of lumbar spine mobility. Clin. Biomech. 1996, 11, 474–480. [Google Scholar] [CrossRef]
- Yang, Z.; Ma, H.T.; Wang, D.; Lee, R. Error analysis on spinal motion measurement using skin mounted sensors. Annu. Int. Conf. IEEE Eng. Med. Biol. Soc. 2008, 2008, 4740–4743. [Google Scholar] [PubMed]
- Ha, T.H.; Saber-Sheikh, K.; Moore, A.P.; Jones, M.P. Measurement of lumbar spine range of movement and coupled motion using inertial sensors—A protocol validity study. Man Ther. 2013, 18, 87–91. [Google Scholar] [CrossRef]
- Eve, L. Analysis of the Spine through a Multibody Model and IMU Technology. Master’s Thesis, Université Catholique de Louvain, Ottignies-Louvain-la-Neuve, Belgium, 2019. [Google Scholar]
- Triantafyllou, A.; Papagiannis, G.; Nikolaou, V.S.; Papagelopoulos, P.J.; Babis, G.C. Similar Biomechanical Behavior in Gait Analysis between Ceramic-on-Ceramic and Ceramic-on-XLPE Total Hip Arthroplasties. Life 2021, 11, 1366. [Google Scholar] [CrossRef]
- Papagiannis, G.; Triantafyllou, A.; Konstantina, Y.G.; Koulouvaris, P.; Anastasiou, A.; Papadopoulos, E.C.; Papagelopoulos, P.J.; Babis, G.C. Biomechanical Factors could Affect Lumbar Disc Reherniation after Microdiscectomy. J. Orthop. Sports Med. 2019, 1, 46–50. [Google Scholar] [CrossRef]


| Item | Healthy (Mean/±SD) | Low Back Pain (Mean/±SD) | p-Value | |
|---|---|---|---|---|
| Total Number | 22 | 25 | ||
| Gender | Male | 12 | 10 | |
| Female | 10 | 15 | ||
| Age | 48.5/±9.3 | 49.4/±11.2 | 0.12 | |
| BMI | 23.3/±1.7 | 24.6/±2.4 | 0.18 | |
| JOA Score | 27.15/±0.73 | 22.2/±1.01 | 0.0003 |
| Item | Group A (Mean/±SD) | Group B (Mean/±SD) | p-Value |
|---|---|---|---|
| Lumbar flexion | 49.33°/±0.94 | 48.83°/±1.12 | 0.24 |
| Lumbar extension | 14.66°/±0.94 | 14.16°/±0.68 | 0.18 |
| Lumbar right lateral flexion | 18.67°/±0.74 | 17.83°/±1.06 | 0.09 |
| Lumbar left lateral flexion | 18.34°/±0.74 | 18.05°/±0.95 | 0.38 |
Disclaimer/Publisher’s Note: The statements, opinions and data contained in all publications are solely those of the individual author(s) and contributor(s) and not of MDPI and/or the editor(s). MDPI and/or the editor(s) disclaim responsibility for any injury to people or property resulting from any ideas, methods, instructions or products referred to in the content. |
© 2023 by the authors. Licensee MDPI, Basel, Switzerland. This article is an open access article distributed under the terms and conditions of the Creative Commons Attribution (CC BY) license (https://creativecommons.org/licenses/by/4.0/).
Share and Cite
Triantafyllou, A.; Papagiannis, G.; Stasi, S.; Gkrilias, P.; Kyriakidou, M.; Kampouroglou, E.; Skouras, A.-Z.; Tsolakis, C.; Georgoudis, G.; Savvidou, O.; et al. Lumbar Kinematics Assessment of Patients with Chronic Low Back Pain in Three Bridge Tests Using Miniaturized Sensors. Bioengineering 2023, 10, 339. https://doi.org/10.3390/bioengineering10030339
Triantafyllou A, Papagiannis G, Stasi S, Gkrilias P, Kyriakidou M, Kampouroglou E, Skouras A-Z, Tsolakis C, Georgoudis G, Savvidou O, et al. Lumbar Kinematics Assessment of Patients with Chronic Low Back Pain in Three Bridge Tests Using Miniaturized Sensors. Bioengineering. 2023; 10(3):339. https://doi.org/10.3390/bioengineering10030339
Chicago/Turabian StyleTriantafyllou, Athanasios, Georgios Papagiannis, Sophia Stasi, Panagiotis Gkrilias, Maria Kyriakidou, Effrosyni Kampouroglou, Apostolos-Zacharias Skouras, Charilaos Tsolakis, George Georgoudis, Olga Savvidou, and et al. 2023. "Lumbar Kinematics Assessment of Patients with Chronic Low Back Pain in Three Bridge Tests Using Miniaturized Sensors" Bioengineering 10, no. 3: 339. https://doi.org/10.3390/bioengineering10030339
APA StyleTriantafyllou, A., Papagiannis, G., Stasi, S., Gkrilias, P., Kyriakidou, M., Kampouroglou, E., Skouras, A.-Z., Tsolakis, C., Georgoudis, G., Savvidou, O., Papagelopoulos, P., & Koulouvaris, P. (2023). Lumbar Kinematics Assessment of Patients with Chronic Low Back Pain in Three Bridge Tests Using Miniaturized Sensors. Bioengineering, 10(3), 339. https://doi.org/10.3390/bioengineering10030339