Optimization System Based on Convolutional Neural Network and Internet of Medical Things for Early Diagnosis of Lung Cancer
Abstract
1. Introduction
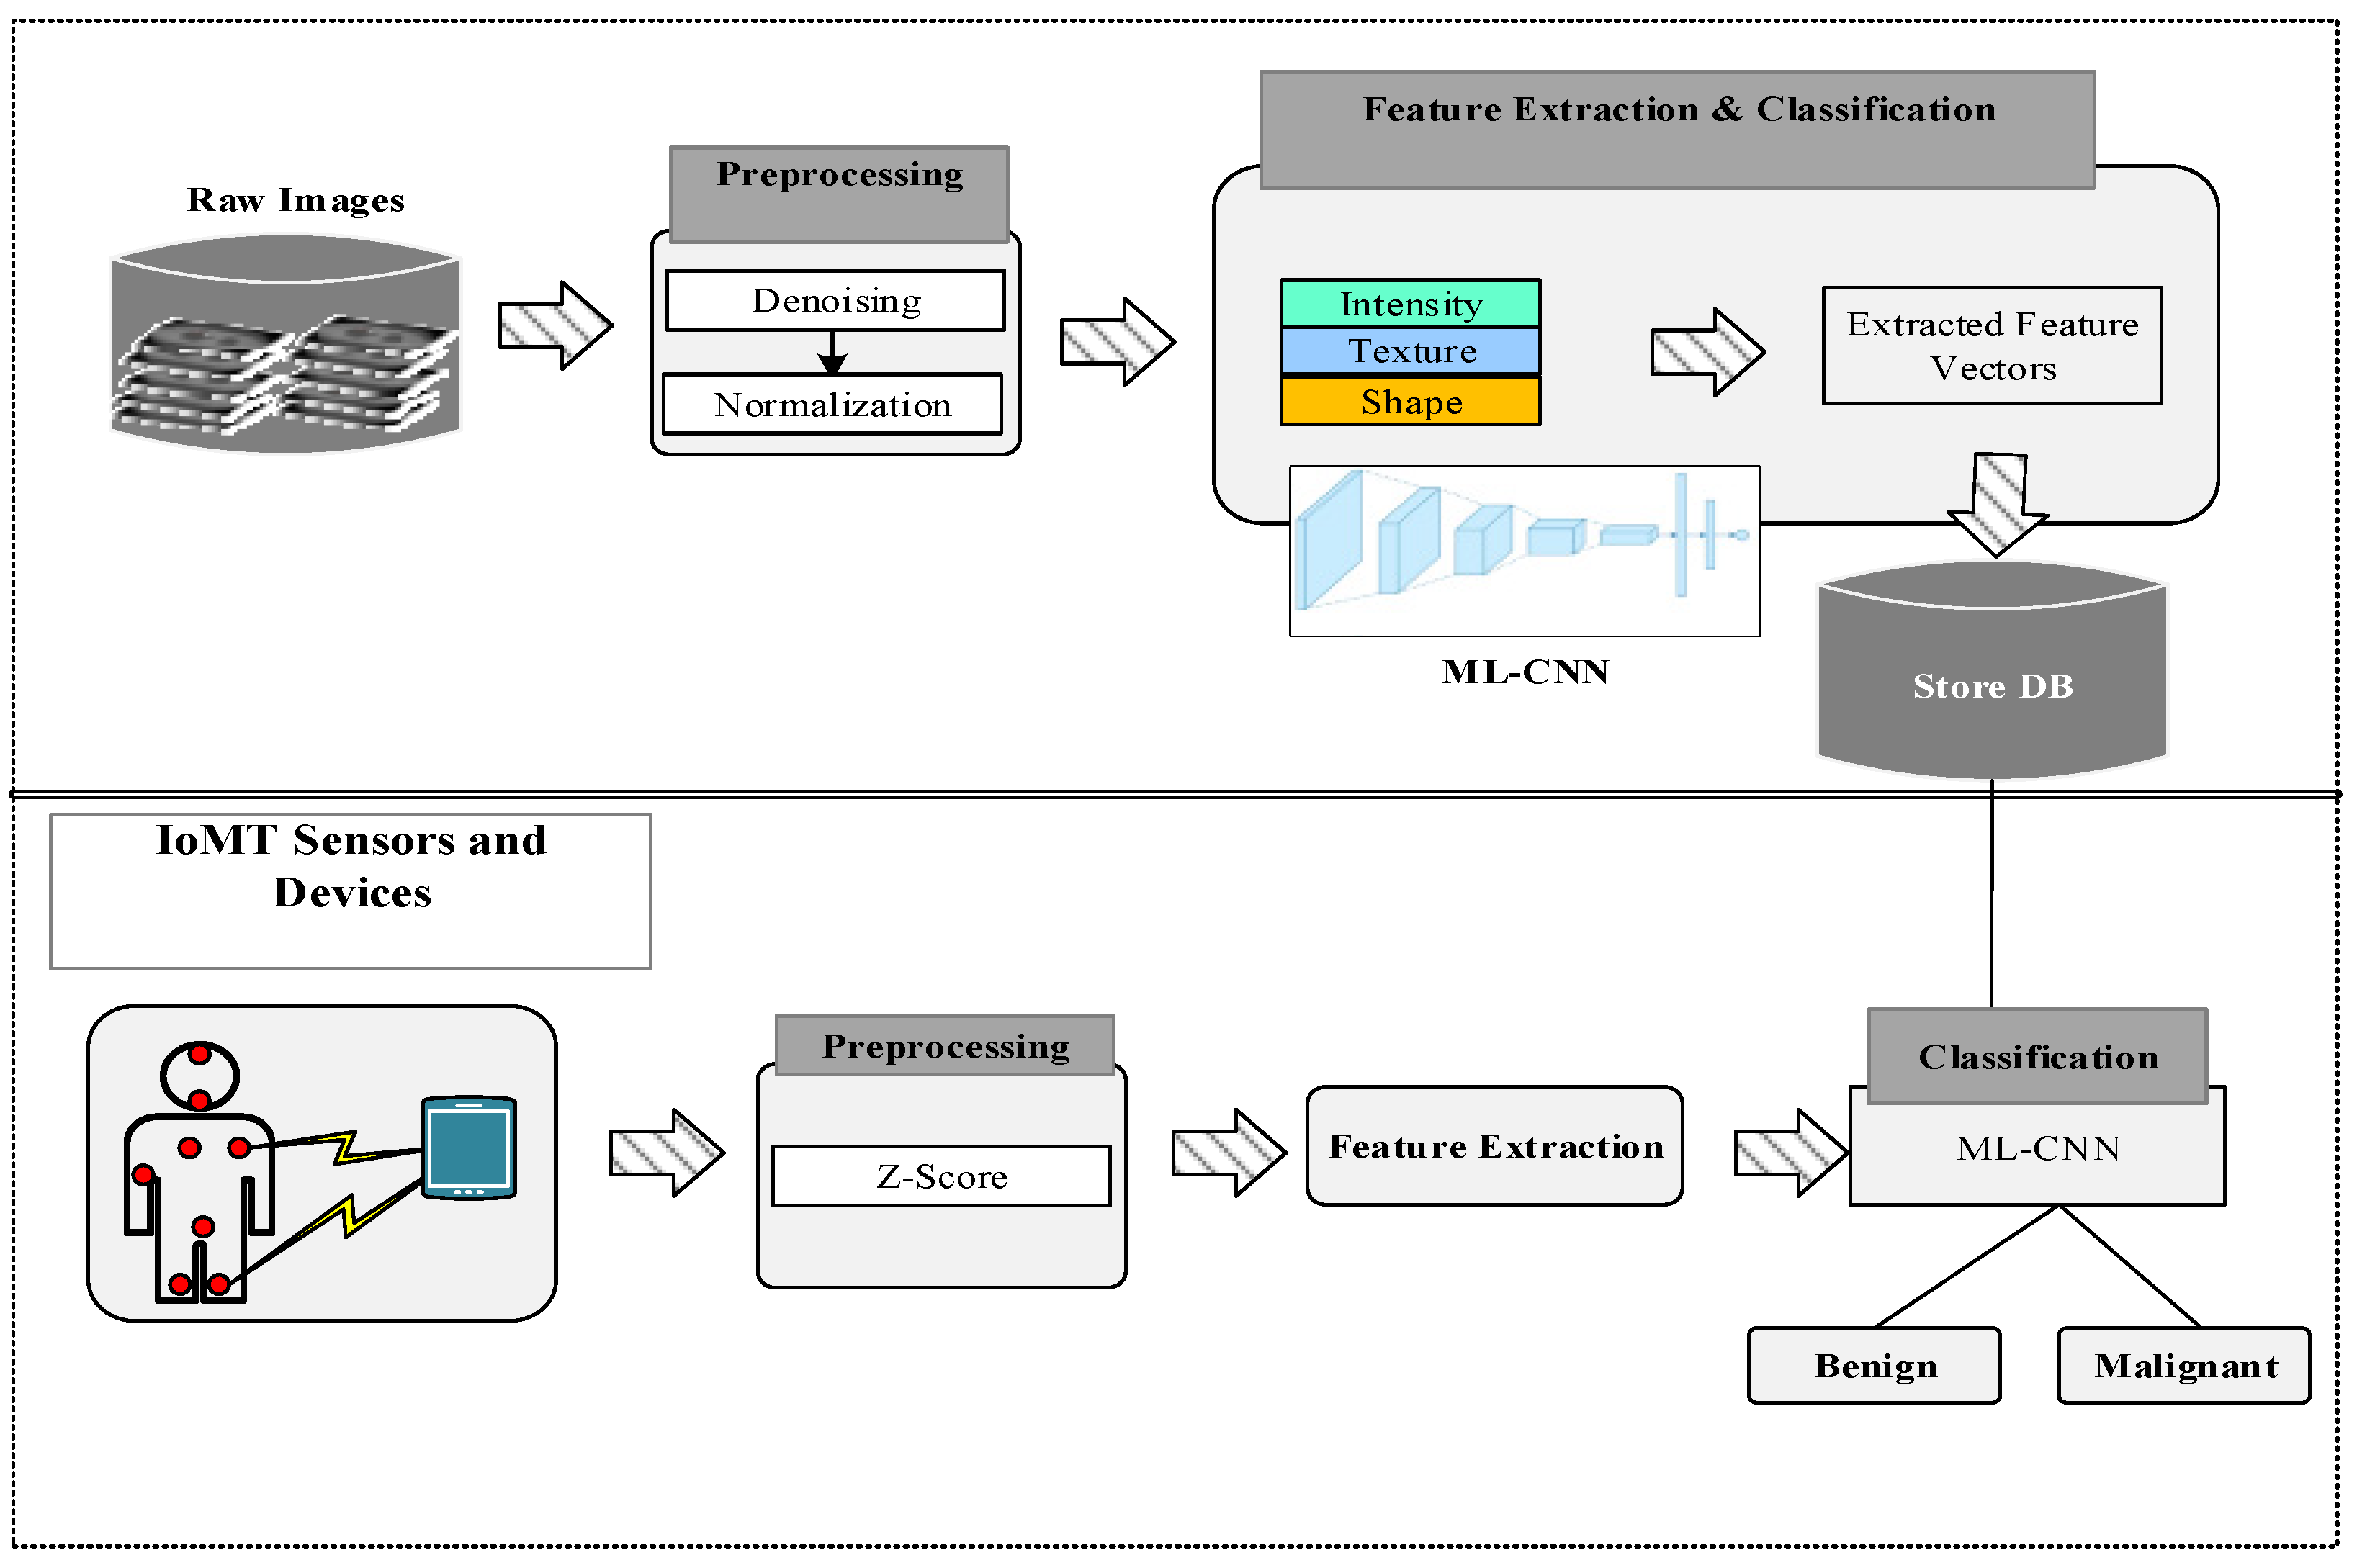
- Image Preprocessing: In this step, image quality is improved by removing undesirable distortions in the image and correcting the geometric transformation of the image (rotation, scaling, and translation). Some of the essential preprocessing tasks are as follows: denoising, contrast enhancement, normalization, and so on [4].
- Feature Extraction: This step converts the given input data into a set of features in a process known as feature extraction. In medical image processing, feature extraction starts with the initial set of reliable data, and feature extraction is performed on borrowed values known as features [5]. This makes the classification method much more satisfactory for prediction. Most medical image classifiers are based on the result of feature extraction in CAD.
- Feature Selection: This step reduces the feature space extracted from the whole image, enhancing the detection rate and reducing the execution and response time. The reduced feature space is obtained by neglecting the irrelevant, noisy, and redundant features and choosing the feature subset that can achieve good performance with the subject of all metrics. In this stage, the dimensionality is reduced [6].
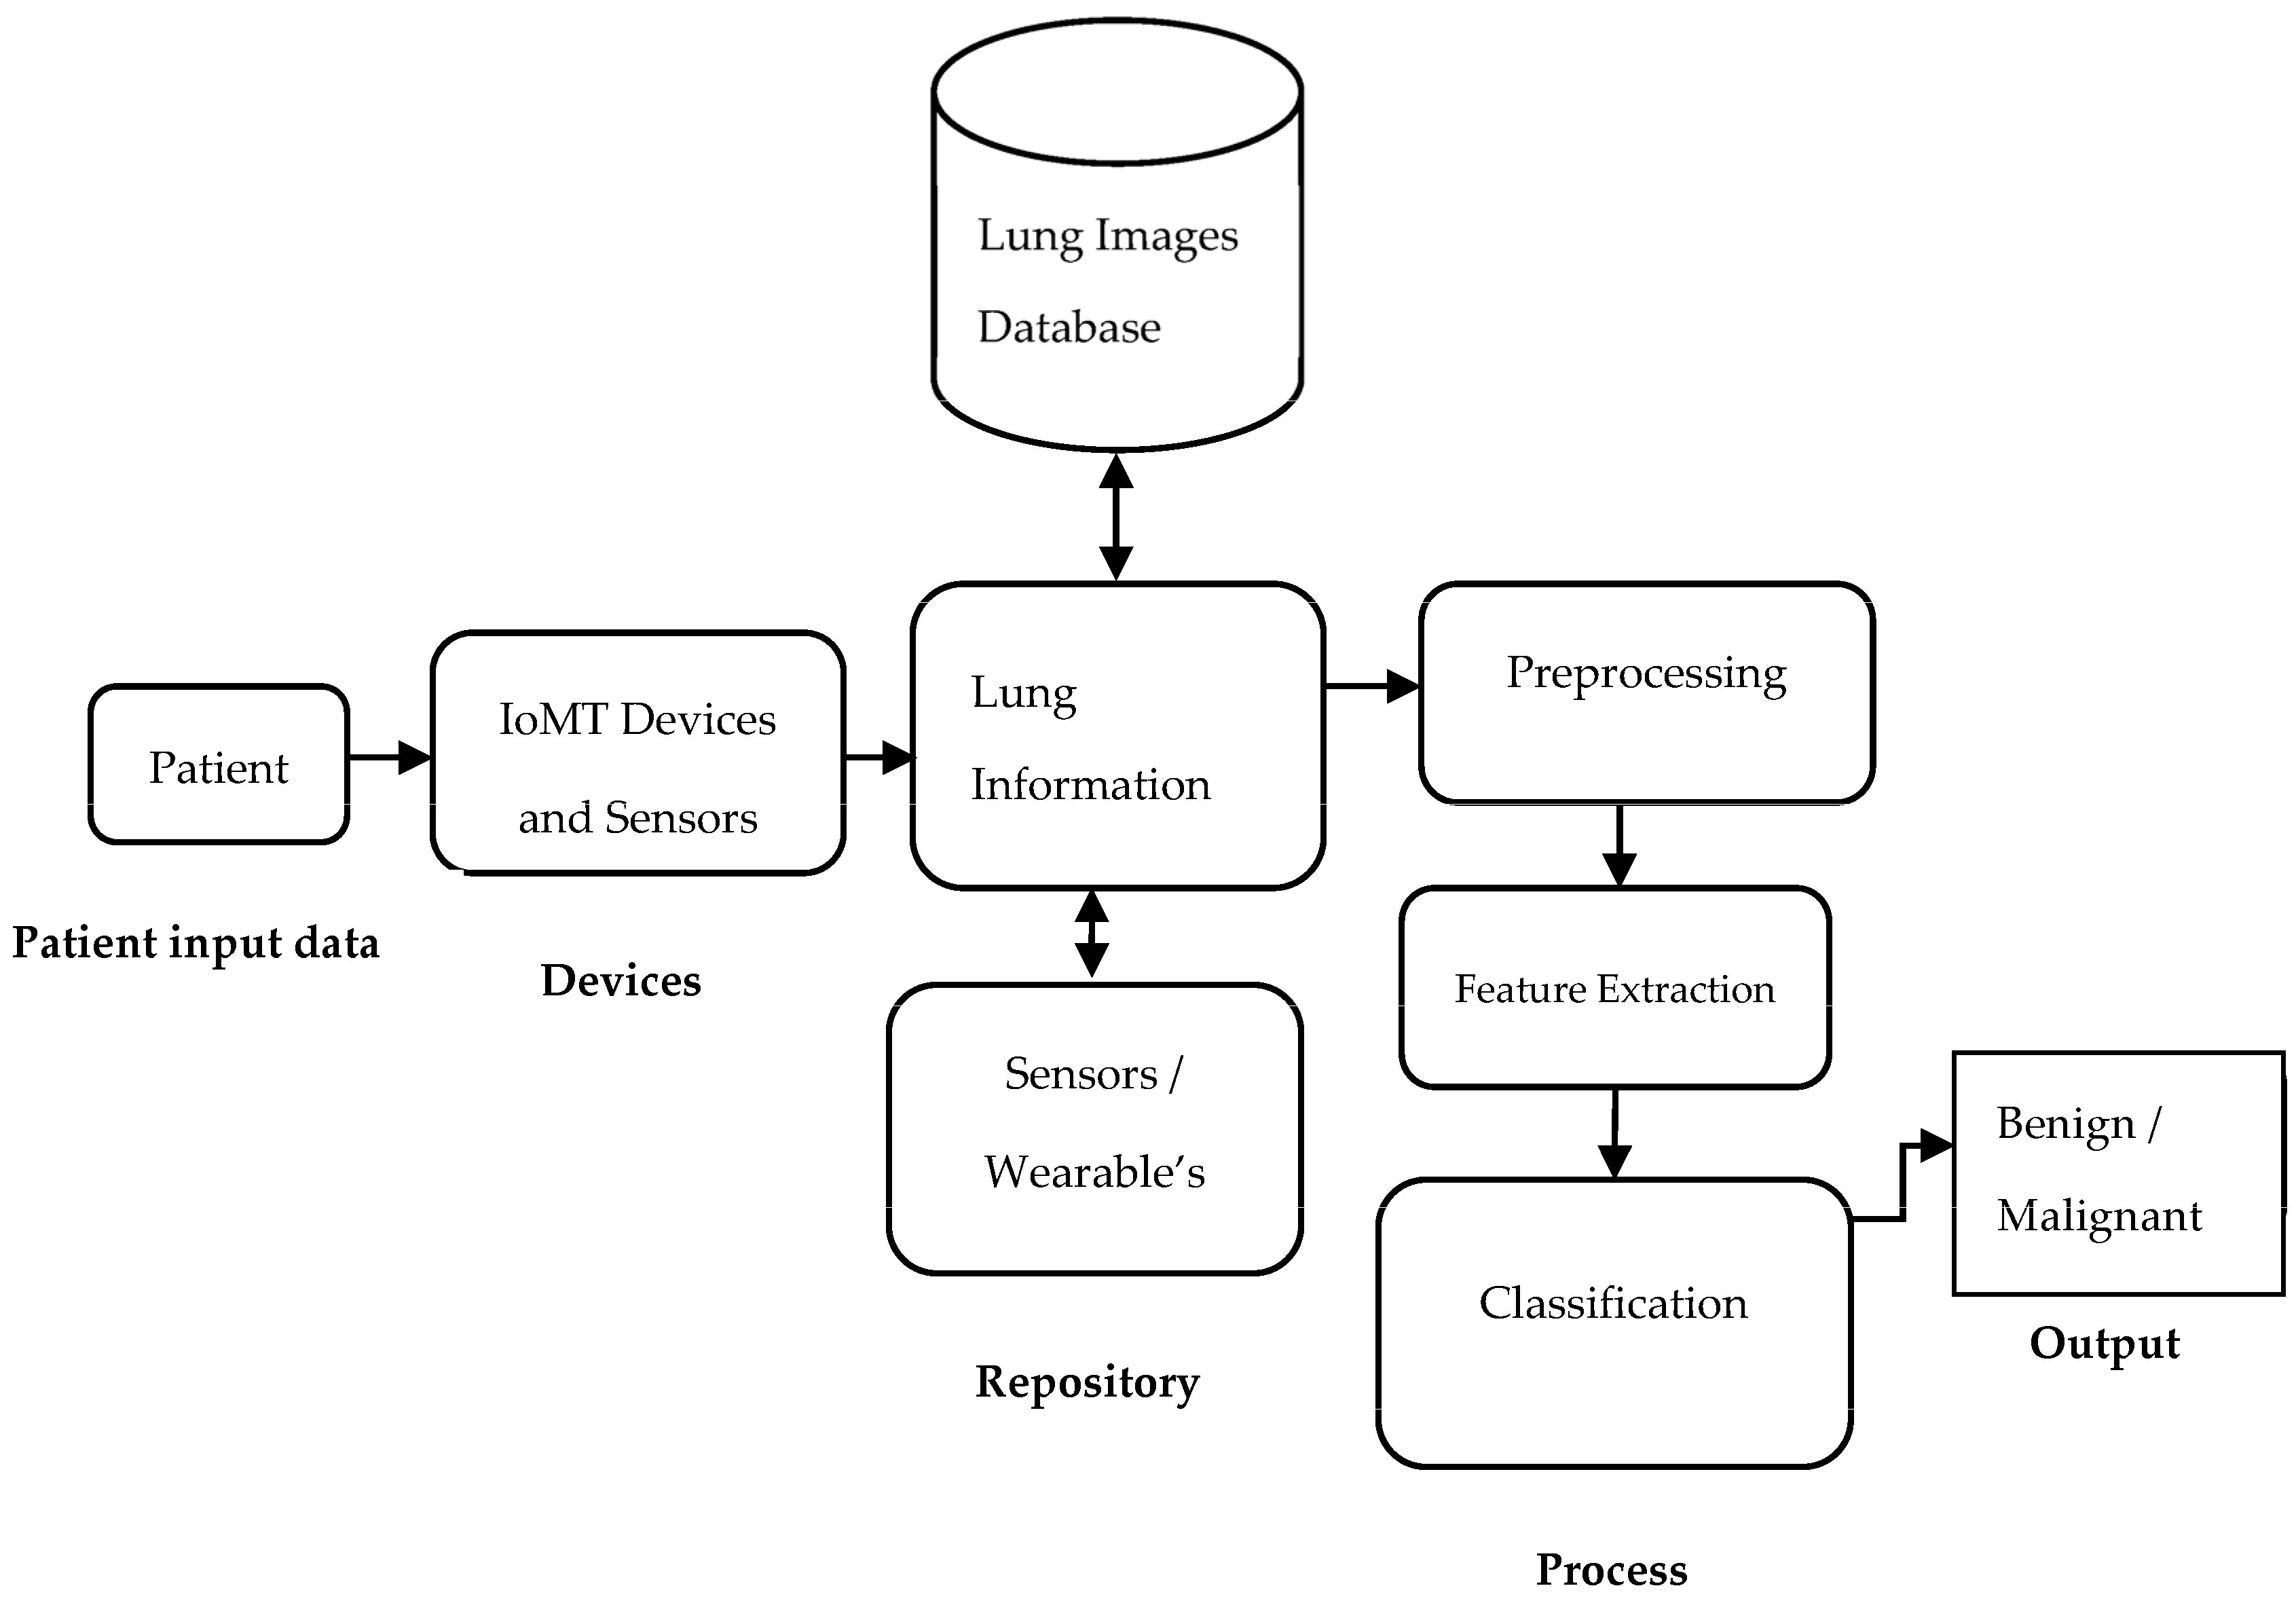
- Classification: In this stage, the selected features are applied to classify each sample to denote the desired class. However, classification is a big issue in medical image analysis tasks. For automatic classification, optimal sets of features are used, and this step needs to be further improved for the better clinical analysis of the human body for diseases [7]. Computer-aided diagnostic systems have proven efficient in finding and diagnosing problems more rapidly and accurately. Unfortunately, this diagnostic technique is prone to several flaws and ambiguities, which might lead to an inaccurate prognosis. Hence, IoT sensor information is fused into the classification model. Machine learning (ML) models are currently used to indicate lung disease in computerized tomography (CT) images. The pipeline architecture is given in Figure 1. The following are the paper’s significant contributions [8]:
- Improved CNN Model: The CNN’s efficiency is optimized to boost the lung cancer diagnostic performance, and its computation is based on various inputs. The CNN calculates the improved range of values based on the extracted features [9].
- Significant Performance Gains of Diagnosis Complexity: The optimized CNN architecture employs fewer convolutional layers by considering relevant information from the convolutional, fully connected, and max-pool layers. The proposed optimized CNN can reach minimal complexity as a result of the primary structural view of the CNN [13,14].
Motivation for Lung Cancer Research
2. Primary Knowledge
3. Related Work
- SVM with wolf optimization and the genetic algorithm has 93.54% accuracy;
- R-CNN with the backpropagation algorithm and Parzen’s probability density has 98.34% accuracy;
- The Gray-Level Co-Occurrence Matrix and chaotic crow search algorithm with a probabilistic neural network provide 90% accuracy;
- The CNN with Association Rules and conventional Decision Tree (DT) provides 96.81% accuracy;
- Gaussian filtering with the sunflower optimization-based wavelet neural network has less than 90% accuracy;
- Enhanced Thermal Exchange Optimization and Kapur entropy maximization and classification techniques have less than 90% accuracy;
- The convolutional neural network, in nine-fold cross-validation, provides 98.32% accuracy.
4. System Model
4.1. Preprocessing
4.2. Feature Extraction
- Intensity-based features: These types of features describe the information on the intensity and histogram values located in the image (visibility is considered in the grayscale or color intensity histogram).
- Shape-based features: These give image information about the shape and size.
- Texture-based features: These describe the image intensity variations on the surface and estimate the properties of coarseness, smoothness, and regularity.
- Convolution Layers: This is the input layer that acquires the inputs, i.e., signals. This layer normalizes the range of all inputs into a single value for fast processing.
- Pooling Layers: This layer’s purpose is to minimize the input size, which automatically influences the higher performance.
- Activation Layer: This layer uses the ReLU activation function, which maximizes the outputs for non-linear cases.
- Fully Connected Layer: This layer uses an activation function called softmax to control the output range. The proposed CNN computes the weight values for a given problem between neighboring neurons.
| Algorithm 1. ML CNN classification pseudocode |
| Input: Sensed and image patterns Ffn |
| Let C be the size of the total sequence to be classified |
| 1. Ni = 3 // no. of layers |
| 2. Nr = 1 // no. of runs |
| 3. Let Ns // no. of samples |
| 4. Let Nf // no. of features |
| Initiallize traning set size (t фc) |
| Testing set size (t ψc) |
| // 80% training and 20% testing |
| Extract features from the sequence and create a list of features |
| Let ffn be the feature set extracted |
| Initialize CNN parameters |
| 5. Let batch size = 1 |
| 6. No. of epochs = 1 |
| Let Lbs be the labels corresponding to the selected features |
| Let Nc be the number of classes to be identified |
| 7. Load ffn // load optimized data |
| 8. For i=1 to Nl |
| Split Ffs (feature set into T (feature subset)) |
| 9. For j = 1 to T |
| To find backpropagation CNN |
| 10. For i = 1 to size (t фc) |
| 11. N1. Ffn = t фc (i,:) |
| 12. End |
| 13. For i = 2:Nl |
| 14. Layer = i |
| 15. if Nl(i) = t фc (i,:) |
| 16. Val = Nl(i) ∗ t фc (i,:) |
| 17. For j = 1:length(Val) |
| 18. z = 0; |
| 19. For k = e:length(Val) |
| 20. Kk = Kk + 1 |
| 21. Val = Nl(i-1) ∗ t ψc (k) |
| 22. Val1 = Nl(i) ∗ t ψc (k(;,:,1) |
| 23. End |
| 24. End |
| 25. End |
| Let ffn be feature in Ffs(i,j) |
| Trained TCLF estimates ffn |
| 26. Let Rsort= sort(Tout) //rank level |
| 27. Let accuracy = mean(Tclf,1) |
| 28. Tclf = ∑i(Tout/Rsort) |
| 29. cnti=∑ (Ffn) in belonging to samples Ns |
| 30. End |
| 31. Compute Total count as CntT = Cnti |
| Compute probabilistic components for each class as |
| 32. For i = 1 to Nc |
| 33. Pcomp(i) = cnti/cntT |
| 34. End |
| 35. End (Ending of firt i for loop) |
| Output: Classified output |
5. Experimental Results and Discussion
5.1. Implementation
5.2. Dataset Description
- GGO: This is a sign showing hazy maximized attenuation in the lung and vascular and bronchial margins. It is suggestive of lung adenocarcinoma and bronchioloalveolar carcinoma.
- Lobulation: This is an indication that the septae of connective tissue, which contain fibroblasts recognised as coming from the perithymic mesenchyme, are growing (malignant lesion).
- Calcification: This is a sign of the deposition of insoluble salts (magnesium and calcium). Its characteristics, such as distribution and morphology, are significant in distinguishing whether a lung nodule is benign or malignant. Popcorn and dense calcifications indicate that the given lung image is benign, and the central regions of lesions, spotted lesions, and irregular appearance indicate malignancy. It is determined from lung nodule areas with high-density pixels, and CT scan ranges are above 100 HU (Hounsfield Units).
- Cavity and Vacuoles: These are signs of hollow spaces, represented by tissues. The vacuole is a type of cavity. It is suggestive of bronchioloalveolar carcinoma and adenocarcinoma, and the cavity is connected to tumors greater than 3 mm.
- Speculation: This is a sign caused by stellate distortion in tissue lesions. The cancerous tumor’s intrusion causes this, which is one of the common lung nodule signs correlated with a desmoplastic response. This result indicates the fibrotic strand radiates with lung parenchyma. It is a sign of a malignant lesion.
- Pleural Indentation: This is a sign of a tumor-affected area, which is diagnosed in the tissues. The sign is connected with peripheral adenocarcinomas that comprise central or subpleural anthracitic and fibrotic foci.
- Bronchial Mucus Plugs (BMPs): These are also referred to as focal opacities. They vary in density and may have a liquefied density, which is above 100 HU. They are due to allergic bronchopulmonary aspergillosis and represent Intrabronchial Air, which the mucus transforms.
- Air Bronchogram: This is a sign of the formation of low-attenuation bronchi over the background of the high-attenuation airless lung. It is due to (1) proximal airway patency, (b) the removal of alveolar air, which produces absorption (atelectasis) or replacement (pneumonia), or (3) the presence of both symptoms. In very rare cases, the air displacement is the result of the marked Interstitial Expansion (Lymphoma).
- Obstructive Pneumonia: This rectangle mark available in Figure 5 is a sign of a small lung nodule volume, which is due to distal collapse. This is mainly due to proximal bronchial blocking. It is combined with adenocarcinoma and squamous cell carcinoma. For a visual representation, it represents the cuneate or flabellate area with increased density. Among the descriptions of lung nodule signs, radiologists have concluded that the GGO, Cavity and Vacuoles, Lobulation, Bronchial Mucus Plugs, and Pleural Indentation represent the malignant lung nodule lesions. Air Bronchogram, Obstructive Pneumonia, and Calcification are classified as benign or malignant lesions. Figure 5 presents the sites of nine lung nodule signs in images in the database.
5.3. Performance Measures
6. Conclusions
Author Contributions
Funding
Institutional Review Board Statement
Informed Consent Statement
Data Availability Statement
Conflicts of Interest
References
- Karthick, K.; Rajkumar, S.; Selvanathan, N.; Saravanan, U.K.; Murali, M.; Dhiyanesh, B. Analysis of Lung Cancer Detection Based on the Machine Learning Algorithm and IOT. In Proceedings of the 2021 6th International Conference on Communication and Electronics Systems (ICCES), Coimbatre, India, 8–10 July 2021; pp. 1–8. [Google Scholar]
- Villegas, D.; Martínez, A.; Quesada-López, C.; Jenkins, M. IoT for Cancer Treatment: A Mapping Study. In Proceedings of the 2020 15th Iberian Conference on Information Systems and Technologies (CISTI), Seville, Spain, 24–27 June 2020; pp. 1–6. [Google Scholar]
- Ng, T.L.; Morgan, R.L.; Patil, T.; Barón, A.E.; Smith, D.E.; Camidge, D.R. Detection of oligoprogressive disease in oncogene-addicted non-small cell lung cancer using PET/CT versus CT in patients receiving a tyrosine kinase inhibitor. Lung Cancer 2018, 126, 112–118. [Google Scholar] [CrossRef] [PubMed]
- Jony, M.H.; Johora, F.T.; Khatun, P.; Rana, H.K. Detection of Lung Cancer from CT Scan Images using GLCM and SVM. In Proceedings of the 2019 1st International Conference on Advances in Science, Engineering and Robotics Technology (ICASERT), Dhaka, Bangladesh, 3–5 May 2019; pp. 1–6. [Google Scholar] [CrossRef]
- Zanon, M.; Pacini, G.S.; de Souza, V.V.S.; Marchiori, E.; Meirelles, G.S.P.; Szarf, G.; Torres, F.S.; Hochhegger, B. Early detection of lung cancer using ultra-low-dose computed tomography in coronary CT angiography scans among patients with suspected coronary heart disease. Lung Cancer 2017, 114, 1–5. [Google Scholar] [CrossRef] [PubMed]
- Mishra, S.; Thakkar, H.K.; Mallick, P.K.; Tiwari, P.; Alamri, A. A sustainable IoHT based computationally intelligent healthcare monitoring system for lung cancer risk detection. Sustain. Cities Soc. 2021, 72, 103079. [Google Scholar] [CrossRef]
- Alakwaa, W.; Mohammad, N.; Amr, B. Lung cancer detection and classification with 3D convolutional neural network (3D-CNN). Int. J. Adv. Comput. Sci. Appl. 2017, 8, 8. [Google Scholar] [CrossRef]
- Hatuwal, B.K.; Himal, C.T. Lung cancer detection using convolutional neural network on histopathological images. Int. J. Comput. Trends Technol. 2020, 68, 10, 21–24. [Google Scholar] [CrossRef]
- Sasikumar, S.; Renjith, P.N.; Ramesh, K.; Sankaran, K.S. Attention Based Recurrent Neural Network for Lung Cancer Detection. In Proceedings of the 2020 Fourth International Conference on I-SMAC (IoT in Social, Mobile, Analytics and Cloud) (I-SMAC), Palladam, India, 7–9 October 2020; pp. 720–724. [Google Scholar]
- Al-Yasriy, H.F.; AL-Husieny, M.S.; Mohsen, F.Y.; Khalil, E.A.; Hassan, Z.S. Diagnosis of lung cancer based on CT scans using CNN. IOP Conf. Ser. Mater. Sci. Eng. 2020, 928, 022035. [Google Scholar] [CrossRef]
- Kirubakaran, J.; Venkatesan, G.K.D.P.; Kumar, K.S.; Kumaresan, M.; Annamalai, S. Echo state learned compositional pattern neural networks for the early diagnosis of cancer on the internet of medical things platform. J. Ambient. Intell. Humaniz. Comput. 2020, 12, 3303–3316. [Google Scholar] [CrossRef]
- Bahat, B.; Görgel, P. Lung Cancer Diagnosis via Gabor Filters and Convolutional Neural Networks. In Proceedings of the 2021 Innovations in Intelligent Systems and Applications Conference (ASYU), Elazig, Turkey, 6–8 October 2021; pp. 1–6. [Google Scholar]
- Hosseini, H.M.; Monsefi, R.; Shadroo, S. Deep Learning Applications for Lung Cancer Diagnosis: A systematic review. arXiv 2020, arXiv:2201.00227. [Google Scholar]
- Ozdemir, O.; Russell, R.L.; Berlin, A.A. A 3D Probabilistic Deep Learning System for Detection and Diagnosis of Lung Cancer Using Low-Dose CT Scans. IEEE Trans. Med. Imaging 2019, 39, 1419–1429. [Google Scholar] [CrossRef]
- Capuano, R.; Catini, A.; Paolesse, R.; Di Natale, C. Sensors for Lung Cancer Diagnosis. J. Clin. Med. 2019, 8, 235. [Google Scholar] [CrossRef]
- Shimizu, R.; Yanagawa, S.; Monde, Y.; Yamagishi, H.; Hamada, M.; Shimizu, T.; Kuroda, T. Deep learning appli-cation trial to lung cancer diagnosis for medical sensor systems. In Proceedings of the 2016 International SoC Design Conference (ISOCC), Jeju, Korea, 23–26 October 2016; pp. 191–192. [Google Scholar]
- Mishra, S.; Chaudhary, N.K.; Asthana, P.; Kumar, A. Deep 3d convolutional neural network for automated lung cancer diagnosis. In Computing and Network Sustainability: Proceedings of IRSCNS 2018; Springer: Singapore, 2019; pp. 157–165. [Google Scholar]
- Zhang, Y.; Simoff, M.J.; Ost, D.; Wagner, O.J.; Lavin, J.; Nauman, B.; Hsieh, M.-C.; Wu, X.-C.; Pettiford, B.; Shi, L. Understanding the patient journey to diagnosis of lung cancer. BMC Cancer 2021, 21, 402. [Google Scholar] [CrossRef] [PubMed]
- Alsammed, S.M.Z.A. Implementation of Lung Cancer Diagnosis based on DNN in Healthcare System. Webology 2021, 18, 798–812. [Google Scholar] [CrossRef]
- Pradhan, K.; Chawla, P. Medical Internet of things using machine learning algorithms for lung cancer detection. J. Manag. Anal. 2020, 7, 591–623. [Google Scholar] [CrossRef]
- Valluru, D.; Jeya, I.J.S. IoT with cloud based lung cancer diagnosis model using optimal support vector machine. Heal. Care Manag. Sci. 2019, 23, 670–679. [Google Scholar] [CrossRef] [PubMed]
- Souza, L.F.D.F.; Silva, I.C.L.; Marques, A.G.; Silva, F.H.D.S.; Nunes, V.X.; Hassan, M.M.; Filho, P.P.R. Internet of Medical Things: An Effective and Fully Automatic IoT Approach Using Deep Learning and Fine-Tuning to Lung CT Segmentation. Sensors 2020, 20, 6711. [Google Scholar] [CrossRef]
- Chakravarthy, S.; Rajaguru, H. Lung Cancer Detection using Probabilistic Neural Network with modified Crow-Search Algorithm. Asian Pac. J. Cancer Prev. 2019, 20, 2159–2166. [Google Scholar] [CrossRef]
- Palani, D.; Venkatalakshmi, K. An IoT Based Predictive Modelling for Predicting Lung Cancer Using Fuzzy Cluster Based Segmentation and Classification. J. Med. Syst. 2018, 43, 21. [Google Scholar] [CrossRef]
- Faruqui, N.; Abu Yousuf, M.; Whaiduzzaman; Azad, A.; Barrosean, A.; Moni, M.A. LungNet: A hybrid deep-CNN model for lung cancer diagnosis using CT and wearable sensor-based medical IoT data. Comput. Biol. Med. 2021, 139, 104961. [Google Scholar] [CrossRef]
- Ozsandikcioglu, U.; Atasoy, A.; Yapici, S. Hybrid Sensor Based E-Nose For Lung Cancer Diagnosis. In Proceedings of the 2018 IEEE International Symposium on Medical Measurements and Applications (MeMeA), Rome, Italy, 11–13 2018; pp. 1–5. [Google Scholar]
- Kiran, S.V.; Kaur, I.; Thangaraj, K.; Saveetha, V.; Grace, R.K.; Arulkumar, N. Machine Learning with Data Science-Enabled Lung Cancer Diagnosis and Classification Using Computed Tomography Images. Int. J. Image Graph. 2021, 1, 2240002. [Google Scholar] [CrossRef]
- Shan, R.; Rezaei, T. Lung Cancer Diagnosis Based on an ANN Optimized by Improved TEO Algorithm. Comput. Intell. Neurosci. 2021, 2021, 6078524. [Google Scholar] [CrossRef]
- Jeffree, A.I.; Karman, S.; Ibrahim, S.; Ab Karim, M.S.; Rozali, S. Biosensors Approach for Lung Cancer Diagnosis—A Review. In Lecture Notes in Mechanical Engineering, Proceedings of the 6th International Conference on Robot Intelligence Technology and Applications, Kuala Lumpur, Malaysia, 16–18 December 2018; Springer: Singapore, 2020; pp. 425–435. [Google Scholar]
- Rustam, Z.; Hartini, S.; Pratama, R.Y.; Yunus, R.E.; Hidayat, R. Analysis of Architecture Combining Convolutional Neural Network (CNN) and Kernel K-Means Clustering for Lung Cancer Diagnosis. Int. J. Adv. Sci. Eng. Inf. Technol. 2020, 10, 1200–1206. [Google Scholar] [CrossRef]
- Anitha, J.; Agnes, S.A. Appraisal of deep-learning techniques on computer-aided lung cancer diagnosis with computed tomography screening. J. Med. Phys. 2020, 45, 98–106. [Google Scholar] [CrossRef] [PubMed]
- Chenyang, L.; Chan, S.-C. A Joint Detection and Recognition Approach to Lung Cancer Diagnosis From CT Images With Label Uncertainty. IEEE Access 2020, 8, 228905–228921. [Google Scholar] [CrossRef]
- Wang, Q.; Zhou, Y.; Huang, J.; Liu, Z.; Li, L.; Xu, W.; Cheng, J.-Z. Hierarchical Attention-Based Multiple Instance Learning Network for Patient-Level Lung Cancer Diagnosis. In Proceedings of the 2020 IEEE International Conference on Bioinformatics and Biomedicine (BIBM), Seoul, Korea, 16–19 December 2020; pp. 1156–1160. [Google Scholar]
- Liu, Z.; He, H.; Yan, S.; Wang, Y.; Yang, T.; Li, G. End-to-End Models to Imitate Traditional Chinese Medicine Syn-drome Differentiation in Lung Cancer Diagnosis: Model Development and Validation. JMIR Med. Inform. 2020, 8, e17821. [Google Scholar] [CrossRef] [PubMed]
- Dodia, S.; Annappa, B.; Mahesh, P.A. Recent advancements in deep learning based lung cancer detection: A sys-tematic review. Eng. Appl. Artif. Intell. 2022, 116, 105490. [Google Scholar] [CrossRef]
- Civit-Masot, J.; Bañuls-Beaterio, A.; Domínguez-Morales, M.; Rivas-Pérez, M.; Muñoz-Saavedra, L.; Corral, J.M.R. Non-small cell lung cancer diagnosis aid with histopathological images using Explainable Deep Learning techniques. Comput. Methods Programs Biomed. 2022, 226, 107108. [Google Scholar] [CrossRef]






| Feature Type | Feature | Description | Formula |
|---|---|---|---|
| Texture features | Correlation | It is defined by the similar direction of rows and columns | |
| Contrast | It indicates the brightness or contrast for each nodule. When the contrast level is high, texture features are not clear. | ||
| Homogeneity | It is defined as the distribution closeness of entities in the matrix. It is computed in all directions of the image. | ||
| Entropy | It is defined by the complexity of textures or unevenness | is the normalized image matrix for one pixel coordinate, is the total number of distinct gray levels in the image | |
| Shape features | Area | The number of pixels in the largest axial slice computes it multiplied by the resolution of the pixels | |
| Aspect Ratio | It is computed by the major axis and minor axis length | ||
| Roundness | It is computed by the similarity of the lung nodule region to the circular shape | ||
| Perimeter | It is defined as the structural property for the list of coordinates and also the sum of the distance from each coordinate | ||
| Circularity | It is computed by the 〖lar〗_aS of each lung nodule image | is the area of one pixel in the shape of , and is the ith pixel coordinates, A is the nodule area, and L is the nodule region boundary length, is the major axis length and is the minor axis length. | |
| Intensity features | Uniformity | It is defined by the intensity uniformity of the Histograms | |
| Mean | The average intensity measure represents it | ||
| Standard Variance | It is represented by the 2nd moment of the average values | ||
| Kurtosis | It is defined by the 4th moment of mean | ||
| Skewness | It is defined by the 3rd moment of the mean values | ||
| Smoothness | The relative intensity differences in the given region define it | Is a random attribute that indicates the intensity, H(R_i) is the Histogram of the Intensity in the nodule region, l denotes the number of potential intensity levels, and σ represents the standard deviation |
| Feature Name | |
|---|---|
| Texture features | Correlation |
| Contrast | |
| Homogeneity | |
| Sum of square variance | |
| Spectral, Spatial, and Entropy | |
| Shape features | Area |
| Irregularity | |
| Roundness | |
| Perimeter | |
| Circularity | |
| Intensity features | Intensity |
| Mean | |
| Standard Variance | |
| Kurtosis | |
| Skewness | |
| Median |
| Nodule Size | <4 mm, 4–7 mm, 8–20 mm, and >20 mm |
|---|---|
| Speculation | The range between 0 and 1 |
| Diameter | Nodule diameter |
| Location | Upper lobe or not |
| Morphology | Smooth, Lobulated, Spiculated, and Irregular |
| Methods Used | Parameters | Description |
|---|---|---|
| CNN | Number of Epochs | 5 |
| Non-Linear Activation Function | ReLU | |
| Activation Function | Softmax | |
| Learning Function | Adam Optimizer | |
| PSO | Number of Particles | 10 |
| Iterations | 10 | |
| Inertial Weight (W) | 0.85 | |
| Social Constant (W2) | 2 | |
| Cognitive Constant (W1) | 2 |
| CT Imaging Scans | Annotated ROIs | |
|---|---|---|
| GGO | 25–2D 19–3D | 45–2D 166–3D |
| Lobulation | 21 | 41 |
| Calcification | 20 | 47 |
| Cavity and Vacuoles | 75 | 147 |
| Speculation | 18 | 29 |
| Pleural Dragging | 26 | 80 |
| Air Bronchogram | 22 | 23 |
| Bronchial Mucus Plugs | 19 | 81 |
| Obstructive Pneumonia | 16 | 18 |
| Sum | 271 | 677 |
| Nodule Description | Number of Nodules |
|---|---|
| No. of nodules or lesions marked by at least 1 radiologist | 7371 |
| No. of <3 mm nodules marked by at least 1 radiologist | 2669 |
| No. of <3 mm nodules marked by all 4 radiologists | 928 |
| Formula | |
|---|---|
| Accuracy | |
| Sensitivity | |
| Specificity | |
| Precision | |
| F-Score | |
| where TP = true positive, TN = true negative, FP = false positive, FN = false negative | |
| Approach | Description | Merits and Demerits |
|---|---|---|
| Genetic algorithm | A genetic algorithm is an evolutionary algorithm that deals with chromosomes. Operations such as crossover and mutation are performed. | Merits: 1. Parallel processing 2. Flexible |
| Demerits: 1. Gives close to the optimal solution 2. Lot of computations are required | ||
| Ant Colony Optimization | This algorithm is based on the behavior of ants, which deposit chemical components called pheromones. | Merits: 1. Faster discovery with appropriate solutions 2. Solves travel salesman problem |
| Demerits: 1. Inappropriate for continuous problems 2. Weakened local search | ||
| Bee Colony Optimization | Individual proactive abilities and self-organizing capacity are developed with honey bee behavior | Merits: 1. Faster convergence 2. Uses fewer control parameters |
| Demerits: 1. Allows only a limited number of search space | ||
| Particle swarm optimization | The population-based algorithm initializes the input and evaluates the fitness value. | Merits:– 1. Robust 2. Less computation time |
| Algorithm | Attacks | Accuracy (%) | Precision (%) | Sensitivity (%) | Specificity (%) | F-Measure (%) |
|---|---|---|---|---|---|---|
| GA | 2000 | 84.52 | 86.75 | 85.45 | 86.75 | 85.7 |
| 4000 | 86.54 | 87.45 | 86.12 | 87.45 | 85.9 | |
| 6000 | 87.45 | 88.15 | 86.75 | 88.78 | 85.6 | |
| 8000 | 88.02 | 88.16 | 86.78 | 88.95 | 85.9 | |
| 10,000 | 88.15 | 88.19 | 86.79 | 88.23 | 86 | |
| ACO | 2000 | 88.45 | 88.78 | 88.91 | 88.96 | 89 |
| 4000 | 88.6 | 88.75 | 88.90 | 88.97 | 89.15 | |
| 6000 | 88.69 | 88.89 | 88.92 | 88.98 | 89.45 | |
| 8000 | 88.72 | 88.90 | 88.94 | 88.98 | 89.55 | |
| 10,000 | 89.75 | 88.91 | 88.95 | 88.99 | 89.6 | |
| BCO | 2000 | 90.1 | 91.23 | 91.25 | 91.44 | 91.63 |
| 4000 | 90.25 | 91.45 | 91.35 | 91.56 | 91.65 | |
| 6000 | 90.26 | 91.75 | 91.39 | 91.58 | 91.67 | |
| 8000 | 90.32 | 91.88 | 91.40 | 91.60 | 91.69 | |
| 10,000 | 90.45 | 91.89 | 91.45 | 91.62 | 91.85 | |
| PSO | 2000 | 98.1 | 98.23 | 98.25 | 98.44 | 98.63 |
| 4000 | 98.25 | 98.45 | 98.35 | 98.56 | 98.65 | |
| 6000 | 98.26 | 98.75 | 98.39 | 98.58 | 98.67 | |
| 8000 | 98.32 | 98.88 | 98.40 | 98.60 | 98.69 | |
| 10,000 | 98.45 | 98.89 | 98.45 | 98.62 | 98.85 |
| F2 | h | Accuracy | |
|---|---|---|---|
| 0.8 | 0.6 | 1.0 | 98.45 |
| 0.8 | 0.6 | 0.9 | 97.73 |
| 0.8 | 0.6 | 1.0 | 98.12 |
| 0.7 | 0.6 | 1.0 | 98.09 |
| 0.6 | 0.5 | 1.0 | 99.46 |
| Iterations | Accuracy | Precision | F-Measure | |
|---|---|---|---|---|
| 2500 | 25 | 97.90 | 97.89 | 97.12 |
| 2500 | 26 | 98.06 | 97.03 | 97.56 |
| 2500 | 27 | 98.45 | 96.43 | 96.49 |
| 2500 | 28 | 98.23 | 97.63 | 98.62 |
| 2500 | 29 | 99.56 | 99.54 | 99.32 |
| 2500 | 30 | 97.96 | 97.87 | 97.51 |
| Features | Accuracy | Precision | F-Measure |
|---|---|---|---|
| 10 | 99.45 | 99.03 | 99.89 |
| 12 | 98.09 | 97.46 | 97.43 |
| 15 | 98.83 | 98.03 | 98.69 |
| 18 | 98.23 | 98.67 | 97.52 |
| 20 | 97.12 | 97.23 | 98.86 |
Disclaimer/Publisher’s Note: The statements, opinions and data contained in all publications are solely those of the individual author(s) and contributor(s) and not of MDPI and/or the editor(s). MDPI and/or the editor(s) disclaim responsibility for any injury to people or property resulting from any ideas, methods, instructions or products referred to in the content. |
© 2023 by the authors. Licensee MDPI, Basel, Switzerland. This article is an open access article distributed under the terms and conditions of the Creative Commons Attribution (CC BY) license (https://creativecommons.org/licenses/by/4.0/).
Share and Cite
Hussain Ali, Y.; Sabu Chooralil, V.; Balasubramanian, K.; Manyam, R.R.; Kidambi Raju, S.; T. Sadiq, A.; Farhan, A.K. Optimization System Based on Convolutional Neural Network and Internet of Medical Things for Early Diagnosis of Lung Cancer. Bioengineering 2023, 10, 320. https://doi.org/10.3390/bioengineering10030320
Hussain Ali Y, Sabu Chooralil V, Balasubramanian K, Manyam RR, Kidambi Raju S, T. Sadiq A, Farhan AK. Optimization System Based on Convolutional Neural Network and Internet of Medical Things for Early Diagnosis of Lung Cancer. Bioengineering. 2023; 10(3):320. https://doi.org/10.3390/bioengineering10030320
Chicago/Turabian StyleHussain Ali, Yossra, Varghese Sabu Chooralil, Karthikeyan Balasubramanian, Rajasekhar Reddy Manyam, Sekar Kidambi Raju, Ahmed T. Sadiq, and Alaa K. Farhan. 2023. "Optimization System Based on Convolutional Neural Network and Internet of Medical Things for Early Diagnosis of Lung Cancer" Bioengineering 10, no. 3: 320. https://doi.org/10.3390/bioengineering10030320
APA StyleHussain Ali, Y., Sabu Chooralil, V., Balasubramanian, K., Manyam, R. R., Kidambi Raju, S., T. Sadiq, A., & Farhan, A. K. (2023). Optimization System Based on Convolutional Neural Network and Internet of Medical Things for Early Diagnosis of Lung Cancer. Bioengineering, 10(3), 320. https://doi.org/10.3390/bioengineering10030320


