1. Introduction
Lung cancer is the malignant tumor with the highest incidence and mortality rate, and studies have shown that the number of people dying from lung cancer in 2030 will continue to increase, China could reach 42.7% [
1,
2]. Lung cancer is often overlooked in the early stage due to the lack of obvious symptoms [
3], and when detected, it is usually in the advanced stage, often accompanied by multiple organ or lymph node metastasis, which makes the treatment difficult and ineffective. Early lung cancer is mostly manifested as lung nodules, which can be treated with surgery and radiotherapy, so early screening is of great significance to the prevention and treatment of lung cancer [
4]. Studies have shown that low-dose spiral CT (Low-dose Computed Tomography (LDCT)) screening methods can significantly improve lung cancer detection rates and reduce the morbidity and mortality of people at a high risk of lung cancer by 20% compared to chest radiography screening methods [
5].
The popularization of LDCT technology has achieved a high yield of CT images. Consequently, the workload of manual reading has increased dramatically [
6], which not only burdens doctors with time-consuming and cumbersome work but also may cause fatigue misdiagnosis and omission of diagnosis [
7]. For this reason, researchers have proposed a computer-aided diagnosis (CAD) system for lung nodule classification to improve the effectiveness of diagnosis [
8]. In recent years, CAD systems have been widely used to assist in the treatment of different diseases due to their efficiency and reliability in clinical diagnosis [
9,
10]. Benign and malignant identification is the top priority in the auxiliary diagnosis of lung nodules. Generally speaking, the traditional computer-aided diagnosis system extracts the underlying features of the image from the candidate nodules after lung parenchyma segmentation and adopts traditional classifiers for learning. In contrast, with the rise of deep learning technology, its application in medical images has gradually become a mainstream trend [
11].
Deep learning techniques create a form of end-to-end automated processing that integrates feature selection and extraction in a single architecture, significantly improving efficiency and accuracy [
12]. Shen et al. [
13] proposed MC-CNN (Multi-crop convolutional neural networks) to simplify the traditional way of classifying the malignancy of lung nodules by using convolutional neural networks to learn the features generated at multiple scales, effectively reducing computational complexity. Liu et al. [
14] designed multiple independent neural networks to simulate different expert behaviors and fused the results with integrated learning, consisting of three different types of architectures to form a multi-model 3D CNN. Ciompi et al. [
15] extracted multi-view features of lung nodules by analyzing three views, axial, coronal and sagittal, and constructed a multi-scale representation using three scales, which is more conducive to the classification of lung nodules. Zheng et al. [
16] proposed a deep convolutional neural network, STM-Net (Scale-Transfer Module Net), which contains a scale-shifting module and multi-feature fusion operation, and the model adapts to the size of the target by scaling the images with different resolutions.
Although convolutional neural networks can simplify complex processing steps, some problems inevitably arise. Networks are often characterized by complex parameters, layers and high dimensionality of data, making it difficult to intuitively understand how they make decisions and unable to explain the logic behind their predictions. They are often considered as a “black box” [
17]. Especially in the medical field [
18], it is necessary to have a clear explanation and basis for the model’s judgment in order to help radiologists make more profound diagnoses.
When doctors assess lung nodules with CT images, they use characteristics such as lobulation, texture, diameter, subtlety and degree of calcification to describe and analyse their relevant manifestations [
19]. These semantic characteristics are also often found in radiology reports. Clinically speaking, these semantic characteristics are important reference factors for determining the benignity and malignancy of pulmonary nodules and correlate with each other [
20]. Utilizing shared features among multiple semantic characteristics can achieve mutual enhancement between features. Studies have shown that multi-task learning can improve performance when similar domain background tasks are involved [
21]. Wu et al. [
22] designed PN-SAMP (Pulmonary Nodule Segmentation Attributes and Malignancy Prediction) to combine lung nodule segmentation, semantic characteristics and benign and malignant prediction, which helps improve a single task’s performance. Zhao et al. [
23] proposed a multi-scale multi-task combined 3D CNN that can detect benign and malignant lung nodules from CT scan Classification. This CNN combined two image features of different volume scales, followed by multi-task learning to achieve benign, malignant and semantic feature classifications of lung nodules. Li et al. [
24] incorporated domain knowledge into the CNN and achieved the classification of nine semantic characteristics of lung nodules by multi-task learning with improved overall performance of the model.
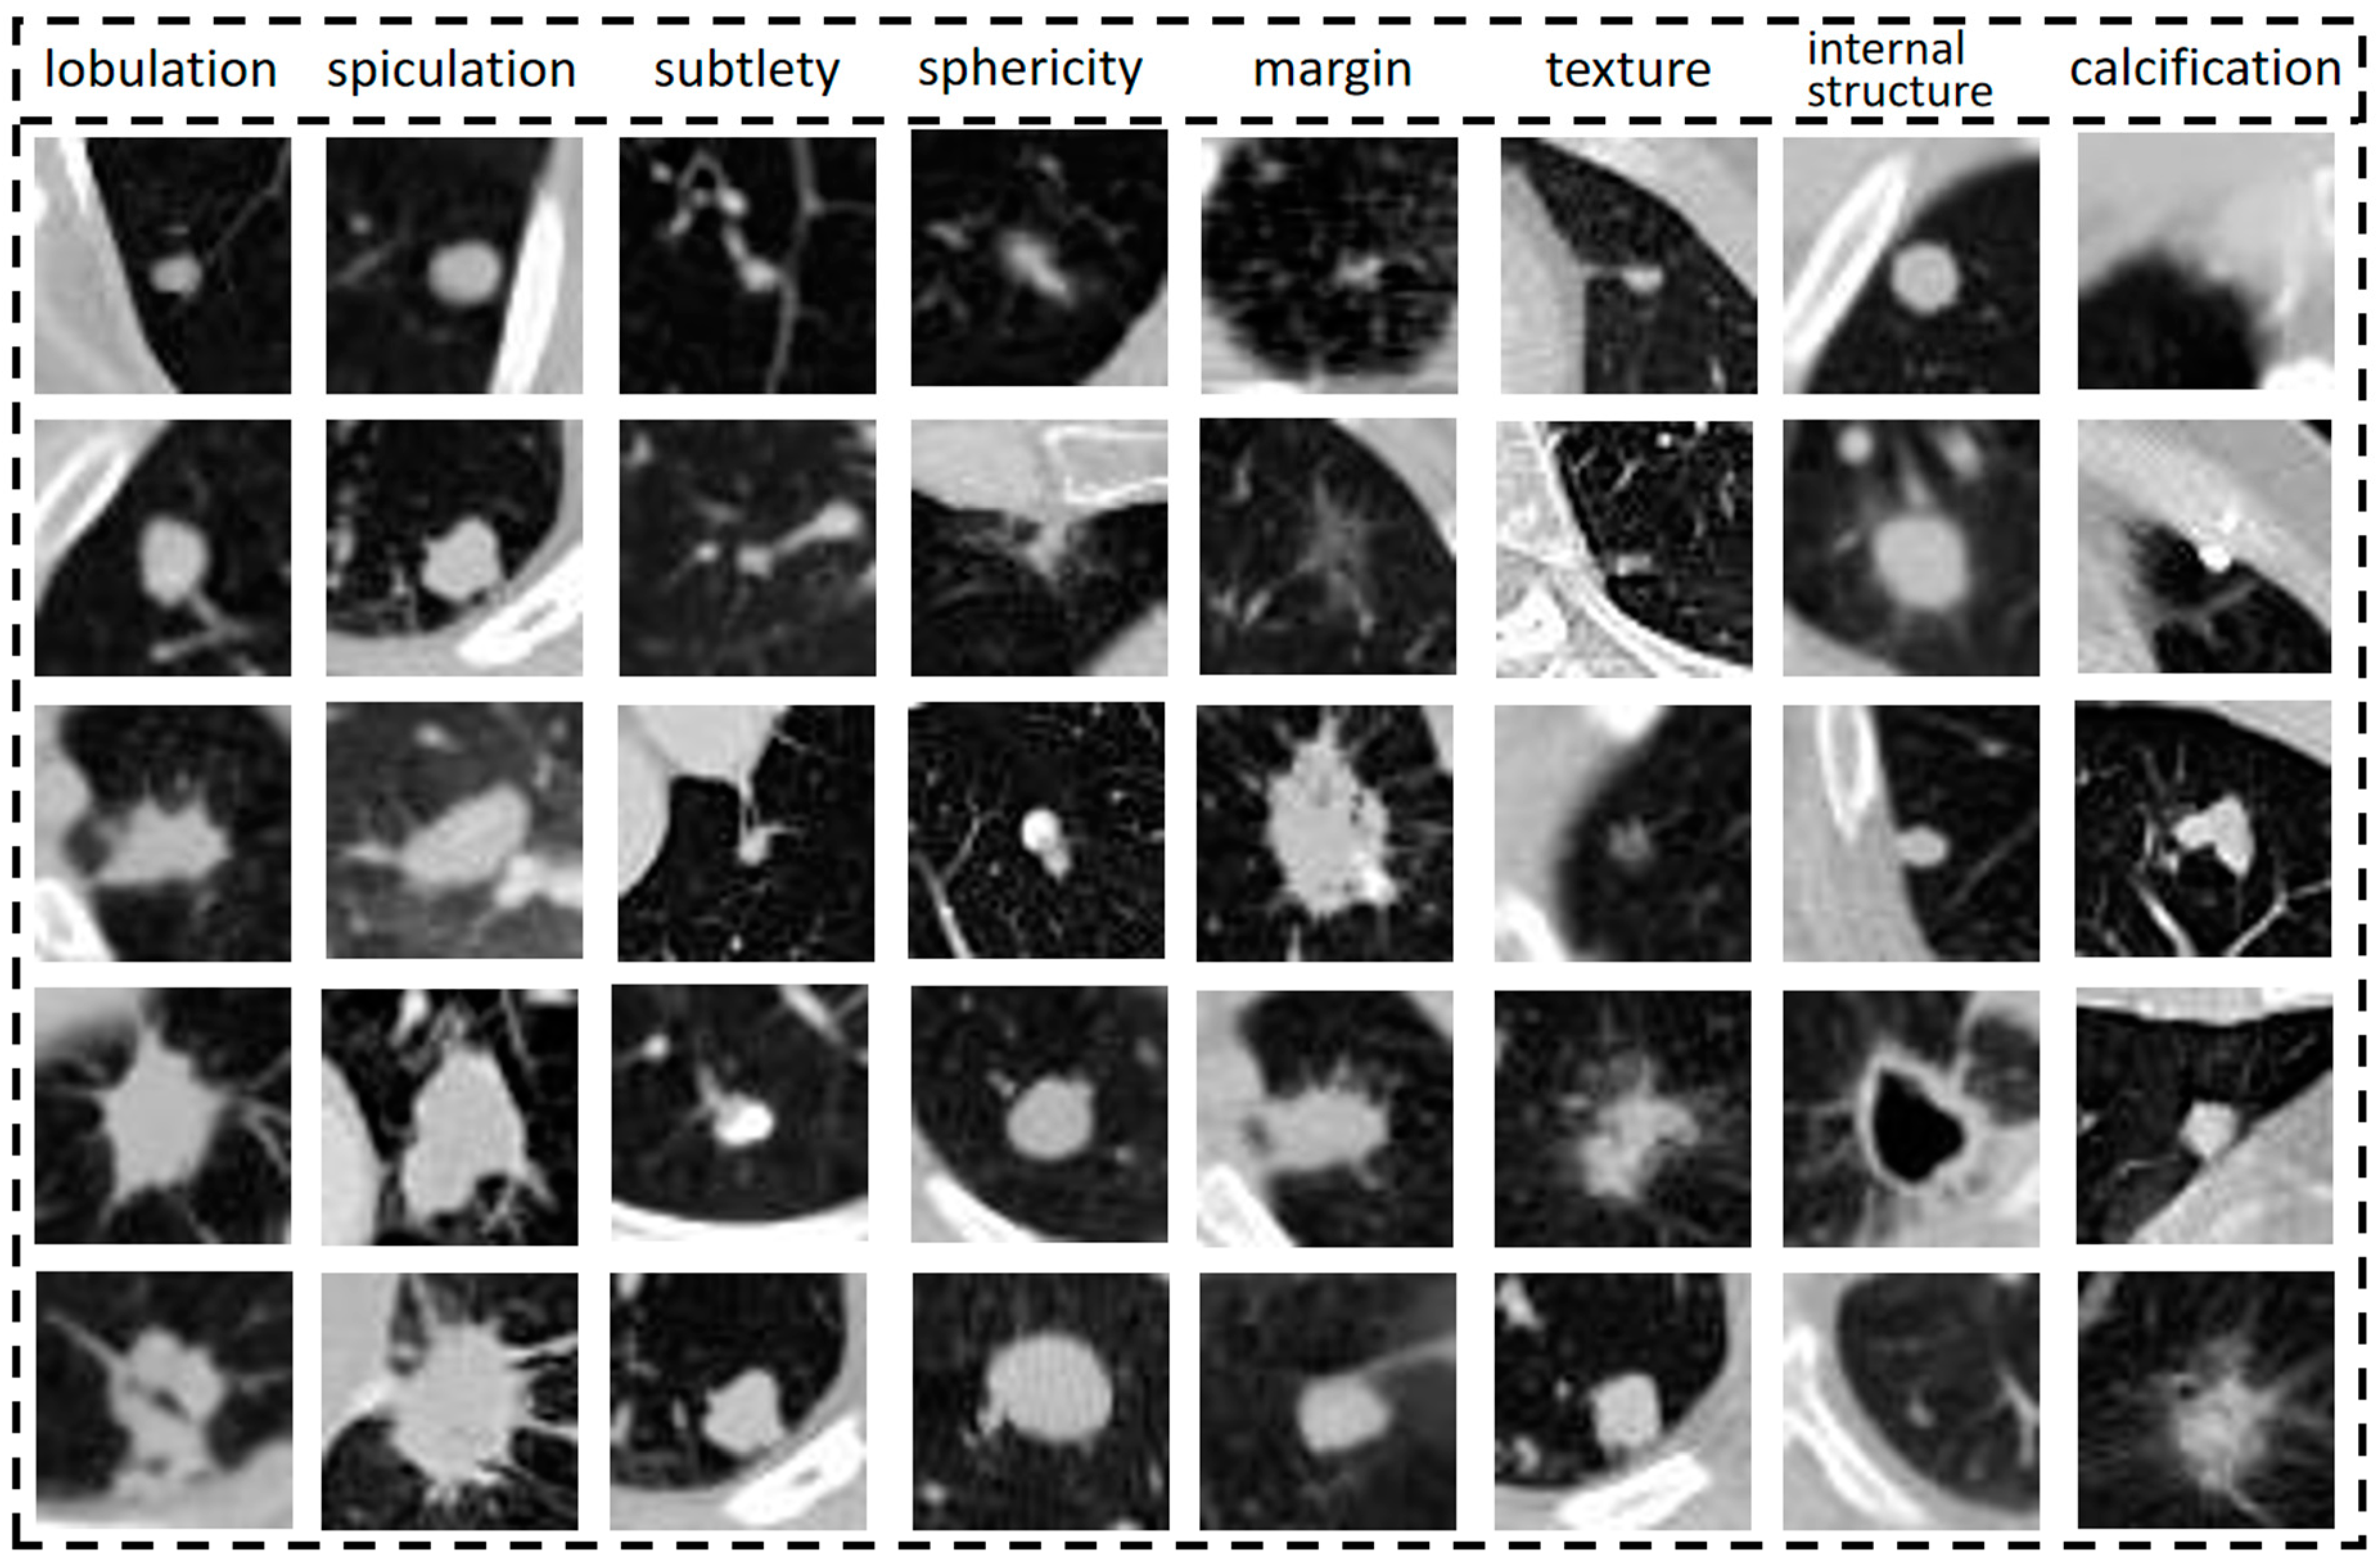
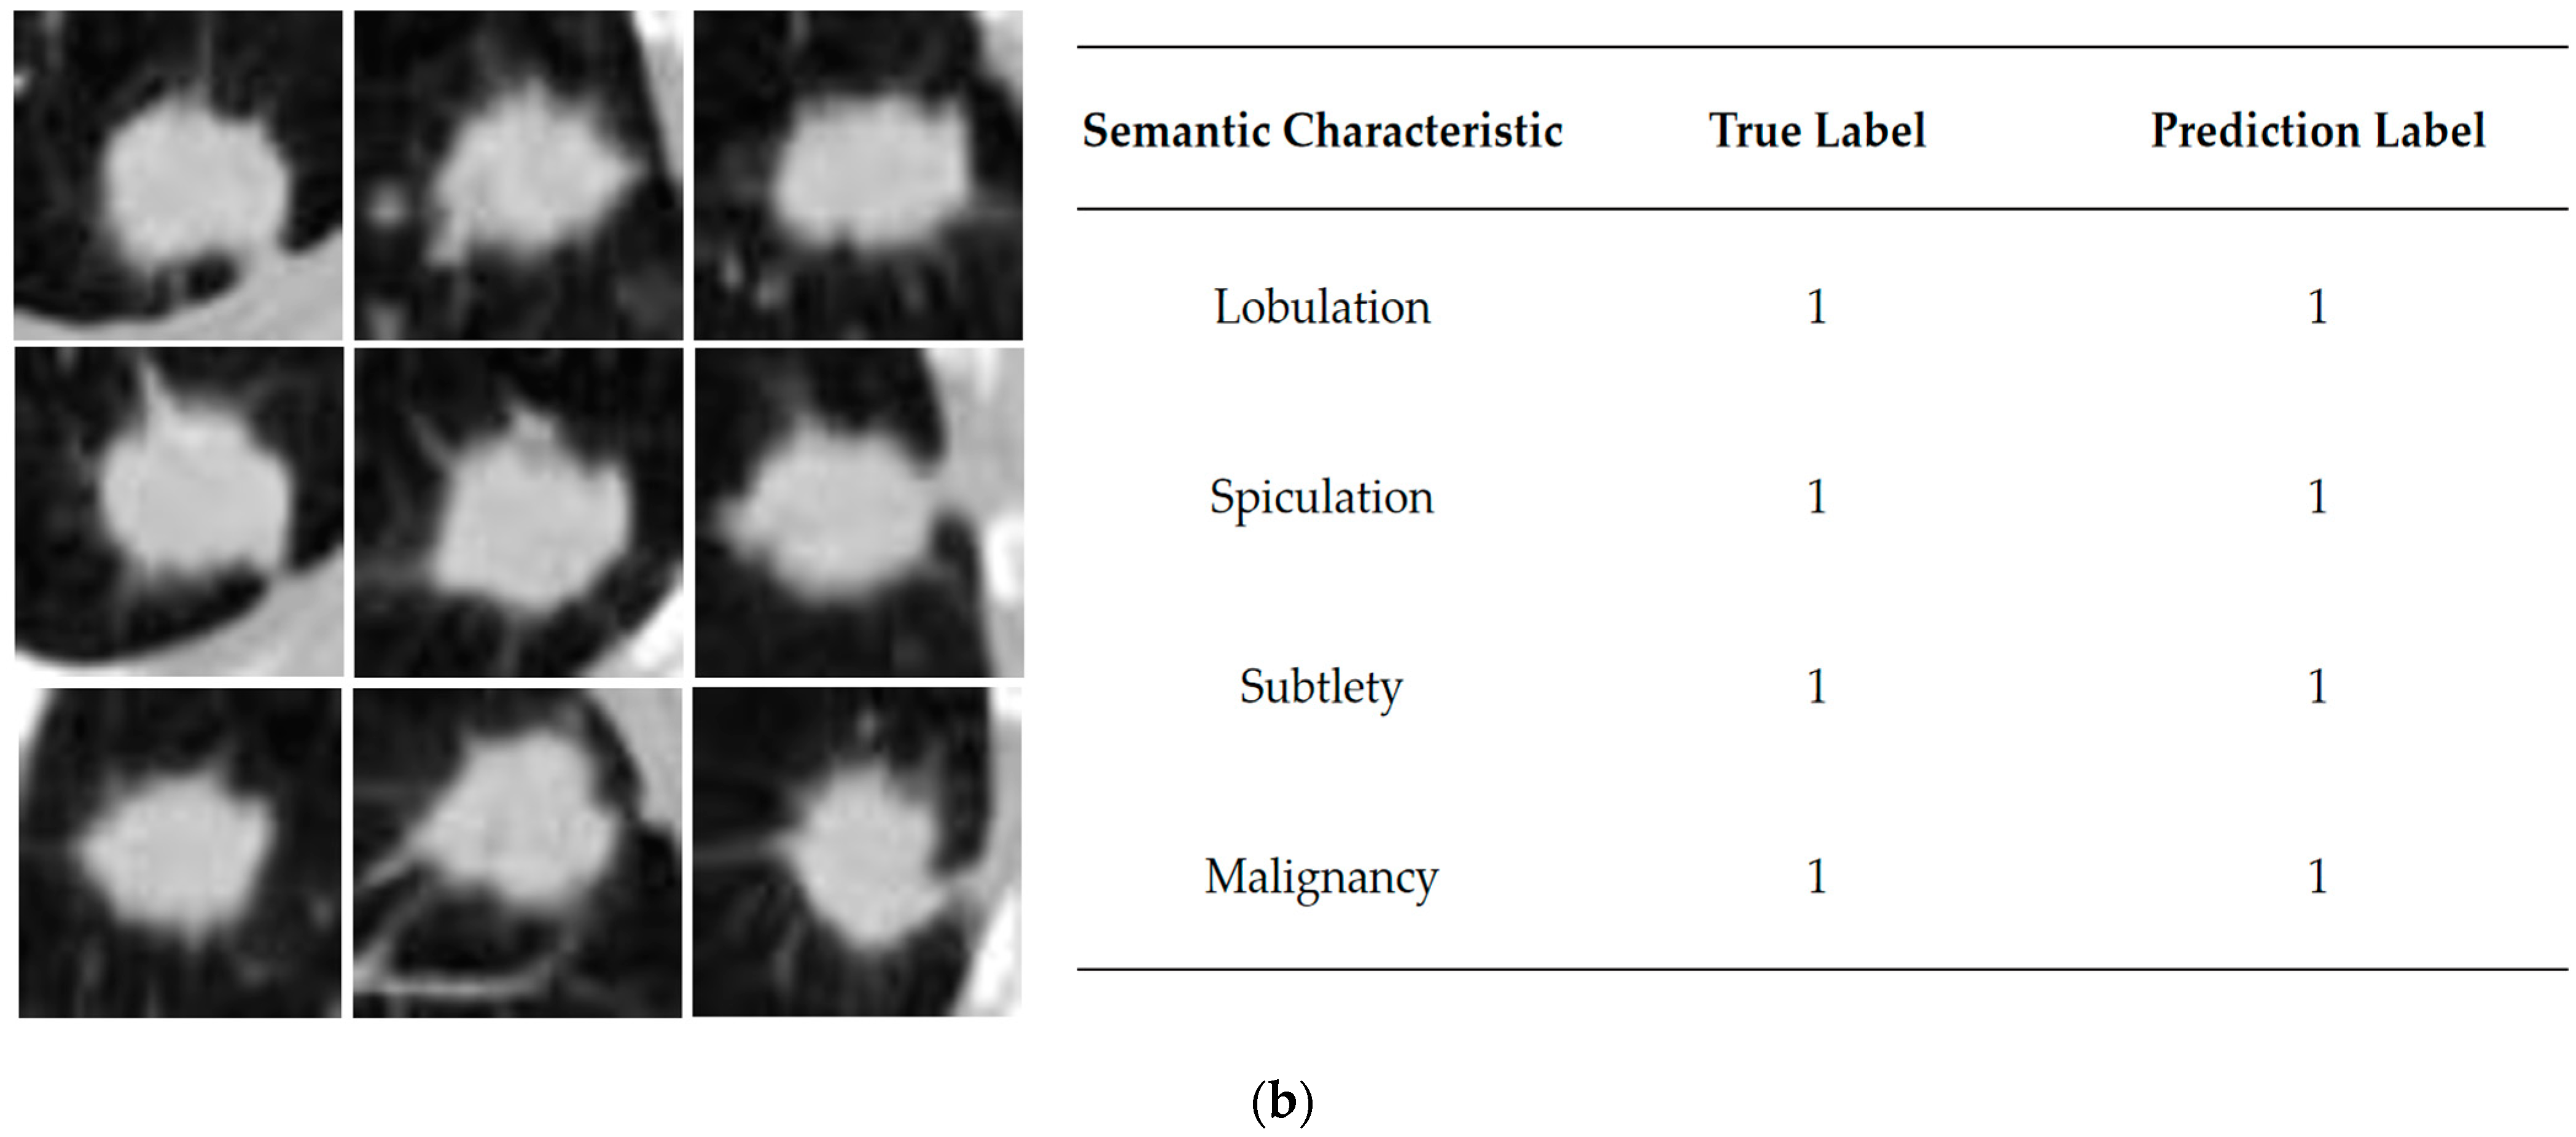
The performance of each semantic characteristic common to lung nodules is shown in
Figure 1, from top to bottom, indicating the elevated level of semantic characteristics represented by the column. Semantic characteristics are more intuitive and informative for clinicians [
25], so this study synthesizes them to assist in benign and malignant diagnosis and analysis. Semantic characteristics are intuitive to radiologists and provide objective methods to capture image information. There is an opportunity to incorporate these semantic characteristics into the design of deep learning models, combining the best of both worlds.
Similarly, the diagnostic process focuses on different semantic characteristics by repeatedly observing them. Attention mechanisms proposed in recent years also draw on the humans ability to focus attention when processing information [
26]. In computer vision tasks, by assigning different weights to the input image, the model is allowed to selectively focus on a specific portion of the input to understand the data better. Zhang et al. [
27] designed the LungSeek model that combines the SK-Net with a residual Network to simultaneously extract lung nodule features from both spatial and channel dimensions, improving lung nodules detection effectiveness. Fu et al. [
28] added an attention module to the model, which can compute the importance of each slice to filter out irrelevant slices. AI-Shabi et al. [
29] proposed a 3D axial attention, applying the attention to each axis individually, thus providing complete 3D attention to focus on the nodes efficiently. There are not many studies that take semantic characteristics and attention mechanisms into account, but simply classify malignant labels. We try to incorporate this domain knowledge into a deep learning framework, and the mentioned studies are summarized in
Table 1.
In this paper, we design a convolutional neural network (SCCNN) with semantic characteristics and integrate the multi-view, multi-tasking and attention mechanism advantages. The input of the model is the original CT image cube centered on the nodule. The degree of malignancy is regarded as the main task, and semantic characteristics are regarded as the branch task. The primary task explains what the SCCNN model learns from the raw image data, and trains it to improve the prediction of whether a nodule in a CT image is malignant.
The contributions of this paper are as follows:
We synthesized the semantic characteristics of lung nodules commonly used by doctors during clinical diagnosis to design a multi-task learning network model to assist in identifying benign and malignant nodules, which was experimentally verified to improve the model’s performance and increase the interpretability of the model.
A multi-perspective approach is used for data augmentation, combining physician-annotated data and gold-standard pathological diagnostic data to deal with uncertain nodules in order to solve the problems of too little annotated data and sample imbalance and maximize the use of existing annotation information.
Establish ablation experiments by introducing different attention mechanisms so that the model can adaptively focus on more critical feature information when synthesizing multiple semantic characteristics and improve the robustness of the model.
The remainder of this paper is organized as follows.
Section 2 presents the materials and methods used in this study, including the dataset, data processing methods and the proposed SCCNN model.
Section 3 describes the performance evaluation indicators and model results.
Section 4 discusses the strengths and limitations of this work. Finally, in
Section 5, the conclusions of the study are provided.
2. Materials and Methods
2.1. Dataset and Data Cleaning
This study used the publicly available Lung Image Database Consortium and Image Database Resource Initiative (LIDC-IDRI) [
30] as the underlying data source, which contains 1018 lung CT cases from 1010 lung cancer patients. The CT cases contained lesion annotations from four experienced chest radiologists. The CT images were given digital imaging and communications in medicine (DICOM) format. The annotation results were presented in Extensive Markup Language (XML) format, and the annotations included large nodules (diameter ≥ 3 mm), small nodules (diameter < 3 mm), and non-nodules, with additional identifiers of specific contours and features for large nodules. The four physicians labelled the images with the following nine semantic characteristics: subtlety, lobulation, spiculation, sphericity, margin, texture, internal structure, calcification and malignancy. All of the categories were divided into five grades to differentiate the degree of expression of the semantic characteristics. The calcification was classified in six grades. Evaluating an isolated pulmonary nodule’s specific morphology can help differentiate between benign and malignant nodules. For example, lobulated outlines or spiculation edges are usually associated with malignancy. The presence and pattern of calcification can also help distinguish between the two [
31]. These image features provide a quantitative and objective way to capture image information to create more standardized rating systems and terminology, and reduce competent variability between radiologist annotations [
32]. Typically, a higher rank indicates a more significant corresponding semantic characteristic.
Table 2 shows the specifics of each rank.
LIDC-IDRI provides the diagnostic data of benign-malignant at two levels, semantic benign-malignant and pathological benign-malignant, where the former is mainly based on the information labelled by doctors, i.e., doctors’ subjective judgment of lung nodules based on rich clinical experience, and the latter is based on pathological diagnostic information, i.e., the diagnosis of the nodules through tissue sections and puncture biopsy procedures, which is the “gold standard” for assessing the risk of lung cancer [
33].
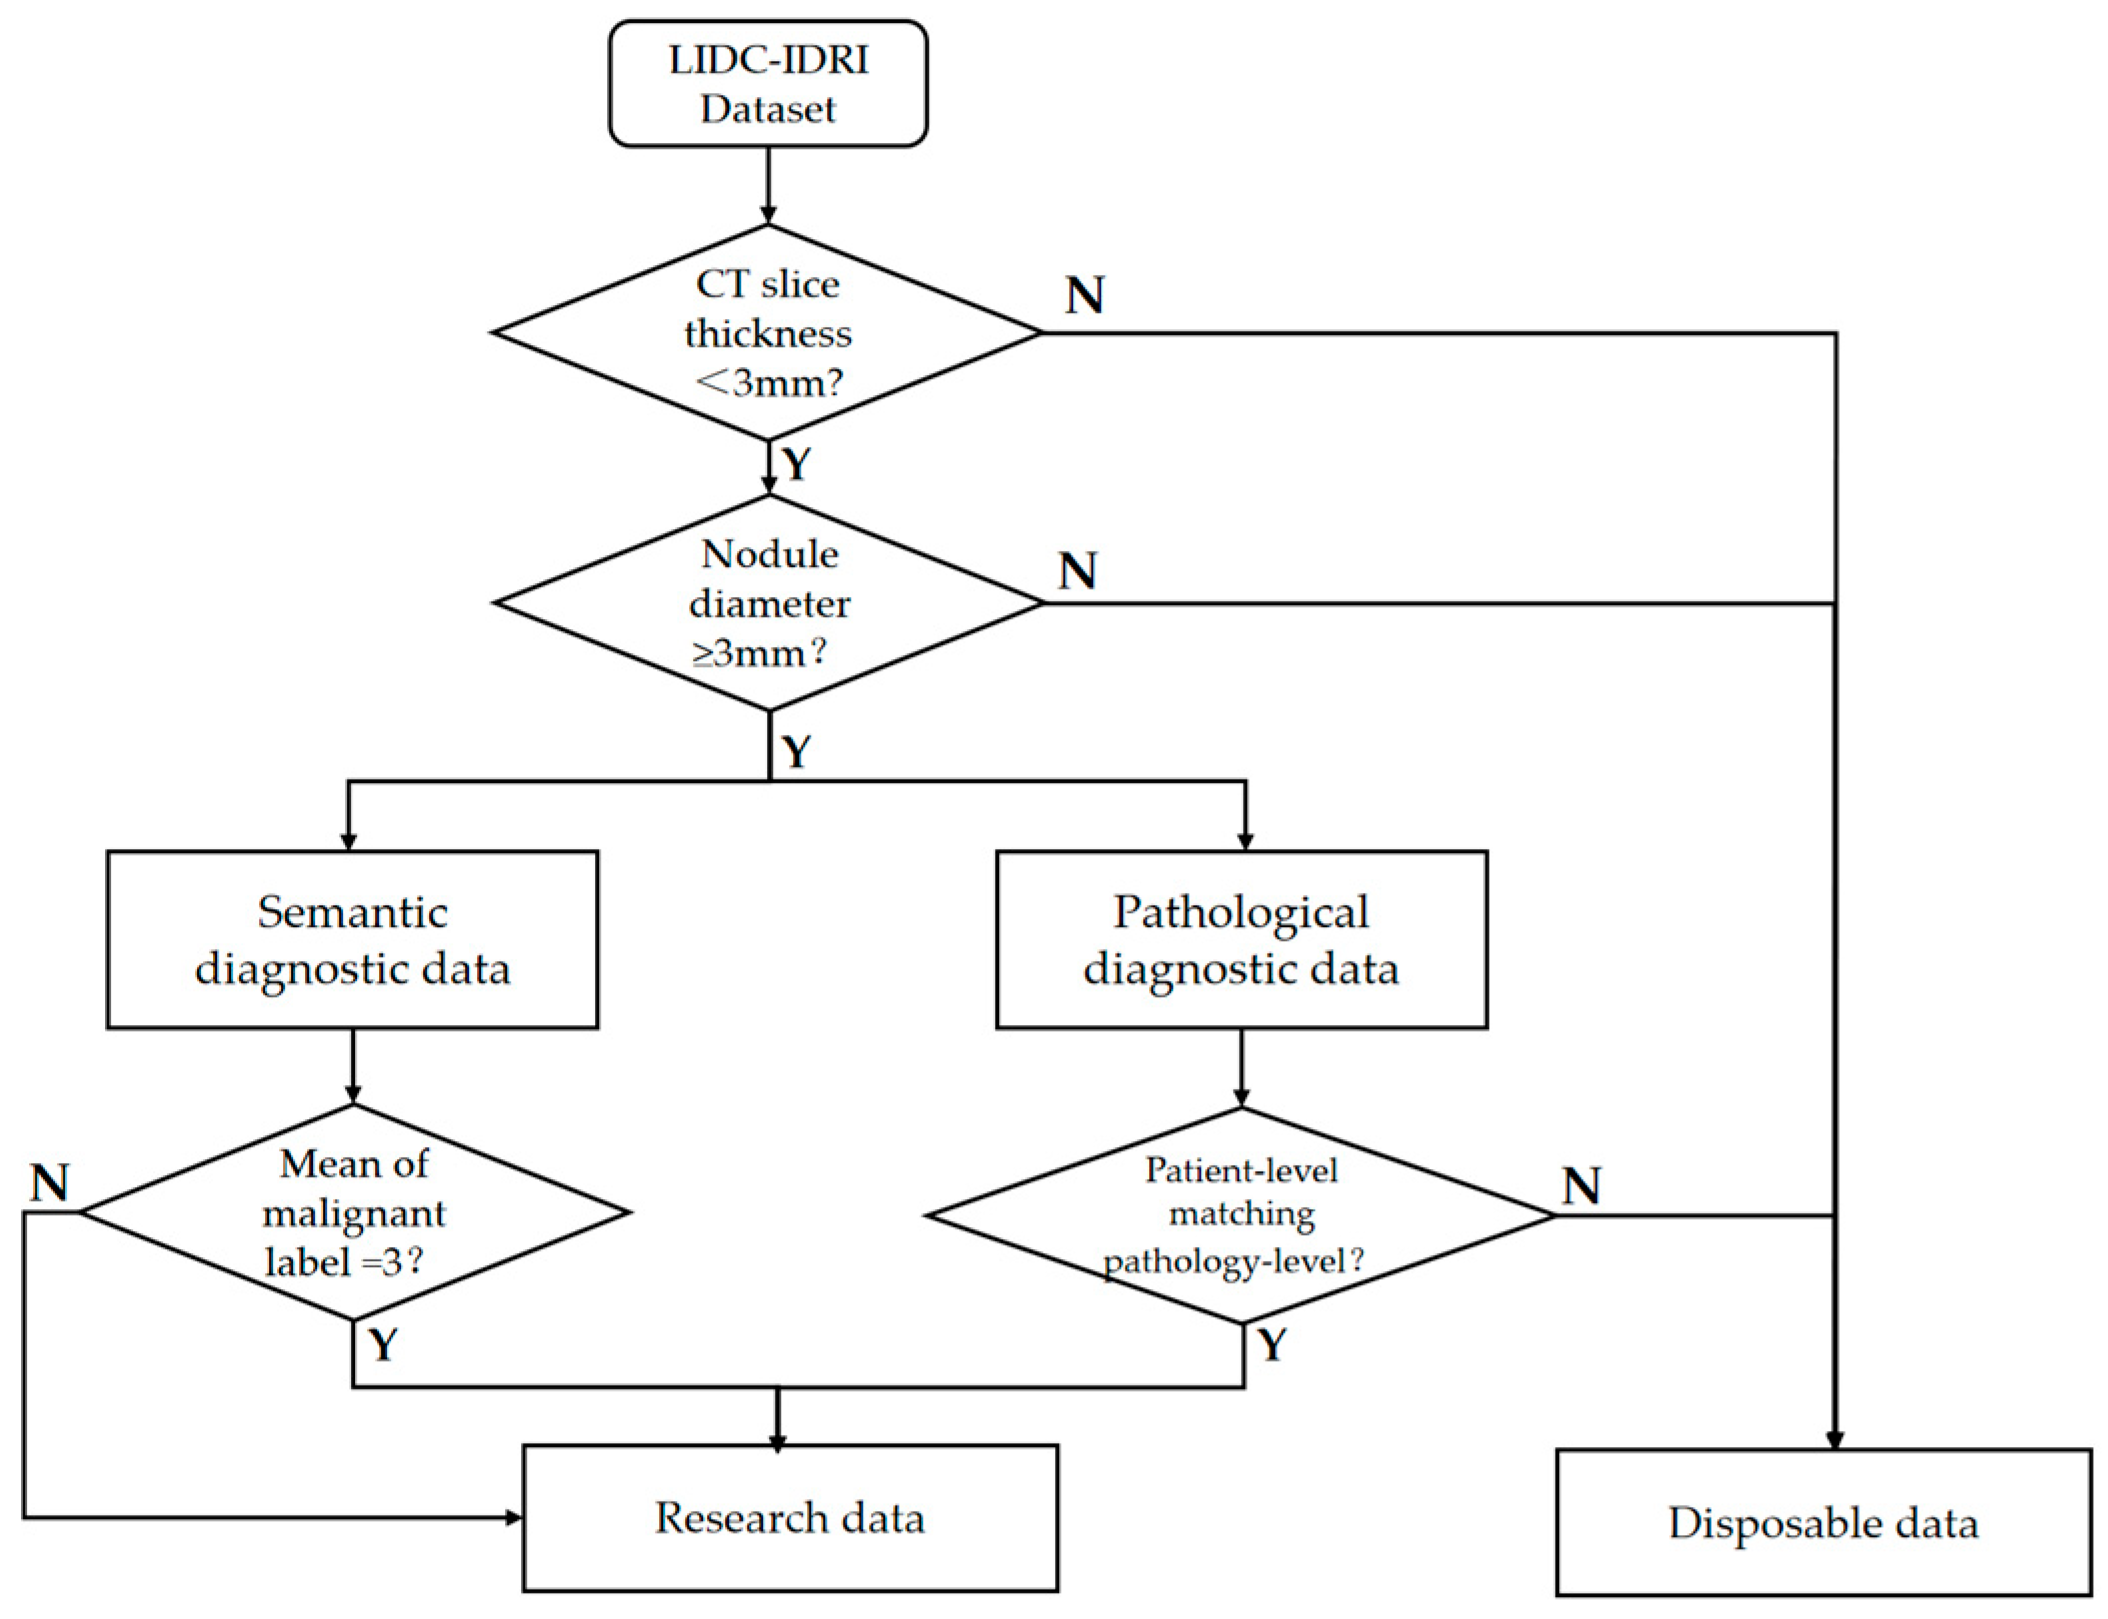
The gold standard data makes it more difficult to obtain data samples because it involves invasive surgical operations and 157 subjects in LIDC had pathologic diagnostic information. There were 2072 lung nodules with physician annotations of semantic characteristic grade in LIDC, each containing annotations from at least one physician. We first screened out high-quality data from these CT imaging data with a nodule diameter greater than 3 mm and CT slice thickness within 3 mm, referring to the positive and negative sample definition method in a previous study [
34]. In order to maximize the use of limited annotations for samples of uncertain malignant samples, we added them to the dataset after referring to the pathological diagnosis.
Figure 2 shows the specific data cleaning process, and the cleaned data totaled 1779 cases.
2.2. Data Preprocessing and Correlation Analysis
In order to quantify the intrinsic association between semantic characteristics and the degree of malignancy, our study performed a Spearman’s correlation [
35] analysis on the cleaned data, using the absolute value of the correlation coefficient as a measure of the degree of linear correlation between the two.
The semantic characteristics of the lung nodules with higher correlation can be interpreted as follows: when this characteristic has a higher rank, it may be accompanied by a more pronounced degree of malignancy, which is more likely to enhance the prediction of malignancy by the network model. As can be seen from
Table 3, the three characteristics with the highest rank of relevance are lobulation, spiculation and subtlety, indicating that these semantic characteristics play an essential role in malignancy classification [
36]. Therefore, they are selected as auxiliary tasks for the model.
Meanwhile, the cleaned data samples are divided into training and test sets in the ratio of 9:1, as shown in
Table 4. During the training process, a 10% portion is taken as validation set, so the original dataset is divided into the training set, validation set, and test set corresponding to 81%, 9% and 10% of the divisions. The test set was used as an independent validation and was not involved in data balancing and amplification operations. It was left as it was to show the original proportions of positive and negative samples in the dataset.
The Hounsfield unit (HU) in the CT image reacts to the degree of tissue absorption of X-rays, and the image needs to convert to the HU value before making the window width and window position adjustment [
37,
38].
Therefore, the CT slices were firstly unified in the range of [−1000, 400]. Then, the CT values of the lung nodule images were extracted and normalized using linear transformation to make the images more transparent. At the same time, since the images in the dataset come from different devices, in order to truly reflect the imaging size of the lung nodules, the voxel spacing in the x, y and z directions is resampled to 1 mm × 1 mm × 1 mm. Controlling the resolution of the input images to be of the same size creates the conditions for the subsequent model to capture the features.
In the study of A.P Reeves [
34], the nodal coordinate positions and nodal size and diameter reports were provided, from which the center of mass coordinates were obtained as distance information from the center scanning point of each image. The coordinates obtained by coordinate conversion through Equations (1)–(3) were required to localize the nodule to the image:
In the above equation, , and represent the original distance information of the image in , and axes, , and represent the pixel resolution of the image before resampling, and represents the size of z-axis before resampling. The product , , and results represent the voxel coordinates of each image in the corresponding direction after a coordinate transformation.
After locating the position, the appropriate size of the Region of Interest (ROI) of the lung nodule will be selected. According to the study [
34] and statistics after data cleaning, the diameter of the large nodule in the cross-section of the CT sequence is distributed between 3.06–38.14 mm. In order to encompass all the nodules, the final setting of this study cropped out the 40 × 40 size of the region of interest while setting nine layers. The 3D stereoscopic nodule images with a length and width of 40 mm each and a height of 9 mm were organized.
On the other hand, nine semantic characteristic ratings of nodules were extracted by parsing the XML annotation file. At least one doctor reviewed and annotated each case of CT concerning Shen’s method [
13]. When more than one doctor annotates a nodule, the average of the ratings of the multiple doctors was taken and then binarized to serve as a Ground Truth Label (GTL).
The specific way is that when the rating score of 3 is regarded as uncertain samples, the average score below 3 is labelled as benign positive samples with low malignant suspicion, and higher than 3 is labelled as malignant negative samples with high malignant suspicion. In order to maximize the use of the existing labelling, unlike other studies that directly discarded uncertain nodules, this paper refers to the pathological information for further control. We take those that contain the “gold standard” results as training labels. In this way, we labelled an additional 80 samples, of which 30 were benign and 50 were malignant.
Acquiring pathological diagnostic data requires traumatic and costly surgical operations, making it difficult to obtain, and the amount of data is small. We selected samples and screened them to maximize the use of annotation. Furthermore, semantic characteristics data distribution is exceptionally unbalanced, compared with the number of the majority of the categories in their respective attributes, which is too small to meet the needs of data division and subsequent experiments, so binarization is adopted to overcome data sparsity.
Table 5 shows the results. Label 0 indicates positive samples that correspond to the semantic characteristics that are not apparent, and label 1 indicates negative samples that the semantic characteristics are evident.
Since the quality and quantity of data limits model training, data augmentation is required to augment the data volume to reduce overfitting. Prior to this, data balancing operations were performed. Specifically, based on
Table 3, this study was finally carried out using the on-the-fly pan, rotate and flip technique. The balanced benign samples were 2118 cases, and the malignant samples were 2078 cases. After that, data enhancement was done on this basis. Numerous techniques are explored in existing studies, such as basic, deformable, deep learning or other data augmentation techniques [
39]. In our paper, it is due to the tendency to simulate the doctor’s full range of diagnostic state. It is proposed to use the multi-view technique as an augmentation method. The 3D cubes of lung nodules were based on axial, sagittal and coronal planes and rotated by 45 degrees on the coordinate axis to generate nine viewing angles as observation angles. The total amount of augmented lung nodule data reached 37,764 cases [
40].
2.3. Semantic Characteristic Convolutional Neural Network
In the actual diagnostic process, to observe lung nodules in CT images from multiple perspectives, radiologists can usually select different planes on the computer to understand the morphology and distribution of the nodules. As a three-dimensional imaging technique, the scanning angle of CT can be adjusted according to the needs, and multiple scans can also be performed to understand the growth changes of the nodules. However, for images from different patients with different devices in LIDC-IDRI, the orientation in medical imaging is not fixed for all CT maps. Therefore, extracting nine views of the ROI region for fusion to be used as data input can be used to simulate further diagnosis by doctors using multiple views and maximize the extraction of information around lung nodules with complex shapes.
As shown in
Figure 3, the benchmark network model in this paper consists of a series of convolutional layers, pooling layers and corresponding fully connected layers. The input data is a 40 × 40 × 9 multi-view lung nodule 3D cube, which passes through the first convolutional layer consisting of 64 convolutional kernels of size 3 × 3 × 3. The second and third layers are residual modules [
41] consisting of 32 convolutional kernels of size 3 × 3 × 3, and the fourth convolutional layer consists of 16 convolutional kernels of size 1 × 1 × 1. Immediately, the convolutional images are fed again into the kernel of the 2 × 2 × 2 maximum pooling layers, which enters into four fully connected layers after spreading processing to map the extracted features to the output space. The specific calculation is as follows:
where
denotes the
output feature mapping in layer
,
denotes the
input feature mapping in layer
l − 1,
denotes the 3D convolution kernel for connecting sums in layer
l,
denotes the convolution operation, and
denotes the
bias term in layer
l. Rectified linear units (ReLUs) [
42] are used as activation functions after convolution. It is the fully connected layer that plays the role of classification in the network.
In this equation,
denotes weighting matrix, and
denotes the neuron vector of the previous layer of the fully connected layer, and
is the bias term for this layer, setting up a dropout layer after the full connectivity layer, which can improve network generalization [
43]. The model structure is shown in
Figure 3 below.
Semantic characteristics as a focus for radiologists and studies have shown that high-accuracy predictions can be achieved using only semantic characteristics as inputs [
41]. In this paper, we first try to add lobulation labels as an auxiliary task and then continue adding spiculation and subtlety. Multiple classification tasks of malignancy degree and semantic characteristics are processed simultaneously to form a multi-task learning model (MTL). The correlation between the tasks is considered in the multi-task learning process. Additional fully connected layers and SoftMax activation functions are added to the underlying network architecture to accommodate the added feature classification tasks, and the Shared-Bottom (SB) is used to share the information about goodness and malignancy and different semantic characteristics extracted during propagation, which ultimately improves the performance of malignancy classification [
44]. MTL needs to consider the correlation and weight assignment between tasks. To jointly optimize the SCCNN during the network training, a global loss function is proposed to maximize the probability of predicting the correct label for each task.
In this equation,
t is the
subtask, which is determined by the number of semantic characteristics that
.
t ∈ [
2,
4] denotes that it takes on integers from 2 to 4. When
t = 1, it represents that the base CNN model only considers one factor, benign or malignant. When
t = 2, it represents that the model uses lobulation as a secondary task for classification. When
t = 3, it represents that the two semantic characteristics, lobulation and spiculation, are used as secondary tasks at the same time. When
t = 4, it represents that the three semantic characteristics of lobulation sign, spiculation sign and subtlety are considered simultaneously and they are used as a secondary task to assist in benign-malignant classification.
corresponds to a separate loss function for the
task, which is the individual loss corresponding to the
task.
is the weight hyperparameter for the
task. It is based on the importance of the task in the total loss, and auxiliary tasks exist to better serve the main task. Higher weights are assigned to malignant classification tasks, as they are the result of being given greater expectations. Each loss component is defined as a weighted cross entropy loss in the following equation:
where
N is the number of samples in a batch size and M is the number of categories.
is the true label for the
sample in the
class; it equals 0 or 1 here.
represents a prediction score for class
. The probability distribution was transformed using the softmax function. The global loss function is minimized during the training process by iteratively computing the gradient of
over the learnable parameters of SCCNN and updates the parameters through back-propagation.
2.4. Attention Mechanisms
As the scale of tasks increases, there may be interactions between malignancy and semantic characteristics. We hope the model can automatically learn the dependencies between tasks and play the role of a carrier, just like an actual radiologist in the hospital. The Convolutional Block Attention Module (CBAM) [
45] is introduced in the stage of feature extraction and fusion to improve the model performance.
The module has two sequential sub-modules, channel and spatial. Specifically, it sums the weight vectors of the sequential outputs of the two sub-modules. After normalization by sigmoid, it obtains a heat map of the same size as the input feature map. Multiply it with the input feature map to get the adjusted feature map.
The goal of channel attention focusing is to find more meaningful features of the input image. Squeezing the spatial dimension of the input feature map can help it to compute the channel attention efficiently. By using both global average-pooling and max-pooling, it learns the relationships between the channels. Subsequent input into the two fully connected layers recalibrate the channel feature responses to learn global information.
and denote the descriptors of the input feature mappings after average-pooling and max-pooling operations, which subsequently forward to the shared network. and represent the weights of the shared network consisting of a multi-layer perceptron (MLP) with one hidden layer. denotes the sigmoid activation function. Eventually an element-wise summation is performed to merge the output feature vectors to produce , which is the channel attention map.
The target of spatial attention focuses on the information between different locations in the feature map. Since the size of the nodules ranges from 3 to 38 mm, an image with a length and width of 40 mm is used in this study, making the lung nodule present in the surrounding structural organization. The spatial attention module can consider the spatial location, thus focusing on the target region, which operates by performing the maximum pooling and average pooling operations on the feature maps output from the previous step as well and selecting a 7 × 7 × 7 convolution kernel as the attention fuser and dimensionality reduction.
denotes the spatial attention mapping. The formula can be expressed as:
Finally, the output is fused with the original input for feature fusion with the following equation:
F denotes the original input image feature and
denotes the multiplication operation. The mapping
acquired in the channel attention multiplies with
F as input to spatial attention and iterated, and their result
realizes the combination of channel and spatial attention.
Figure 4 illustrates the structure of the attention mechanism.
