Article

Decline in Seasonal Snow during a Projected 20-Year Dry Spell

by
Benjamin J. Hatchett
1,*,
Alan M. Rhoades
2 and
Daniel J. McEvoy
1
1
Division of Atmospheric Sciences, Desert Research Institute, Reno, NV 89512, USA
2
Climate and Ecosystem Sciences Division, Lawrence Berkeley National Laboratory, Berkeley, CA 94720, USA
*
Author to whom correspondence should be addressed.
Hydrology 2022, 9(9), 155; https://doi.org/10.3390/hydrology9090155
Submission received: 25 July 2022 / Revised: 12 August 2022 / Accepted: 22 August 2022 / Published: 26 August 2022
(This article belongs to the Special Issue Recent Advances in Hydrological Modeling)

Abstract

:
Snowpack loss in midlatitude mountains is ubiquitously projected by Earth system models, though the magnitudes, persistence, and time horizons of decline vary. Using daily downscaled hydroclimate and snow projections, we examine changes in snow seasonality across the U.S. Pacific Southwest region during a simulated severe 20-year dry spell in the 21st century (2051–2070) developed as part of the 4th California Climate Change Assessment to provide a “stress test” for water resources. Across California’s mountains, substantial declines (30–100% loss) in median peak annual snow water equivalent accompany changes in snow seasonality throughout the region compared to the historic period. We find that 80% of historic seasonal snowpacks transition to ephemeral conditions. Subsetting empirical-statistical wildfire projections for California by snow seasonality transition regions indicates a two-to-four-fold increase in the area burned, consistent with recent observations of high elevation wildfires following extended drought conditions. By analyzing six of the major California snow-fed river systems, we demonstrate snowpack reductions and seasonality transitions result in concomitant declines in annual runoff (47–58% of historical values). The negative impacts to statewide water supply reliability by the projected dry spell will likely be magnified by changes in snowpack seasonality and increased wildfire activity.

1. Introduction

Snowpacks alter the energy and mass fluxes between the land surface and atmosphere, influencing the hydrologic cycle across local, regional, and global scales [1]. Snow provides water resources for human use [2] and ecosystems [3] and is central to mountain recreation and tourism-based economies [4,5,6]. Annual peak snowpack declines on the order of 30–100% in midlatitude mountains are widely projected by Earth system models—with the greatest declines in lower elevations—though the magnitudes vary between projection method and emissions pathway [7,8,9]. Loss of snowpack alters the mountain hydrology many societies and ecosystems have long-relied upon. Warming-induced snow loss changes the timing, quantity, and quality of water resources provided by headwater regions to downstream communities [1,2,10,11] and reduces seasonal drought predictability [12].
A modern analog of an increasingly snow-free and drought-prone future is unfolding in real-time in the southwestern United States, a global hotspot of freshwater vulnerability [13]. Since the early 2000s, expectations of a warming climate have been met or exceeded [14,15,16], with the severity akin to centennial-scale duration Medieval megadroughts [17,18]. Following 20 years of aridification combined with increasing demand and a management system developed during a wetter and cooler western U.S. climate [16,18,19,20], major snow-fed reservoir levels in the Upper and Lower Colorado Basin are at all-time lows, threatening water supply and energy generation [21]. Negative economic and health impacts of these outcomes on society (especially in underprivileged and disadvantaged communities [22]) and ecosystems west-wide are increasingly compounded by other warming-induced changes: more frequent and extreme wildfire and air pollution episodes, heat waves, and flooding [23,24]. Similar outcomes are being observed in other water-limited regions of the world [13], with Chile being a close analog to the western U.S. [25,26].
One broad indicator of hydroclimate change in mountains is the seasonality, or persistence, of the snowpack. Snowpack seasonality can be quantified in many ways [27,28,29,30,31]. As part of characterizing snowpack seasonality across the conterminous United States using a gridded snow water equivalent (SWE) product [32] and the snow seasonality metric (SSM [29], Hatchett [33] performed a thought experiment to explore: (1) how this metric could identify generally seasonal snowpacks that historically demonstrated less seasonal to occasionally ephemeral behaviors (another form of ‘at-risk’ snowpacks [34]) and (2) to estimate the volume of water stored in peak SWE in these snowpacks, with the assumption that patterns of runoff will be different in ephemeral compared to seasonal years. The results showed that many watersheds in the western U.S. could transition to more ephemeral snowpacks, suggesting variations in the timing and magnitude of runoff compared to historically expected behaviors. This approach highlighted the value of the SSM as a tool to identify regions of potential snow seasonality change. Such identification is a potentially helpful step in developing vulnerability assessments and prioritizing the implementation of adaptation and mitigation strategies aimed at addressing projected snowpack decline [4,35]. Given the reliance on snow-derived water resources across scales throughout the western U.S. and worldwide, loss of snow could factor into local decision-making and planning in both snowy locales and communities far removed but reliant upon snow-derived water resources [8,13,36,37,38].
Extending the application of the SSM method to examine additional land surface changes associated with transitions from seasonal to ephemeral snowpacks or reductions in snow seasonality may provide insight into direct and indirect hydrologic changes. Here, we apply the SSM to an extreme and persistent drought of the future identified as part of California’s Fourth Climate Change Assessment [39]. The SSM is used to identify various regions where snow seasonality transitions occur and to assess changes in peak SWE and runoff. It is also used to explore how projected changes in area burned by wildfire vary across transition regimes (e.g., where seasonal snowpacks become more ephemeral). The results highlight the potential for mid-century levels of warming (≈3 °C) in California) but persistently dry conditions to drive notable hydrologic changes throughout the Pacific Southwest.

2. Data

2.1. California’s Drought of the Future

The drought scenario selected for analysis is based upon the projected driest 20-year span within the suite of 10 statistically downscaled Fifth Coupled Model Intercomparison Project (CMIP5) Earth system model projections (from an initial set of 32 models in the CMIP5 collection) found to best represent the regional hydroclimate [39,40]. Described in detail in California’s Fourth Climate Change Assessment [39], this drought scenario originates from the Hadley Model (HadESM2-ES) and aims to provide a ‘stress test’ to examine impacts on water resources should such a dry spell occur. The drought spans water years (WY) 2051–2070. Water years span 1 October to 30 September, with the year corresponding to the final year. For example, WY2051 spans 1 October 2050–30 September 2051. During the WY2051-2070 drought period, the median projected North Coast and Sierra Nevada precipitation is approximately 78% of the median 55-year historical period (WY1951–2005), and warming is approximately +3 °C [39]. Despite overall dry conditions, occasional wet years still occur.

2.2. Hydroclimate Projections

We acquired gridded, 1/16° (6 km) horizontal resolution, daily temporal resolution historical and projected estimates of precipitation, temperature, runoff, snow water equivalent (SWE), and evapotranspiration (ET) from Cal-Adapt (https://cal-adapt.org, accessed on: 5 June 2022) for the HadGEM2-ES simulation under representative concentration pathway RCP8.5. Historical hydroclimate estimates of temperature and precipitation produced by Livneh et al. [41] were used as input to the locally constructed analogs statistical downscaling methodology [39] to create historic (1950–2005) and projected (A.D. 2006–2099) hydroclimate estimates for the HadGEM2-ES model over the Pacific Southwest domain. We subset LOCA-generated outputs of projected temperature and precipitation for the historical period spanning 1 January 1950–31 December 2005 and the identified mid-century drought spanning 1 January 2050–31 December 2070 (water years 2051–2070).
Precipitation and temperature outputs from LOCA were used as input to the Variable Infiltration-Capacity Model [42] to produce a suite of hydrologic output variables at 1/16° (6 km) horizontal resolution and daily temporal resolution. We used VIC-generated SWE, runoff, and ET outputs for the same historical and projected periods as the LOCA output. Historical and projected hydroclimate conditions of median precipitation, SWE, and runoff are shown for the two periods in Figure 1. Aggregated, unimpaired VIC-derived runoff at streamflow gaging points for six major California river systems ultimately terminating at the Sacramento-San Joaquin River Delta (Figure 2a) were also acquired from CalAdapt at monthly time steps for the period spanning 1 January 1950–31 December 2099. The six rivers and their gage locations include the Sacramento River at Red Bluff, the Feather River at Lake Oroville, the Yuba River at Smartville, the Mokelumne River at Pardee Reservoir, the Tuolumne River at Don Pedro Reservoir, and the San Joaquin River at Millerton Reservoir. These six rivers—managed by local, state, and federal agencies to meet water resource demands (human and ecosystem) and mitigate flood hazards—span a range of upstream hydroclimate conditions, from rain-dominated (Sacramento River) to transitional (Feather and Yuba Rivers) to increasingly snow-dominated (Mokelumne, Tuolumne, and San Joaquin Rivers). In all cases, seasonal snowpacks in river headwaters play important, albeit varying, roles in the hydrologic cycle and water management (Figure 2a).

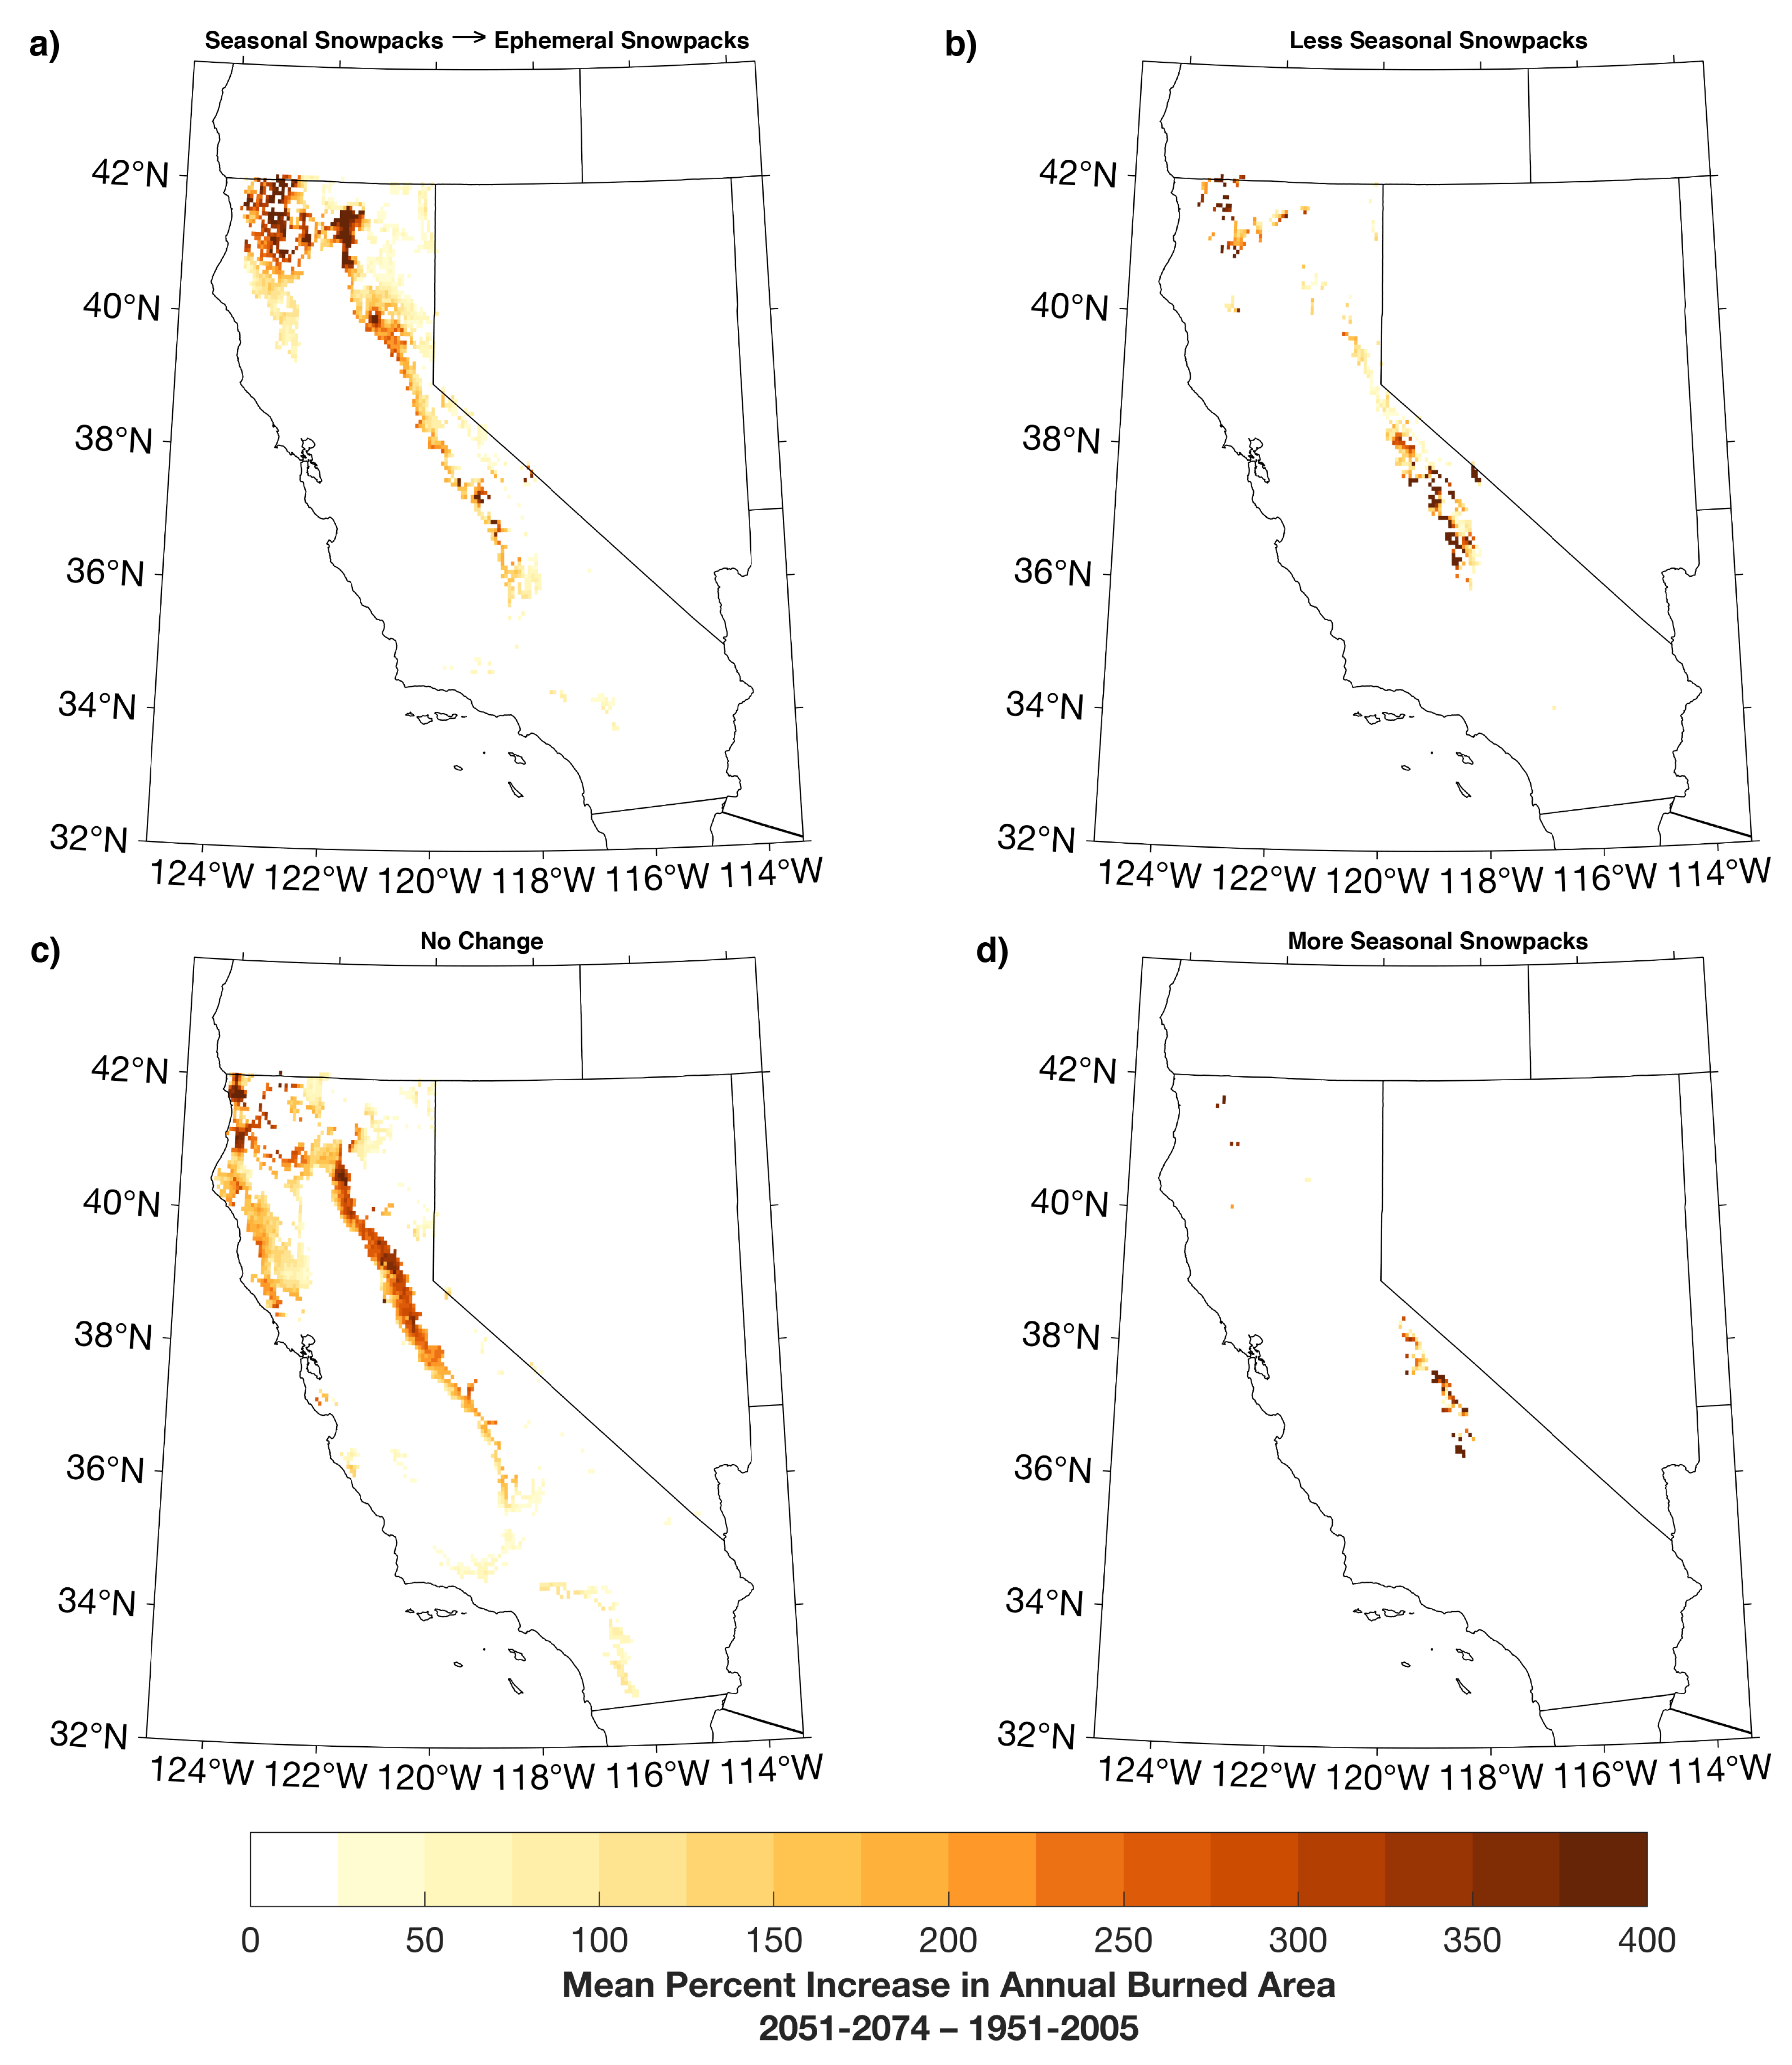
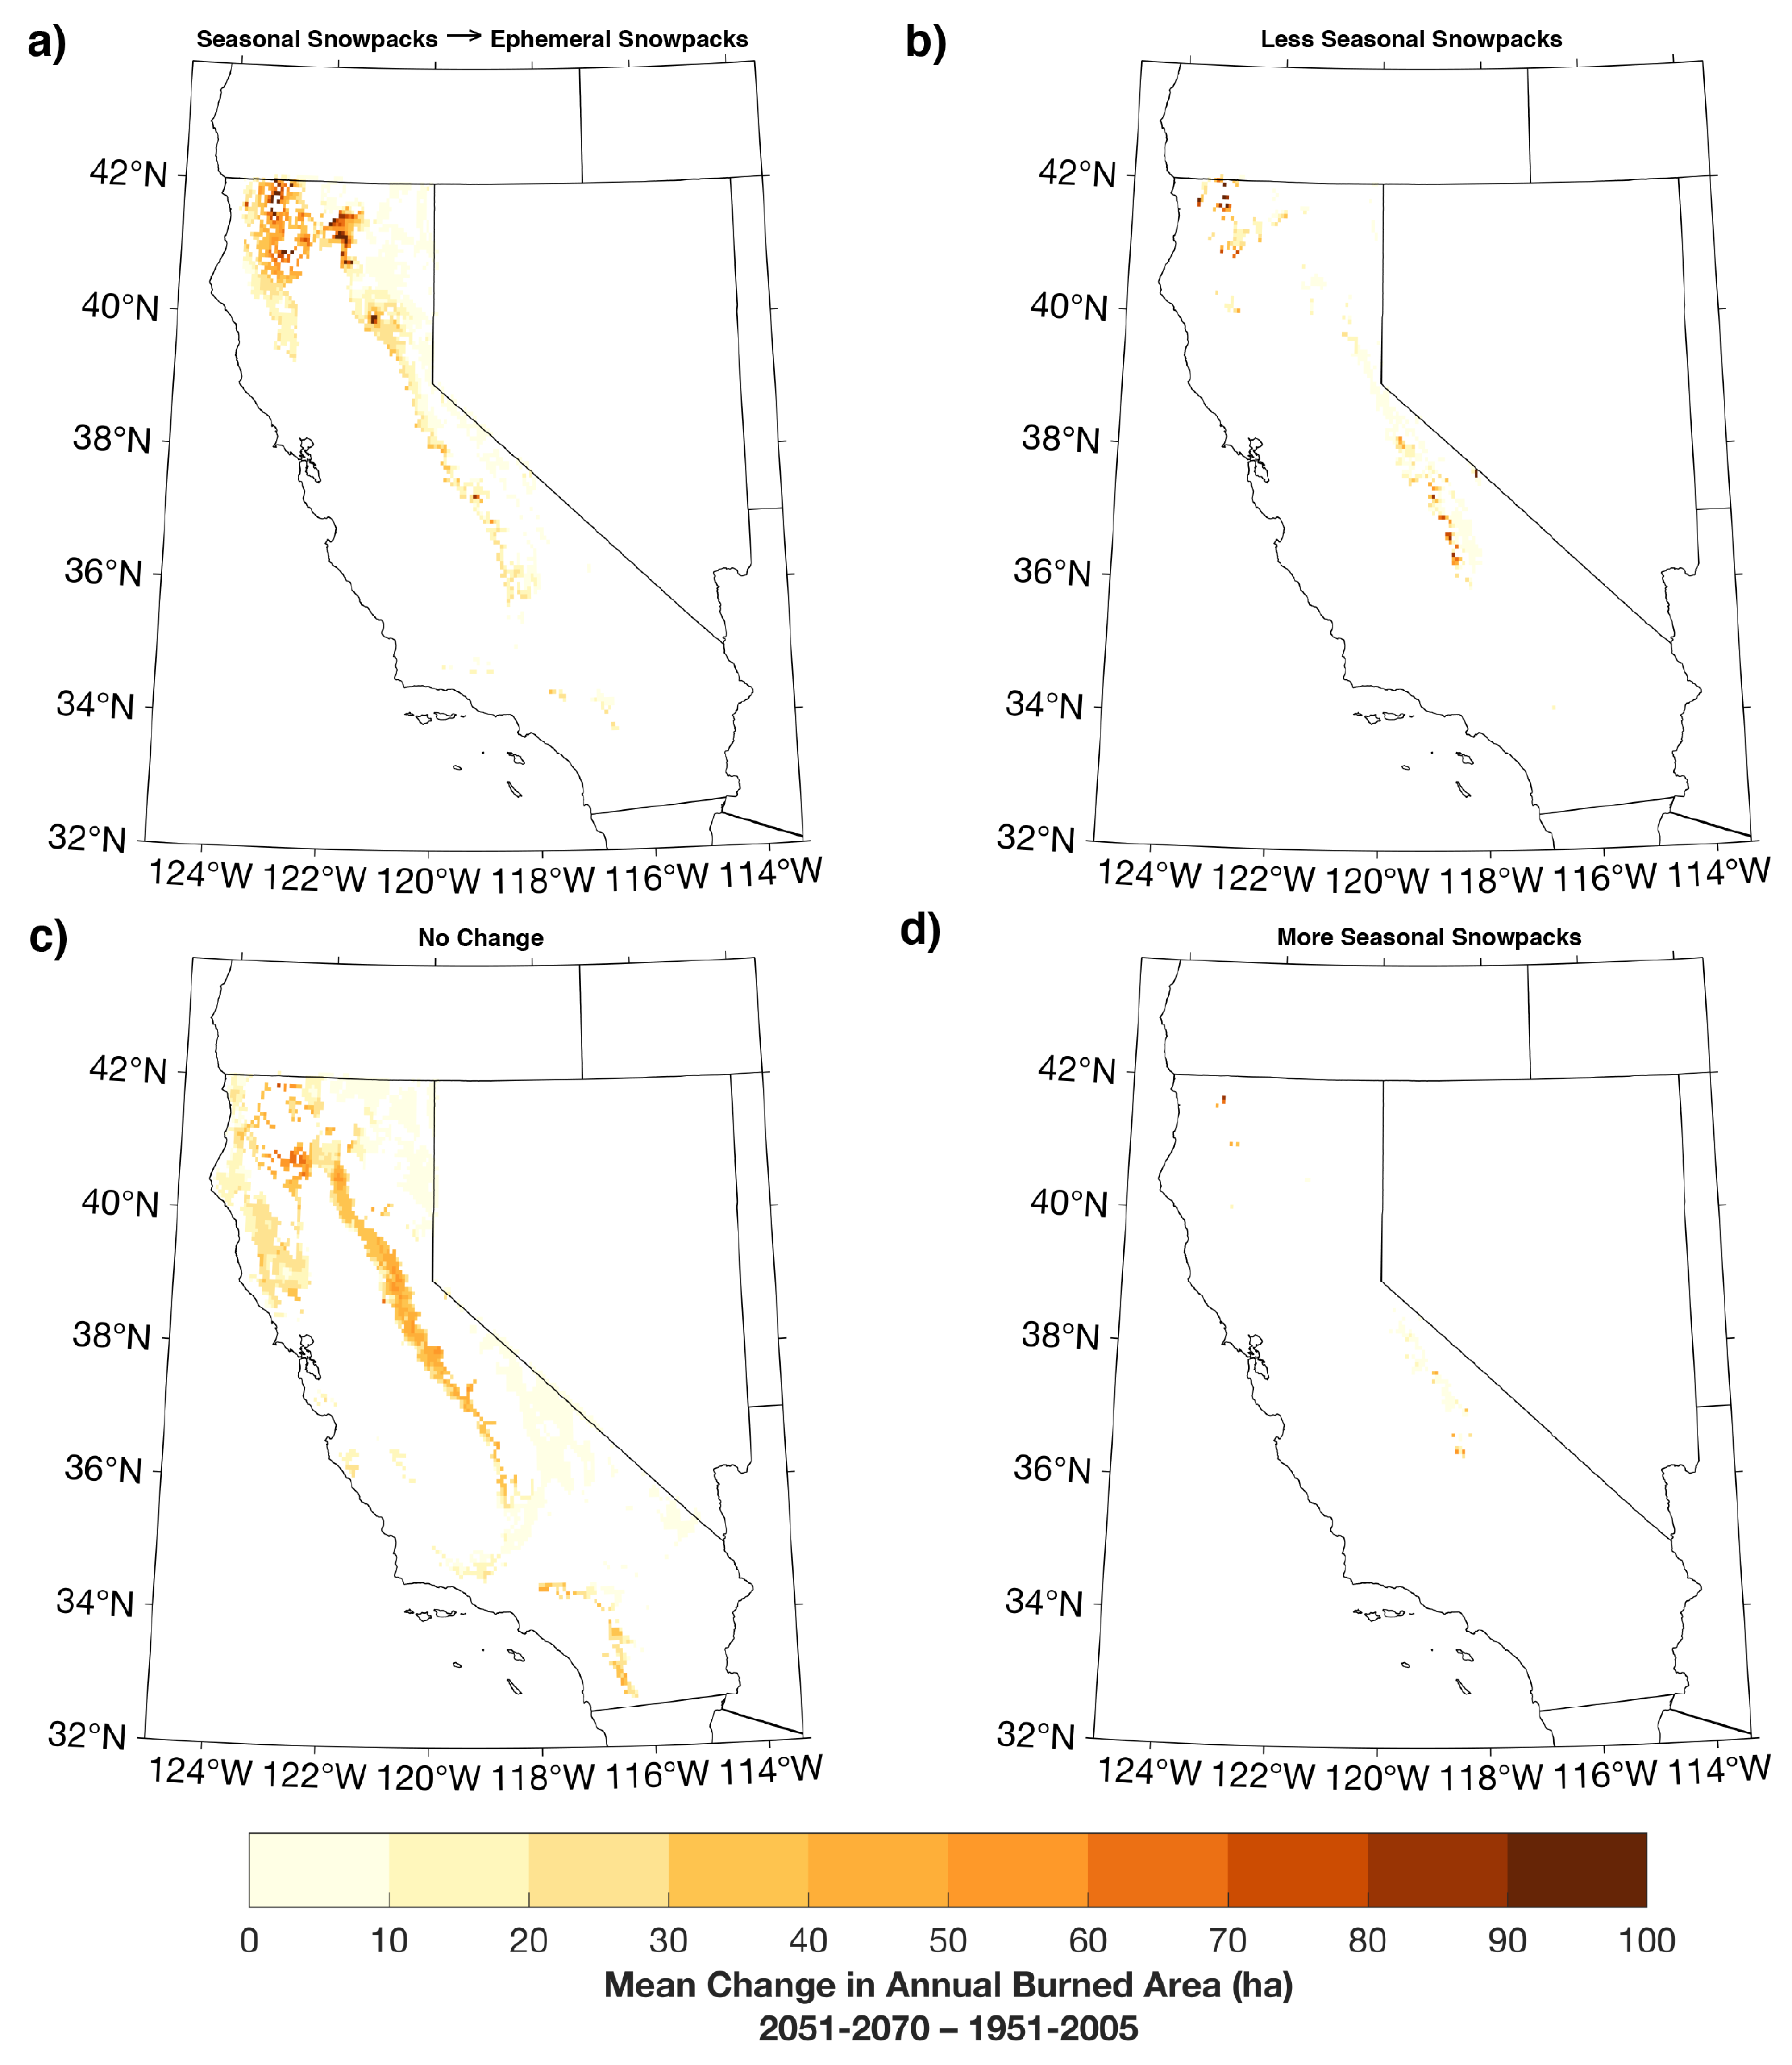
2.3. Wildfire Projections

A suite of statistical models of large wildfire occurrence (including frequency and size) were also developed as part of California’s Fourth Climate Assessment [43]. The suite of models comprises a range of population and development footprint scenarios as well as fuel treatment scenarios and emissions scenarios. It spans nearly the same period (calendar years 1953–2099) at the same horizontal resolution (6 km) as the LOCA and VIC inputs, making it ideal for evaluation in concert with other projected climate changes at local and regional scales. The wildfire model utilizes spatially explicit statistical and Monte-Carlo-based methods (i.e., random draws from appropriate probability models) to simulate key aspects of wildfire activity (e.g., fire presence, number of fires, fire size) at monthly timesteps using inputs of population, land use and land cover (including an additional fire regime condition class), and hydroclimate inputs. Hydroclimate inputs are provided by both LOCA and VIC outputs and includes daily maximum and minimum temperature, precipitation, and potential and actual ET. Ignitions, which are dominantly human-caused in California [44], were simulated using a Poisson lognormal model that mirrored historic ignition frequencies. Four ESMs provided input to the wildfire model, including the HadGEM2-ES model, which we evaluate here using the business-as-usual fuel treatment scenario (i.e., no forest fuel reduction treatments occurring at scale). Additional model details and limitations are provided in Westerling [43] and references therein. Model results are generally consistent with historic conditions providing greater confidence in reporting the expectations of a warming climate: statewide results include a 77% increase in mean annual area burned by the end of the 21st century with a nearly 50% increase in large fires (>10,000 ha), the majority occurring in inland forested areas of northern California [43].

3. Methods

3.1. The Snow Seasonality Metric

Petersky and Harpold [29] developed the snow seasonality metric (SSM) to identify seasonal and ephemeral snowpacks on a continuous scale. Seasonal snowpacks are defined following [27] with a requirement of 60 days of continuous snow cover. Continuous snow cover can be inferred from various snowpack variables, including S W E > 0 or s n o w d e p t h > 0 . The minimum 50 cm depth criteria imposed by [27] for seasonal snowpacks is not included, making the definition broader as in [33]. The snow seasonality metric is defined as:
S S M = D a y s S e a s o n a l S n o w D a y s E p h e m e r a l S n o w D a y s w i t h S n o w
We calculated the median SSM for historical and future periods, with differences reported as the future minus the historical. Because only one model realization was available and the sample size of the drought period small (20 years), we did not perform any statistical significance testing. Transitions in median SSM were identified as the following cases:
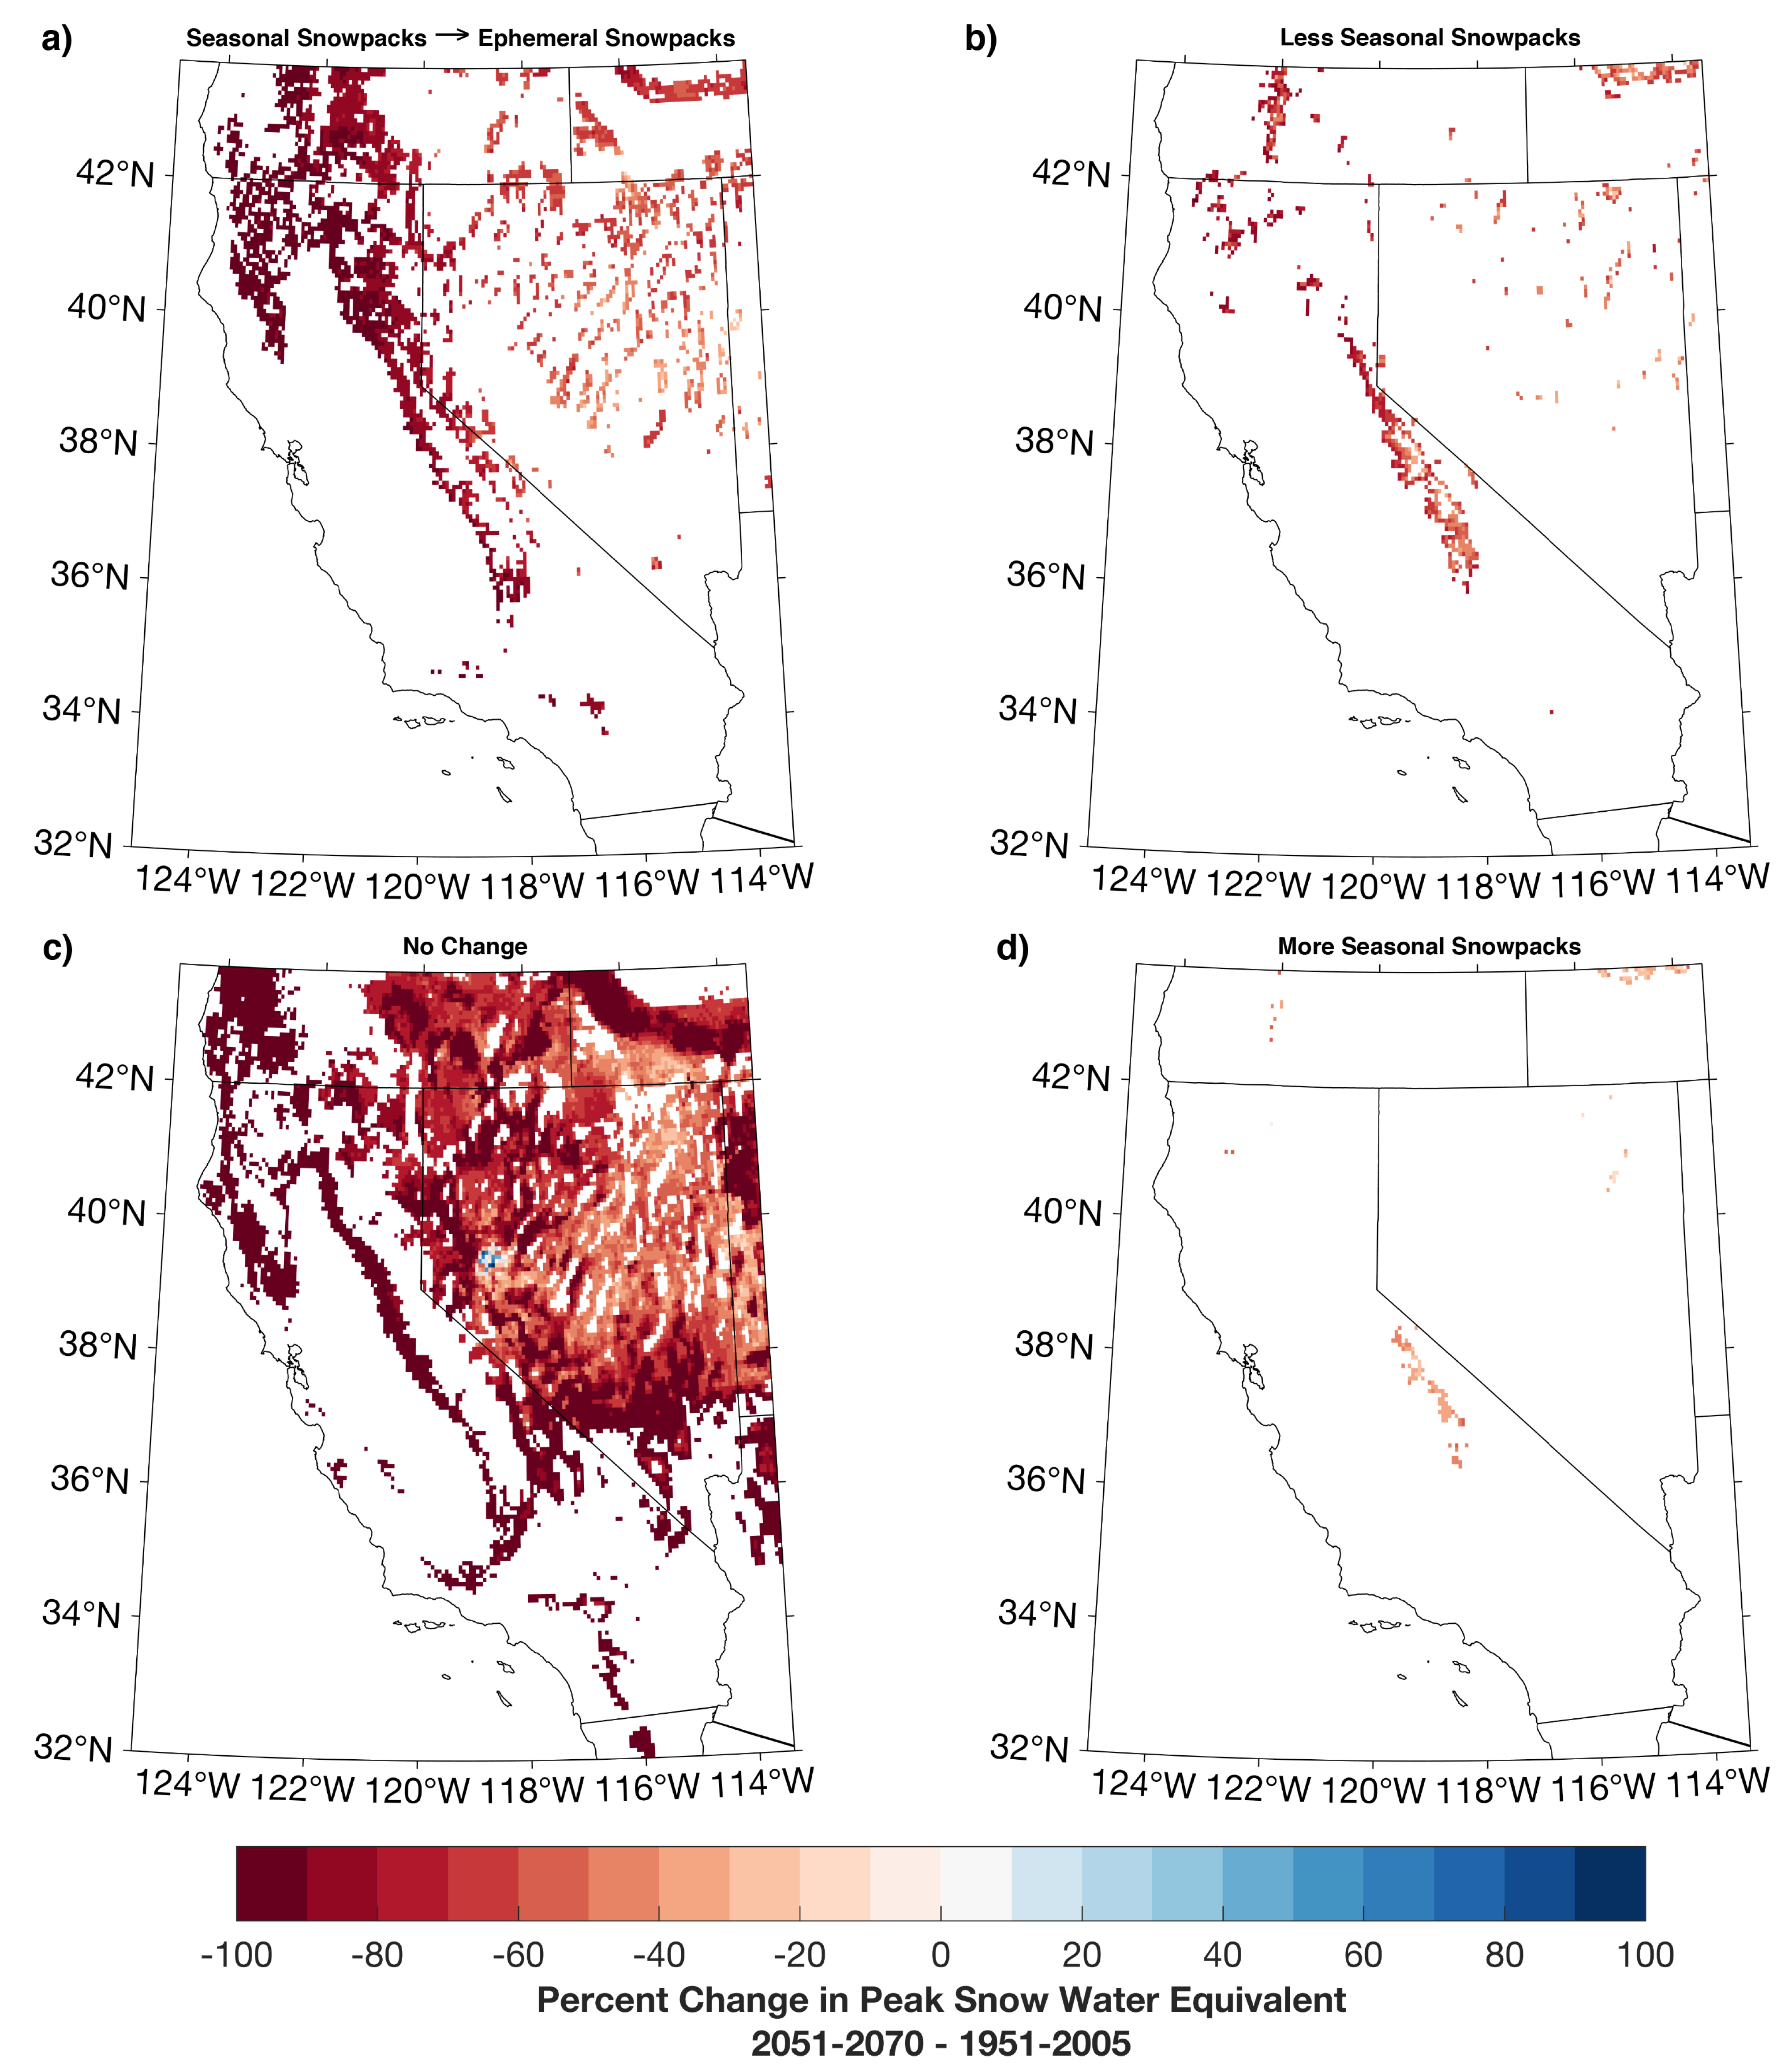
  • Seasonal snowpacks → ephemeral snowpacks: The transition from a seasonal snowpack to an ephemeral snowpack represents a notable change in the properties and role of the snowpack on the landscape. This transition indicates that on average, a 60-day period of continuous snowpack no longer occurs. Historically, many seasonal Pacific Southwest snowpacks can transition to ephemeral during dry (sunny and warm) and/or rainier-than-normal winter seasons [33].
  • No change: SSM values remain the same between the two periods.
  • Less seasonal snowpacks: Snowpacks that become less seasonal are expected to experience more days of ephemeral snow, but not enough to remove the 60 day continuous snowpack presence constraint (shifting them into the first category, seasonal snowpacks → ephemeral snowpacks). The most seasonal snowpack has an SSM equal to 1, indicating once snow begins falling for a winter season, it accumulates continuous before peaking and beginning its ablation back to snow-free conditions. As a result of ephemeral snow days before beginning the seasonal cycle of accumulation or following the melt-out of seasonal snow, the SSM will often be less than 1. The increasing fraction of fall or spring precipitation falling as rain instead of snow [45] and increasing dry day frequencies [46] are two ways during the shoulder seasons to create more ephemeral snowpacks as less snow accumulates and more opportunities for melt occurs.
  • More seasonal snowpacks: For a seasonal snowpack to become more seasonal in a warmer and drier world, there must be a decline in the number of ephemeral snow days, driving the value produced by Equation (1) to approach 1, likely to occur only in high elevations where snow is not transitioning to rain during the core winter season. The loss of high elevation ephemeral snow days is likely the result of winter or spring drying (enhanced seasonality), an additional expectation of California climate change [47,48], as temperatures during precipitation more frequently remain cold enough to produce snow.

3.2. Other Projections

All other projections (hydroclimate variables and burned area) were subset by the four snow seasonality transition regions to examine changes. Peak SWE was calculated as the annual maximum of SWE for each grid point. Wildfire projections, as noted in Section 2.3, were only available for California. Thus, the subset regions are limited to within the state’s boundaries. Streamflow at the six major river systems is reported as median monthly fractions of median total historic flow for the time periods reported. Dry days were defined as days with zero (0 mm) precipitation for the water year or the fall season (September–November). Water year ET was summed for each year, and the median date at which 95%, or the vast majority, of the total ET for the water year was found.

4. Results

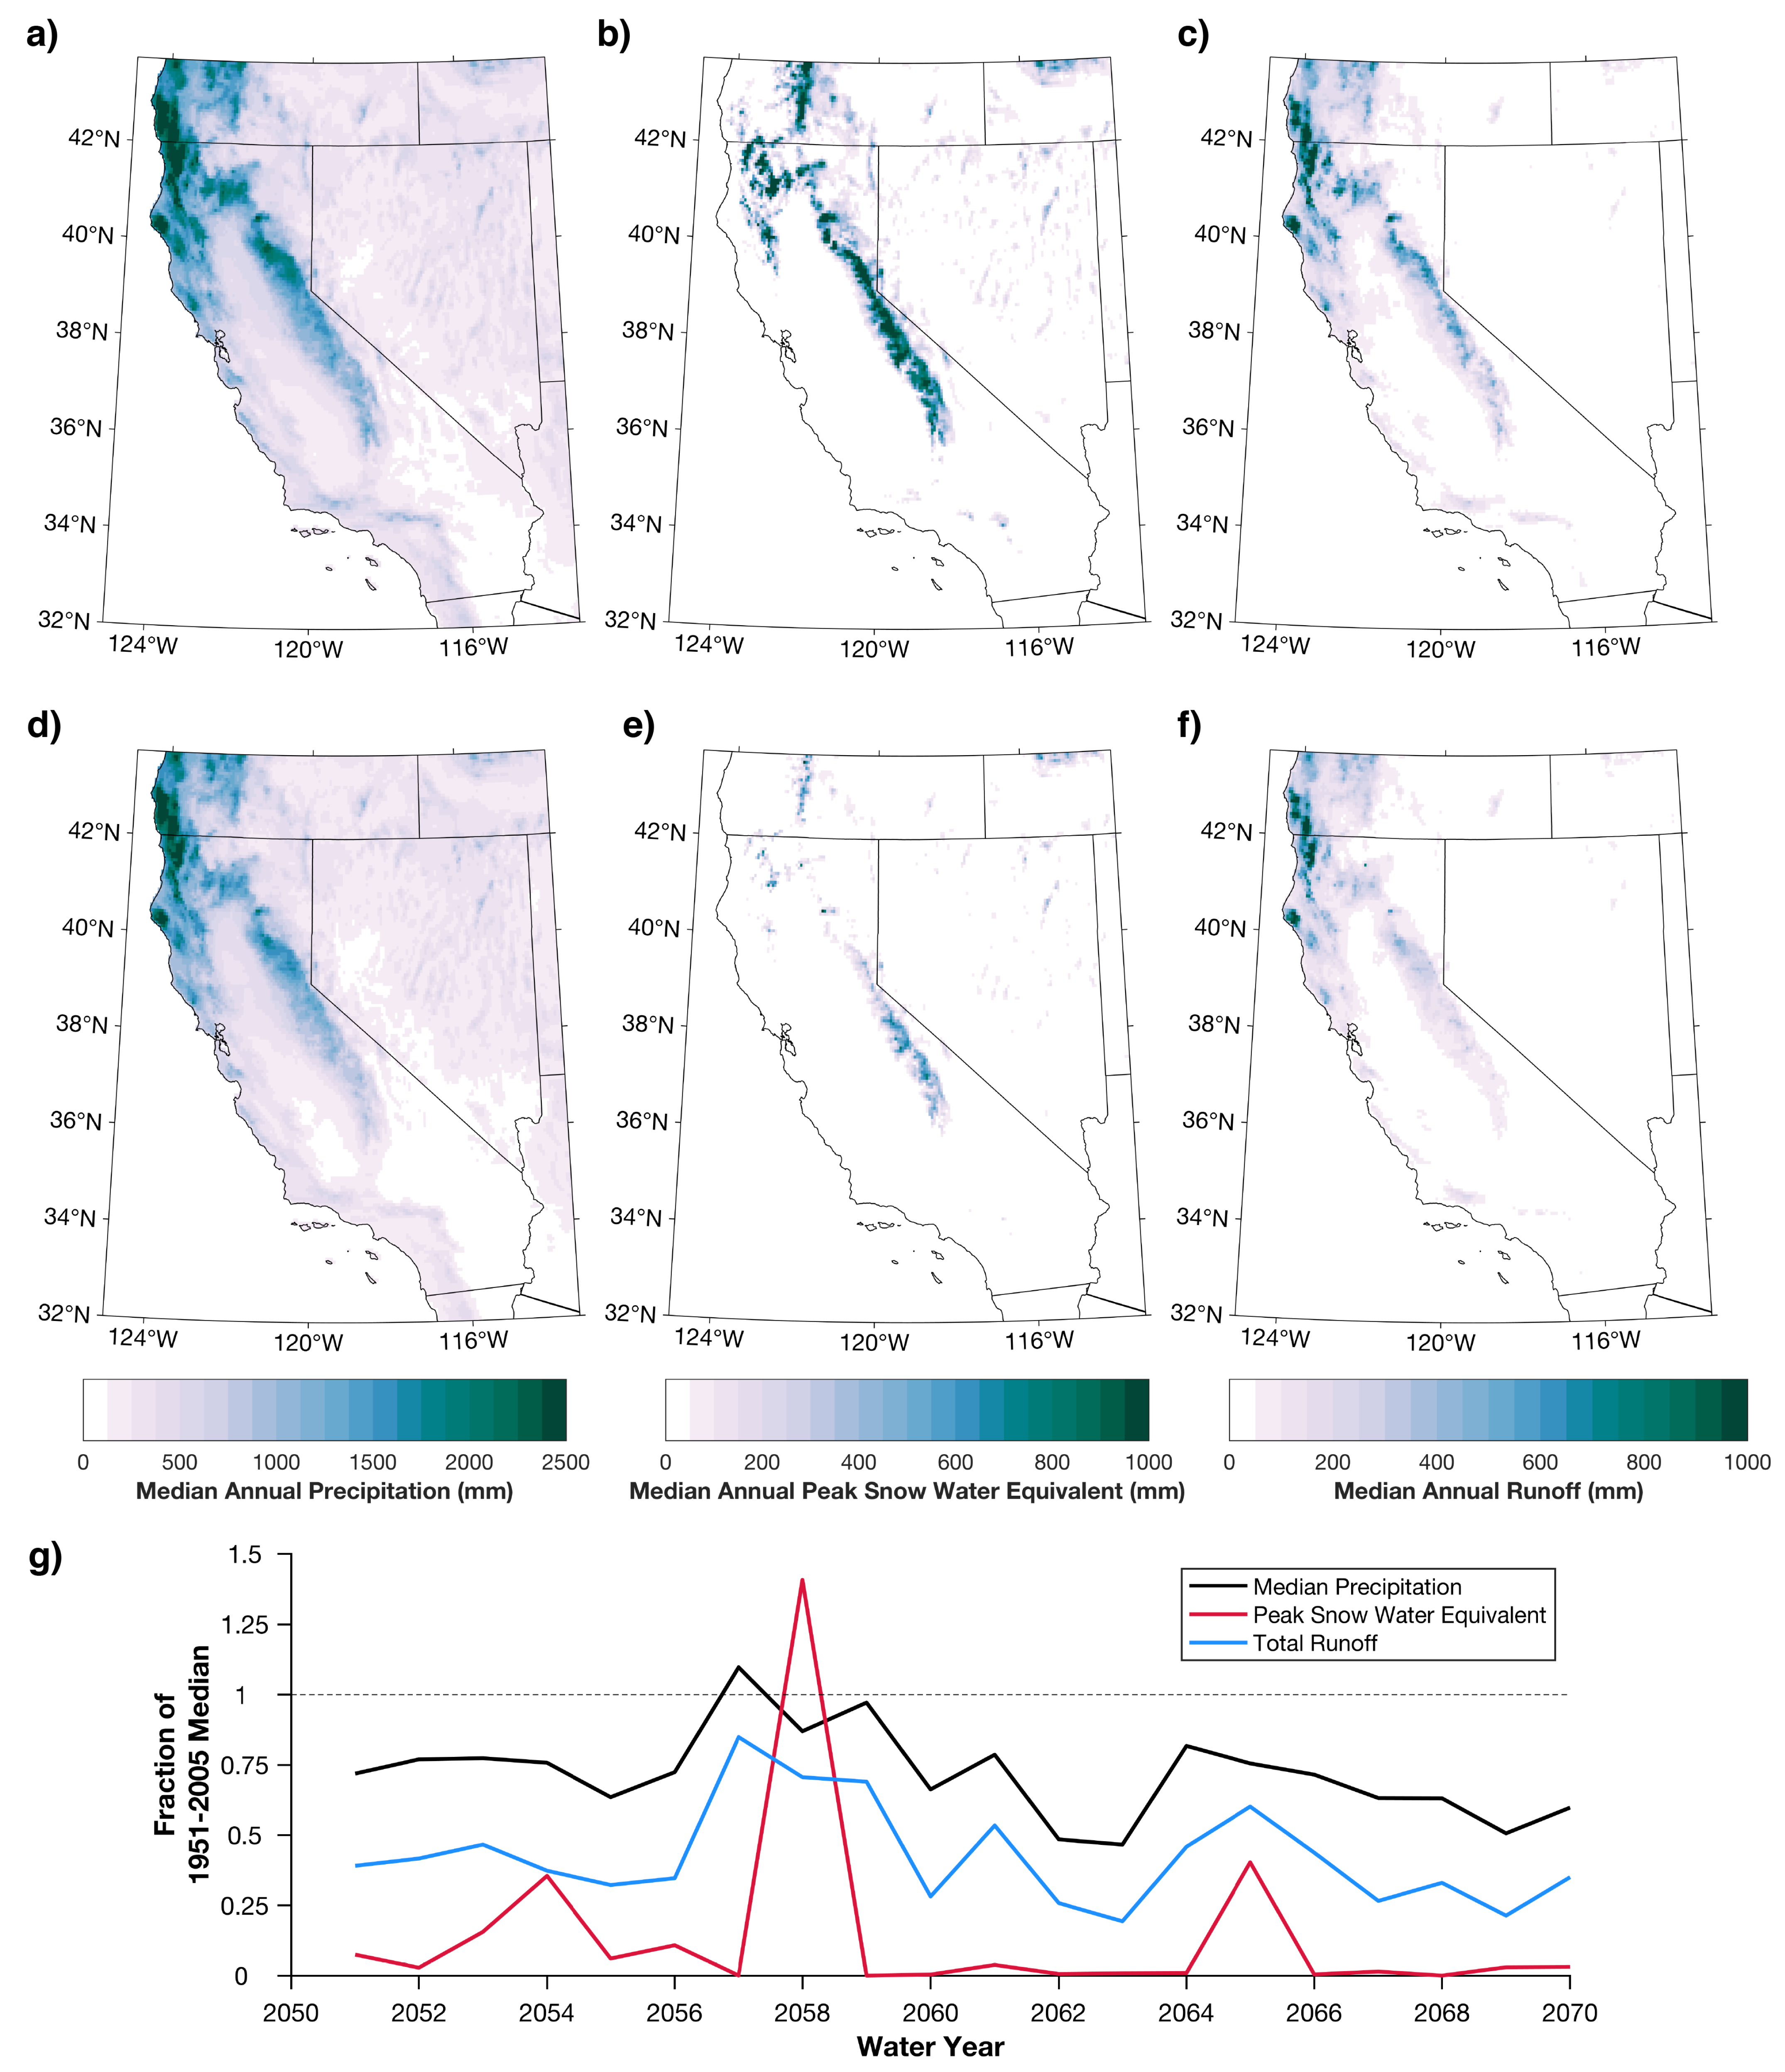
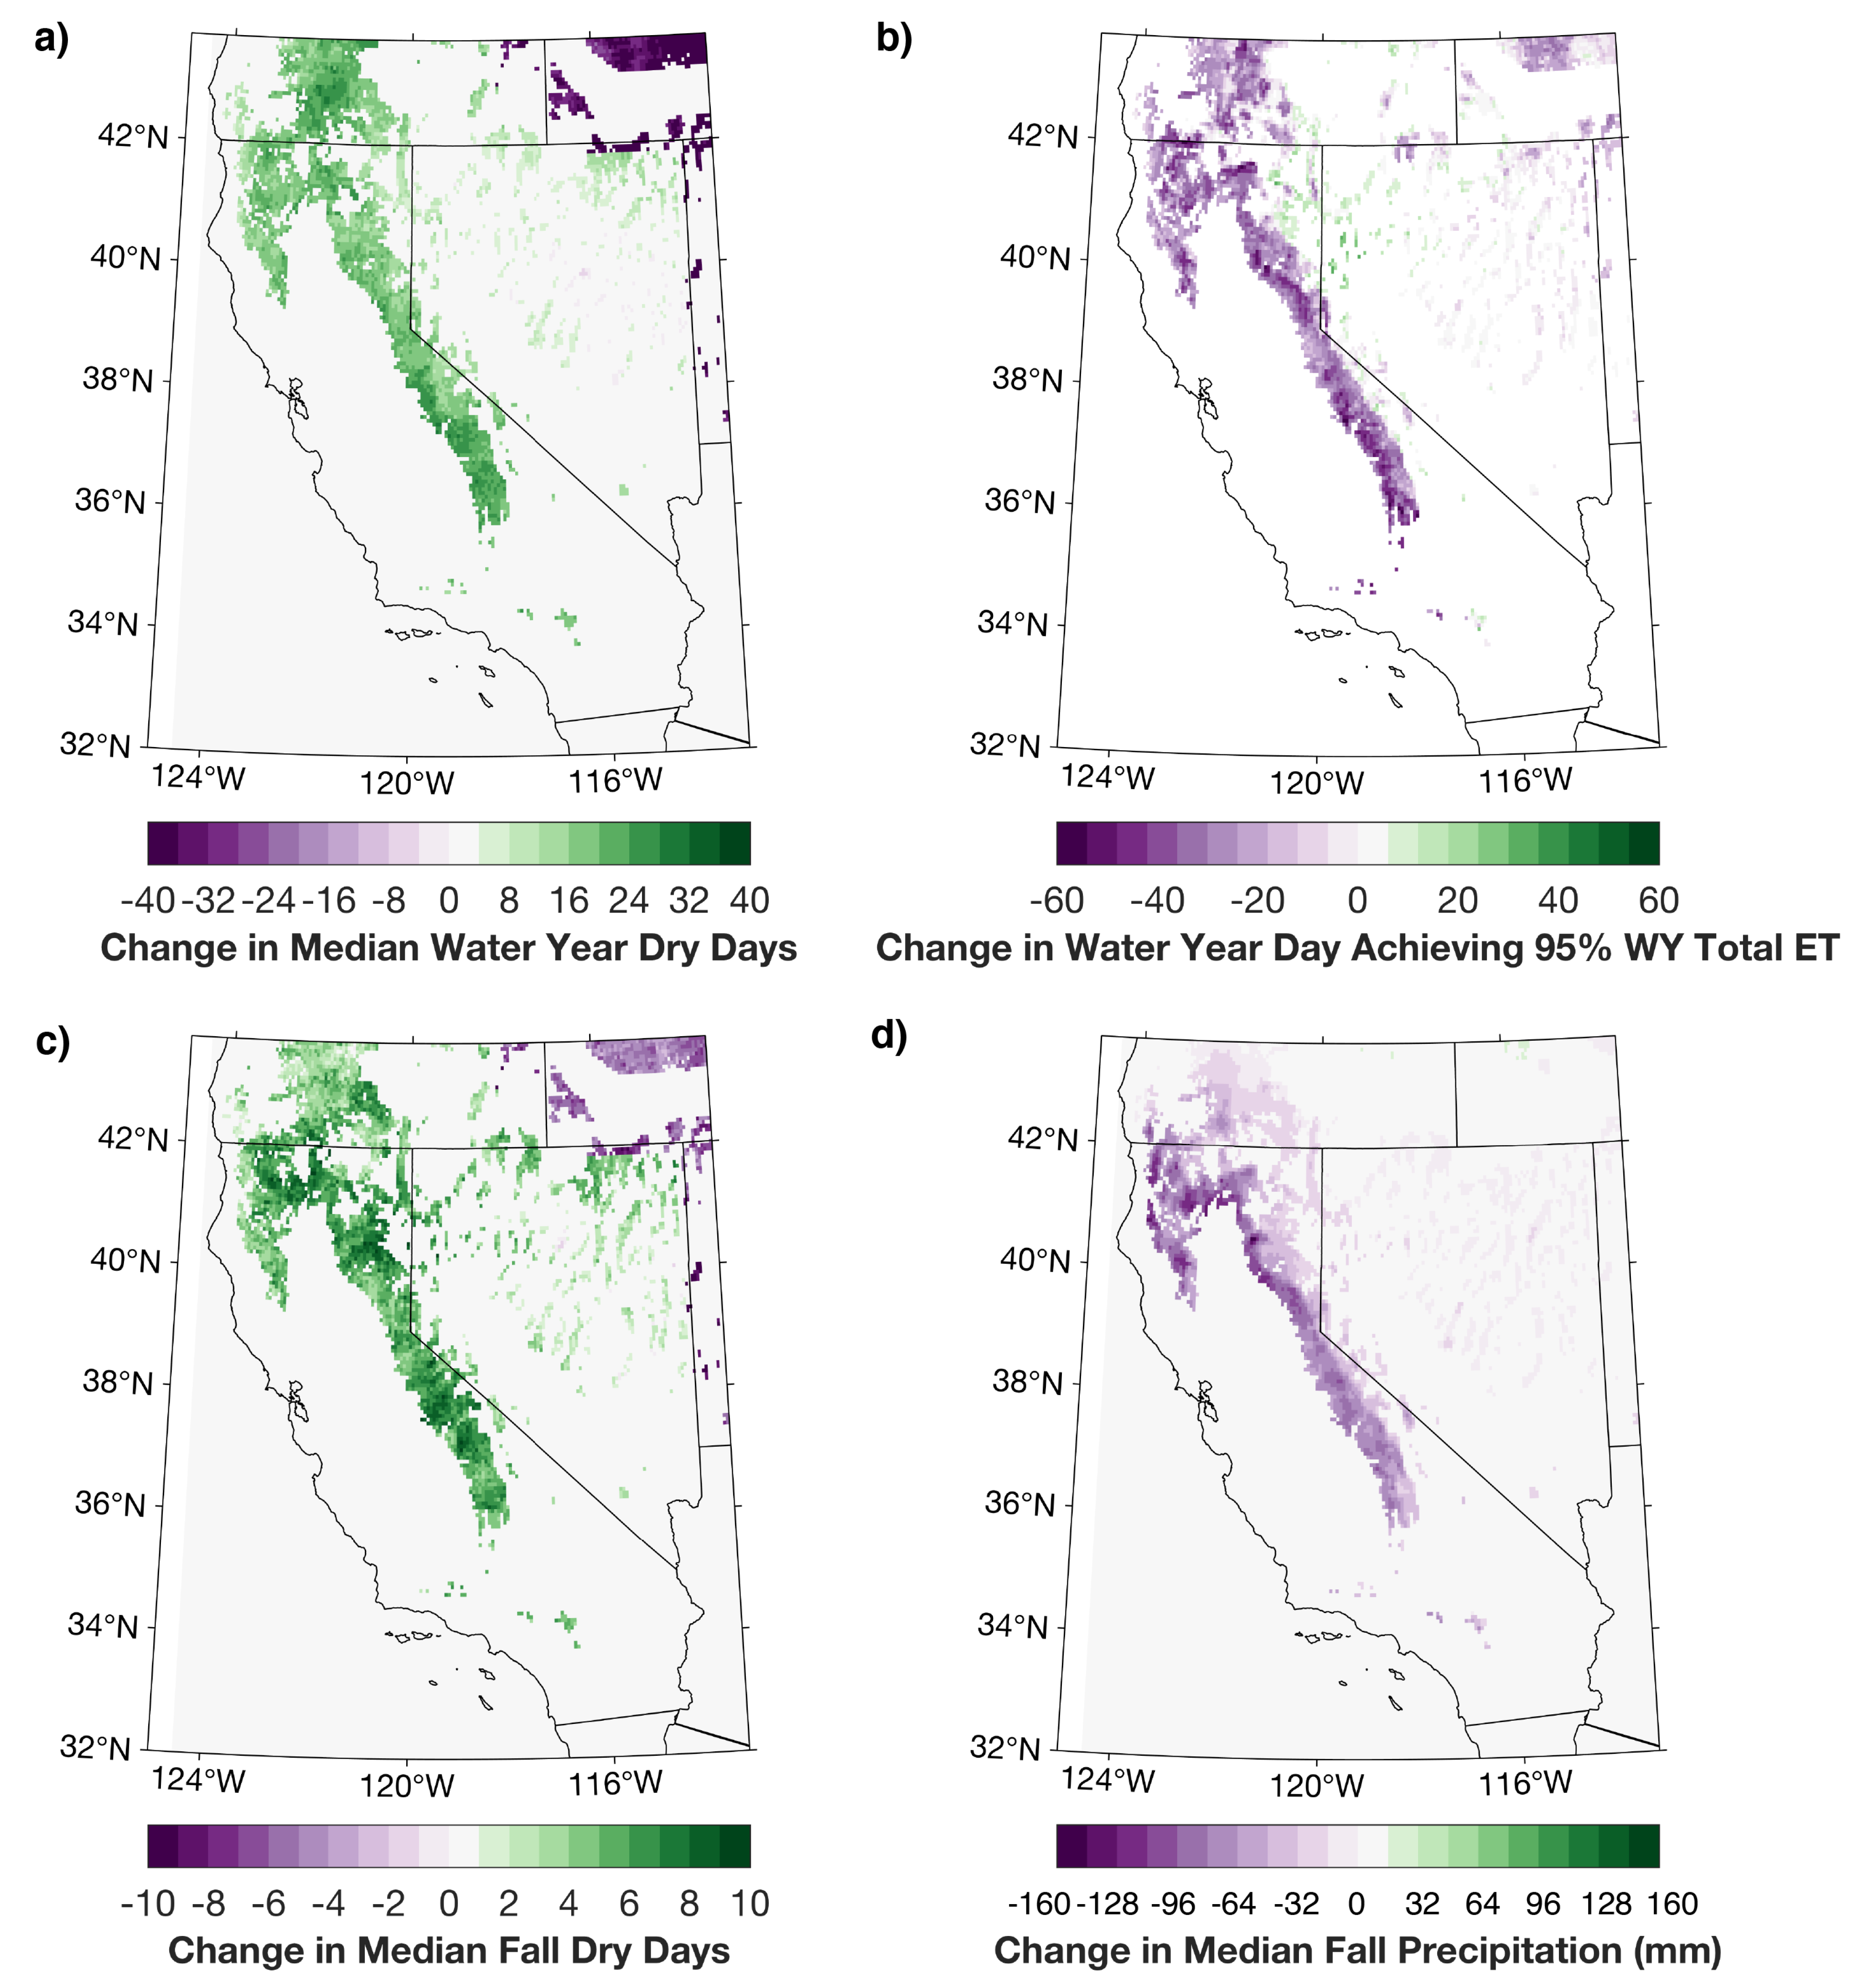
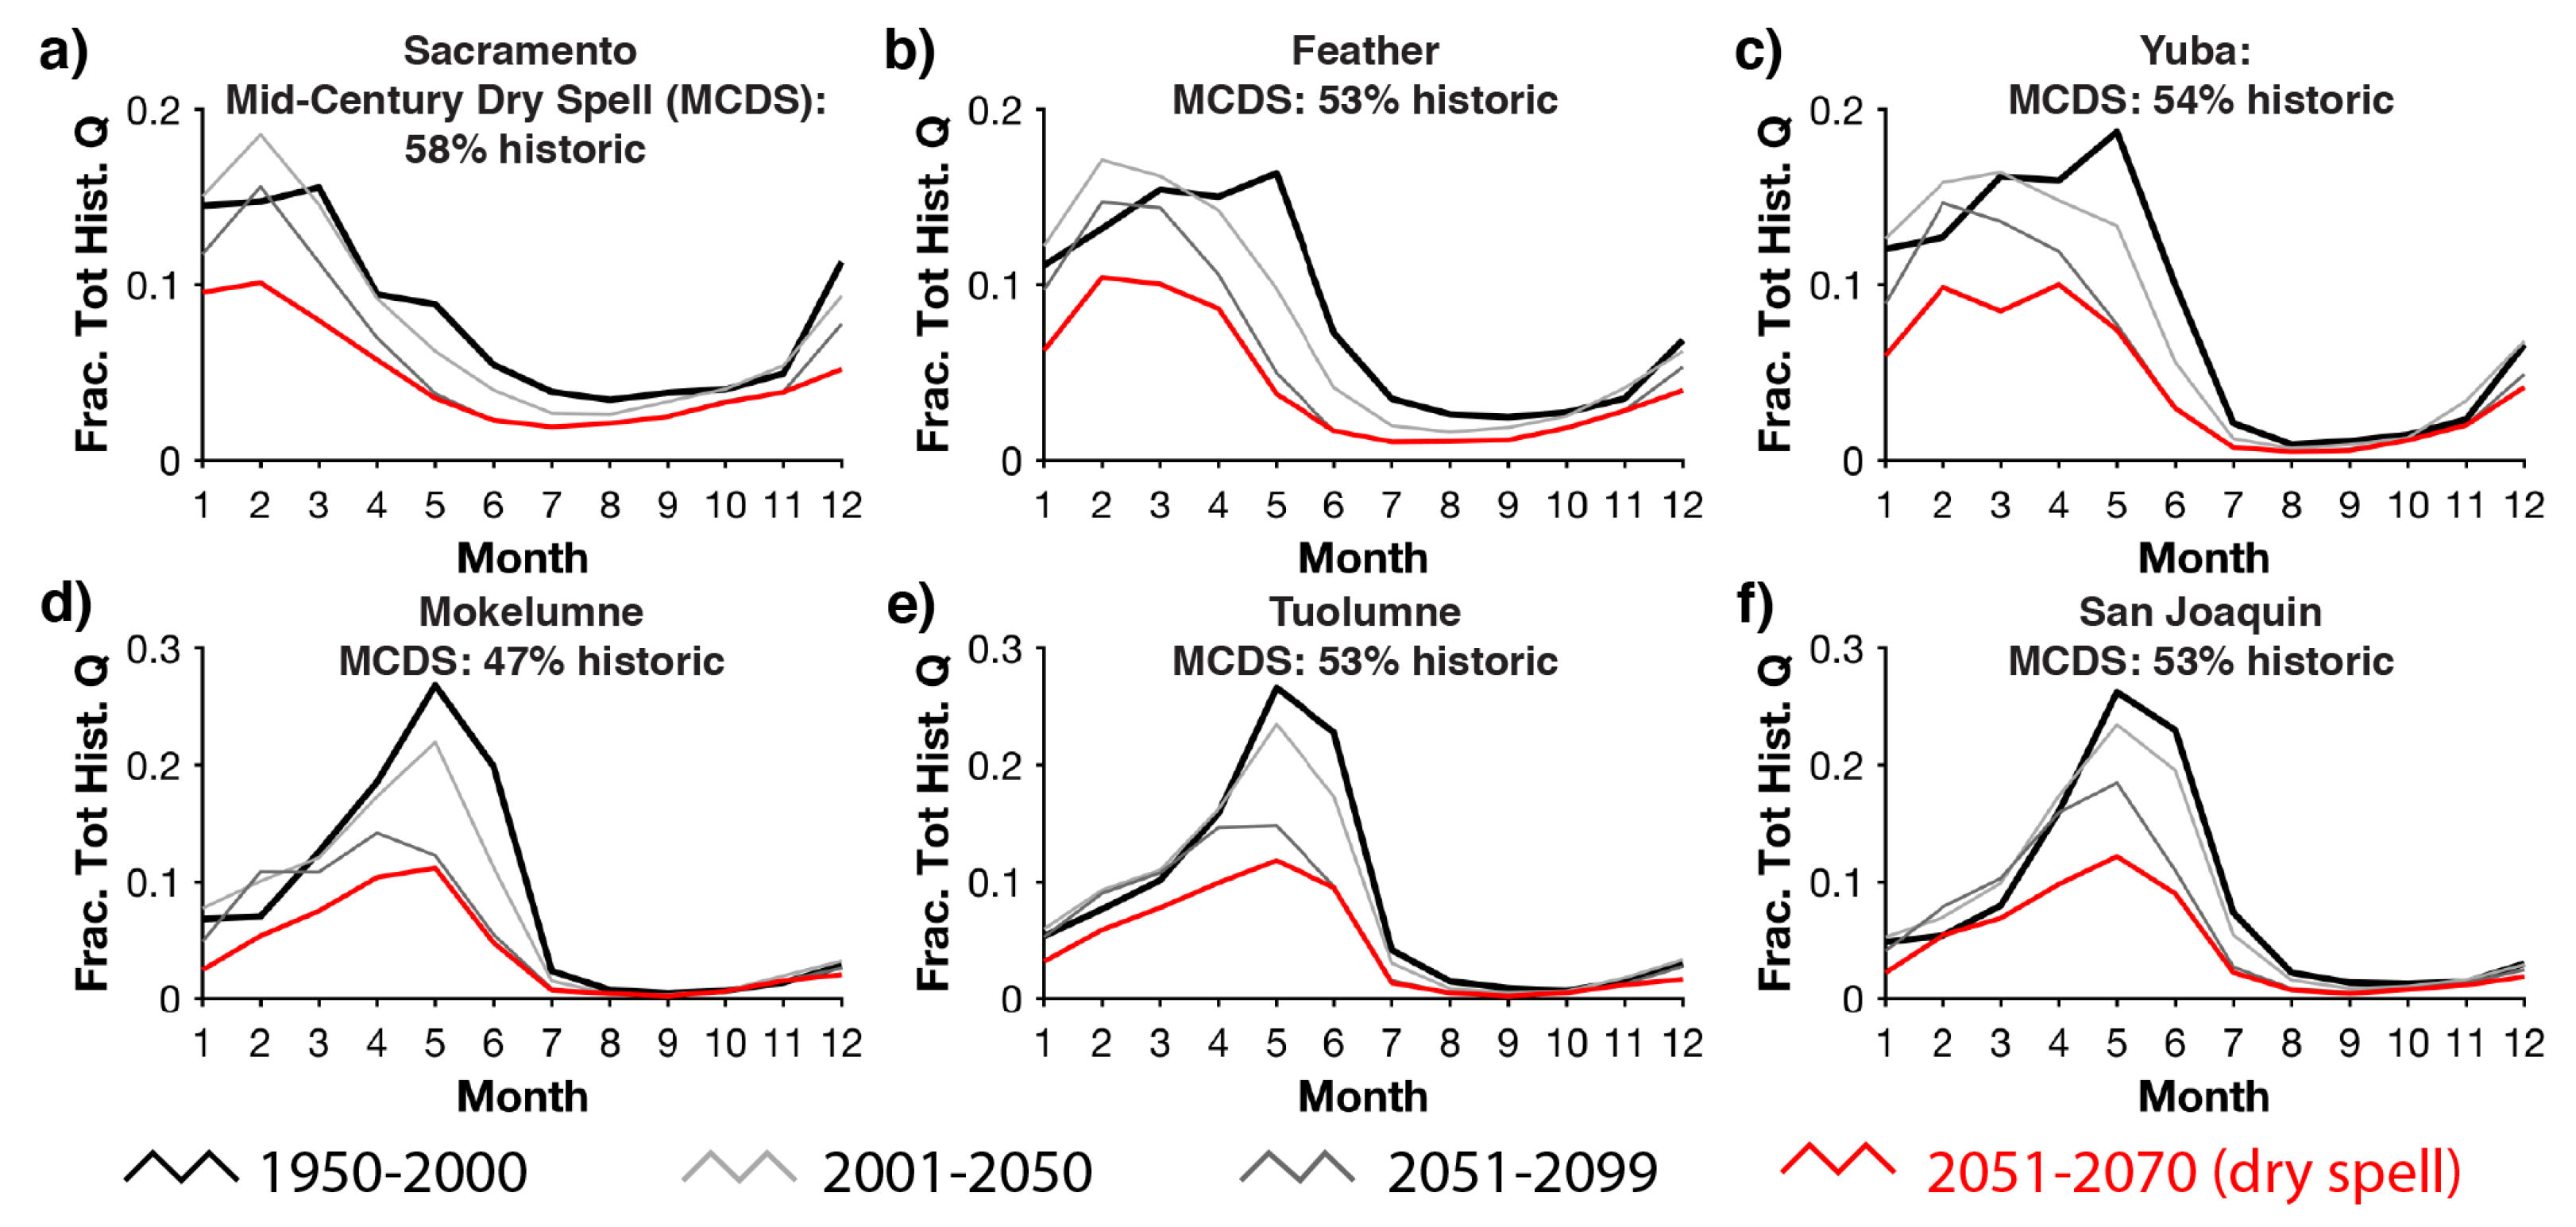
4.1. Characteristics of the Mid-Century Dry Spell

The mid-century dry spell is characterized by domain-wide declines in median precipitation (Figure 1a,d), with a median statewide precipitation of 72% of historic. Despite dry conditions overall, three years show near-historic levels of precipitation (Figure 1g). Given a +3 °C of mean warming, this warming and drying drives region-wide declines in snowpack with the majority of years at or below 25% of historic peak SWE (Figure 1g). This is consistent with mid-to-late century SWE loss projections of 50–70% across a range of future projections in the literature [8]; Figure 1b,e and Figure 2b). The largest declines in peak SWE magnitude occur in northern California’s southern Cascades and Sierra Nevada (Figure 2b) that drain into the Sacramento, Feather, and Yuba Rivers (Figure 2a). Consistent with decreased precipitation and a warmer and drier atmosphere, runoff also broadly declines across the domain (Figure 1c,f) to a statewide median value of 38% of historic runoff during the dry spell. Annually, runoff is well-correlated (Spearman’s rho = 0.9, p < 0.0001) with precipitation (Figure 1g).

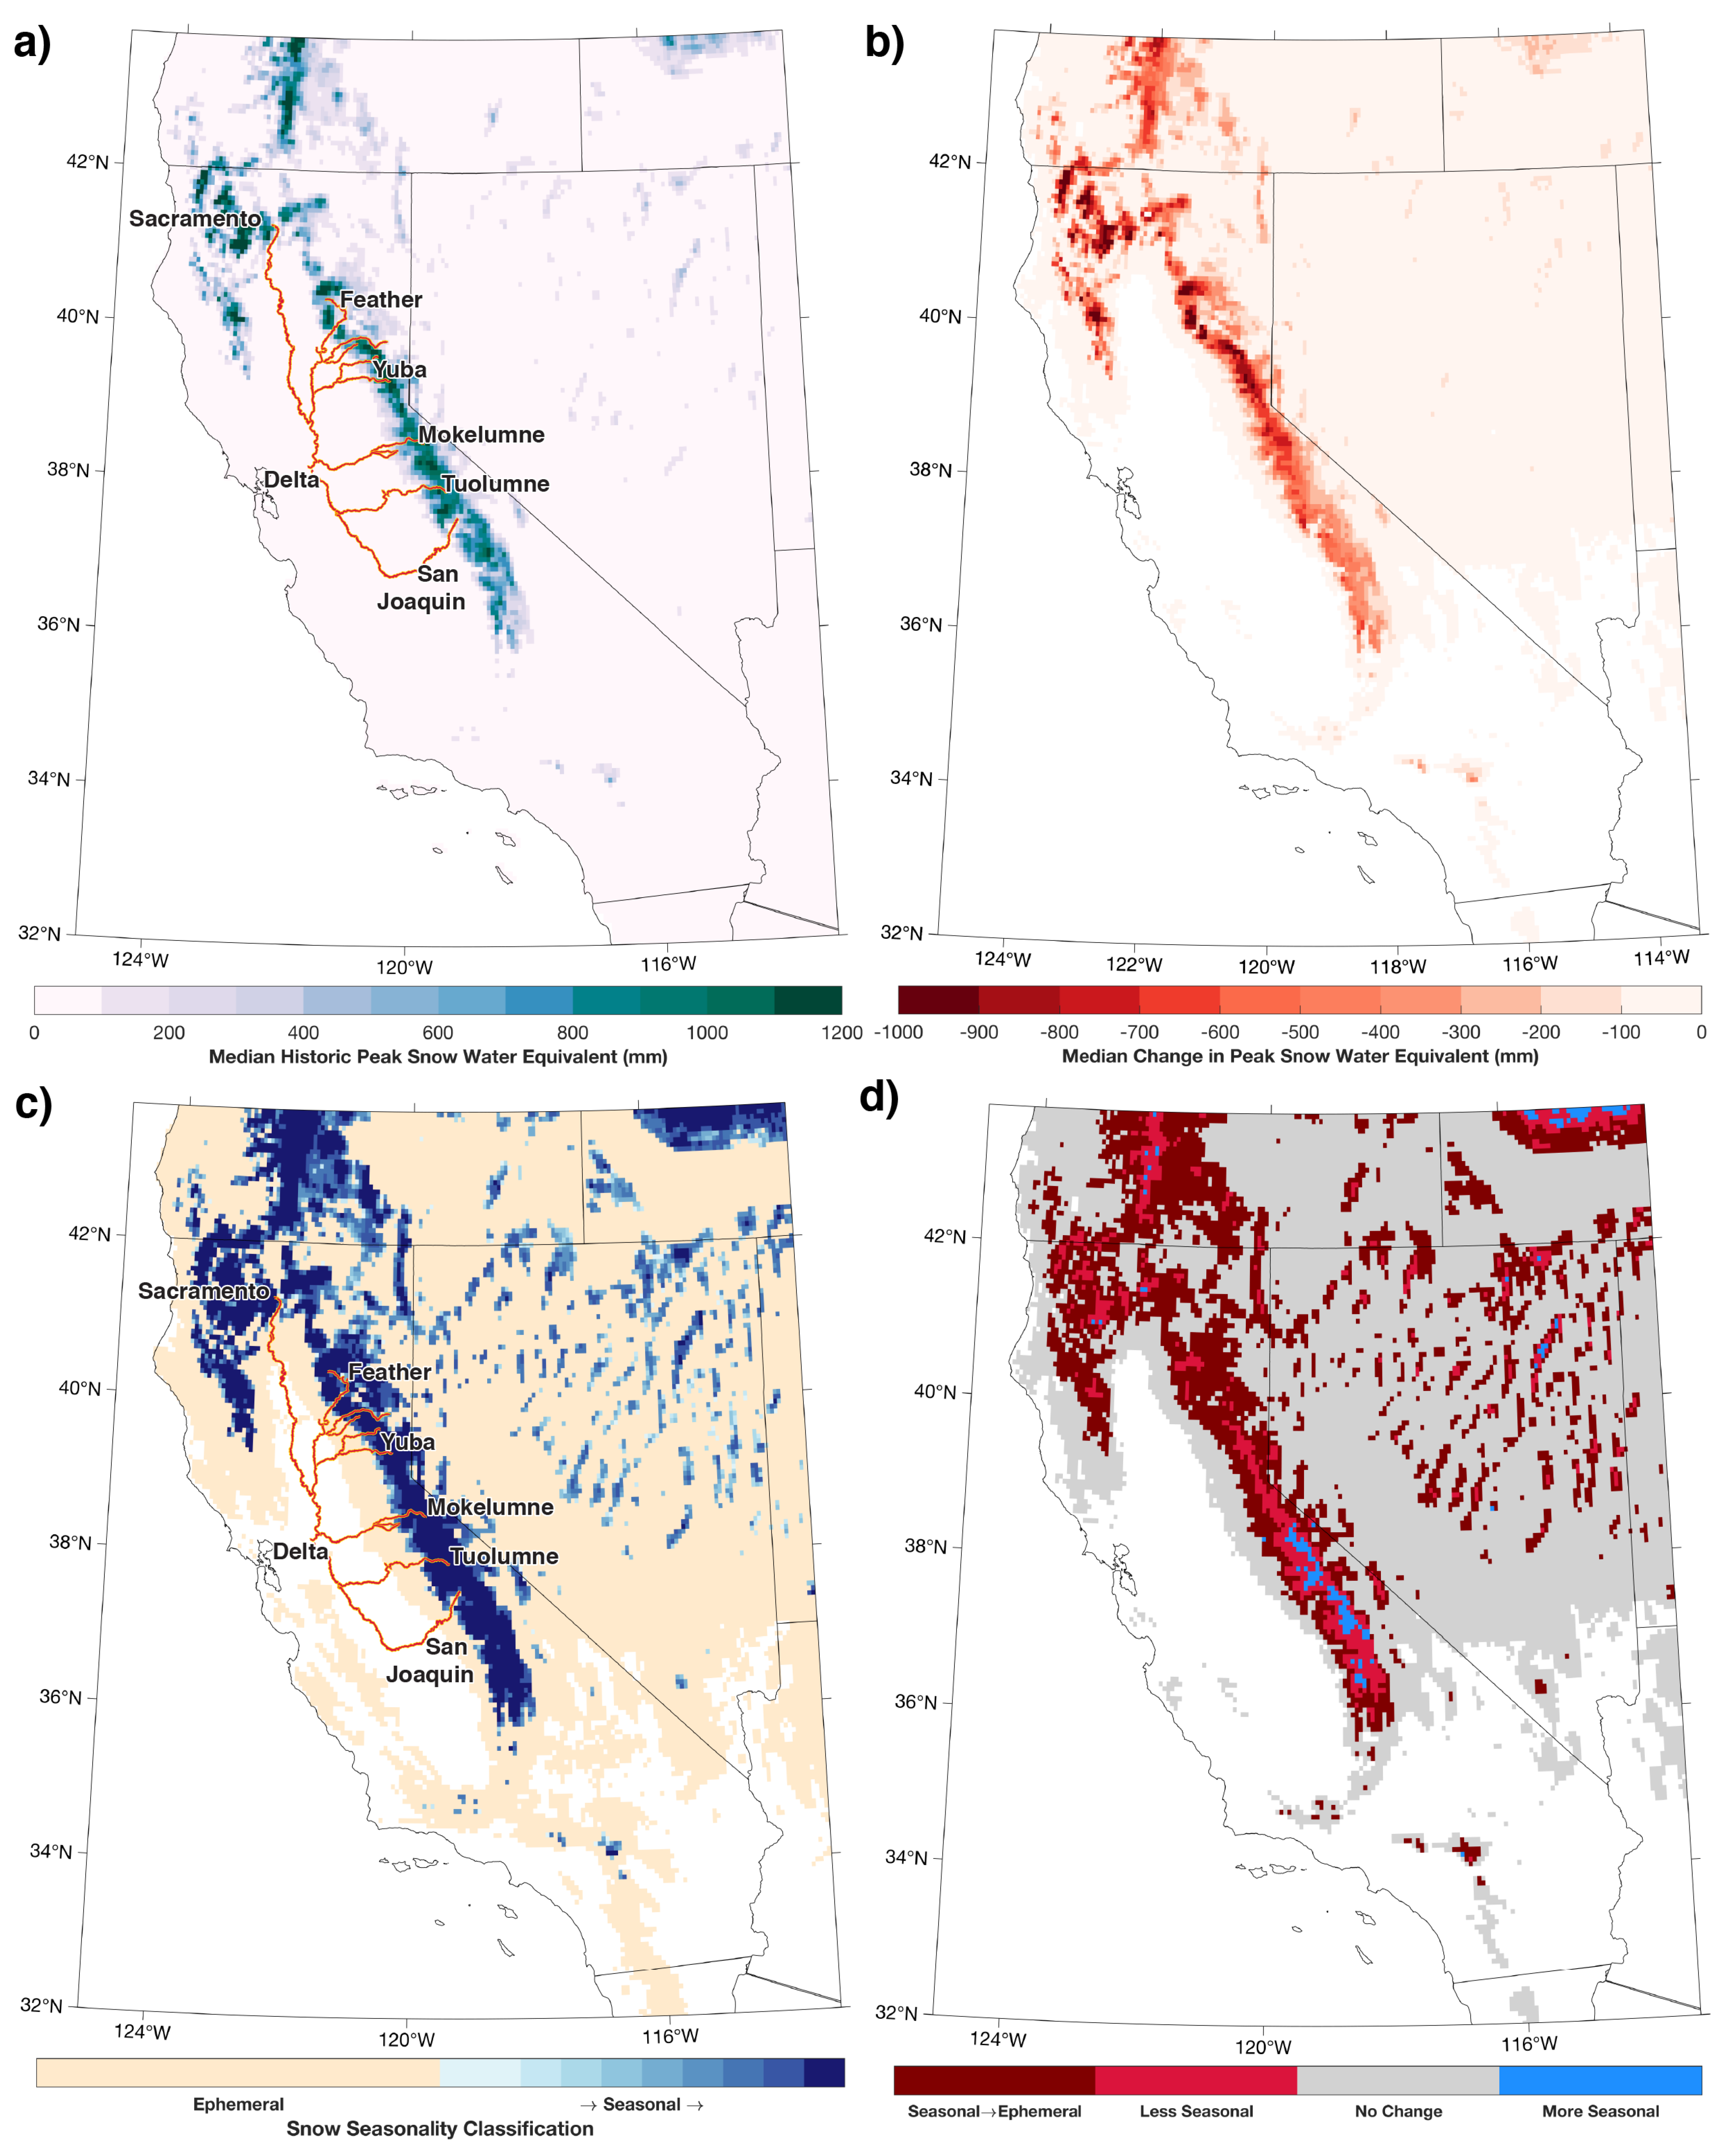
4.2. Effect of the Mid-Century Dry Spell on Snow Seasonality

Snow seasonality transitions compared to historical conditions (Figure 2c) are evident throughout the domain in response to decreased snowpack accumulation amidst warmer and persistently drier conditions (Figure 2d). Although many historically ephemeral regions remain ephemeral (83%; Figure 2d), they demonstrate reduced peak winter snowpack accumulations compared to historical conditions (Figure 1b,e and Figure 2c). 17% of the area encompassed by historically ephemeral snowpacks no longer accumulates a snowpack during the projected dry spell. Historically seasonal snowpacks transitioning to ephemeral snowpacks compose large areas (80%) of lower to middle elevations surrounding mountains throughout California, Oregon, Nevada, and Idaho. Higher elevation regions (17%) become less seasonal near the crests of the Sierra Nevada (California), Ruby Mountains (Nevada), southern Cascades (southern Oregon), and southwestern Rockies (southwestern Idaho). Only the highest elevations, near the crests of major mountain ranges, become more seasonal (4%) as drying fall and springs reduce the number of snow days before and following seasonal snow accumulation and melt, making the numerator larger in Equation (1). Sub-setting snowpack declines by transition region indicate substantial losses (50–100%) in historically seasonal snowpacks that become ephemeral snowpacks (Figure 3a), moderate losses (30–80%) in remaining seasonal snowpacks (Figure 3b,d), and near total peak snowpack loss in historically ephemeral snowpacks (Figure 3c).

4.3. Wildfire Projections

Wildfire projections subset by snow seasonality transition regions indicate widespread and large (200–400%) increases in projected area burned across California snow zones during the mid-century dry spell, especially in the north state regions highlighted by [43]. In seasonal snowpack → ephemeral snowpack transitions, the greatest increases in burned area are projected for the northernmost portions of California (Figure 4a and Figure 5a). The remaining seasonal snowpacks are projected to have less increase in area burned (Figure 5b,d) as a result of infrequent historical wildfire at high elevations. This implies small increases in area burned will equate to large percentage changes (increases on the order of 300–400%; Figure 4b,d). Historically ephemeral snowpack regions, which remain ephemeral (no change), observe widespread and large increases (100–200%) in the annual area burned along the western slope of the Sierra Nevada, with smaller increases across California.

4.4. Changes in Streamflow

Region-wide reductions in precipitation and runoff (Figure 1) and snowpack seasonality (Figure 2) alter the magnitude and timing of streamflow (Figure 6). The mid-century dry spell indicates upwards of 50% decreases in flow during the winter and spring months at all locations; these flows are lower than late-century projections (2071–2099), which are relatively wetter but warmer. Peak monthly flows decline in all locations, with the largest declines in the snow-dominated Mokelumne, Tuolumne, and San Joaquin rivers (Figure 6d–f). The Sacramento and Feather Rivers undergo the greatest projected warm season flow decreases (Figure 6a,b). During the mid-century dry spell, peak flow timing shifts one to two months earlier in the rain-dominated Sacramento and transitional Yuba and Feather basins (Figure 6a–c). Later century projections extending to 2099 indicate how additional warming will cause a one-month earlier shift in peak flow timing in the Mokelumne and Tuolumne basins (Figure 6d,e). In the San Joaquin basin, peak monthly flows continue to occur in May through the end of the century (Figure 6f).

5. Discussion

A key signal of climate warming is a reduced snowpack [1,7,8,38]. By additionally assessing changes in the snowpack’s seasonality, we gain additional perspective of how the mountain hydrologic system changes, why it changes, and how these changes may impact local and downstream communities and their water resources. During a projected “worst case” scenario—the driest 20-year span in the 21st century—we identified widespread transitions of seasonal snowpacks to ephemeral snowpacks and less seasonal snowpacks (Figure 2b). This implies more sporadic presence/absence of snow and shorter durations of seasonal snowpacks. Such a climatological transition to persistent dry snow drought throughout the season [49], or what has been termed “low-to-no snow” [8], is consistent with projections for overall drying [50] but also precipitation-induced drying of the shoulder season (i.e., fall and spring; [47]), an increased fraction of precipitation falling as rain rather than snow [51,52], more frequent dry days [46], and generally higher humidity of maritime ranges favoring melt [53]. Indeed, the HadGEM2-ES model simulates an increase in dry days throughout the water year (Figure 7a). The increase in fall dry days (Figure 7c) contributes to decreased fall precipitation (Figure 7d). Projected increases in dry days during fall and less fall season precipitation indicate an extension of historic trends resulting from delayed strengthening of the Aleutian Low [48]. Combined, these conditions limit snowpack accumulation and present additional opportunities for snow to melt under sunny and increasingly warm and dry conditions, favoring ephemeral snowpacks or shallower and warmer seasonal snowpacks.
Increasingly ephemeral snowpacks and persistent drought pose challenges to water management paradigms built on the assumption of abundant seasonal snowpacks [8,12,19,54]. With less snowpack cold content [27], ephemeral snowpacks are more prone to melt and potentially increase flood hazards [55]. Elevated midwinter runoff, whether via radiation-driven melt or rain falling instead of snow, often occurs at the expense of later season flows as this water is not stored in the mountain snowpack and is more readily available for ET, lowering runoff efficiency. With a hypothetical multi-decade dry spell, we show a reduction of median annual flows to nearly 50% of historical levels (Figure 6), which correlates with increasingly ephemeral snowpacks in the Sierra Nevada. While we were not able to perform statistical significance testing due to the single model approach and the small sample size of the future drought, the magnitudes of projected change during this dry spell would likely stress the reservoir and floodplain management practices predicated on a past climate [8,19]. The ongoing “Millenium Drought” starting around 2000 in the southwestern U.S. [21] is likely the best analog for the stress and impacts a projected drier and warmer future would bring to water resources, ecosystems, and society. Both the ongoing situation and the projected dry spell scenario examined here highlight that infrastructure could benefit from retrofitting and new construction to enable operations supported by increasingly available real-time monitoring [56,57] and forecasting of atmospheric and land surface conditions [58,59,60] to more effectively capture, convey, and store [61,62] mountain-generated runoff. The water management implications of an earlier shift in peak flow timing (Figure 6) will be compounded by the fact that there could also be fewer but more extreme [63,64,65] and warmer [52,66,67,68] high-impact atmospheric river events, even amidst an extended drought [69]. Improvements and changes in infrastructure and management should incorporate community-based engagement strategies to ensure more equitable outcomes and enhance employment opportunities for populations most at-risk to weather and climate hazards [22].
Several cascading impacts could also result from snowpack decline across the U.S. Pacific Southwest. Reductions in seasonal snowpack drive losses in land available for snow-based winter recreation, consistent with historical trends [5]. These reductions could present major economic implications for tourism-dependent, often rural, and generally underserved communities [4]. As the contribution of snowmelt to runoff declines [70], warm season recreation and tourism suffer from low river flows, air quality reductions from local or long-range transport, as well as forest, road, and trail closures from increasingly large and frequent wildfires moving upslope into the seasonal snow zone (Figure 4; [6,23,71]). Snowpack loss over the Great Basin and changing synoptic circulations suggest increasing chances of hot and fire-favoring fall and winter season Santa Ana winds [24,72], which bring forth numerous negative economic and health impacts on large populations [73,74]. Additional reductions in streamflow from major rivers once flowing into the Sacramento-San Joaquin River Delta, particularly during the dry and extended warm season (June–September [75]) will exacerbate the existing suite of widespread problems arising due to changes in ecosystem health, water quality, water availability and electricity generation [11,76,77].
Projected increases in wildfire burned area in previously snow-dominated environments (Figure 5 and Figure 6) are cause for concern. These increases are consistent with projected warming-induced drying [50]. The 40–60 day shift in earlier timing of ET onset (Figure 7b) in tandem with reduced precipitation (Figure 1e) and snow cover duration (Figure 2d) suggests the transition from energy-limited conditions to moisture-limited conditions [78,79] will occur sooner during prolonged drought as soil moisture is well-correlated with snow disappearance date [80]. This transition suggests faster and earlier drying of live and dead fuels, greater chances of tree mortality [81], and longer durations when receptive fuels are present during increasingly arid autumns (Figure 7) [47,48,82].
Wildfire, especially high severity fire, alters mountain hydrology by changing the canopy structure, radiation balance, and soil physical properties of the environment [71,83,84,85,86]. These changes produce varying and potentially costly post-fire hydrologic hazards ranging from reservoir sedimentation [87,88] to mass movements [74]. To be consistent with our worst-case hydroclimate projection, we selected the worst-case forest management scenario (no fuel treatments) from Westerling [43]. Efforts to expand low severity prescribed fire or when possible, manage wildland fire for resource benefits [89], can help reduce fuel loading and canopy interception, thereby increasing snow water storage and water yield [90,91] while also lowering the risk of later large and severe wildfires [92]. These methods could preserve water supply reliability and improve ecosystem function in mountain watersheds.
This paper provides proof-of-concept for applying the snow seasonality metric to identify regions at risk of transition from seasonal snowpacks to ephemeral snowpacks. Our use of one ESM realization, intentionally selected as an end-member case of likely interest to water management as a ’worst case scenario’, is informative and a limitation. The SSM method can be extended to the other 31 LOCA-downscaled simulations from CMIP5, those in the other ESM ensembles (e.g., HighResMIP [9,93]), Coordinated Regional Climate Downscaling Experiments; [7]), as well as singular ESM studies (e.g., [30,94]).
Our approach yields results consistent with physical intuition. However, the sequential application of models (i.e., LOCA as input to VIC, VIC and LOCA as input to wildfire modeling) likely lacks two-way feedbacks or emergent connections that could alter results. Potentially missing feedbacks span the atmosphere-bedrock continuum [8] and include some of the following. Both hydrologic models and ESMs lack certain snow-albedo feedbacks, such as black carbon and litter deposition on snow and the gradient of canopy alterations following fire [71,83,86,95]. The multi-year post-fire changes in soil and vegetation properties influencing water and energy budgets vary with burn severity [86,96,97]. This variance potentially leads to underestimation of actual melt rates [98] and post-fire water yield [84]. Additional uncertainties in ESMs pertain to mountain precipitation phase partitioning and energy budgets potentially resulting in biased snow accumulation, persistence, and melt [7,8,99]). ESMs may also not capture extreme wind [100] or dry lightning [101,102] events that could influence the outcomes of the empirically-based wildfire model [43] and result in underestimates of ignitions and fire growth. Related to wildfire and runoff, the lack of time-varying CO2 concentrations in CMIP5 ESMs will impact ET and potential ET as plants respond differently to elevated CO2 levels [103]. Future studies using fully-coupled model approaches might evaluate snow seasonality sensitivity to projections of hydroclimate and land use and land cover change to further identify both vulnerable and resilient regions with the goal of prioritization of investments and adaptation strategies.

6. Conclusions

The coming decades will bring substantial hydroclimate change to the Pacific Southwest. This change involves warming temperatures, increased precipitation variability, snowpack decline, less efficient runoff, and increased wildfire potential. A “worst case scenario” 20-year dry period in the 21st century, identified using readily-available and state-sanctioned projections down-selected from a suite of simulations [39], was used to examine how such a multi-decadal drought could influence the hydrology and the fire activity in historical snow zones in the Pacific Southwest and California, respectively. Using snow seasonality classifications to identify historic snow zones and evaluate their projected changes during the multi-decadal drought, we found historically ephemeral regions will remain ephemeral but lose nearly all of their snow (Figure 2). The majority (80%) of historically seasonal snowpacks in the Pacific Southwest—also expected to lose significant peak snowpack (>50%)—will become ephemeral snowpacks (Figure 2). These hydroclimatic changes and snowpack transitions will influence ecohydrologic processes of the Pacific Southwest’s mountain watersheds in three ways. First, mountains will become less efficient at storing limited winter precipitation as snow (Figure 3). Second, snowmelt-derived runoff magnitudes will decline and runoff timing will shift earlier (Figure 6). Third, mountain watersheds will become more susceptible to wildfire (Figure 4), especially given fall season drying (Figure 7), with varied implications for downstream water quality and reservoir management that also must adjust to changes in timing and quantity of runoff (Figure 6). Given these outcomes, maintaining water supply reliability will benefit from collaborative, locally-specific, portfolio-based approaches to mitigate negative impacts and adapt to them [8,104]. By including relevant metrics and creative management strategies, we can develop resiliency to potential negative impacts related to changes in mountain hydrologic systems [31,36,37,90,105] while simultaneously reducing emissions [106] and increasing equity [22].

Author Contributions

Conceptualization, methodology, software, formal analysis, visualization, B.J.H.; writing—original draft preparation, B.J.H.; investigation, writing—review and editing, funding acquisition, B.J.H., A.M.R. and D.J.M. All authors have read and agreed to the published version of the manuscript.

Funding

The authors appreciate support from the California Department of Water Resources and the National Oceanic and Atmospheric Administration’s National Integrated Drought Information System (award no. 1332KP21DNEEN0006). Rhoades was supported by the Director, Office of Science, Office of Biological and Environmental Research of the U.S. Department of Energy Regional and Global Climate Modeling Program (RGCM) “the Calibrated and Systematic Characterization, Attribution and Detection of Extremes (CASCADE)” Science Focus Area (award no. DE-AC02-05CH11231) and the “An Integrated Evaluation of the Simulated Hydroclimate System of the Continental US” project (award no. DE-SC0016605).

Institutional Review Board Statement

Not applicable.

Informed Consent Statement

Not applicable.

Data Availability Statement

All data used is publicly available from the Cal-Adapt data server hosted by UC Berkeley: https://albers.cnr.berkeley.edu/data/, accessed on: 5 June 2022.

Acknowledgments

We thank those who produced the data and model output used within California’s 4th Climate Assessment and the University of California, Berkeley for hosting the climate and wildfire projection data. We appreciate constructive comments provided by three peer reviewers.

Conflicts of Interest

The authors declare no conflict of interest. The funders had no role in the design of the study; in the collection, analyses, or interpretation of data; in the writing of the manuscript; or in the decision to publish the results.

Abbreviations

The following abbreviations are used in this manuscript:
ETEvapotranspiration
MCDSMid-Century Dry Spell
LOCALOcally Constructed Analogs
VICVariable Infiltration-Capacity Model
CMIP5Fifth Coupled Model Intercomparison Project
SWESnow Water Equivalent

References

  1. Huss, M.; Bookhagen, B.; Huggel, C.; Jacobsen, D.; Bradley, R.; Clague, J.; Vuille, M.; Buytaert, W.; Cayan, D.; Greenwood, G.; et al. Toward mountains without permanent snow and ice. Earth’s Future 2017, 5, 418–435. [Google Scholar] [CrossRef]
  2. Viviroli, D.; Dürr, H.H.; Messerli, B.; Meybeck, M.; Weingartner, R. Mountains of the world, water towers for humanity: Typology, mapping, and global significance. Water Resour. Res. 2007, 43, W07447. [Google Scholar] [CrossRef]
  3. Contosta, A.R.; Casson, N.J.; Garlick, S.; Nelson, S.J.; Ayres, M.P.; Burakowski, E.A.; Campbell, J.; Creed, I.; Eimers, C.; Evans, C.; et al. Northern forest winters have lost cold, snowy conditions that are important for ecosystems and human communities. Ecol. Appl. 2019, 29, e01974. [Google Scholar] [CrossRef] [PubMed]
  4. Hagenstad, M.; Burakowski, E.; Hill, R. The Economic Contributions of Winter Sports in a Changing Climate; Technical Report; Protect Our Winters: Boulder, CO, USA, 2018. [Google Scholar]
  5. Hatchett, B.J.; Eisen, H.G. Brief Communication: Early season snowpack loss and implications for oversnow vehicle recreation travel planning. Cryosphere 2019, 13, 21–28. [Google Scholar] [CrossRef]
  6. Crowley, N.; Doolittle, C.; King, J.; Mace, R.; Seifer, J. Drought and Outdoor Recreation: Impacts, Adaptation Strategies, and Information Gaps in the Intermountain West; Technical Report; University of Colorado: Boulder, CO, USA, 2019. [Google Scholar]
  7. Rhoades, A.M.; Jones, A.D.; Ullrich, P.A. The Changing Character of the California Sierra Nevada as a Natural Reservoir. Geophys. Res. Lett. 2018, 45, 13,008–13,019. [Google Scholar] [CrossRef]
  8. Siirila-Woodburn, E.; Rhoades, A.; Hatchett, B.; Huning, L.; Szinai, J.; Tague, C.; Nico, P.; Feldman, D.; Jones, A.; Collins, W.; et al. Evidence of a low-to-no snow future and its impacts on water resources in the western United States. Nat. Rev. Earth Environ. 2021, 2, 800–819. [Google Scholar] [CrossRef]
  9. Rhoades, A.; Hatchett, B.; Risser, M.; Collins, B.; Bambach, N.; Huning, L.; McCrary, R.; Siirila-Woodburn, E.; Ullrich, P.; Wehner, M.; et al. Asymmetric Emergence of Low-to-No Snow in the Midlatitudes of the American Cordillera; Creative Commons: Mountain View, CA, USA, 2021. [Google Scholar] [CrossRef]
  10. Sturm, M.; Goldstein, M.A.; Parr, C. Water and life from snow: A trillion dollar science question. Water Resour. Res. 2017, 53, 3534–3544. [Google Scholar] [CrossRef]
  11. Herbold, B.; Bush, E.; Castillo, G.; Colombano, D.; Hartman, R.; Lehman, P.; Mahardja, B.; Sommer, T. Climate Change Impacts on San Francisco Estuary Aquatic Ecosystems: A Review. San Fr. Estuary Watershed Sci. 2022, 20. [Google Scholar] [CrossRef]
  12. Livneh, B.; Badger, A.M. Drought less predictable under declining future snowpack. Nat. Clim. Change 2020, 10, 452–458. [Google Scholar] [CrossRef]
  13. Huggins, X.; Gleeson, T.; Kummu, M.; Zipper, S.C.; Wada, Y.; Troy, T.J.; Famiglietti, J.S. Hotspots for social and ecological impacts from freshwater stress and storage loss. Nat. Commun. 2022, 13, 439. [Google Scholar] [CrossRef]
  14. Cayan, D.R.; Das, T.; Pierce, D.W.; Barnett, T.P.; Tyree, M.; Gershunov, A. Future dryness in the southwest US and the hydrology of the early 21st century drought. Proc. Natl. Acad. Sci. USA 2010, 107, 21271–21276. [Google Scholar] [CrossRef] [PubMed]
  15. Overpeck, J.T.; Udall, B. Climate change and the aridification of North America. Proc. Natl. Acad. Sci. USA 2020, 117, 11856–11858. [Google Scholar] [CrossRef] [PubMed]
  16. Milly, P.C.D.; Dunne, K.A. Colorado River flow dwindles as warming-driven loss of reflective snow energizes evaporation. Science 2020, 367, 1252–1255. [Google Scholar] [CrossRef]
  17. Williams, A.P.; Cook, B.I.; Smerdon, J.E. Rapid intensification of the emerging southwestern North American megadrought in 2020–2021. Nat. Clim. Change 2022, 12, 232–234. [Google Scholar] [CrossRef]
  18. Hatchett, B.J.; Boyle, D.P.; Putnam, A.E.; Bassett, S.D. Placing the 2012-2015 California-Nevada drought into a paleoclimatic context: Insights from Walker Lake, California-Nevada, USA. Geophys. Res. Lett. 2015, 42, 8632–8640. [Google Scholar] [CrossRef]
  19. Milly, P.C.D.; Betancourt, J.; Falkenmark, M.; Hirsch, R.M.; Kundzewicz, Z.W.; Lettenmaier, D.P.; Stouffer, R.J. Stationarity Is Dead: Whither Water Management? Science 2008, 319, 573–574. [Google Scholar] [CrossRef]
  20. Cook, B.I.; Seager, R.; Miller, R.L. On the Causes and Dynamics of the Early Twentieth-Century North American Pluvial. J. Clim. 2011, 24, 5043–5060. [Google Scholar] [CrossRef]
  21. Wheeler, K.G.; Udall, B.; Wang, J.; Kuhn, E.; Salehabadi, H.; Schmidt, J.C. What will it take to stabilize the Colorado River? Science 2022, 377, 373–375. [Google Scholar] [CrossRef] [PubMed]
  22. Tripati, A.; Shepherd, M.; Morris, V.; Andrade, K.; Whyte, K.P.; David-Chavez, D.M.; Trujillo-Falcón, J.E.; Hunter, B.; Hence, D.; Carlis, D.; et al. Centering Equity in the Nation’s Weather, Water and Climate Services. EarthArXiv 2022. [Google Scholar] [CrossRef]
  23. Alizadeh, M.R.; Abatzoglou, J.T.; Luce, C.H.; Adamowski, J.F.; Farid, A.; Sadegh, M. Warming enabled upslope advance in western US forest fires. Proc. Natl. Acad. Sci. USA 2021, 118, e2009717118. [Google Scholar] [CrossRef]
  24. Guirguis, K.; Gershunov, A.; Hatchett, B.; Shulgina, T.; DeFlorio, M.; Subramanian, A.; Guzman-Morales, J.; Aguilera, R.; Clemesha, R.; Corringham, T.; et al. Weather Patterns Driving Atmospheric Rivers, Santa Ana Winds, Floods, and Wildfires During California Winters Provide Evidence for Increasing Fire Risk. Clim. Dyn. 2022. [Google Scholar] [CrossRef]
  25. Garreaud, R.D.; Boisier, J.P.; Rondanelli, R.; Montecinos, A.; Sepúlveda, H.H.; Veloso-Aguila, D. The Central Chile Mega Drought (2010–2018): A climate dynamics perspective. Int. J. Climatol. 2020, 40, 421–439. [Google Scholar] [CrossRef]
  26. Muñoz, A.A.; Klock-Barría, K.; Alvarez-Garreton, C.; Aguilera-Betti, I.; Gonzalez-Reyes, A.; Lastra, J.A.; Chávez, R.O.; Barría, P.; Christie, D.; Rojas-Badilla, M.; et al. Water Crisis in Petorca Basin, Chile: The Combined Effects of a Mega-Drought and Water Management. Water 2020, 12, 648. [Google Scholar] [CrossRef]
  27. Sturm, M.; Holmgren, J.; Liston, G.E. A Seasonal Snow Cover Classification System for Local to Global Applications. J. Clim. 1995, 8, 1261–1283. [Google Scholar] [CrossRef]
  28. Trujillo, E.; Molotch, N.P. Snowpack regimes of the Western United States. Water Resour. Res. 2014, 50, 5611–5623. [Google Scholar] [CrossRef]
  29. Petersky, R.; Harpold, A. Now you see it, now you do not: A case study of ephemeral snowpacks and soil moisture response in the Great Basin, USA. Hydrol. Earth Syst. Sci. 2018, 22, 4891–4906. [Google Scholar] [CrossRef]
  30. Rhoades, A.M.; Ullrich, P.A.; Zarzycki, C.M. Projecting 21st century snowpack trends in western USA mountains using variable-resolution CESM. Clim. Dyn. 2018, 50, 261–288. [Google Scholar] [CrossRef]
  31. Nolin, A.W.; Sproles, E.A.; Rupp, D.E.; Crumley, R.L.; Webb, M.J.; Palomaki, R.T.; Mar, E. New snow metrics for a warming world. Hydrol. Process. 2021, 35, e14262. [Google Scholar] [CrossRef]
  32. Zeng, X.; Broxton, P.; Dawson, N. Snowpack Change From 1982 to 2016 over Conterminous United States. Geophys. Res. Lett. 2018, 45, 12,940–12,947. [Google Scholar] [CrossRef]
  33. Hatchett, B.J. Seasonal and Ephemeral Snowpacks of the Conterminous United States. Hydrology 2021, 8, 32. [Google Scholar] [CrossRef]
  34. Nolin, A.W.; Daly, C. Mapping “at Risk” Snow in the Pacific Northwest. J. Hydrometeorol. 2006, 7, 1164–1171. [Google Scholar] [CrossRef]
  35. Scott, D. Global Environmental Change and Mountain Tourism. In Tourism and Global Environmental Change; Gössling, S., Hall, C.M., Eds.; Routledge: London, UK, 2006; Chapter 3; pp. 54–75. [Google Scholar] [CrossRef]
  36. Sterle, K.; Hatchett, B.J.; Singletary, L.; Pohll, G. Hydroclimate Variability in Snow-Fed River Systems: Local Water Managers’ Perspectives on Adapting to the New Normal. Bull. Am. Meteorol. Soc. 2019, 100, 1031–1048. [Google Scholar] [CrossRef]
  37. Marshall, A.M.; Foard, M.; Cooper, C.M.; Edwards, P.; Hirsch, S.L.; Russell, M.; Link, T.E. Climate change literature and information gaps in mountainous headwaters of the Columbia River Basin. Reg. Environ. Change 2020, 20, 134. [Google Scholar] [CrossRef]
  38. Immerzeel, W.W.; Lutz, A.F.; Andrade, M.; Bahl, A.; Biemans, H.; Bolch, T.; Hyde, S.; Brumby, S.; Davies, B.J.; Elmore, A.C.; et al. Importance and vulnerability of the world’s water towers. Nature 2020, 577, 364–369. [Google Scholar] [CrossRef]
  39. Pierce, D.W.; Kalansky, J.F.; Cayan, D.R. Climate, Drought, and Sea Level Rise Scenarios for the Fourth California Climate Assessment. In California’s Fourth Climate Change Assessment; Technical Report CNRA-CEC-2018-006; California Energy Commission: Sacramento, CA, USA, 2018. [Google Scholar]
  40. California Department of Water Resources (DWR); Climate Change Technical Advisory Group (CCTAG). Perspectives and Guidance for Climate Change Analysis; Technical Report; California Department of Water Resources: Sacramento, CA, USA, 2015.
  41. Livneh, B.; Bohn, T.J.; Pierce, D.W.; Munoz-Arriola, F.; Nijssen, B.; Vose, R.; Cayan, D.R.; Brekke, L. A spatially comprehensive, hydrometeorological data set for Mexico, the U.S., and Southern Canada 1950–2013. Sci. Data 2015, 2, 150042. [Google Scholar] [CrossRef]
  42. Liang, X.; Lettenmaier, D.P.; Wood, E.F.; Burges, S.J. A simple hydrologically based model of land surface water and energy fluxes for general circulation models. J. Geophys. Res. Atmos. 1994, 99, 14415–14428. [Google Scholar] [CrossRef]
  43. Westerling, A.L. Wildfire Simulations for California’s Fourth Climate Change Assessment: Projecting Changes in ExtremeWildfire Events with a Warming Climate. In California’s Fourth Climate Change Assessment; Technical Report CCCA4-CEC-2018-014; California Energy Commission: Sacramento, CA, USA, 2018. [Google Scholar]
  44. Balch, J.K.; Bradley, B.A.; Abatzoglou, J.T.; Nagy, R.C.; Fusco, E.J.; Mahood, A.L. Human-started wildfires expand the fire niche across the United States. Proc. Natl. Acad. Sci. USA 2017, 114, 2946–2951. [Google Scholar] [CrossRef]
  45. Lynn, E.; Cuthbertson, A.; He, M.; Vasquez, J.P.; Anderson, M.; Abatzoglou, J.T.; Hatchett, B.J. Technical note: Precipitation-phase partitioning at landscape scales to regional scales. Hydrol. Earth Syst. Sci. 2020, 24, 5317–5328. [Google Scholar] [CrossRef]
  46. Polade, S.D.; Pierce, D.W.; Cayan, D.R.; Gershunov, A.; Dettinger, M.D. The key role of dry days in changing regional climate and precipitation regimes. Sci. Rep. 2014, 4, 4364. [Google Scholar] [CrossRef]
  47. Gershunov, A.; Shulgina, T.; Clemesha, R.E.; Guirguis, K.; Pierce, D.W.; Dettinger, M.D.; Lavers, D.A.; Cayan, D.R.; Polade, S.D.; Kalansky, J.; et al. Precipitation regime change in Western North America: The role of atmospheric rivers. Sci. Rep. 2019, 9, 9944. [Google Scholar] [CrossRef]
  48. Luković, J.; Chiang, J.C.H.; Blagojević, D.; Sekulić, A. A Later Onset of the Rainy Season in California. Geophys. Res. Lett. 2021, 48, e2020GL090350. [Google Scholar] [CrossRef]
  49. Hatchett, B.J.; McEvoy, D.J. Exploring the Origins of Snow Drought in the Northern Sierra Nevada, California. Earth Interact. 2018, 22, 1–13. [Google Scholar] [CrossRef]
  50. McEvoy, D.J.; Pierce, D.W.; Kalansky, J.F.; Cayan, D.R.; Abatzoglou, J.T. Projected Changes in Reference Evapotranspiration in California and Nevada: Implications for Drought and Wildland Fire Danger. Earth’s Future 2020, 8, e2020EF001736. [Google Scholar] [CrossRef]
  51. Klos, P.Z.; Link, T.E.; Abatzoglou, J.T. Extent of the rain-snow transition zone in the western U.S. under historic and projected climate. Geophys. Res. Lett. 2014, 41, 4560–4568. [Google Scholar] [CrossRef]
  52. Prein, A.F.; Heymsfield, A.J. Increased melting level height impacts surface precipitation phase and intensity. Nat. Clim. Change 2020, 10, 771–776. [Google Scholar] [CrossRef]
  53. Harpold, A.A.; Brooks, P.D. Humidity determines snowpack ablation under a warming climate. Proc. Natl. Acad. Sci. USA 2018, 115, 1215–1220. [Google Scholar] [CrossRef]
  54. Ullrich, P.A.; Xu, Z.; Rhoades, A.; Dettinger, M.; Mount, J.; Jones, A.; Vahmani, P. California’s Drought of the Future: A Midcentury Recreation of the Exceptional Conditions of 2012–2017. Earth’s Future 2018, 6, 1568–1587. [Google Scholar] [CrossRef]
  55. Brandt, W.T.; Haleakala, K.; Hatchett, B.J.; Pan, M. A Review of the Hydrologic Response Mechanisms during Mountain Rain-on-Snow. Front. Earth Sci. 2022, 10, 791760. [Google Scholar] [CrossRef]
  56. Hatchett, B.J.; Cao, Q.; Dawson, P.B.; Ellis, C.J.; Hecht, C.W.; Kawzenuk, B.; Lancaster, J.T.; Osborne, T.C.; Wilson, A.M.; Anderson, M.L.; et al. Observations of an Extreme Atmospheric River Storm with a Diverse Sensor Network. Earth Space Sci. 2020, 7, e2020EA001129. [Google Scholar] [CrossRef]
  57. Hatchett, B.J.; Rhoades, A.M.; McEvoy, D.J. Monitoring the Daily Evolution and Extent of Snow Drought. Nat. Hazards Earth Syst. Sci. 2021, 22, 869–890. [Google Scholar] [CrossRef]
  58. He, M.; Whitin, B.; Hartman, R.; Henkel, A.; Fickenschers, P.; Staggs, S.; Morin, A.; Imgarten, M.; Haynes, A.; Russo, M. Verification of Ensemble Water Supply Forecasts for Sierra Nevada Watersheds. Hydrology 2016, 3, 35. [Google Scholar] [CrossRef]
  59. Heggli, A.; Hatchett, B.; Schwartz, A.; Bardsley, T.; Hand, E. Toward snowpack runoff decision support. iScience 2022, 25, 104240. [Google Scholar] [CrossRef]
  60. Delaney, C.J.; Hartman, R.K.; Mendoza, J.; Dettinger, M.; Delle Monache, L.; Jasperse, J.; Ralph, F.M.; Talbot, C.; Brown, J.; Reynolds, D.; et al. Forecast Informed Reservoir Operations Using Ensemble Streamflow Predictions for a Multipurpose Reservoir in Northern California. Water Resour. Res. 2020, 56, e2019WR026604. [Google Scholar] [CrossRef]
  61. Scanlon, B.R.; Reedy, R.C.; Faunt, C.C.; Pool, D.; Uhlman, K. Enhancing drought resilience with conjunctive use and managed aquifer recharge in California and Arizona. Environ. Res. Lett. 2016, 11, 035013. [Google Scholar] [CrossRef]
  62. Dillon, P.; Stuyfzand, P.; Grischek, T.; Lluria, M.; Pyne, R.; Jain, R.; Bear, J.; Schwarz, J.; Wang, W.; Fernandez, E.; et al. Sixty years of global progress in managed aquifer recharge. Hydrogeol. J. 2019, 27, 1–30. [Google Scholar] [CrossRef]
  63. Rhoades, A.M.; Jones, A.D.; Srivastava, A.; Huang, H.; O’Brien, T.A.; Patricola, C.M.; Ullrich, P.A.; Wehner, M.; Zhou, Y. The Shifting Scales of Western U.S. Landfalling Atmospheric Rivers under Climate Change. Geophys. Res. Lett. 2020, 47, e2020GL089096. [Google Scholar] [CrossRef]
  64. Payne, A.E.; Demory, M.E.; Leung, L.R.; Ramos, A.M.; Shields, C.A.; Rutz, J.J.; Siler, N.; Villarini, G.; Hall, A.; Ralph, F.M. Responses and impacts of atmospheric rivers to climate change. Nat. Rev. Earth Environ. 2020, 1, 143–157. [Google Scholar] [CrossRef]
  65. Rhoades, A.M.; Risser, M.D.; Stone, D.A.; Wehner, M.F.; Jones, A.D. Implications of warming on western United States landfalling atmospheric rivers and their flood damages. Weather Clim. Extrem. 2021, 32, 100326. [Google Scholar] [CrossRef]
  66. Hatchett, B.J.; Daudert, B.; Garner, C.B.; Oakley, N.S.; Putnam, A.E.; White, A.B. Winter Snow Level Rise in the Northern Sierra Nevada from 2008 to 2017. Water 2017, 9, 899. [Google Scholar] [CrossRef]
  67. Hatchett, B. Snow Level Characteristics and Impacts of a Spring Typhoon-Originating Atmospheric River in the Sierra Nevada, USA. Atmosphere 2018, 9, 233. [Google Scholar] [CrossRef]
  68. Gonzales, K.R.; Swain, D.L.; Nardi, K.M.; Barnes, E.A.; Diffenbaugh, N.S. Recent Warming of Landfalling Atmospheric Rivers along the West Coast of the United States. J. Geophys. Res. Atmos. 2019, 124, 6810–6826. [Google Scholar] [CrossRef]
  69. Hatchett, B.J.; Boyle, D.P.; Garner, C.B.; Kaplan, M.L.; Putnam, A.E.; Bassett, S.D. Magnitude and frequency of wet years under a megadrought climate in the western Great Basin, USA. Quat. Sci. Rev. 2016, 152, 197–202. [Google Scholar] [CrossRef]
  70. Li, D.; Wrzesien, M.L.; Durand, M.; Adam, J.; Lettenmaier, D.P. How much runoff originates as snow in the western United States, and how will that change in the future? Geophys. Res. Lett. 2017, 44, 6163–6172. [Google Scholar] [CrossRef]
  71. Gleason, K.E.; McConnell, J.R.; Arienzo, M.M.; Chellman, N.; Calvin, W.M. Four-fold increase in solar forcing on snow in western U.S. burned forests since 1999. Nat. Commun. 2019, 10, 2026. [Google Scholar] [CrossRef] [PubMed]
  72. Gershunov, A.; Guzman Morales, J.; Hatchett, B.; Guirguis, K.; Aguilera, R.; Shulgina, T.; Abatzoglou, J.T.; Cayan, D.; Pierce, D.; Williams, P.; et al. Hot and cold flavors of southern California’s Santa Ana winds: Their causes, trends, and links with wildfire. Clim. Dyn. 2021, 57, 2233–2248. [Google Scholar] [CrossRef]
  73. Aguilera, R.; Gershunov, A.; Ilango, S.D.; Guzman-Morales, J.; Benmarhnia, T. Santa Ana Winds of Southern California Impact PM2.5 with and without Smoke from Wildfires. GeoHealth 2020, 4, e2019GH000225. [Google Scholar] [CrossRef]
  74. Oakley, N.S. A Warming Climate Adds Complexity to Post-Fire Hydrologic Hazard Planning. Earth’s Future 2021, 9, e2021EF002149. [Google Scholar] [CrossRef]
  75. Godsey, S.E.; Kirchner, J.W.; Tague, C.L. Effects of changes in winter snowpacks on summer low flows: Case studies in the Sierra Nevada, California, USA. Hydrol. Process. 2014, 28, 5048–5064. [Google Scholar] [CrossRef]
  76. Lund, J.; Medellin-Azuara, J.; Durand, J.; Stone, K. Lessons from California’s 2012–2016 Drought. J. Water Resour. Plan. Manag. 2018, 144, 04018067. [Google Scholar] [CrossRef]
  77. Szinai, J.K.; Deshmukh, R.; Kammen, D.M.; Jones, A.D. Evaluating cross-sectoral impacts of climate change and adaptations on the energy-water nexus: A framework and California case study. Environ. Res. Lett. 2020, 15, 124065. [Google Scholar] [CrossRef]
  78. Avanzi, F.; Rungee, J.; Maurer, T.; Bales, R.; Ma, Q.; Glaser, S.; Conklin, M. Climate elasticity of evapotranspiration shifts the water balance of Mediterranean climates during multi-year droughts. Hydrol. Earth Syst. Sci. 2020, 24, 4317–4337. [Google Scholar] [CrossRef]
  79. Maurer, T.; Avanzi, F.; Glaser, S.D.; Bales, R.C. Drivers of drought-induced shifts in the water balance through a Budyko approach. Hydrol. Earth Syst. Sci. 2022, 26, 589–607. [Google Scholar] [CrossRef]
  80. Harpold, A.A.; Molotch, N.P. Sensitivity of soil water availability to changing snowmelt timing in the western U.S. Geophys. Res. Lett. 2015, 42, 8011–8020. [Google Scholar] [CrossRef]
  81. Bales, R.C.; Goulden, M.L.; Hunsaker, C.T.; Conklin, M.H.; Hartsough, P.C.; O’Geen, A.T.; Hopmans, J.W.; Safeeq, M. Mechanisms controlling the impact of multi-year drought on mountain hydrology. Sci. Rep. 2018, 8, 690. [Google Scholar] [CrossRef] [PubMed]
  82. Nauslar, N.J.; Abatzoglou, J.T.; Marsh, P.T. The 2017 North Bay and Southern California Fires: A Case Study. Fire 2018, 1, 18. [Google Scholar] [CrossRef]
  83. Gleason, K.E.; Nolin, A.W. Charred forests accelerate snow albedo decay: Parameterizing the post-fire radiative forcing on snow for three years following fire. Hydrol. Process. 2016, 30, 3855–3870. [Google Scholar] [CrossRef]
  84. Maina, F.Z.; Siirila-Woodburn, E.R. Watersheds dynamics following wildfires: Nonlinear feedbacks and implications on hydrologic responses. Hydrol. Process. 2020, 34, 33–50. [Google Scholar] [CrossRef]
  85. Ebel, B.A.; Moody, J.A.; Martin, D.A. Hydrologic conditions controlling runoff generation immediately after wildfire. Water Resour. Res. 2012, 48. [Google Scholar] [CrossRef]
  86. Koshkin, A.; Hatchett, B.; Nolin, A. Wildfire Impacts on Western United States Snowpack. Front. Water 2022. [Google Scholar] [CrossRef]
  87. East, A.E.; Logan, J.B.; Dartnell, P.; Lieber-Kotz, O.; Cavagnaro, D.B.; McCoy, S.W.; Lindsay, D.N. Watershed Sediment Yield Following the 2018 Carr Fire, Whiskeytown National Recreation Area, Northern California. Earth Space Sci. 2021, 8, e2021EA001828. [Google Scholar] [CrossRef]
  88. Jumps, N.; Gray, A.B.; Guilinger, J.J.; Cowger, W.C. Wildfire impacts on the persistent suspended sediment dynamics of the Ventura River, California. J. Hydrol. Reg. Stud. 2022, 41, 101096. [Google Scholar] [CrossRef]
  89. Hiers, J.K.; O’Brien, J.J.; Varner, J.M.; Butler, B.W.; Dickinson, M.; Furman, J.; Gallagher, M.; Godwin, D.; Goodrick, S.L.; Hood, S.M.; et al. Prescribed fire science: The case for a refined research agenda. Fire Ecol. 2020, 16, 11. [Google Scholar] [CrossRef]
  90. Lundquist, J.D.; Dickerson-Lange, S.E.; Lutz, J.A.; Cristea, N.C. Lower forest density enhances snow retention in regions with warmer winters: A global framework developed from plot-scale observations and modeling. Water Resour. Res. 2013, 49, 6356–6370. [Google Scholar] [CrossRef]
  91. Cristea, N.C.; Lundquist, J.D.; Loheide II, S.P.; Lowry, C.S.; Moore, C.E. Modelling how vegetation cover affects climate change impacts on streamflow timing and magnitude in the snowmelt-dominated upper Tuolumne Basin, Sierra Nevada. Hydrol. Process. 2014, 28, 3896–3918. [Google Scholar] [CrossRef]
  92. Kolden, C.A. We are Not Doing Enough Prescribed Fire in the Western United States to Mitigate Wildfire Risk. Fire 2019, 2, 30. [Google Scholar] [CrossRef]
  93. Haarsma, R.J.; Roberts, M.J.; Vidale, P.L.; Senior, C.A.; Bellucci, A.; Bao, Q.; Chang, P.; Corti, S.; Fučkar, N.S.; Guemas, V.; et al. High Resolution Model Intercomparison Project (HighResMIP v1.0) for CMIP6. Geosci. Model Dev. 2016, 9, 4185–4208. [Google Scholar] [CrossRef]
  94. Bambach, N.E.; Rhoades, A.M.; Hatchett, B.J.; Jones, A.D.; Ullrich, P.A.; Zarzycki, C.M. Projecting climate change in South America using variable-resolution Community Earth System Model: An application to Chile. Int. J. Climatol. 2022, 42, 2514–2542. [Google Scholar] [CrossRef]
  95. Smoot, E.E.; Gleason, K.E. Forest Fires Reduce Snow-Water Storage and Advance the Timing of Snowmelt across the Western U.S. Water 2021, 13, 3533. [Google Scholar] [CrossRef]
  96. Stevens, J.T. Scale-dependent effects of post-fire canopy cover on snowpack depth in montane coniferous forests. Ecol. Appl. 2017, 27, 1888–1900. [Google Scholar] [CrossRef]
  97. Broxton, P.D.; Moeser, C.D.; Harpold, A. Accounting for Fine-Scale Forest Structure is Necessary to Model Snowpack Mass and Energy Budgets in Montane Forests. Water Resour. Res. 2021, 57, e2021WR029716. [Google Scholar] [CrossRef]
  98. Gleason, K.E.; Nolin, A.W.; Roth, T.R. Charred forests increase snowmelt: Effects of burned woody debris and incoming solar radiation on snow ablation. Geophys. Res. Lett. 2013, 40, 4654–4661. [Google Scholar] [CrossRef]
  99. Jennings, K.; Winchell, T.S.; Livneh, B.; Molotch, N.P. Spatial variation of the rain–snow temperature threshold across the Northern Hemisphere. Nat. Commun. 2018, 9, 1148. [Google Scholar] [CrossRef]
  100. Abatzoglou, J.T.; Hatchett, B.J.; Fox-Hughes, P.; Gershunov, A.; Nauslar, N.J. Global climatology of synoptically-forced downslope winds. Int. J. Climatol. 2021, 41, 31–50. [Google Scholar] [CrossRef]
  101. Nauslar, N.J.; Kaplan, M.L.; Wallmann, J.; Brown, T.J. A forecast procedure for dry thunderstorms. J. Oper. Meteorol. 2013, 1, 200–214. [Google Scholar] [CrossRef]
  102. Nauslar, N.J.; Hatchett, B.J. Dry Thunderstorms. In Encyclopedia of Wildfires and Wildland-Urban Interface (WUI) Fires; Manzello, S.L., Ed.; Springer International Publishing: Cham, Switzerland, 2019; pp. 1–10. [Google Scholar] [CrossRef]
  103. Yang, Y.; Roderick, M.L.; Zhang, S.; McVicar, T.R.; Donohue, R.J. Hydrologic implications of vegetation response to elevated CO2 in climate projections. Nat. Clim. Change 2019, 9, 44–48. [Google Scholar] [CrossRef]
  104. Singletary, L.; Sterle, K. Collaborative Modeling to Assess Drought Resiliency of Snow-Fed River Dependent Communities in the Western United States: A Case Study in the Truckee-Carson River System. Water 2017, 9, 99. [Google Scholar] [CrossRef]
  105. Yarnell, S.M.; Stein, E.D.; Webb, J.A.; Grantham, T.; Lusardi, R.A.; Zimmerman, J.; Peek, R.A.; Lane, B.A.; Howard, J.; Sandoval-Solis, S. A functional flows approach to selecting ecologically relevant flow metrics for environmental flow applications. River Res. Appl. 2020, 36, 318–324. [Google Scholar] [CrossRef]
  106. Williams, J.H.; Jones, R.A.; Haley, B.; Kwok, G.; Hargreaves, J.; Farbes, J.; Torn, M.S. Carbon-Neutral Pathways for the United States. AGU Adv. 2021, 2, e2020AV000284. [Google Scholar] [CrossRef]
Figure 1. Median annual (a) precipitation, (b) peak snow water equivalent, and (c) runoff for the historic (water years 1951–2005) period from the HadGEM2-ES model. (dg) as in (ac) but for the projected driest 20-year span in the 21st century (water years 2051–2070). (g) Time series of state-wide 2051–2070 median precipitation, peak snow water equivalent, and total runoff as a fraction of historic 1951–2005.
Hydrology 09 00155 g001
Figure 2. (a) Median historic peak snow water equivalent with six major rivers studied and the location of the Sacramento-San Joaquin Delta. (b) Projected change in median peak snow water equivalent. (c) Historic (water years 1951–2005) snow seasonality classification. (d) Projected transitions in snow seasonality during the 20-year mid-21st century dry spell.
Hydrology 09 00155 g002
Figure 3. Projected percent change in median peak snow water equivalent during the 20-year mid-21st century dry spell compared to the historic period for: (a) seasonal snowpacks → ephemeral snowpacks, (b) less seasonal snowpacks, (c) no change, and (d) more seasonal snowpacks.
Hydrology 09 00155 g003
Figure 4. Increases (percentage) in wildfire acres burned for snow seasonality transitions: (a) seasonal snowpacks → ephemeral snowpacks, (b) less seasonal snowpacks, (c) no change, and (d) more seasonal snowpacks.
Hydrology 09 00155 g004
Figure 5. As in Figure 4 but showing mean change in annual wildfire area burned for snow seasonality transitions: (a) seasonal snowpacks → ephemeral snowpacks, (b) less seasonal snowpacks, (c) no change, and (d) more seasonal snowpacks.
Hydrology 09 00155 g005
Figure 6. Projected changes in simulated monthly runoff for six major river systems in California: (a) the Sacramento River at Red Bluff, (b) the Feather River at Lake Oroville, (c) the Yuba River at Smartville, (d) the Mokelumne River at Pardee Reservoir, (e) the Tuolumne River at Don Pedro Reservoir, and (f) the San Joaquin River at Millerton Reservoir. Values provided indicate the percentage of median total annual water year flow during the Mid-Century Dry Spell (MCDS) to historic total annual water year flow.
Hydrology 09 00155 g006
Figure 7. Projected changes for historically seasonal snowpacks in (a) median water year dry days, (b) median day at which 95% of water year evapotranspiration (ET) occurs (negative is earlier), (c) median fall season (September-November) dry days, and (d) median fall season precipitation.
Hydrology 09 00155 g007
Publisher’s Note: MDPI stays neutral with regard to jurisdictional claims in published maps and institutional affiliations.

