Systematic Review

Misconceptions of Reference and Potential Evapotranspiration: A PRISMA-Guided Comprehensive Review

1
School of Agricultural Engineering, Jiangsu University, Zhenjiang 212013, China
2
Department of Civil, Environmental and Natural Resources Engineering, Lulea University of Technology, 97187 Lulea, Sweden
3
Department of Earth Sciences, Faculty of Sciences and Techniques of Tangier, Abdelmalek Essaadi University, Tetouan 93000, Morocco
4
Department of Irrigation and Drainage Engineering, College of Technology, G. B. Pant University of Agriculture and Technology, Pantnagar, Uttarakhand 263145, India
5
Department of Water Engineering, Faculty of Agriculture, Bu-Ali Sina University, Hamedan 65178-38695, Iran
6
School of Transportation, Southeast University, Nanjing 211189, China
7
School of Communication, Daystar University, Nairobi 00100, Kenya
8
Agricultural Engineering Department, Faculty of Agriculture, Mansoura University, Mansoura 35516, Egypt
*
Author to whom correspondence should be addressed.
Hydrology 2022, 9(9), 153; https://doi.org/10.3390/hydrology9090153
Submission received: 4 July 2022 / Revised: 20 August 2022 / Accepted: 21 August 2022 / Published: 24 August 2022
(This article belongs to the Special Issue Accounting for Climate Change in Water and Agriculture Management)

Abstract

:
One of the most important parts of the hydrological cycle is evapotranspiration (ET). Accurate estimates of ET in irrigated regions are critical to the planning, control, and regulation of agricultural natural resources. Accurate ET estimation is necessary for agricultural irrigation scheduling. ET is a nonlinear and complex process that cannot be calculated directly. Reference evapotranspiration (RET) and potential evapotranspiration (PET) are two primary forms of ET. The ideas, equations, and application areas for PET and RET are different. These two terms have been confused and used interchangeably by researchers. Therefore, terminology clarification is necessary to ensure their proper use. The research indicates that PET and RET concepts have a long and distinguished history. Thornthwaite devised the original PET idea, and it has been used ever since, although with several improvements. The development of RET, although initially confused with that of PET, was formally defined as a standard method. In this study, the Preferred Reporting Item for Systematic reviews and Meta-Analysis (PRISMA) was used. Equations for RET estimation were retrieved from 44 research articles, and equations for PET estimation were collected from 26 studies. Both the PET and RET equations were divided into three distinct categories: temperature-based, radiation-based, and combination-based. The results show that, among temperature-based equations for PET, Thornthwaite’s (1948) equation was mentioned in 12,117 publications, whereas among temperature-based equations for RET, Hargreaves and Samani’s (1985) equation was quoted in 3859 studies. Similarly, Priestley (1972) had the most highly cited equation in radiation-based PET equations (about 6379), whereas Ritchie (1972) had the most highly cited RET equations (around 2382) in radiation-based equations. Additionally, among combination-based PET equations, Penman and Monteith’s (1948) equations were cited in 9307 research studies, but the equations of Allen et al. (1998) were the subject of a significant number of citations from 23,000 publications. Based on application, PET is most often applied in the fields of hydrology, meteorology, and climatology, whereas RET is more frequently utilized in the fields of agronomy, agriculture, irrigation, and ecology. PET has been used to derive drought indices, whereas RET has been employed for single crop and dual crop coefficient approaches. This work examines and describes the ideas and methodologies, widely used equations, applications, and advanced approaches associated with PET and RET, and discusses future enhancements to increase the accuracy of ET calculation to attain accurate agricultural irrigation scheduling. The use of advanced tools such as remote sensing and satellite technologies, in addition to machine learning algorithms, will help to improve the accuracy of PET and RET estimates. Researchers will be able to distinguish between PET and RET in the future with the use of the study’s results.

1. Introduction

Evapotranspiration (ET) is a vital component of the water cycle and a useful indicator for several environmental studies [1,2,3], including climate change research. It is difficult to quantify this climatic parameter because of the diversity of the interactions that occur at the soil–vegetation–atmosphere interface [4]. Water evaporates from the soil surface and transpires from plants in a process known as ET [5]. It is extensively used across a number of fields, including agronomy, hydrology, climatology, meteorology, ecology, and environmental science. Additionally, reference evapotranspiration (RET) and potential evapotranspiration (PET) are two interlinked notions. Although PET and RET both estimate the atmospheric evaporative demand, the terms may be distinguished since they are based on distinct theories and use different equations. For many years, there has been no consensus about PET and RET usage and application. According to the findings of the research, these two terminologies are identical [5,6,7,8]. Other studies used the terms PET and RET interchangeably and calculated them using similar formulas [9,10,11,12,13]. The terms "PET" and "RET" were both used by Hargreaves and Samani in their research report, which was published in 1982 [14]. In turn, this led to confusion among researchers on the proper use of PET and RET concepts.
According to Thornthwaite [15], PET is the evapotranspiration from a large area of land that is covered with vegetation and has an unlimited moisture content. Since the moisture supply is unrestricted, he thought PET is completely reliant on the quantity of energy available. PET was defined by Penman [16] as ET produced by actively growing short, green vegetation that completely shadows the ground and never lacks sufficient moisture. On the surface, PET may be conceived of as the aggregate of all climatic factors affecting the ET process. ET occurs when the soil is completely covered by living things that are actively developing and when there are no restrictions on the amount of moisture in the soil. It may be regarded as the absolute maximum that a crop can receive in a given climate.
The evapotranspiration rate of a hypothetical reference crop with an assumed crop height of 0.12 m, a constant surface resistance of 70 s/m, and an albedo of 0.23 is defined as the ET rate from a reference surface and denoted by RET [5]. The reference surface resembles a broad swath of uniformly tall, actively growing grass that totally shadows the ground and has an infinite supply of soil moisture. RET provides data on atmospheric evaporation demands irrespective of crop development, growth stage, or management techniques. However, since soil water is easily available at the reference surface, the soil variables have no impact on the quantity of RET generated. When RET is connected to a specific surface, it offers a standard against which RET from other surfaces may be examined.
Additionally, climate factors influence RET. As a consequence, it might be determined using weather information. It should be emphasized that the RET definition stipulates that, for climatic data to be deemed legitimate, they must be collected in a well-defined environment, such as a grassy area that has been well-irrigated and maintained. Early uses of PET were in hydrology and meteorology, but it was eventually used in other disciplines. It was related to agricultural water needs and when to irrigate, for instance, in agronomy [17,18,19,20]. Due to the definition’s vagueness, PET was not always applied appropriately. By explicitly connecting single or dual crop coefficient approaches, agronomists started to apply the RET idea to irrigation scheduling, design, and ET estimation. The introduction of the RET idea helped to resolve a number of PET misapplication issues, although the use of the concept is still unclear to researchers [21,22].
A number of RET/PET equation methods have been proposed and divided into three groups: temperature-based, radiation-based, and combination-based equations. For instance, temperature-based equations try to balance water loss (evaporation) effects by incorporating average (mean of minimum and maximum) atmospheric temperature, precipitation, and water change in the hydrological cycle. The radiation-based equations try to balance the amount of incoming energy that is available to produce evapotranspiration (and sensible heat flux) from the surface, and some of them even try to include advective terms (which provide additional energy). In addition, a combination-based calculation takes into account both energy balance and aerodynamics, as the ET process involves transforming liquid water into vapor and then dispersing the vapor. The variables velocity and vapor pressure are two of the most important concepts in aerodynamics since they relate to mass-transfer theory. Air temperature and other environmental conditions are taken into account in this conventional combination type of equation.
The ambiguity between PET and RET as explained above motivates researchers to provide insightful references and clarify the concepts to assist researchers who may not correctly differentiate between PET and RET in their future studies. The current systematic review’s goal, then, is to identify the evolution of frequently used PET and RET equations and applications, along with conceptual differences. This review contributes to a better understanding of the distinctions between PET and RET.

2. PET and RET Perception

2.1. PET Background

PET has been developed for many decades. The PET term was used initially by Thornthwaite [15] to differentiate it from RET, after studying the precipitation and water use in various locations in the U.S.A. PET reflects the ambient evaporation requirement, either the air pack volume at the surface or the water that must be transported. This means that “combined soil evaporation and transpiration from plants means the transport from the ground to the atmosphere” [15]. Initially, it was used to determine if the study area either is arid or semi-arid, or humid based on the aridity index, which was calculated as:
A I = P P E T 1
where AI = aridity index; P = precipitation.
Researchers in drought monitoring studies have used this AI concept, and it is still used today [23,24,25,26,27,28,29]. In addition, Penman [16] developed a new formula to calculate varied surfaces’ evapotranspiration and solely restricted the term to “evaporation”. Subsequently, studies by Penman [30,31] used the “potential transpiration” term to describe vegetation-related water use. This term refers to estimating the transpiration rate produced by an extensive short green cover that completely shades the ground and is adequately supplied with water.
Anon [32] described the “water vapor loss in the short canopy of grass as a growth rate in large areas, covering the soil at an active stage, in an equal height, with optimum water and nutritional condition”. The World Meteorological Organization (WMO) defined it as “the water vapor amount that a clean water surface might release under the present atmospheric situations.” These definitions were comparable to the Penman classification [30,31], and the modern term “potential evaporation (Ep)”, but had distinct vegetation criteria. Somehow the “Ep” term was used with “PET”, a term coined by Thornthwaite [15], which is currently in use as “PET” [33,34,35]. The term “crop potential evapotranspiration”, suggested by Jensen and Haise [36], was a descriptive term appropriate for the definitions given above. The term describes evapotranspiration during a specific growth stage when water is not limited for a given crop; other insignificant factors such as diseases, insects, and nutrients are limitless in plant production. Surface evaporation and crop growth conditions, which may affect evapotranspiration, were considered in the description.
Jensen [37] gave distinctions between many crops grown under different circumstances as an addition to the definition. Nevertheless, it is relatively complicated, and there is insufficient knowledge on enough crops to solve global ET. He also stated PET was “the highest limit of evapotranspiration reported in a well-watered crop along with aerodynamically characteristics, such as Alfalfa with a growth height of 0.3 to 0.5 meters” [38]. Dingman [39] defined PET as the evapotranspiration rate “without advection or heat impact, from a wide area covered entirely and uniformly by vegetation rising with access to abundant supplies of water in the soil”. This definition summarizes perfect conditions for the “potential” level, which causes the water flowing from the crop to achieve an optimum. This indistinguishability in concepts was created when “potential transpiration” was coined from the various definitions of PET given above. Both reports relate to RET and contain some restrictions on the conditions, such as crop growth surfaces or evaporation and transpiration surfaces.
The original intent of PET was to reflect the water requirement and optimum water in vast regions, whereas RET reflected the dispersal of the actual water quantity from the whole area. Under this assumption, several new hypotheses suggested PET based on vegetation or small surface crops. Additionally, PET implied only water lost by leaves. The water change among various crops had to be studied using a particular terminology. However, this had to ensure that it was unique, rather than using several meanings. Thus, inventing a new term to distinguish the concept from PET is critical.

2.2. RET Background

The term RET was suggested for evaporating surfaces and other variables affecting the RET rate [40,41,42]. The United Nations Food Agriculture Organization (UN-FAO) has summarized crop water requirement studies by describing RET as the evapotranspiration rate from a substantial surface of 8 to 15 cm high, with green grass cover of uniform height, and intensively sprouting and shaded soil that is not underwater, whereas the reference crop is an ideal crop and represents one specific type of surface [43]. Several types of grass, including alfalfa, were initially identified as short and high reference plants, but other grasses, such as fescue or ryegrass, may also be considered [44,45,46,47,48]. Nevertheless, alfalfa is difficult to cultivate in certain tropical climates or regions with high winter temperatures. This makes it difficult to identify a particular alfalfa cultivar that grows efficiently globally to provide local verification of alfalfa RET methods [49]. Allen et al. [50] calculated the RET ratio between alfalfa and grass, which was estimated to be 1.37. The precision of RET estimates is related to crop types. The crop growth condition is also required for determining the RET, apart from the variety of crops. For instance, vegetation height around the lysimeter should be the same as vegetation inside the lysimeter [51,52,53,54].
Taking natural vegetation as a reference crop may not be acceptable. Allen et al. [50] also proposed a new description for RET, which used a constant surface resistance value in many circumstances to prevent changes in other related climatic variables. The preference for regular height and surface resistance parameters represented a compromise that could not accurately reflect the truth in all temperature regimes, in addition to the presence of a relatively dry soil surface as a consequence of an irrigation schedule that is nearly weekly in overall frequency [5]. FAO clearly defined the new definition as evapotranspiration rate from hypothesized crops with presumed crop height (0.12 m), fixed surface resistance (1–70 sm), and albedo (0.23), which would be closely similar to the development from a broad surface of a green grass-covering cover. FAO formally adopted the idea in FAO Irrigation and Drainage Paper No. 56 [5].
The American Society of Civil Engineers (ASCE) has introduced another “alfalfa” as a reference crop, describing it as a high crop at around 0.5 m. Based on the comparatively strict FAO56 RET concept, there are two typical canopy-resistant evaporation surfaces, aerodynamic resistance, and a timescale for high and low plants [55]. The ASCE RET, hereafter referred to as RET, is more straightforward and precise than PET since one of the main objectives is to differentiate RET from crops in a wide area. This can be used to identify the water amount that evaporates from crop and vegetation surfaces and for solving water-use problems. Similarly, providing agricultural workers and farmers with helpful knowledge about irrigation plans, unique and ideal plant conditions, and the estimation equations is a simple task.

3. Adopted Methodology

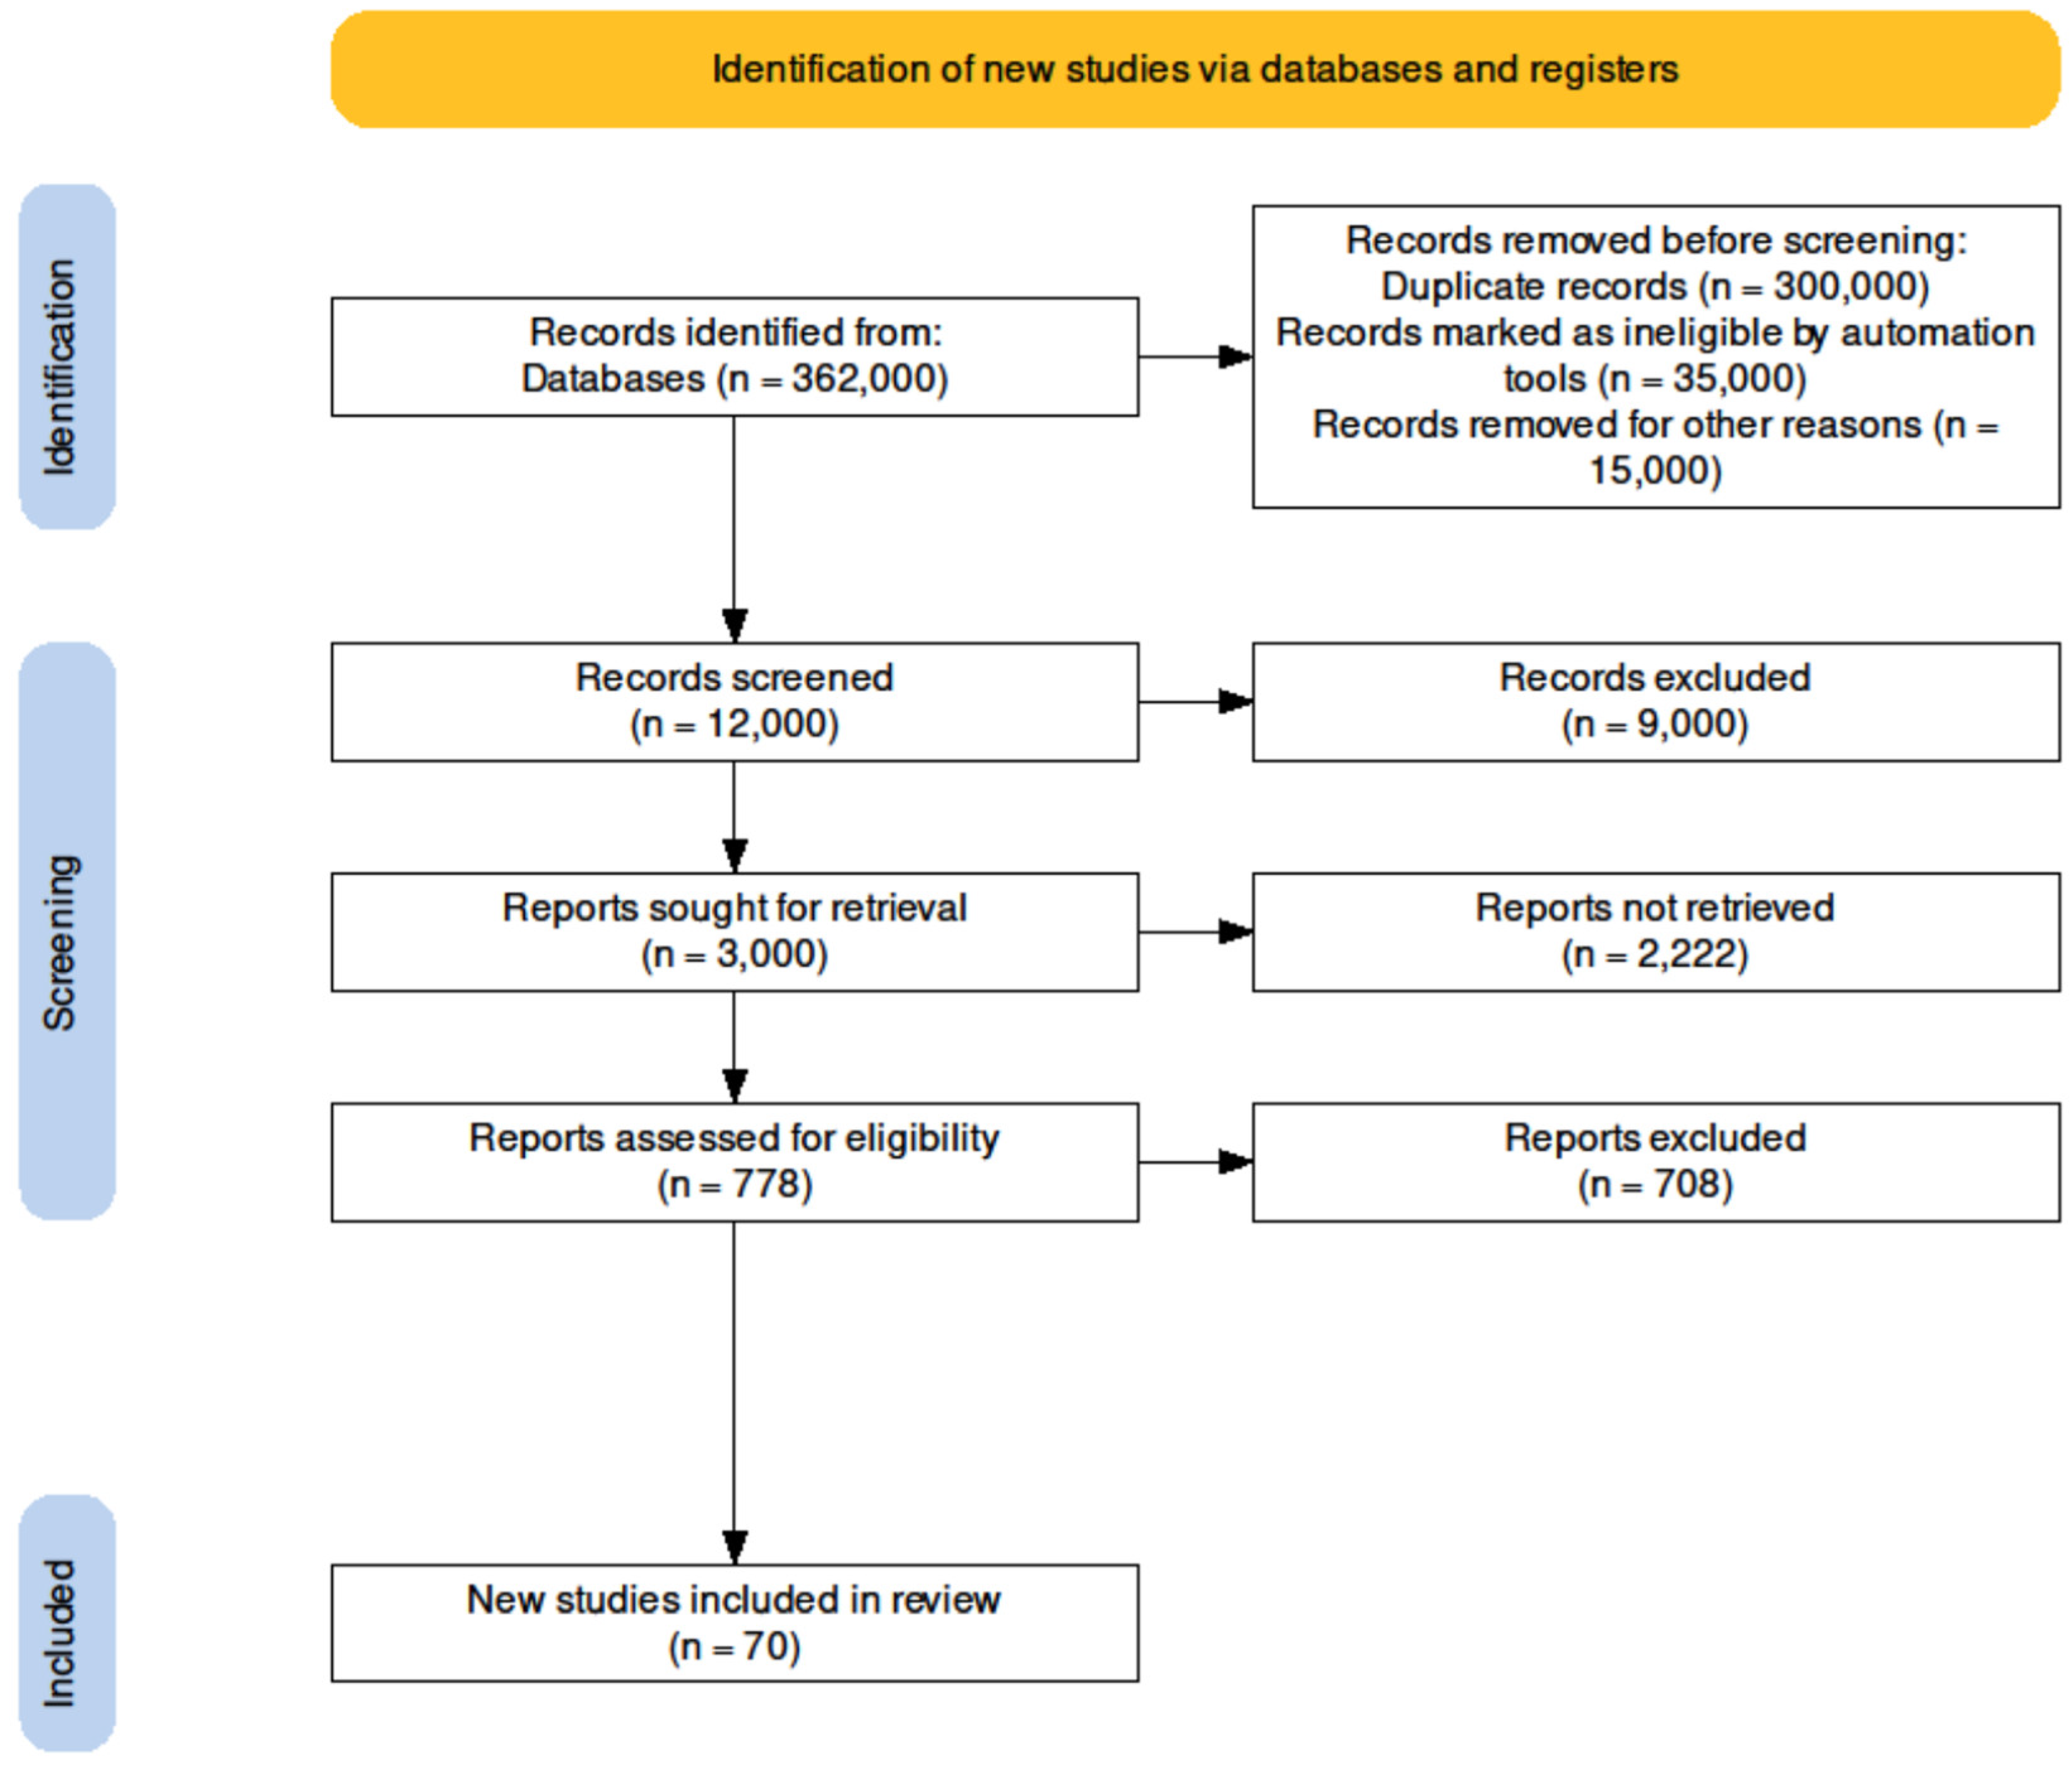
A bibliometric analysis as per the guidelines of Preferred Reporting Item for Systematic reviews and Meta-Analysis (PRISMA) was conducted in this study. According to the recommendations, the PRISMA flow diagram for a systematic review was successfully created using a freely available official tool named Shinyapp (weblink: https://estech.shinyapps.io/prisma_flowdiagram/ accessed on 6 June 2022), which can be seen in Figure 1. To understand the PRISMA flow diagram, the following points should be considered:
(1)
Data source: Google Scholar, Science Direct, PubMed, and Clarivate Analytics Web of Science databases were used with the following title and keywords: reference evapotranspiration estimation equation, potential evapotranspiration estimation equation, evapotranspiration estimation.
(2)
Article screening: Records found in the searched databases that were duplicates or irrelevant, that did not have full-text availability, or were inaccessible or written in languages other than English were excluded and removed from the identified records.
(3)
Article inclusion: Only relevant and suitable articles that provided RET and PET estimation equations using a dataset of daily, monthly, or yearly timescales were included.
It can be observed in Figure 1 that 362,000 records were initially identified when keywords and titles of RET and PET equations were searched in the Google Scholar, Science Direct, PubMed, and Clarivate Analytics Web of Science databases. The duplicate records were omitted, and about 12,000 were screened out from the total identified records as per content relevancy. Finally, based on the inclusion criteria mentioned above, 70 research articles were found to be suitable that provided the correct RET and PET estimation equations. In the current study, equations for RET estimation were retrieved from 44 research articles, whereas equations for PET estimation were collected from 26. The authors, timescales, and citations of the corresponding RET and PET equations are discussed in the next section.

3.1. Temperature Based Equations

PET equations may be traced back to Jensen et al. [56]. They were among the earliest mathematical notations for estimating evapotranspiration based on temperature [57]. Thornthwaite [15] proposed a temperature-based PET equation after studying the relationship between precipitation, temperature, and water fluctuation in numerous states across the United States. Additional PET temperature-based equations have been proposed and implemented. Table A1 illustrates the world’s most commonly used equations. From this table, it can be perceived that PET equations developed by McCloud [58], Hamon [59], Romanenko [60], Baier and Robertson [61], Schendel [62], and Szász [63] have been applied less than Thornthwaite and Blaney and Criddle’s equations [15,64]. Some of them, such as Szász and McCloud’s equations, were abandoned due to poor performance and unjustified or inadequate meteorological conditions. As observed in Figure 2, Thornthwaite’s equation is widely used in research articles (12,117 citations), because it is simple and requires the least amount of data. Several researchers have also compared it to other equations and found that it performed best. Similarly, Blaney and Criddle’s equation has also been widely used as a reference in many studies (1319 citations) for predicting PET because of its performance and ease of data collection. Moreover, it was found to be suitable for humid conditions where the advective impact is generally insignificant.
RET temperature equations are essentially the same as PET temperature equations since both indicate a high demand for evaporation in the atmosphere. Most RET computations include numerous distinct coefficients, similar to how PET is modified. 
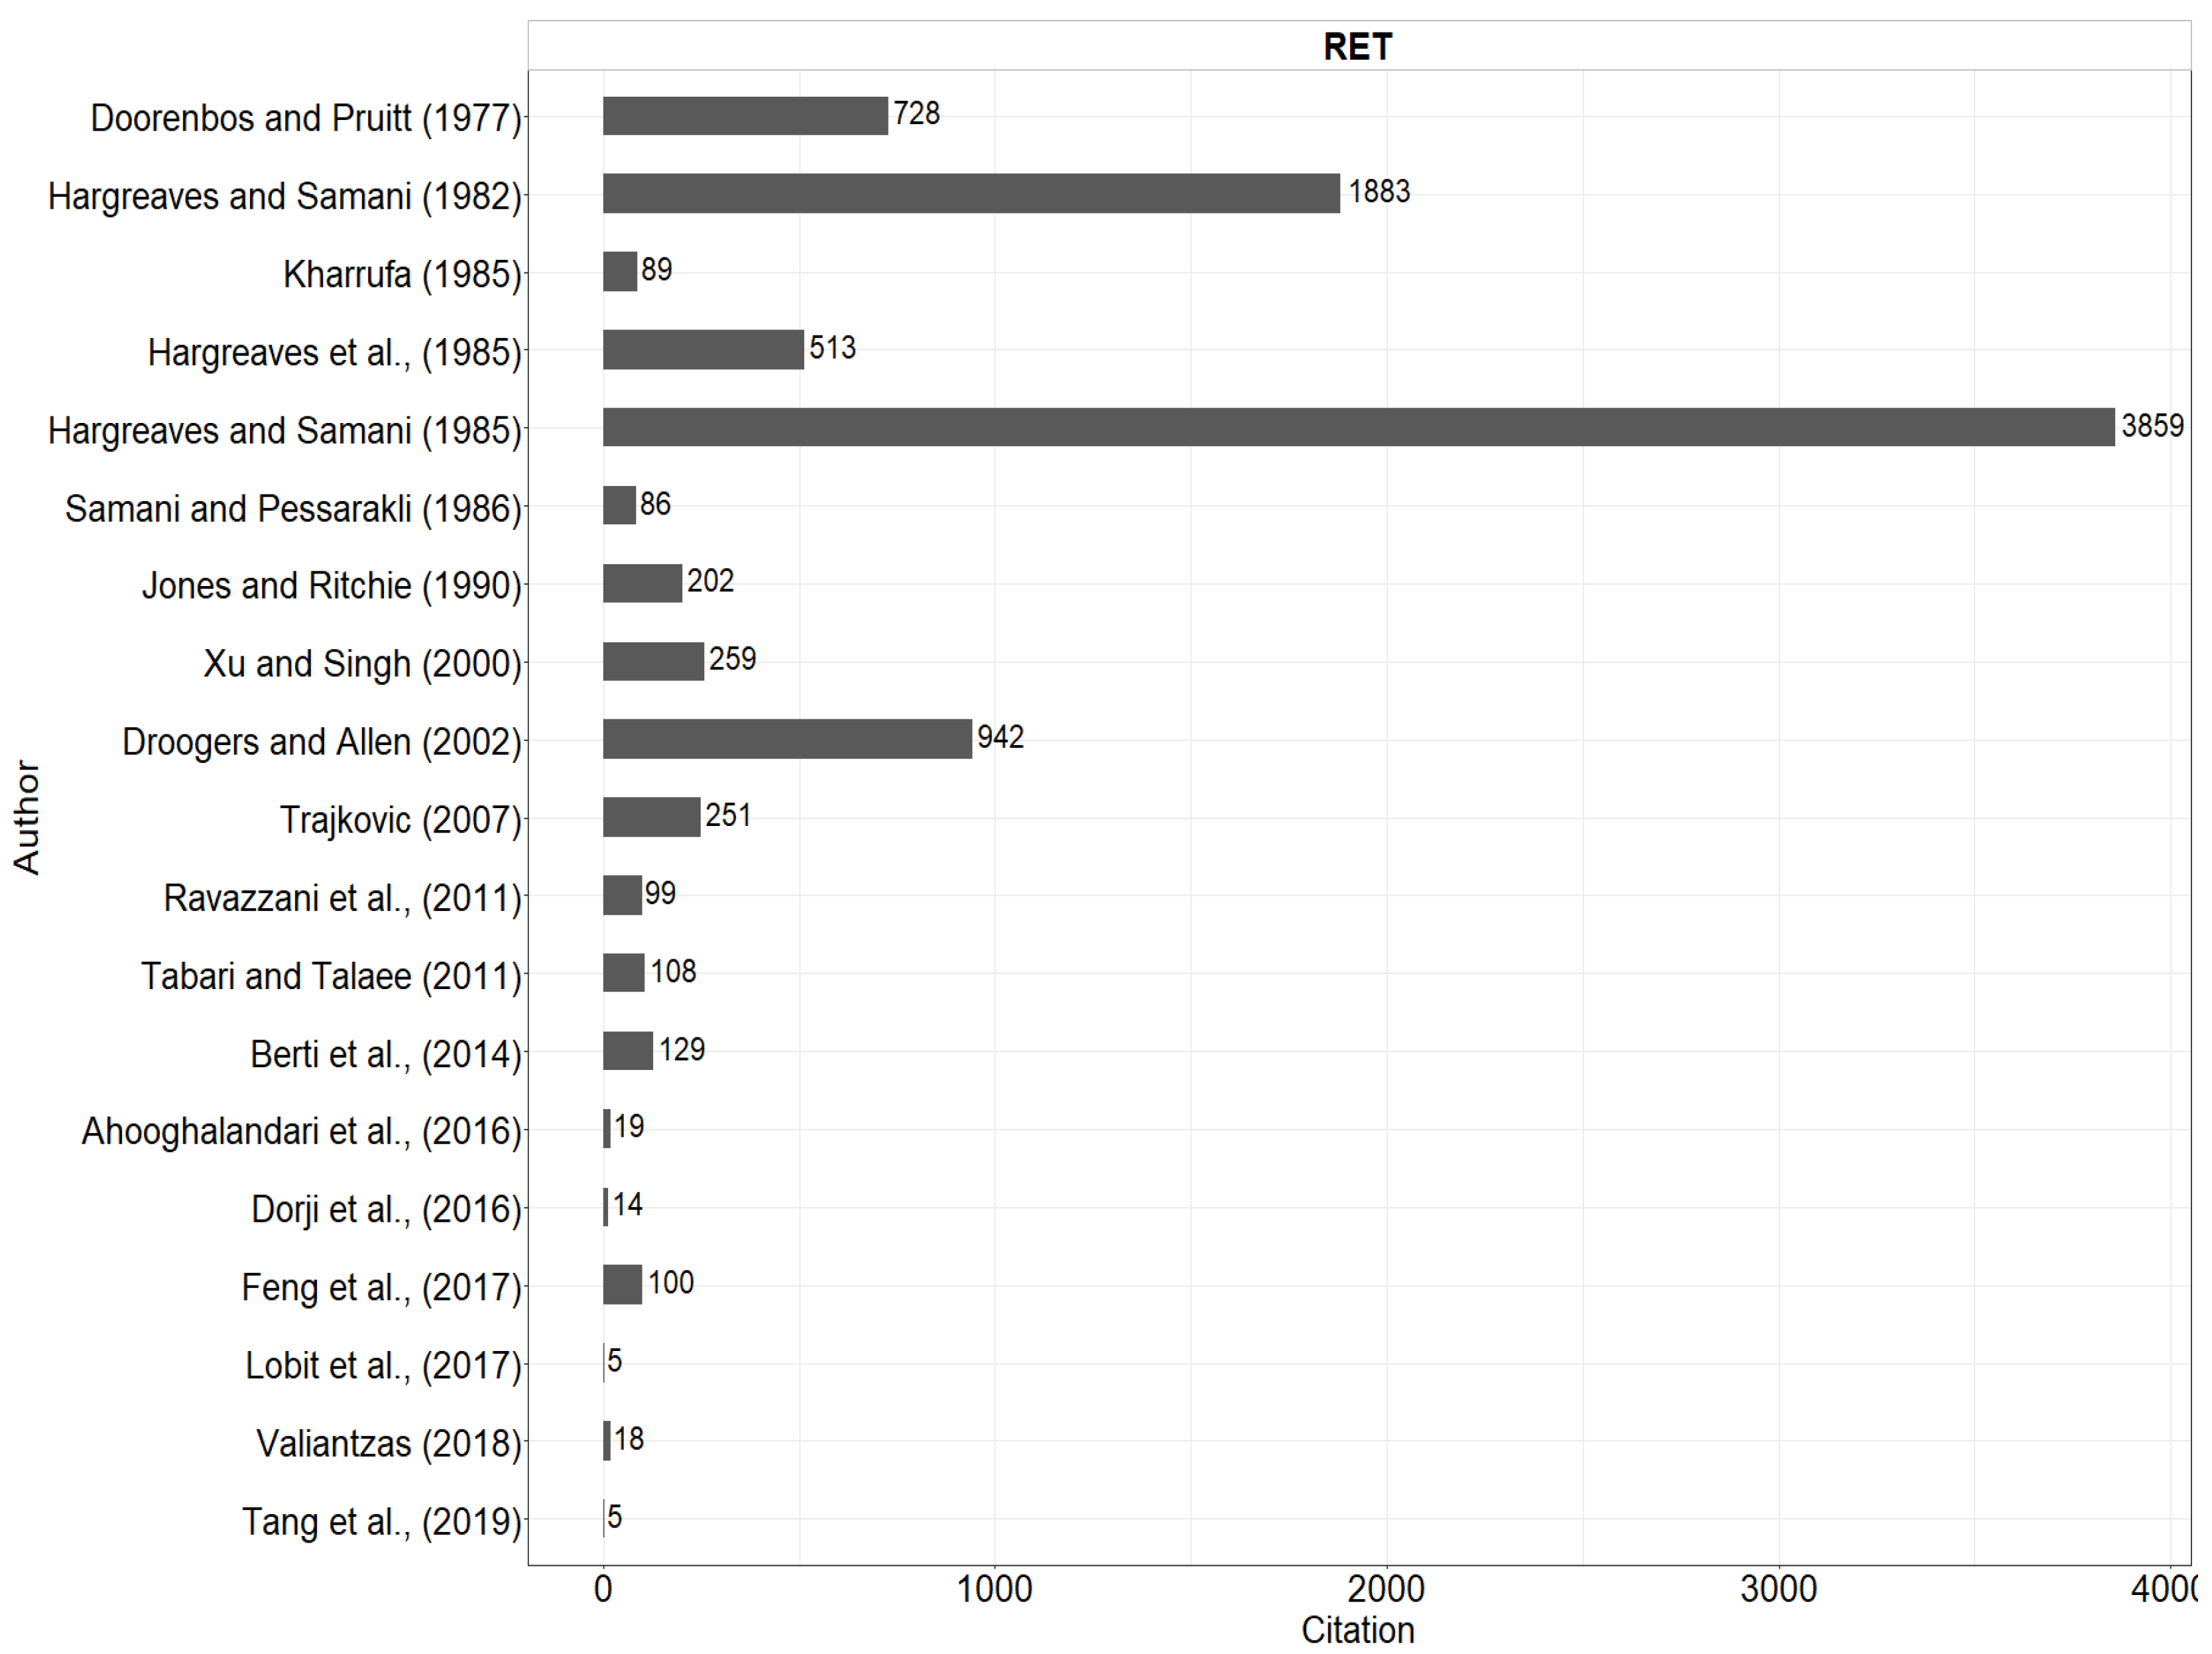
Table A4 illustrates some of the most often used RET temperature-based equations. These equations can be difficult to distinguish from PET equations, and this is similarly true for the other forms of RET equations. Kharrufa’s equation [65] performs poorly in various research studies under varying climatic circumstances, and it either overestimates or underestimates RET [66,67]. Hargreaves and Samani’s 1985 equation outperforms other equations developed by Hargreaves and Samani [14] and Hargreaves et al. [68], as it was cited in 3859 research articles, whereas the others were mentioned in 1883 and 513 articles, respectively. It is the most often used RET equation based on temperature data, as observed in Figure 3.

3.2. Radiation Based Equations

Radiation-based PET equations show empirical relations between PET and radiation. These equations can be seen as Penman’s generalized versions [16], and relatively accurate short-term predictions have been acquired [36]. 
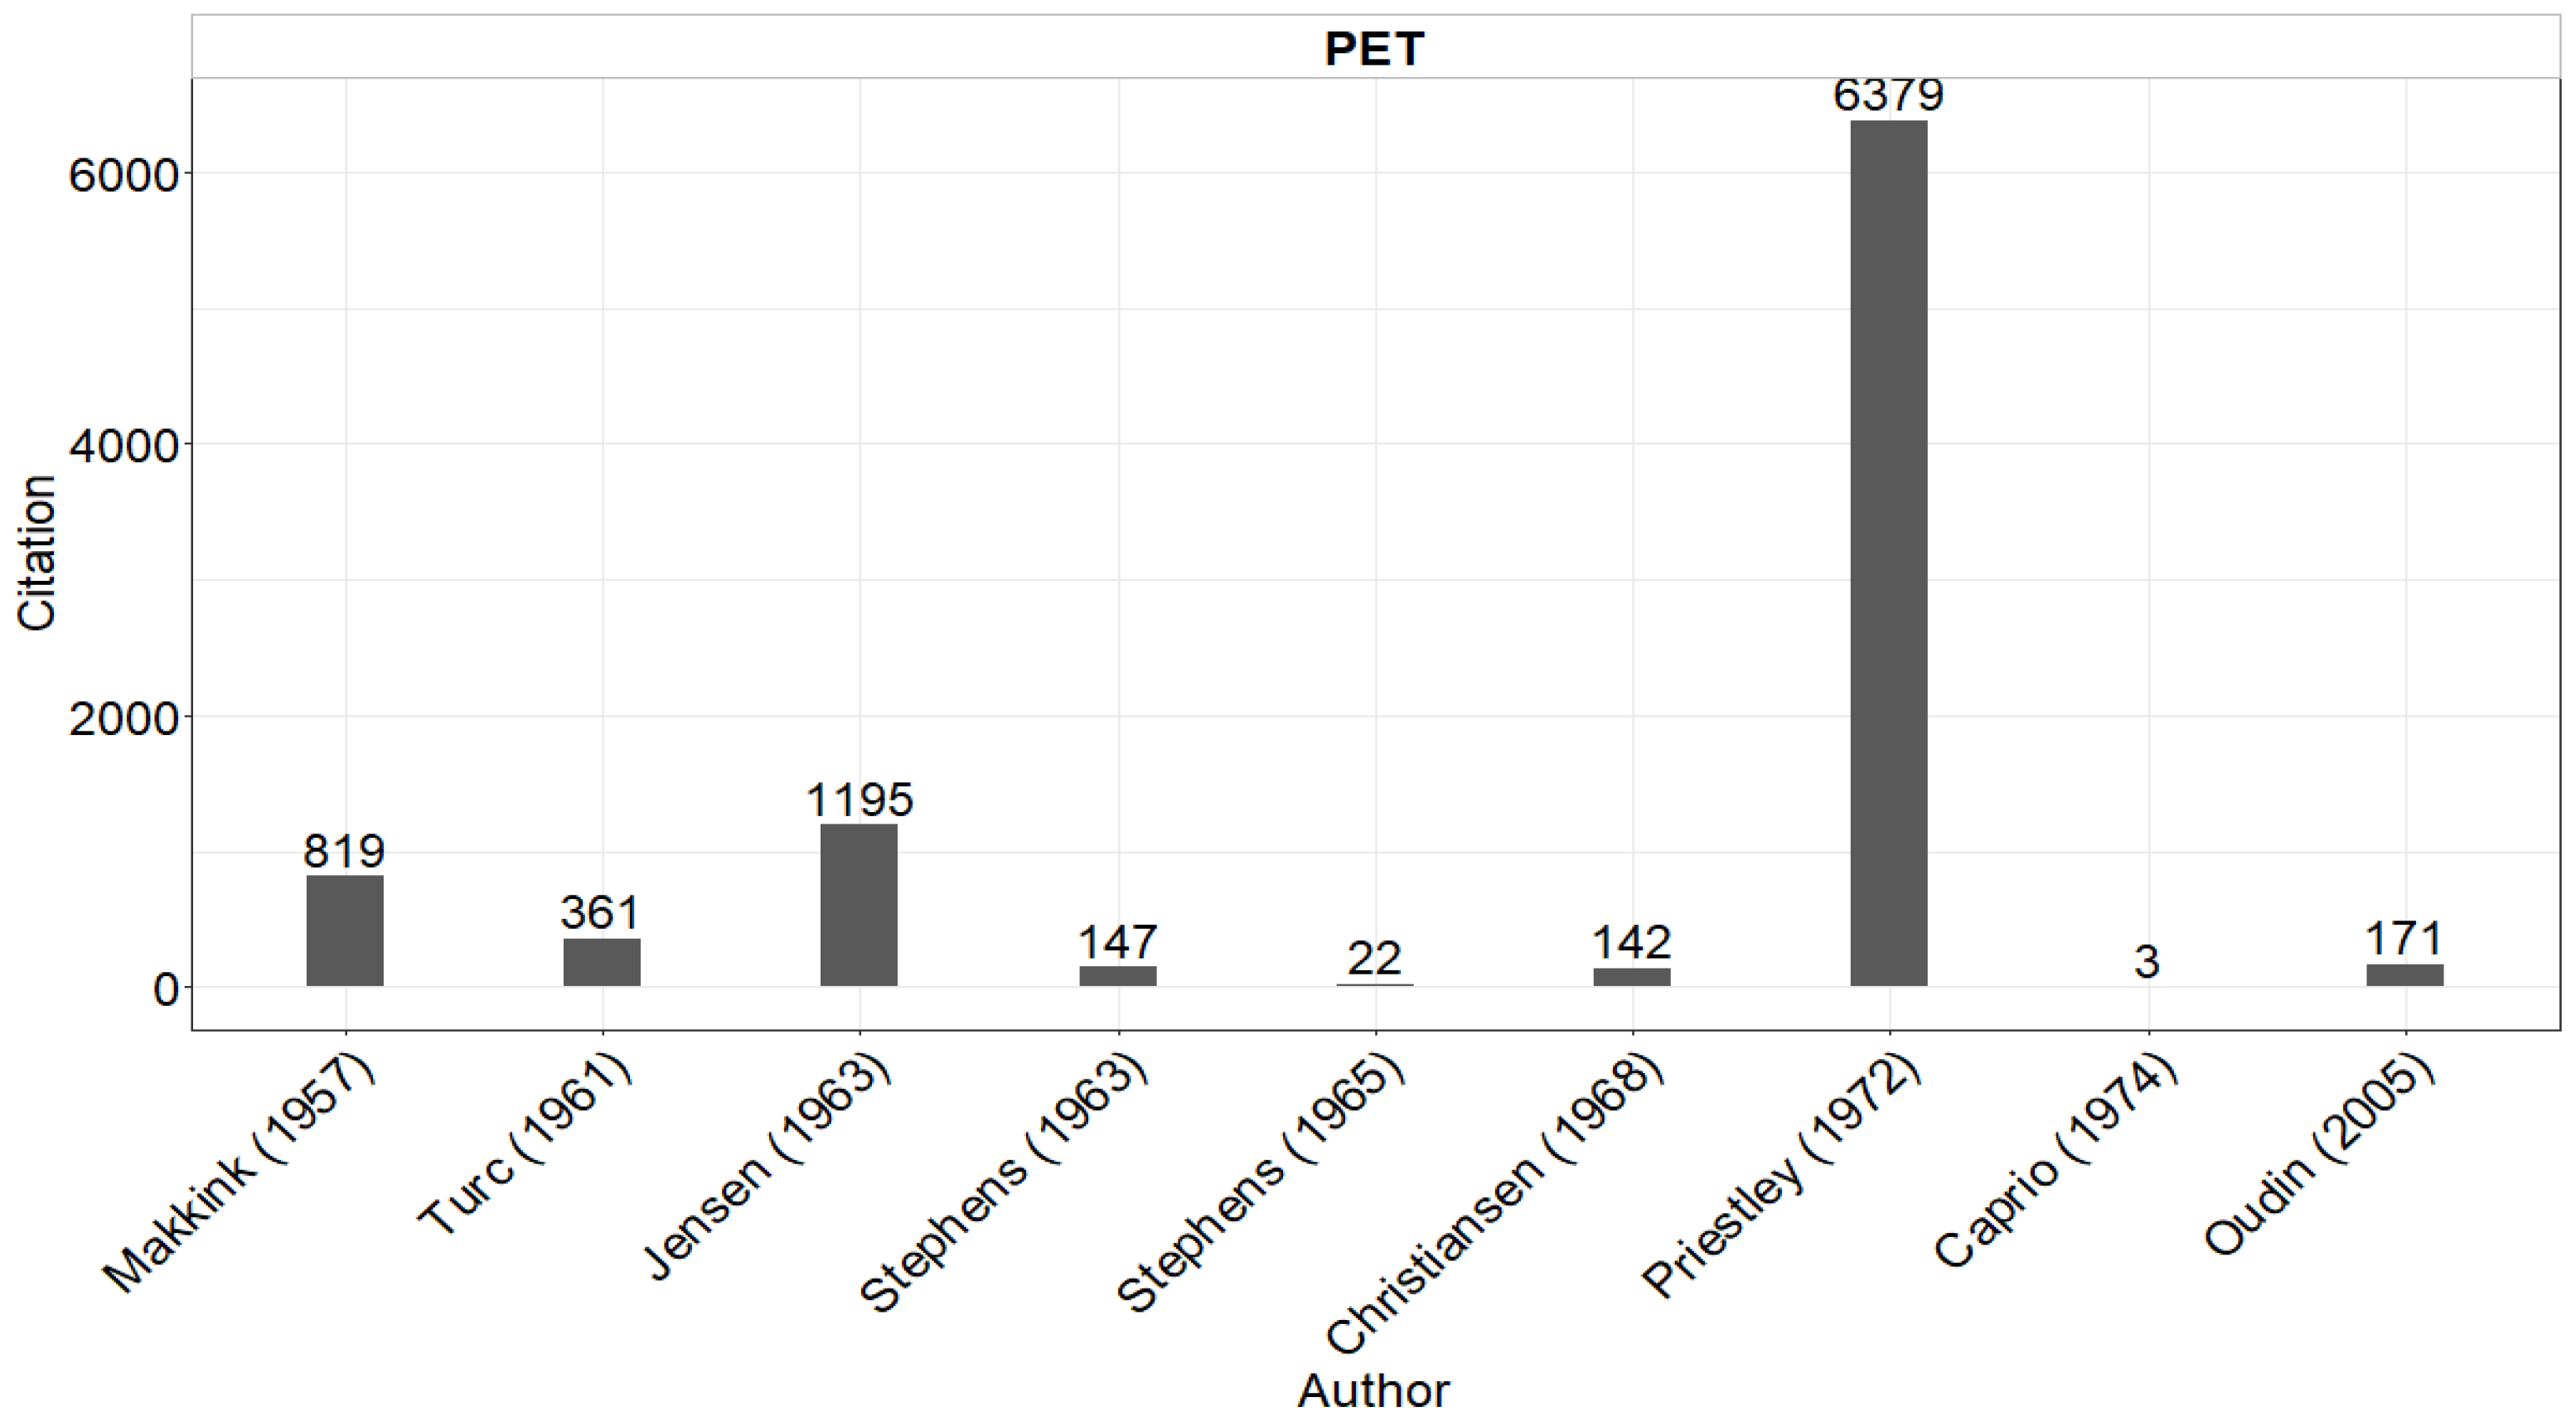
Table A2 presents some ordinary PET radiation equations. Priestley’s equation, developed in 1972, have been applied worldwide and are considered the most common radiation-based PET equation. As evident from Table A2, it has supremacy over other developed PET radiation-based equations, with 6379 citations. It can also be seen in Figure 4 that Priestley’s equation was cited many times compared to other PET equations. Moreover, this equation is suitable for saturated conditions and areas with open water surfaces with wind effects.
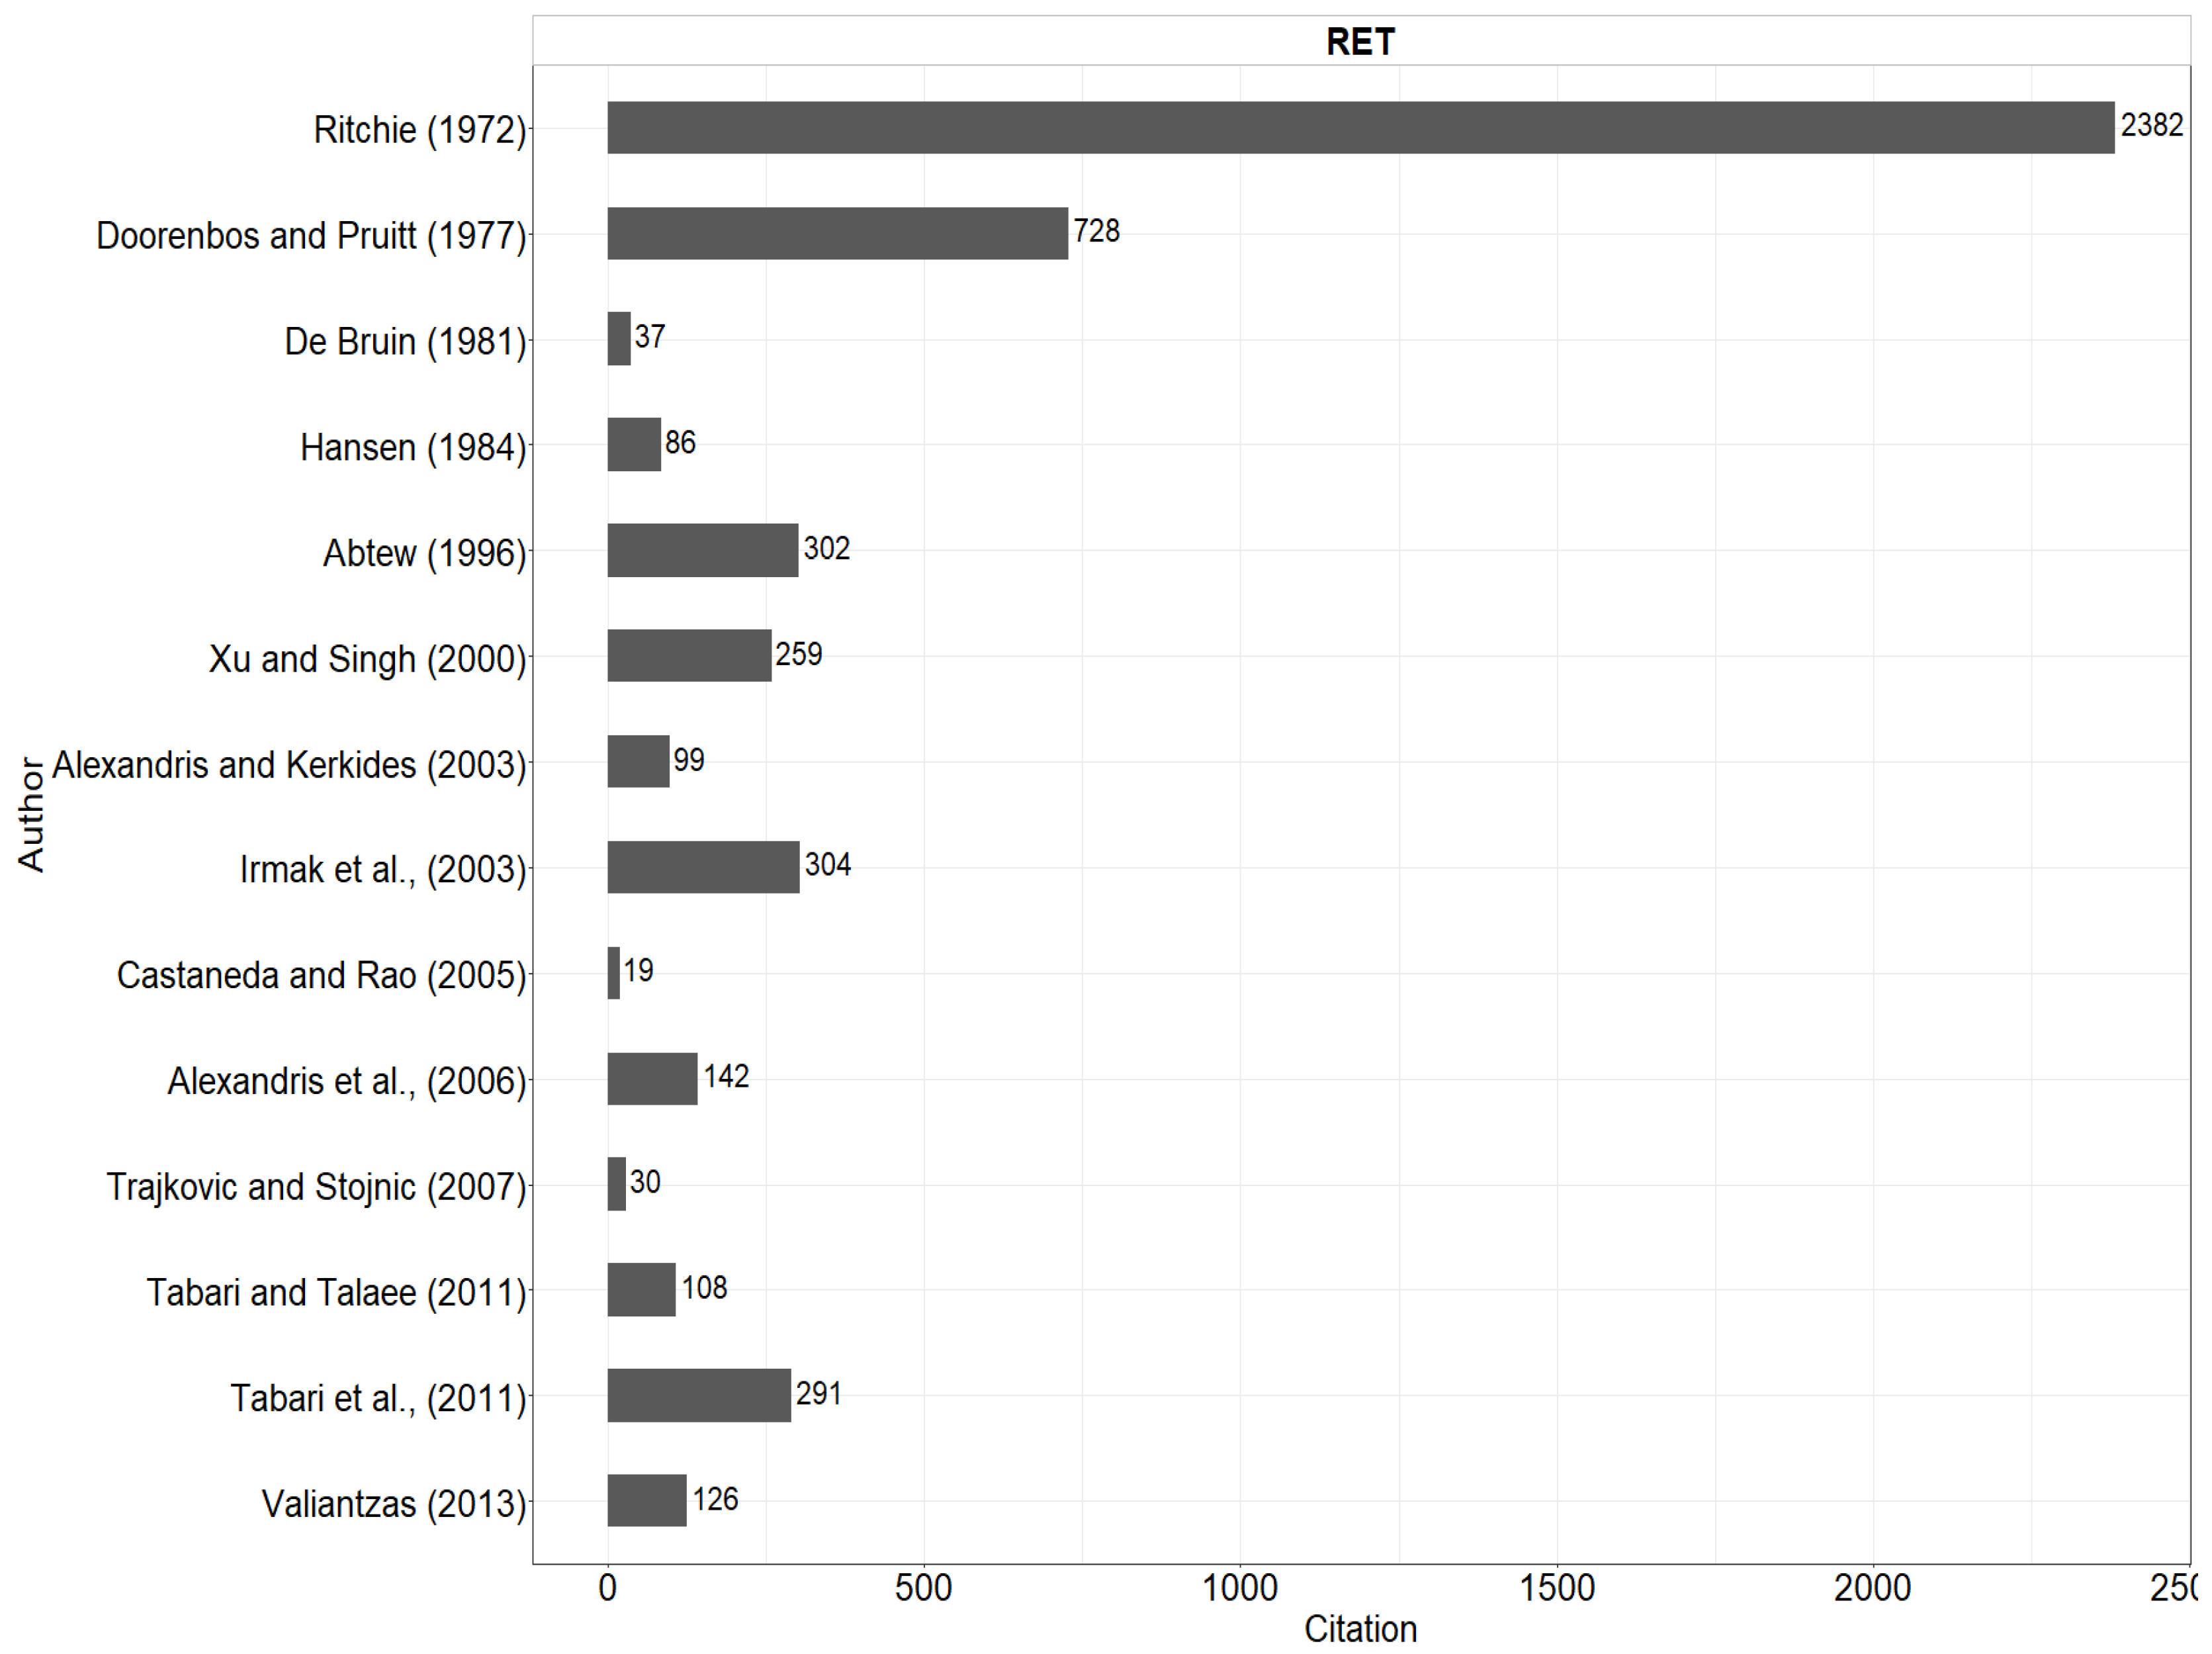
Widely applied RET radiation-based equations are similar to temperature-based PET equations. Table A5 presents the commonly used RET-based radiation equations. Among the radiation-based RET equations, Ritchie’s equation [69] received the most citations (2382), as seen in Table A5, even though it was initially presented to estimate PET. Variability and instability still exist in radiation-based equations. Simultaneously, study results have demonstrated exemplary performance in semi-arid or semi-humid conditions, where the lack of wind speed data can be ignored. The overall citations for each RET equation are presented in Figure 5. It can be seen that Ritchie’s equation has been cited more than other RET equations.

3.3. Combination-Type Equations

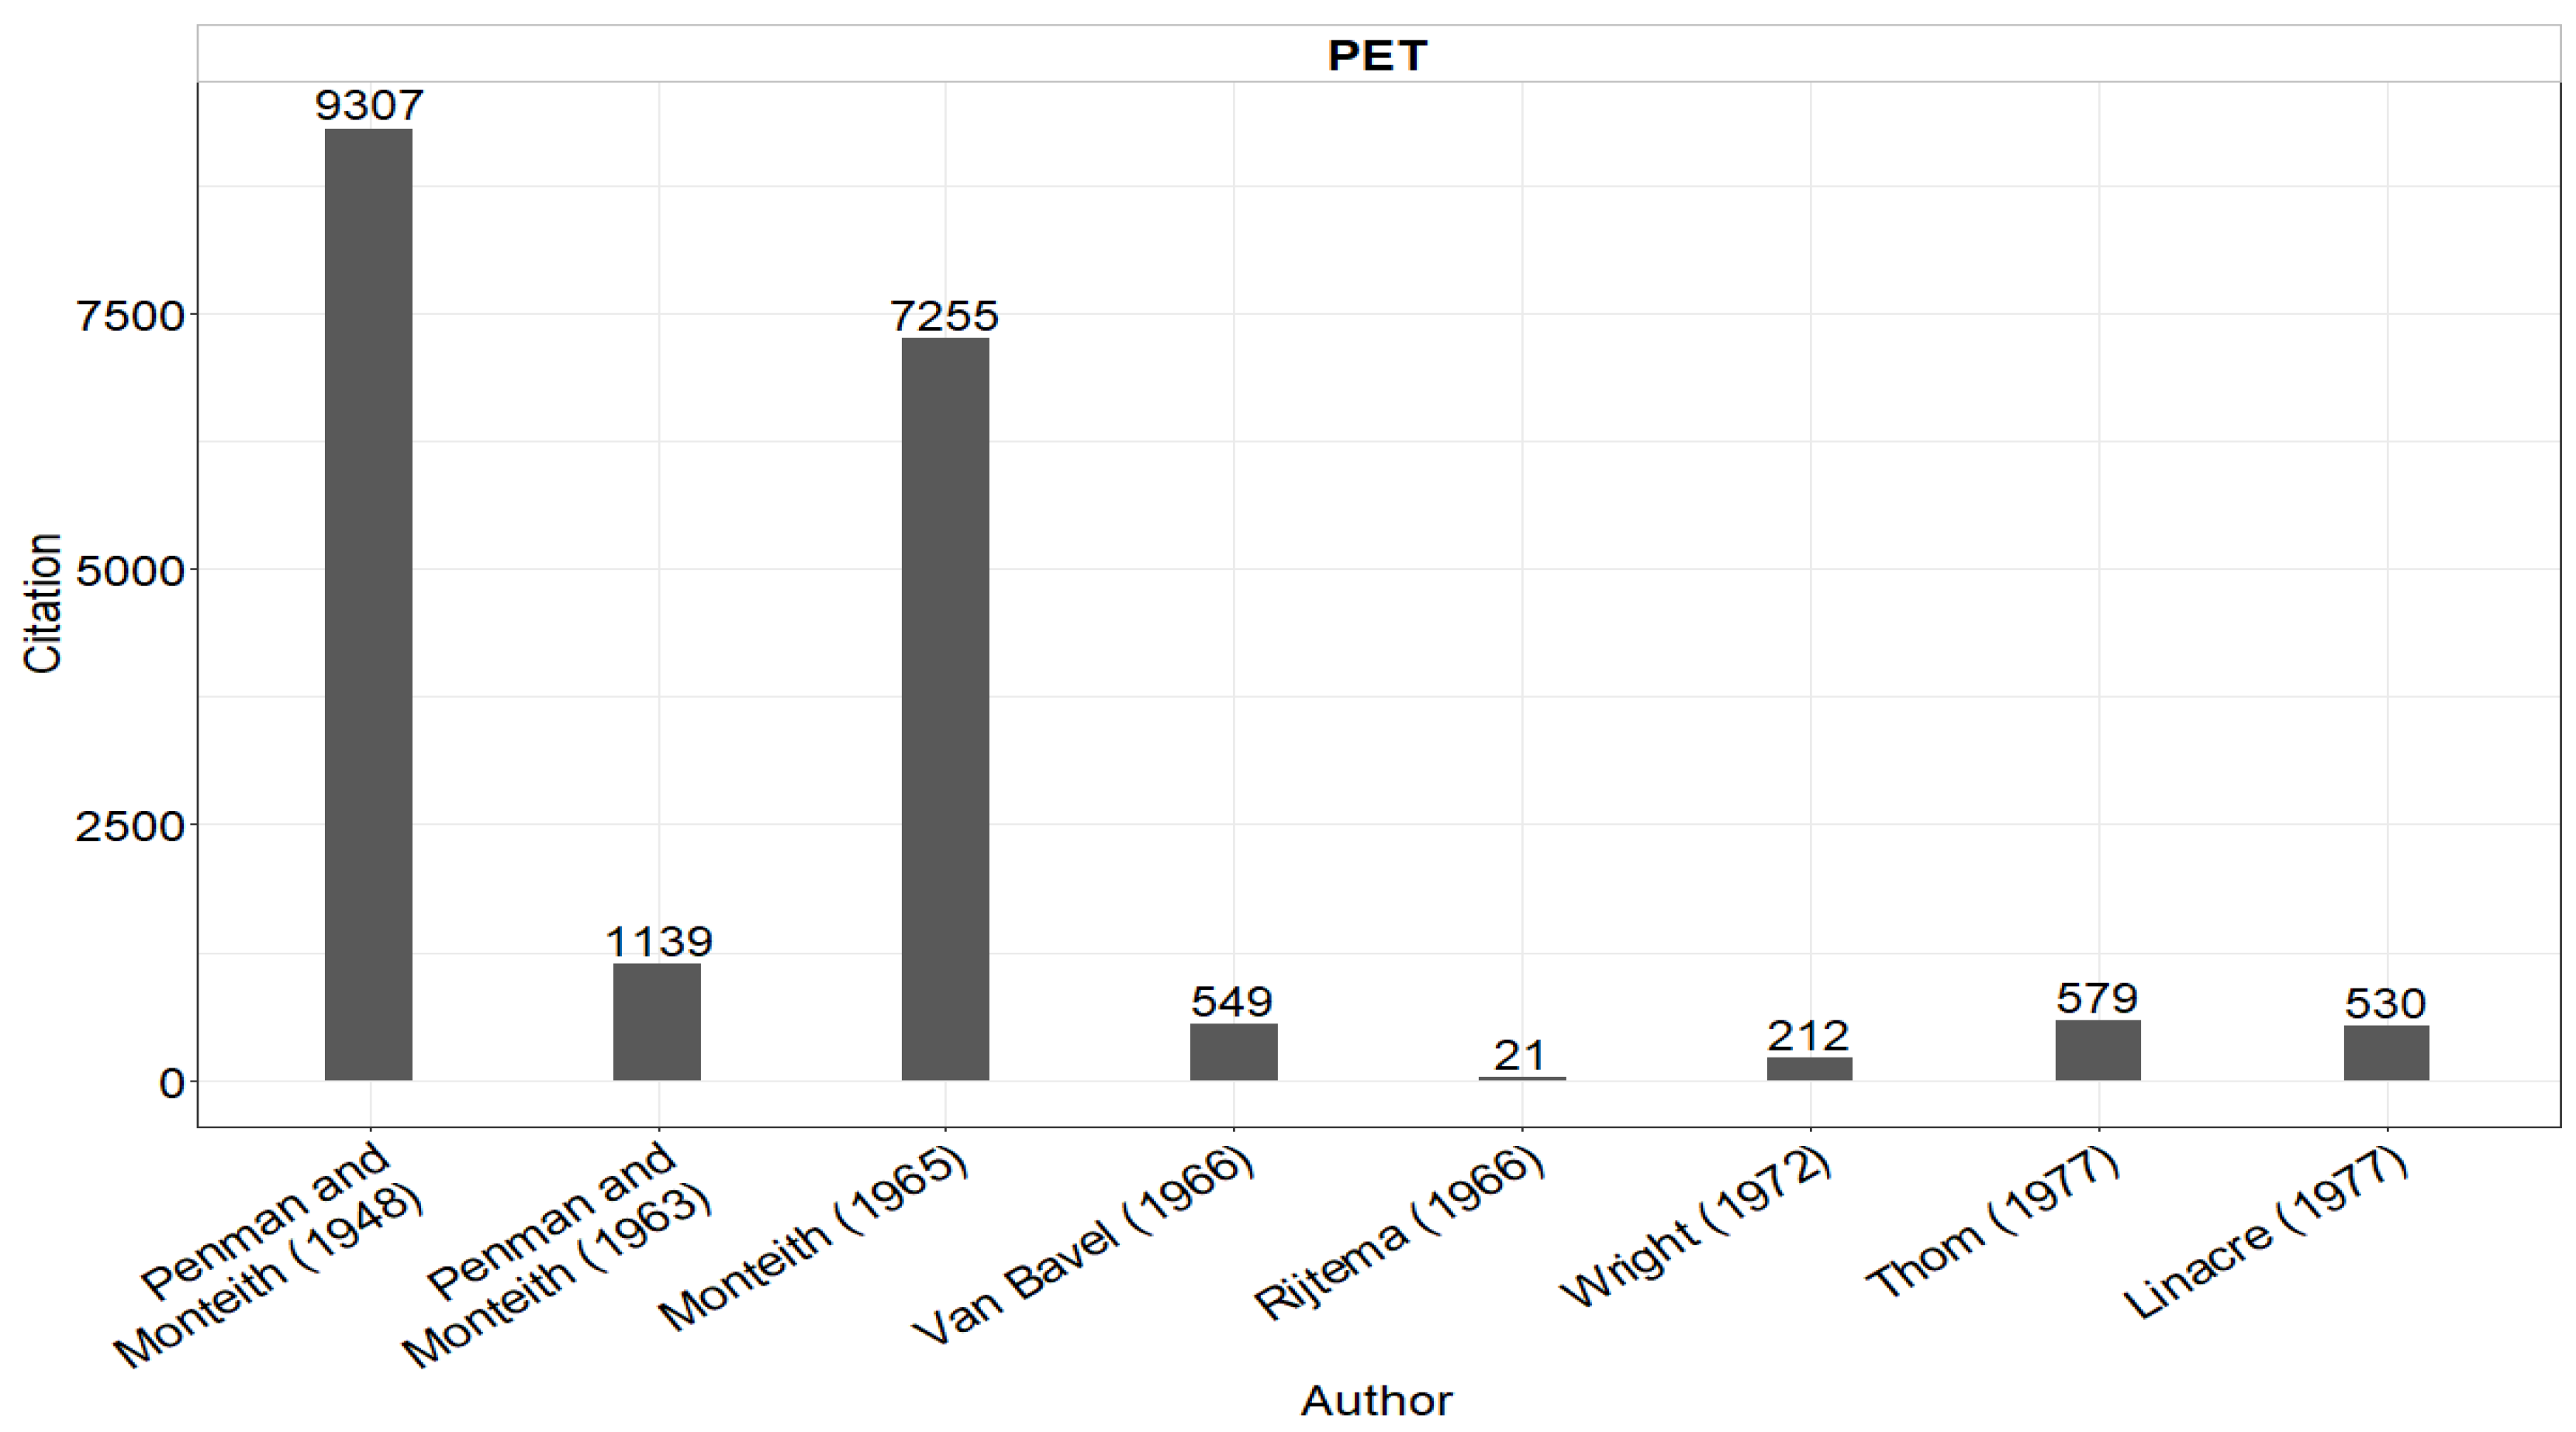
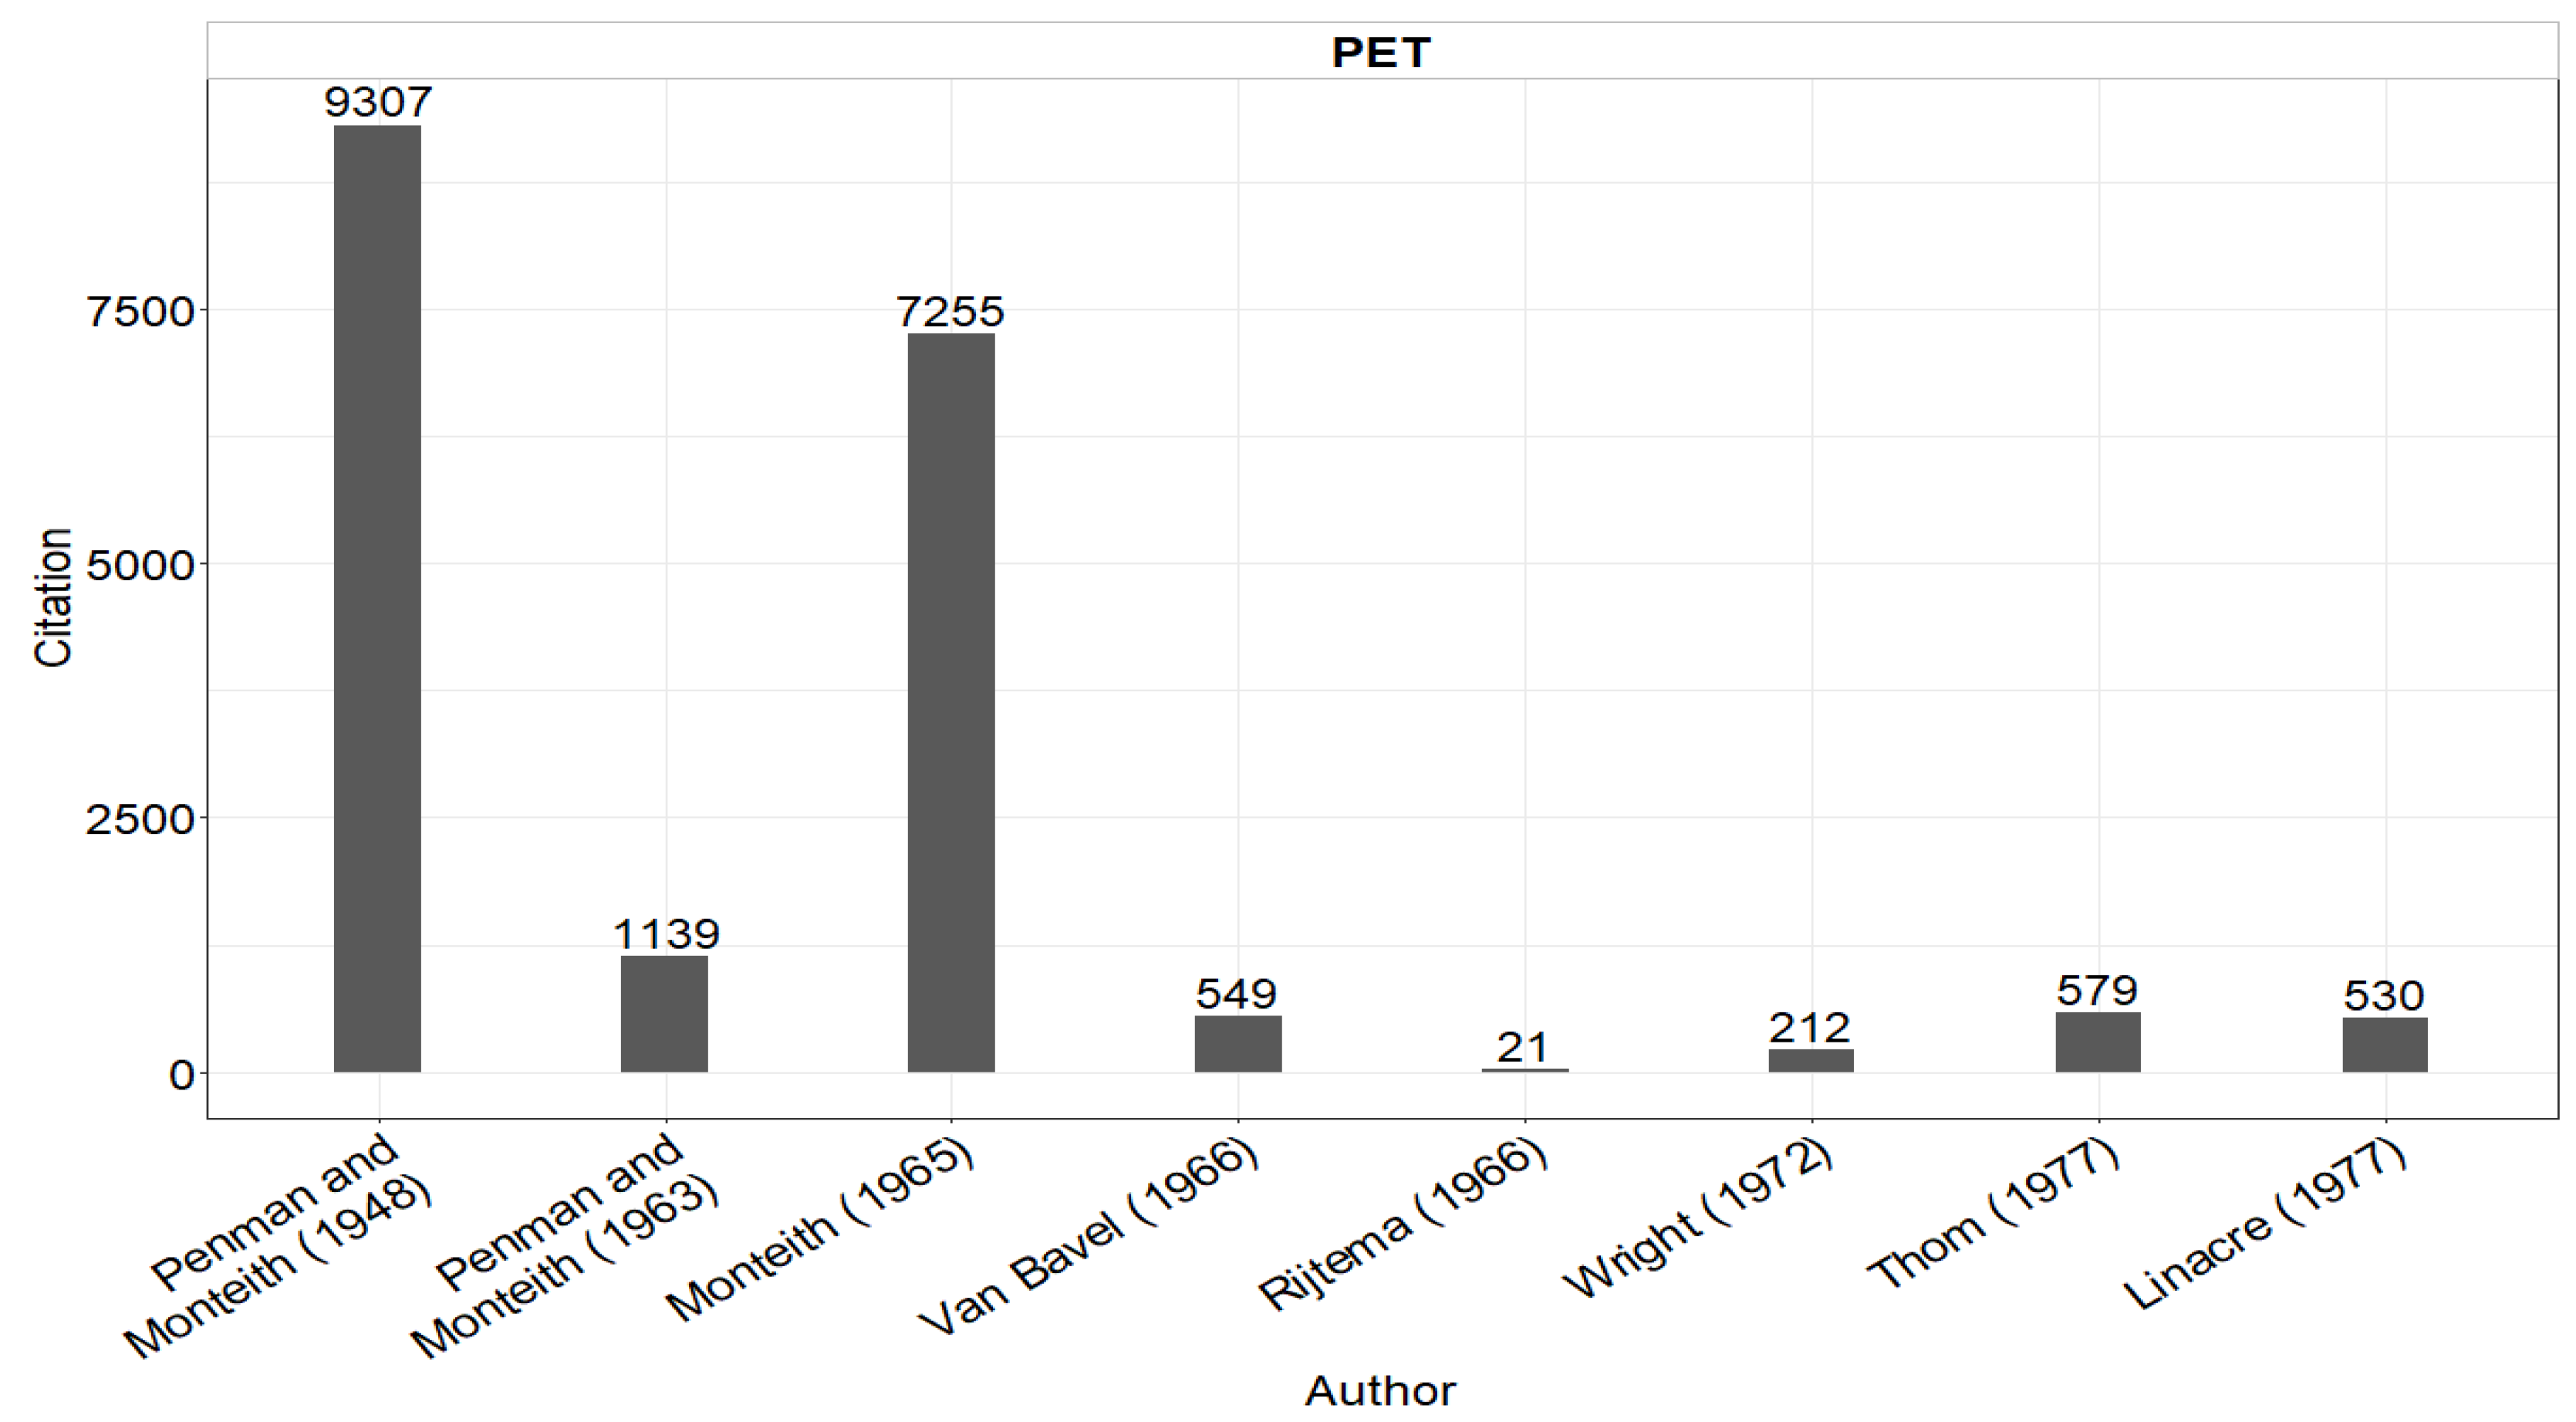
PET combination-based equations incorporate both energy balance and aerodynamic components. Moreover, velocity and vapor pressure are aerodynamic components related to Dalton’s theory of mass transfer presented in 1982. In 1948, Penman [16] provided a PET combination equation that considers the influence of air temperature and other climatic conditions. However, its primary goal was to compute the water quantity escaping from sticky surfaces. Table A3 shows some PET equations based on various combinations. It can be observed that the most often utilized combination-type PET equation is Penman’s equation, which was cited by 9307 studies. It is followed by Monteith [70], cited by 7255 studies, and Penman–Monteith [31], cited by 1139 studies. Penman’s [16,31] equations have not only been examined for diverse purposes but have also been changed for various situations by many researchers.
Moreover, Penman-type equations depend upon numerous meteorological variables that are not readily available in developing countries. As a result, other equations are frequently used as an alternative in these regions, with low PET accuracy being a predictable result. The citation of each PET combination-based equation is presented in Figure 6.
When required hydro-meteorological data are available, RET combination equations, like those for PET, are widely used worldwide (see Table A6). According to Figure 7, the equation of Allen et al. [5], also known as FAO-56 PM, was identified as the best for estimation using different step weather data (with >23,000 citations). This equation is a modified version of the Penman–Monteith equation, which was developed in 1965. FAO recommended it and it is widely used for various reasons, including its robust theoretical foundation and extensive depiction of the model [50]. Thus, it is primarily used as a yardstick for different RET equations and novel approaches to evaluate their performance [71,72].

4. RET and PET Application

It should be noted that RET and PET equations as alternatives to the FAO-56 PM equation have previously been compared. RET and PET equations were properly distinguished from one another in this work. In earlier research, PET and RET were not clearly separated, and PET equations were often compared to the FAO-56 PM equation. Nonetheless, the authors did not address this, and the issue between PET and RET remains unresolved. Trajkovic and Kolakovic [73] evaluated several PET equations with FAO-56 PM in humid climatic conditions, whereas Zarch et al. [74] studied them under desert climate patterns. The only equation that accurately predicted RET among the others was that of Hargreaves and Samani [75]. There were more cases of RET and PET equations being mixed together, and the two parts were often compared [76,77,78,79]
Ambiguity in RET and PET implementation equations has been widespread since solutions were often chosen at random. Both concepts derive from evaporation or evapotranspiration, which are used interchangeably. In meteorology, environmental science, and hydrology, PET has often been employed. Regarding agriculture, RET is the preferred method of irrigation. Thornthwaite’s equation [15] of PET was employed in this context to estimate drought indicators such as Palmer drought intensity indices (SDIS). However, following the conventional RET equation assumption, the FAO-56 PM equation is often employed to estimate PET for the Palmer Drought Severity Index (PDSI) [5]. PET is an important variable in several equations that are used to generate the A.I. drought index. Additionally, it is considered to be a crucial element in numerous hydrologic models that simulate precipitation and runoff [80,81,82,83,84,85]. Accurate RET calculations are necessary in agronomy to determine crop water needs and serve as the foundation for creating agricultural irrigation systems and other strategies. Surface resistance, stomata resistance, and diffusion resistance are only a few of the factors that are represented by the crop coefficient (Kc) [86,87,88]. The three most common RET estimation methods that apply RET as their primary variable [5,88] are: (i) the single crop coefficient (RET = Kc × RET); (ii) the dual crop coefficient (RET = (Ka + Kb) × RET); and (iii) the Shuttleworth and Wallace method.

5. Conclusions and Guidelines for Future Use

Reference evapotranspiration (RET) and potential evapotranspiration (PET) are the two primary forms of evapotranspiration (ET). The misunderstanding between RET and PET has persisted for a very long time. Overall, RET and PET have been used interchangeably for a considerable time. Additionally, correctly distinguishing their meanings and applying them effectively provides an opportunity to improve ET estimation accuracy. Both RET and PET are applied to describe changes in energy and water, so they are related concepts. Despite having an evaporation (E) root, their respective meanings are quite distinct. To increase the investigation’s rationale, it is important to choose terminology that is appropriate for the variety of research related to ET topics. Furthermore, it is crucial to understand these two distinct concepts before using them properly. The definitions and uses of RET and PET differ, and they were designed for distinct timescales.
The Preferred Reporting Item for Systematic reviews and Meta-Analysis (PRISMA) was used in current study. RET estimation equations were obtained from 44 research publications, whereas equations for PET estimation were acquired from 26 articles. This study’s findings reveal that among temperature-based equations for PET, Thornthwaite’s (1948) equation was referenced in 12,117 papers, while Hargreaves and Samani’s (1985) equation was mentioned in 3859 studies. Similarly, Priestley (1972) had the most referenced equation (6379 citations) in radiation-based PET equations, while Ritchie (1972) had the most cited (2382) RET equation in radiation-based equations. Furthermore, Penman and Monteith’s (1948) equations were mentioned in 9307 research articles among PET combination-based equations, while the equation of Allen et al. (1998) received a substantial number of citations in more than 23,000 publications among RET combination-based equations. Based on application usage, PET is most commonly used in the domains of hydrology, meteorology, and climatology. However, RET is more commonly employed in the fields of agronomy, agriculture, irrigation, and ecology. PET has been utilized to calculate drought indicators, whereas RET has been used for single and dual crop coefficient techniques.
The RET and PET equations were previously frequently confused but, by the 1980s, they had been categorized into distinct types (temperature-based, radiation-based, and combination-based), which are explicitly explained in this study. RET aims to eliminate the uncertainties that occurred in the PET definition. Since its introduction, the RET idea has gained a large amount of support from researchers and scientists all across the world. The FAO56-PM equation has gained popularity and is now utilized for RET estimation globally. In the future, RET and PET should be distinguished more clearly from one another than they were in the past. Estimation formulae for PET and RET are the main cause of misunderstanding. This is because there is often a lack of clarity about the concepts and developments of PET and RET. The literature does not provide a clear structure for the many equations that can be used to determine RET or PET. The current study’s information is based on a common interpretation of these terms, which is useful for agricultural and irrigation engineers, farm managers, and university researchers because it provides clear direction for future usage.

Author Contributions

Conceptualization, A.R.; Data curation, A.R., A.E.; Investigation, M.Z.; Methodology, A.R., D.K.V., P.A.; Visualization, D.K.V., P.A., S.A.; Writing—original draft preparation, A.R.; Funding acquisition, N.A.-A.; Writing—review and editing, P.A., Y.H., N.A.-A., C.A.W., M.Z., S.A. All authors have read and agreed to the published version of the manuscript.

Funding

We are highly gratified to Nadhir Al-Ansari for covering the APC of this article.

Data Availability Statement

Supporting material and data included within this research article are available on reasonable request.

Acknowledgments

We are obliged to the editor and anonymous reviewers for their suggestions and improvement regarding this manuscript.

Conflicts of Interest

The authors declare that no conflict of interest are present in this research article.

Abbreviations

N m Sunshine monthly duration
Tm, Tmin , Ta and TmaxMonthly air temperature, minimum, average, and maximum daily air temperature, respectively.
Z Elevation
P t Saturated vapor concentration at the mean temperature
RH Relative humidity
T d and T X Mean dew temperature
u 2 Mean wind speed at 2 m.
Δ Slope of the saturation vapour pressure curve.
γ Psychometric constant.
R   n , R   s and R   a Net solar radiation, solar radiation, and extraterrestrial solar radiation, respectively
α 0 Radiation coefficient
G Ground heat flux
ρ W Water density
H Net radiant energy available at the surface
e a   and e d Saturation vapor pressure and actual vapor pressure, respectively
e ZS and e Za Saturation and actual vapor pressure at height of Z meterd
ρ Mean air density at isobaric conditions
c P Specific heat of air
e S e a Vapour pressure deficit
r a   and r S Surface resistance and aerodynamic resistance, respectively
P re Atmospheric pressure
Z 1 Anemometer height above soil
z 0 Wind profile roughness height
W f Correction factor to compensate day/night effect
φ Latitude
p Average annual percentage of daylight hours [43]
K T and K RS Calibration and empirical coefficient
c o ,   c 1 , c 2 , c 3 Radiation-based coefficients
P t Saturated vapor concentration

Appendix A

Table A1. PET temperature-based equations.
No.Formulated EquationData TypeFirst AuthorPublished YearCitations
1. PET Thornthwaite = 16 N m 10 T m a 1 MThornthwaite194811,093
2. PET Blaney = a 2 + b 0.46 T a + 8.13 1 + 0.0001 Z MBlaney19501164
3. PET McCloud = 0.254 × 1.07 1.8 Ta DMcCloud195554
4. PET Hamon = 0.55 N 2 P t D/MHamon19601010
5. PET Romanenko = 0.0018 25 + T a 2 100 RH DRomanenko1961123
6. PET Baier = 0.157 T max + 0.158 T d + 0.109 R a 5.39 DBaier1965279
7. PET Schendel = 16 T a / RH DSchendel196743
8. PET Szasz = 0.00536 T a + 21 2 ( 1 + RH ) 2 / 3 0.519 u 2 + 0.905 MSzász197310
9. PET Hargreaves = 0.0135 R s T a + 17.8 D/MHargreaves1975361
Note: PET = Potential Evapotranspiration; D = Daily; M = Monthly.
Table A2. PET radiation-based equations.
No.Formulated EquationData TypeFirst AuthorPublished YearCitations
1. PET Makkink = 0.61 Δ / Δ + γ R s 0.12 MMakkink1957819
2. PET Turc = 0.013 T a / T a + 15 R s + 50 D/MTurc1961361
3. PET Jensen = 0.014 T a 0.37 R s D/MJensen19631195
4. PET Stephens = 0.0082 T a 0.19 R s / 1500 D/MStephens1963147
5. PET Stephens = 0.0158 T a 0.09 R s DStephens196522
6. PET Christiansen = 0.385 R s D/MChristiansen1968142
7. PET Priestley = α 0 Δ / Δ + γ R n G DPriestley19726379
8. PET Caprio = 6.1 / 10 6 1.8 T a + 1 R s D/MCaprio19743
9. PET Oudin = R a T a / 5 ρ W D/MOudin2005171
Note: PET = Potential Evapotranspiration; D = Daily; M = Monthly.
Table A3. PET combination-based equations.
No.Formulated EquationData TypeFirst AuthorPublished YearCitations
1. PET Penman = Δ H + γ e a e d f u Δ + γ DPenman19489307
2. PET Penman = Δ Δ + γ R n G + 6.43 γ Δ + γ 1 + 0.0536 u Z e ZS e Za DPenman19631139
3. PET Penman Monteith = Δ R n G + ρ c P e S e a / r a Δ + γ 1 + r S / r a DPenman-Monteith19657255
4. PET Van   Bavel = Δ Δ + γ R n G + γ Δ + γ 0.622 ρ x 2 P re u Z e S e a ln Z 1 d / z 0 2 DVan Bavel1966549
5. PET Rijtema = Δ R n + γ ru 2 0.75 e s e a Δ + γ DRijtema196621
6. PET Wright = Δ Δ + γ R n G + 15.36 γ Δ + γ W f e Z S e Za DWright1972212
7. PET Thom = Δ R n G + 1.2 γ 1 + 0.54 u 2 e s e a Δ + γ 1 + r S / r a DThom1977579
8. PET Linacre = 700 T a + 0.006 Z / 100 φ + 15 T a T dew 80 T a D/MLinacre1977530
Note: PET = Potential Evapotranspiration; D = Daily; M = Monthly.
Table A4. RET temperature-based equations.
No.Formulated EquationData TypeAuthorPublished YearCitations
1. RET Kharrufa = 0.34 pTa 1.3 D/MKharrufa198589
2. RET Jones   &   R i t c h i e = α 1 0.00387 R s 0.6 T max + 0.4 T min + 29 Jones and Ritchie1990202
3. RET Ahooghalandari   &   o t h e r s = 0.369 R a + 0.139 T max 1 RH / 100 1.95 D/MAhooghalandari et al.201619
4. RET Doorenbos   &   P r u i t t = p 0.46 T a + 8 MDoorenbos and Pruitt1977728
5. RET Samani   &   P e s s a r a k l i = 0.013 K T R a 1.8 T a + 32 T X T d 0.5 D/MSamani and Pessarakli198686
6. RET Valiantzas   0.0118 ( 1 RH / 100 ) 0.2 T d 0.3 R a T a + 10 0.5 40 + 0.1 T a + 20 1 RH / 100 ( U / 2 ) 0.6 Valiantzas201818
7. RET Hargreaves   &   S a m a n i = 0.0145 K RS R a ( T a + 17.8 ) T d 0.5 D/MHargreaves and Samani19821883
8. RET Xu   &   S i n g h   = 0.0145 R s T a + 17.8 MXu and Singh2000259
9. RET Hargreaves   &   o t h e r s = 0.0022 R a T a + 17.8 T d 0.5 D/MHargreaves et al.1985513
10. RET Hargreaves   and   Samani = 0.0023 R a T a + 17.8 T d 0.5 D/M/YHargreaves and Samani19853859
11. RET Droogers   &   A l l e n = 0.0005304 R a T a + 17 T d 0.0123 P 0.76 D/M/YDroogers and Allen2002942
12. RET Trajkovic = 0.0023 R a T a + 17.8 T d 0.424 -Trajkovic2007251
13. RET Ravazzani   &   o t h e r s = 0.0023 R a T a + 17.8 0.817 + 0.00022 Z T d 0.5 -Ravazzani et al.201199
14. RET Tabari   &   T a l a e e = 0.0031 R a T a + 17.8 T d 0.5   for   arid   climate )   ET o = 0.0028 R a T a + 17.8 T d 0.5   ( for   cold   climate ) -Tabari and Talaee2011108
15. RET Berti   &   o t h e r s = 0.00193 R a T a + 17.8 T d 0.517 -Berti et al.2014129
16. RET Dorji   &   o t h e r s = 0.000817 R a T a + 33.9 T d 0.296 -Dorji et al.201614
17. RET Feng   &   o t h e r s = 0.00217 R a T a + 16.4 T d 0.435 -Feng et al.2017100
18. RET Lobit   &   o t h e r s = 0.1555 R a 0.00428 T a + 0.09967 T d 0.5 -Lobit et al.20175
19. RET Tan g   &   o t h e r s = 10 4 R a T a + 36.6 7 + 0.002 Z T d 0.5 -Tang et al.20195
Note: RET = Reference Evapotranspiration; D = Daily; M = Monthly; Y = Yearly.
Table A5. RET radiation-based equations.
No.Formulated EquationData TypeAuthorPublished yearCitations
1. RET Ritchie = Δ / Δ + γ R n DRitchie19722382
2. RET Valiantzas 0.0393 T a + 9.5 0.5 R s 0.19 R s 0.6 φ 0.15 + 0.0061 T a + 20 1.12 T a T min 2 0.7 D/MValiantzas2013b126
3. RET Doorenbos   &   P r u i t t = c 1 WR s D/MDoorenbos and Pruitt1977728
4. RET Hansen = 0.7 Δ / Δ + γ R s D/MHansen198486
5. RET Xu   &   S i n g h = 0.77 Δ / Δ + γ R s + 0.2 MXu and Singh2000259
6. RET Castaneda   &   R a o = 0.7 Δ / Δ + γ R s 0.12 MCastaneda and Rao200519
7. RET De   Bruin = 0.63 Δ / Δ + γ R s 2 G DDe Bruin198137
8. RET Abtew = a 1 R s 5-dayAbtew1996302
RET Abtew = KR s 0.52 K 0.54
RET Abtew = 1.18 Δ / Δ + γ R n G
RET Abtew = 0.013 23.89 R s + 50 T max / T max + 15
9. RET Xu   &   S i n g h = 0.98 Δ / Δ + γ R n + 0.94 MXu and Singh2000259
10. RET Xu   &   S i n g h = 0.015 R s + 50 T a / T a + 15 RH 50 ET o   = 0.015 R s + 50 T a / 15 T a 1 + 50 RH / 70 ( RH > 50 ) .
11. RET Tabari   &   T a l a e e = 2.14 Δ / Δ + γ R n G for   arid   climate ET o = 1.82 Δ / Δ + γ R n G   for   cold   climate MTabari and Talaee2011108
12. RET Trajkovi ć   &   S t o j n i ć = 0.013 0.8383 0.0313 u 2 + 0.1706 u 2 23.88 R s + 50 T a / T a + 15 D/MTrajković and Stojnić200730
13. RET Alexandris   &   K e r k i d e s = c 0 + c 1 RH + c 2 T a + c 3 RH 2 + c 4 T a 2 + c 5 R s + R s / 2 c 6 RH + c 7 T a + c 8 R s Hr/DAlexandris and Kerkides200399
14. RET Alexandris   &   o t h e r s = 0.057 + 0.643 C 1 + 0.227 C 2 + 0.0124 C 1 C 2 D/MAlexandris et al.2006142
15. RET Irmak   &     o t h e r s = 0.149 R s + 0.079 T a 0.611 ET o   = 0.289 R n + 0.023 T a + 0.489 D/MIrmak et al.2003b304
16. RET Tabari   &   o t h e r s = 0.156 R s + 0.0733 T min 0.0112 T max 0.478 ET o   = 0.174 R s + 0.0353 T a 0.642 D/MTabari et al.2011291
Note: RET = Reference Evapotranspiration; D = Daily; M = Monthly; Hr = Hourly.
Table A6. RET combination-based equations.
No.Formulated EquationData TypeAuthorPublished YearCitations
1. RET Doorenbos   &   P r u i t t = c 2 0.408 Δ Δ + γ R n G + 2.7 γ Δ + γ 1 + 0.846 u 2 M-DDoorenbos and Pruitt1997728
2. RET Wright = Δ Δ + γ R n G + 6.43 γ Δ + γ W f e Zs e Za -Wright1982942
3. RET George   &   o t h e r s = Δ Δ + γ R n G + 0.268 γ Δ + γ a W + b W u Z e S e a -George et al.198521
4. RET Shuttleworth   and   Maidment = Δ Δ + γ R n + γ 6340 1 + 0.536 u 2 e S e a Δ + γ -Shuttleworth and Maidment19931277
5. RET Valiantzas 0.051 1 α T a + 9.5 0.5 R s 2.4 R s / R a 2 + 0.00012 Z + 0.048 T a + 20 1 RH / 100 0.5 + 0.536 u 2 -Valiantzas2006248
6. RET Valiantzas 0.0393 R s T a + 9.5 0.5 0.024 T a + 20 1 RH / 100 2.4 R s / R a 2 + 0.066 W aero T a + 20 1 RH / 100 u 2 0.6 -Valiantzas201249
7. RET Valiantzas 0.0393 R s T a + 9.5 0.5 0.19 R s 0.6 φ 0.15 + 0.048 T a + 20 1 RH / 100 u 2 0.7 -Valiantzas2013a41
8. RET Allen   FAO 56 = 0.408 Δ R n G + γ u 2 e s e a 900 / T 2 + 273 Δ + γ 1 + 0.34 u 2 H/D/MAllen et al. (FAO56 PM)199823,177
9. RET Allen   ASCE = 0.408 Δ R n G + γ u 2 e s e a C n / T + 273 Δ + γ 1 + C d u 2 Hr/D/MAllen et al. (ASCEPM)20051202
Note: RET = Reference Evapotranspiration; D = Daily; M = Monthly; Hr = Hourly.

References

  1. Immerzeel, W.W.; Droogers, P. Calibration of a Distributed Hydrological Model Based on Satellite Evapotranspiration. J. Hydrol. 2008, 349, 411–424. [Google Scholar] [CrossRef]
  2. Mobilia, M.; Longobardi, A. Prediction of Potential and Actual Evapotranspiration Fluxes Using Six Meteorological Data-Based Approaches for a Range of Climate and Land Cover Types. ISPRS Int. J. Geo-Inf. 2021, 10, 192. [Google Scholar] [CrossRef]
  3. Lu, X.; Zang, C.; Burenina, T. Study on the Variation in Evapotranspiration in Different Period of the Genhe River Basin in China. Phys. Chem. Earth 2020, 120, 102902. [Google Scholar] [CrossRef]
  4. Singh, V.P.; Xu, C.-Y. Evaluation and Generalization of 13 Mass-Transfer Equations for Determining Free Water Evaporation. Hydrol. Process. 1997, 11, 311–323. [Google Scholar] [CrossRef]
  5. Allen, R.G.; Pereira, L.S.; Raes, D.; Smith, M. Crop Evapotranspiration: Guidelines for Computing Crop Water Require-Ments; Irrigation and Drainage Paper No. 56; FAO: Rome, Italy, 1998; Available online: http://www.climasouth.eu/sites/default/files/FAO%2056.pdf (accessed on 2 July 2022).
  6. Yates, D.; Strzepek, K. Potential Evapotranspiration Methods and Their Impact on the Assessment of River Basin Runoff under Climate Change, 1st ed.; IIASA: Laxenburg, Austria, 1994. [Google Scholar]
  7. Irmak, S.; Haman, D.Z. Evapotranspiration: Potential or Reference? Agric. Eng. Florida Coop. Ext. Serv. Inst. Food Agric. Sci. Univ. Fla. US ABE 2003, 343, 1–3. [Google Scholar] [CrossRef]
  8. Peng, L.; Li, Y.; Feng, H. The Best Alternative for Estimating Reference Crop Evapotranspiration in Different Sub-Regions of Mainland. Sci. Rep. 2017, 7, 54–58. [Google Scholar] [CrossRef]
  9. Tanner, C.B.; Pelton, W.L. Potential Evapotranspiration Estimates by the Approximate Energy Balance Method of Penman. J. Geophys. Res. 1960, 65, 3391–3413. [Google Scholar] [CrossRef]
  10. Xu, C.; Singh, V.P. Cross Comparison of Empirical Equations for Calculating Potential Evapotranspiration with Data from Switzerland. Water Resour. Manag. 2002, 16, 197–219. [Google Scholar] [CrossRef]
  11. Mardikis, M.G.; Kalivas, D.P.; Kollias, V.J. Comparison of Interpolation Methods for the Prediction of Reference Evapotranspiration—An Application in Greece. Water Resour. Manag. 2005, 19, 251–278. [Google Scholar] [CrossRef]
  12. Vicente-Serrano, S.M.; Beguería, S.; López-Moreno, J.I. A Multiscalar Drought Index Sensitive to Global Warming: The Standardized Precipitation Evapotranspiration Index. J. Clim. 2010, 23, 1696–1718. [Google Scholar] [CrossRef] [Green Version]
  13. Dinpashoh, Y.; Jhajharia, D.; Fakheri-fard, A.; Singh, V.P.; Kahya, E. Trends in Reference Crop Evapotranspiration over Iran. J. Hydrol. 2011, 399, 422–433. [Google Scholar] [CrossRef]
  14. Hargreaves, G.H.; Samani, Z. Estimating Potential Evapotranspiration. J. Irrig. Drain. Eng. Div. 1982, 108, 225–230. [Google Scholar] [CrossRef]
  15. Thornthwaite, C.W. An Approach toward a Rational Classification of Climate. Geogr. Rev. 1948, 38, 55–94. [Google Scholar] [CrossRef]
  16. Penman, H.L. Natural Evaporation from Open Water, Hare Soil and Grass. Proc. R. Soc. Lond. 1948, 193, 120–145. [Google Scholar] [CrossRef]
  17. Parajuli, K.; Jones, S.B.; Tarboton, D.G.; Flerchinger, G.N.; Hipps, L.E.; Allen, L.N.; Seyfried, M.S. Agricultural and Forest Meteorology Estimating Actual Evapotranspiration from Stony-Soils in Montane Ecosystems. Agric. For. Meteorol. 2019, 265, 183–194. [Google Scholar] [CrossRef]
  18. Zhang, Y.; Li, G.; Ge, J.; Li, Y.; Yu, Z.; Niu, H. Sc _ PDSI Is More Sensitive to Precipitation than to Reference Evapotranspiration in China during the Time Period 1951–2015. Ecol. Indic. 2019, 96, 448–457. [Google Scholar] [CrossRef]
  19. Yao, N.; Li, Y.; Xu, F.; Liu, J.; Chen, S.; Ma, H.; Wai, H.; Liu, D.L.; Li, M.; Feng, H.; et al. Permanent Wilting Point Plays an Important Role in Simulating Winter Wheat Growth under Water Deficit Conditions. Agric. Water Manag. 2020, 229, 105954. [Google Scholar] [CrossRef]
  20. Feng, P.; Liu, D.L.; Wang, B.; Waters, C.; Zhang, M.; Yu, Q. Projected Changes in Drought across the Wheat Belt of Southeastern Australia Using a Downscaled Climate Ensemble. Int. J. Clim. 2019, 39, 1041–1053. [Google Scholar] [CrossRef]
  21. Bausch, W.C.; Neale, C.M. Crop Coefficients Derived from Reflected Canopy Radiation: A Concept. Trans. Asae 1987, 30, 703–709. [Google Scholar] [CrossRef]
  22. Gong, X.; Liu, H.; Sun, J.; Gao, Y.; Zhang, H. Comparison of Shuttleworth-Wallace Model and Dual Crop Coe Ffi Cient Method for Estimating Evapotranspiration of Tomato Cultivated in a Solar Greenhouse. Agric. Water Manag. 2019, 217, 141–153. [Google Scholar] [CrossRef]
  23. Huo, Z.; Dai, X.; Feng, S.; Kang, S.; Huang, G. Effect of Climate Change on Reference Evapotranspiration and Aridity Index in Arid Region of China. J. Hydrol. 2013, 492, 24–34. [Google Scholar] [CrossRef]
  24. Zarch, M.A.; Sivakumar, B.; Sharma, A. Assessment of Global Aridity Change. J. Hydrol. 2015, 520, 300–313. [Google Scholar] [CrossRef]
  25. Haile, B.T.; Bekitie, K.T.; Zeleke, T.T.; Ayal, D.Y.; Feyisa, G.L.; Anose, F.A. Drought Analysis Using Standardized Evapotranspiration and Aridity Index at Bilate Watershed: Sub-Basins of Ethiopian Rift Valley. Sci. World J. 2022, 2022, 1181198. [Google Scholar] [CrossRef] [PubMed]
  26. Derdous, O.; Tachi, S.E.; Bouguerra, H. Spatial Distribution and Evaluation of Aridity Indices in Northern Algeria. Arid L. Res. Manag. 2020, 35, 1–14. [Google Scholar] [CrossRef]
  27. Derdous, O.; Bouguerra, H.; Tachi, S.E.; Bouamrane, A. A Monitoring of the Spatial and Temporal Evolutions of Aridity in Northern Algeria. Theor. Appl. Climatol. 2020, 142, 1191–1198. [Google Scholar] [CrossRef]
  28. Jahangir, M.H.; Danehkar, S. A Comparative Drought Assessment in Gilan, Iran Using Pálfai Drought Index, de Martonne Aridity Index, and Pinna Combinative Index. Arab. J. Geosci. 2022, 15, 90. [Google Scholar] [CrossRef]
  29. Kimura, R.; Moriyama, M. Use of A MODIS Satellite-Based Aridity Index to Monitor Drought Conditions in Mon-Golia from 2001 to 2013. Remote Sens. 2021, 13, 2561. [Google Scholar] [CrossRef]
  30. Penman, H.L. Evaporation: An Introductory Survey. Neth. J. Agric. Sci. 1956, 4, 9–29. [Google Scholar] [CrossRef]
  31. Penman, H.L. Vegetation and Hydrology. Soil Sci. 1963, 96, 357. [Google Scholar] [CrossRef]
  32. Anon, J. Proceeding of the Informal Meeting on Physics in Agriculture. Neth. J. Agric. Sci. 1956, 4, 162. [Google Scholar] [CrossRef]
  33. Choudhury, B.J. Global Pattern of Potential Evaporation Calculated from the PenmanMonteith Equation Using Satellite and Assimilated Data. Remote Sens. Environ. 1997, 61, 64–81. [Google Scholar] [CrossRef]
  34. Vörösmarty, C.J.; Federer, C.A.; Schloss, A.L. Potential Evaporation Functions Compared on US Watersheds: Possible Implications for Global-Scale Water Balance and Terrestrial Ecosystem Modeling. J. Hydrol. 1998, 207, 147–169. [Google Scholar] [CrossRef]
  35. Donohue, R.J.; Mcvicar, T.R.; Roderick, M.L. Assessing the Ability of Potential Evaporation Formulations to Capture the Dynamics in Evaporative Demand within a Changing Climate. J. Hydrol. 2010, 386, 186–197. [Google Scholar] [CrossRef]
  36. Jensen, M.E.; Haise, H.R. Estimating Evapotranspiration from Solar Radiation. Proc. Am. Soc. Civ. Eng. J. Irrig. Drain. Eng. Div. 1963, 89, 15–41. [Google Scholar] [CrossRef]
  37. Jensen, M.E. Water Consumption By Agricultural Plants. In Water Deficits Plant Growth; Kozlowski, T.T., Ed.; Academic Press: New York, NY, USA; London, UK, 1968; pp. 1–22. [Google Scholar]
  38. Van Wijk, W.R.; De Vries, D.A. Evapotranspiration. Neth. J. Agric. Sci. 1954, 2, 105–119. [Google Scholar]
  39. Dingman, S.L. Physical Hydrology, 1st ed.; Prentice Hall: Hoboken, NJ, USA, 1992. [Google Scholar]
  40. Jensen, M.E.; Wright, J.L.; Pratt, B.J. Estimating Soil Moisture Depletion from Climate, Crop and Soil Data. Trans. Asae 1971, 14, 954–959. [Google Scholar] [CrossRef]
  41. Wright, J.L.; Jensen, M.E. Peak Water Requirements of Crops in Southern Idaho. Proc. Am. Soc. Civ. Eng. J. Irrig. Drain. Div. 1972, 98, 193–201. [Google Scholar] [CrossRef]
  42. Jensen, M.E. Consumptive Use of Water and Irrigation Water Requirements; American Society of Civil Engineers: New York, NY, USA, 1973. [Google Scholar]
  43. Doorenbos, J.; Pruitt, W. Guidelines for Predicting Crop Water Requirements. FAO Irrig. Drain. Pap. 1977, 67, 454–460. [Google Scholar]
  44. Marsh, A.W.; Strohman, R.A.; Spaulding, S.; Youngner, V.; Gibeault, V. Turfgrass Irrigation Research at the University of California: Warm & Cool Season Grasses Tested for Water Needs. Landsc. Ind. 1980, 25, 36–38. [Google Scholar]
  45. Biran, I.; Bravdo, B.; Bushkin-Harav, I.; Rawitz, E. Water Consumption and Growth Rate of 11 Turfgrasses as Affected by Mowing Height, Irrigation Frequency, and Soil Moisture. Agron. J. 1981, 73, 85–90. [Google Scholar] [CrossRef]
  46. Frank, A.B. Effect of Leaf Age and Position on Photosynthesis and Stomatal Conductance of Forage Grasses. Agron. J. 1981, 73, 70–74. [Google Scholar] [CrossRef]
  47. Beard, J. An Assessment of Water Use by Turfgrasses, Turfgrass Water Conservation, Univ. of California. Div. Agric. Nat. Resour. Publ. 1985, 21, 45–60. [Google Scholar]
  48. Snyder, R.L.; Lanini, B.J.; Shaw, D.A.; Priott, W.O. Using Reference Evapotranspiration (ETo) and Crop Coefficients to Estimate Crop Evapotranspiration (ETc) for Agronomic Crops, Grasses, and Vegetable Crops. Leafl. Calif. Coop. Ext. Serv. 1987, 21427, 12–27. [Google Scholar]
  49. Allen, R.G.; Jensen, M.E.; Wright, J.L.; Burman, R.D. Operational Estimates of Reference Evapotranspiration. Agron. J. 1989, 81, 650–662. [Google Scholar] [CrossRef]
  50. Allen, R.G.; Smith, M.; Pereira, L.S.; Perrier, A. An Update for the Calculation of Reference Evapotranspiration. ICID Bull. 1994, 43, 35–92. [Google Scholar] [CrossRef]
  51. Van Bavel, C.H.M.; Fritschen, L.J.; Reeves, W.E. Transpiration by Sudangrass as an Externally Controlled Process. Science 1963, 141, 269–270. [Google Scholar] [CrossRef]
  52. Meyer, W.S.; Dugas, W.A.; Barrs, H.D.; Smith, R.C.G.; Fleetwood, R.J. Effects of Soil Type on Soybean Crop Water Use in Weighing Lysimeters. Irrig. Sci. 1990, 11, 69–75. [Google Scholar] [CrossRef]
  53. Allen, R.G.; Pruitt, W.O. FAO-24 Reference Evapotranspiration Factors. J. Irrig. Drain. Eng. 1991, 117, 758–773. [Google Scholar] [CrossRef]
  54. Pruitt, W.O. Development of Crop Coefficients Using Lysimeters. In Grouting in Geotechnical Engineering; ASCE: Reston, VA, USA, 1991; pp. 182–190. [Google Scholar]
  55. Walter, I.A.; Allen, R.G.; Elliot, R.; Jensen, M.E.; Itenfisu, D.; Mecham, B.; Howell, T.A.; Snyder, R.; Brown, P.; Echings, S. ASCE’s Standarized Reference Evapotranspiration Equation. In Watershed Management and Operation Management 2000, Proceedings of the Watershed Management and Operations Management Conferences 2000, Fort Collins, CO, USA, 20–24 June 2000; ASCE: Reston, VA, USA, 2000. [Google Scholar]
  56. Jensen, M.E.; Burman, R.D.; Allen, R.G. Evapotranspiration and Irrigation Water Requirements. ASCE Man. Rep. Eng. Pract. 1990, 70, 70. [Google Scholar]
  57. Xu, C.; Singh, V.P. Evaluation and Generalization of Temperature-based Methods for Calculating Evaporation. Hydrol. Process. 2001, 15, 305–319. [Google Scholar] [CrossRef]
  58. McCloud, D.E. Water Requirements of Field Crops in Florida as Influenced by Climate. Proc. Soil Sci. Soc. Fla 1955, 15, 165–172. [Google Scholar]
  59. Hamon, W.R. Estimating Potential Evapotranspiration. J. Hydraul. Div. 1960, 87, 107–120. [Google Scholar] [CrossRef]
  60. Romanenko, V.A. Computation of the Autumn Soil Moisture Using a Universal Relationship for a Large Area. Proc. Ukr. Hydrometeorol. Res. Inst. 1961, 3, 12–25. [Google Scholar]
  61. Baier, W.; Robertson, G.W. Estimation of Latent Evaporation from Simple Weather Observations. Can. J. Plant Sci. 1965, 45, 276–284. [Google Scholar] [CrossRef]
  62. Schendel, U. Vegetationswasserverbrauch Und-Wasserbedarf. Habilit. Kiel 1967, 137, 1–11. [Google Scholar]
  63. Szász, G. A Potenciális Párolgás Meghatározásának Új Módszere. Hidrológiai Közlöny 1973, 10, 435–442. [Google Scholar]
  64. Blaney, H.F. Determining Water Requirements in Irrigated Areas from Climatological and Irrigation Data; Technical Paper No. 96; US Department of Agriculture, Soil Conservation Service: Washington, DC, USA, 1952; 48p. [Google Scholar]
  65. Kharrufa, N.S. Simplified Equation for Evapotranspiration in Arid Regions. Beiträge zur Hydrol. 1985, 5, 39–47. [Google Scholar]
  66. Zhang, Y. Estimation of Potential Evapotranspiration by Different Methods in Handan Eastern Plain, China. Am. J. Water Sci. Eng. 2018, 4, 117–123. [Google Scholar] [CrossRef]
  67. Süheri, S.; Amarkai, P.A.; Yavuz, D. A Comparative Study of Crop Evapotranspiration Estimation by Three Methods with Measured Crop Evapotranspiration in Konya Plain. Selcuk J. Agric. Food Sci. 2019, 33, 1–6. [Google Scholar] [CrossRef]
  68. Hargreaves, G.L.; Hargreaves, G.H.; Riley, J.P. Irrigation Water Requirements for Senegal River Basin. J. Irrig. Drain. Eng. 1985, 111, 265–275. [Google Scholar] [CrossRef]
  69. Ritchie, J.T. Model for Predicting Evaporation from a Row Crop with Incomplete Cover. Water Resour. Res. 1972, 8, 1204–1213. [Google Scholar] [CrossRef] [Green Version]
  70. Monteith, J.L. Evaporation and Environment. Symp. Soc. Exp. Biol. 1965, 19, 205–234. [Google Scholar] [PubMed]
  71. Raza, A.; Shoaib, M.; Faiz, M.A.; Baig, F.; Khan, M.M.; Ullah, M.K.; Zubair, M. Comparative Assessment of Reference Evapotranspiration Estimation Using Conventional Method and Machine Learning Algorithms in Four Climatic Regions. Pure Appl. Geophys. 2020, 177, 4479–4508. [Google Scholar] [CrossRef]
  72. Raza, A.; Shoaib, M.; Baig, M.A.I.; Ahmad, S.; Khan, M.M.; Ullah, M.K.; Hashim, S. Comparative Study of Powerful Predictive Modeling Techniques for Modeling Monthly Reference Evapotranspiration in Various Climatic Regions. Fresenius Environ. Bull. 2021, 30, 7490–7513. [Google Scholar]
  73. Trajkovic, S.; Kolakovic, S. Evaluation of Reference Evapotranspiration Equations under Humid Conditions. Water Resour. Manag. 2009, 23, 3057–3067. [Google Scholar] [CrossRef]
  74. Hargreaves, G.H.; Samani, Z.A. Reference Crop Evapotranspiration from Temperature. Appl. Eng. Agric. 1985, 1, 96–99. [Google Scholar] [CrossRef]
  75. Winter, T.C.; Rosenberry, D.O.; Sturrock, A.M. Evaluation of 11 Equations for Determining Evaporation for a Small Lake in the North Central United States. Water Resour. Res. 1995, 31, 983–993. [Google Scholar] [CrossRef]
  76. Xing, Z.; Chow, L.; Meng, F.; Rees, H.W.; Monteith, J.; Lionel, S. Testing Reference Evapotranspiration Estimation Methods Using Evaporation Pan and Modeling in Maritime Region of Canada. J. Irrig. Drain. Eng. 2008, 134, 417–424. [Google Scholar] [CrossRef]
  77. Tabari, H. Evaluation of Reference Crop Evapotranspiration Equations in Various Climates. Water Resour. Manag. 2010, 24, 2311–2337. [Google Scholar] [CrossRef]
  78. Poyen, E.F.B.; Ghosh, A.K.; PalashKundu, P. Review on Different Evapotranspiration Empirical Equations. Int. J. Adv. Eng. Manag. Sci. 2016, 2, 239382. [Google Scholar]
  79. Cao, Q.; Gao, M.; Xiao, M.; Lettenmaier, D.P.; Chen, F. Comparison of Noah-MP and VIC Long-Term Drought Predictions over the Western US. AGU Fall Meet. Abstr. 2018, 2018, H41P-H2335. [Google Scholar]
  80. Chen, S.; Xie, Z. The Application of Variable Infiltration Capacity (VIC) Macroscale Hydrologic Model in Arid and Semi-Arid Regions in Northwest China. In Proceedings of the AGU Fall Meeting Abstracts, Washington, DC, USA, 10–14 December 2018; Volume 21, p. GC33F-1422. [Google Scholar]
  81. Mizukami, N.; Newman, A.J.; Hamman, J.; Wood, A.W.; Gutmann, E.D.; Gergel, D.R.; Clark, M.P.; Nijssen, B.; Arnold, J.R. High-Resolution Statistically Downscaled Climate and Hydrology Projections over Alaska. In Proceedings of the AGU Fall Meeting Abstracts, Washington, DC, USA, 10–14 December 2018; Volume 2018, p. H13U-2056. [Google Scholar]
  82. Asyhari, A.; Suardiwerianto, Y.; Balamurugan, M.; Marpaung, S.M.; Tanjungsari, R.J.; Hidayat, M.F.; Harahap, M.I.F.; Ghimire, C.P. Assessing the Impacts of Plantation Forestry on Tropical Peatland Hydrology Using the Coupled MIKE SHE and MIKE Hydro River Modelling System. In Proceedings of the AGU Fall Meeting Abstracts, Washington, DC, USA, 10–14 December 2018; Volume 21, p. 2017. [Google Scholar]
  83. Torres, M.A.; Nikolskii, I.; Martínez-Miranda, M.E.; Martínez, M.R. Hydrological Assessment of the Teapa River Basin, Using the Mike She Model. Tecnol. Y Ciencias Del Agua 2018, 9, 130–146. [Google Scholar] [CrossRef]
  84. Waseem, M.; Kachholz, F.; Traenckner, J. Suitability of Common Models to Estimate Hydrology and Diffuse Water Pollution in North-Eastern German Lowland Catchments with Intensive Agricultural Land Use. Front. Agric. Sci. Eng. 2018, 5, 420–431. [Google Scholar] [CrossRef]
  85. Ding, R.; Tong, L.; Li, F.; Zhang, Y.; Hao, X.; Kang, S. Variations of Crop Coef Fi Cient and Its in Fl Uencing Factors in an Arid Advective Cropland of Northwest China. Hydrol. Process 2015, 29, 239–249. [Google Scholar] [CrossRef]
  86. Marin, F.R.; Angelocci, L.R.; Nassif, D.S.P.; Costa, L.G.; Vianna, M.S.; Carvalho, K.S. Crop Coefficient Changes with Reference Evapotranspiration for Highly Canopy-Atmosphere Coupled Crops. Agric. Water Manag. 2016, 163, 139–145. [Google Scholar] [CrossRef]
  87. Wang, J.; Zhang, Y.; Gong, S.; Xu, D.; Juan, S.; Zhao, Y. Evapotranspiration, Crop Coefficient and Yield for Drip-Irrigated Winter Wheat with Straw Mulching in North China Plain. Field Crops Res. 2018, 217, 218–228. [Google Scholar] [CrossRef]
  88. Shuttleworth, W.J.; Wallace, J.S. Evaporation from Sparse Crops-an Energy Combination Theory. Q. J. R. Meteorol. Soc. 1985, 111, 839–855. [Google Scholar] [CrossRef]
Figure 1. PRISMA flow diagram for the current study.
Hydrology 09 00153 g001
Figure 2. Citations of PET temperature-based equations.
Hydrology 09 00153 g002
Figure 3. Citations of RET temperature-based equations.
Hydrology 09 00153 g003
Figure 4. Citations of PET radiation-based equations.
Hydrology 09 00153 g004
Figure 5. Citations of RET radiation-based equations.
Hydrology 09 00153 g005
Figure 6. Citations of PET combination-based equations.
Hydrology 09 00153 g006
Figure 7. Citations for RET combination-based equations.
Hydrology 09 00153 g007
Publisher’s Note: MDPI stays neutral with regard to jurisdictional claims in published maps and institutional affiliations.

