Article

A Holistic Approach to Study Groundwater-Surface Water Modifications Induced by Strong Earthquakes: The Case of Campiano Catchment (Central Italy)

1
Scuola di Scienze e Tecnologie, Sezione di Geologia, Università di Camerino, Via Gentile III da Varano, 62032 Camerino, Italy
2
Dipartimento di Scienze e Ingegneria della Materia, dell’Ambiente ed Urbanistica (SIMAU), Università Politecnica delle Marche, Via Brecce Bianche 12, 60131 Ancona, Italy
3
Dipartimento di Fisica e Geologia, Università degli Studi di Perugia, Via Pascoli snc, 06123 Perugia, Italy
4
Istituto Nazionale di Geofisica e Vulcanologia, Sezione di Bologna, Via D. Creti 12, 40128 Bologna, Italy
5
Istituto Nazionale di Geofisica e Vulcanologia, Sezione di Napoli, Osservatorio Vesuviano (INGV-OV), Via Diocleziano 328, 80124 Naples, Italy
*
Author to whom correspondence should be addressed.
Hydrology 2022, 9(6), 97; https://doi.org/10.3390/hydrology9060097
Submission received: 30 April 2022 / Revised: 27 May 2022 / Accepted: 29 May 2022 / Published: 31 May 2022
(This article belongs to the Special Issue Hydro-Geology of Karst Areas)

Abstract

:
Carbonate aquifers are characterised by strong heterogeneities and their modelling is often a challenging aspect in hydrological studies. Understanding carbonate aquifers can be more complicated in the case of strong seismic events which have been widely demonstrated to influence groundwater flow over wide areas or on a local scale. The 2016–2017 seismic sequence of Central Italy is a paradigmatic example of how earthquakes play an important role in groundwater and surface water modifications. The Campiano catchment, which experienced significant discharge modifications immediately after the mainshocks of the 2016–2017 seismic sequence (Mmax = 6.5) has been analysed in this study. The study area is within an Italian national park (Sibillini Mts.) and thus has importance from a naturalistic and socio-economic standpoint. The research strategy coupled long-period artificial tracer tests (conducted both before and after the main earthquakes), geochemical and discharge analyses and isotope hydrology with hydrogeological cross-sections. This study highlights how the seismic sequence temporarily changed the behaviour of the normal faults which act predominantly as barriers to flow in the inter-seismic period, with water flow being normally favoured along the fault strikes. On the contrary, during earthquakes, groundwater flow can be significantly diverted perpendicularly to fault-strikes due to co-seismic fracturing and a consequent permeability increase. The interaction between groundwater and surface water is not only important from the point of view of scientific research but also has significant implications at an economic and social level.

1. Introduction

In the scientific literature, earthquakes are known to produce hydrological changes that are most evident in the near field but also occur in the intermediate and far field [1,2,3]. In this context, water level changes in wells, springs and streams’ discharge modifications were documented in both the co-seismic and post-seismic periods [4]. Elkhoury et al. (2006) [5] demonstrated that relatively small dynamic stresses can double rock permeability, thus making it a very dynamic parameter that should not be considered fixed over time. With regards to the secondary permeability, geological structures such as faults play an important role on fluid flow, both in pre-seismic and post-seismic periods. As reported by Bense et al. 2013 [6], deformation processes accommodating strain in a fault zone can enhance or reduce permeability and, in this regard, lithology is one of the main factors to consider. Generally, the complex permeability structure of the fault zones that are observed at the outcrop scale suggests an enhancement of water flow along fault strike and a flow inhibition across fault strike [6,7]. However, during earthquakes such behaviour often changes completely. In this framework, structural geology and hydrogeology should join forces and knowledge to assess how faults influence groundwater circulation, depending on the change of their state in different phases of the seismic cycle [6]. For instance, stream excess-flow and discharge increases were also detected in response to earthquakes that were induced by thrust faults [8,9] (which are in general considered as barriers to flow), in addition to normal and strike slip faults [10,11,12].
This study is focused on the effects of the 2016–2017 seismic sequence in the groundwater–surface water interaction of the water basin of the Campiano stream (Umbria Region, Central Italy). In this area, the surface water regime is closely connected with the hydrogeological setting [13,14,15]; the groundwater feeds streams, causing an increase in stream discharge along their course (linear springs) [13]. The socio-economic and environmental context of the area is strongly linked to its relationship with water (hydropower plants, fish farming), making its natural environment a groundwater-dependent ecosystem (GDE) [16]. In fact, changes in the hydrogeological structure due to strong earthquakes can lead to modifications of the hydrogeological framework with high economic, social and landscape repercussions [17]. For this reason, the main aim of this work is to identify the mechanisms of the hydrogeological modifications that are associated with the 2016–2017 earthquakes by using a holistic approach that involves the use of standard techniques, such as the stream hydrograph and recession curves analysis [12]; the use of long-period artificial tracer tests (conducted both before and after the main earthquakes); and the use of geochemical investigations. The results obtained from these techniques were compared with the oxygen-18 isotopic value of the groundwater emerging along the stream to validate the springs’ elevation recharge area. By comparing the above data with a set of hydro-geological sections, it was possible to infer the role of the main normal fault system outcropping in the area and its influence on groundwater circulation in a typical carbonate (fissured and karstic) environment.

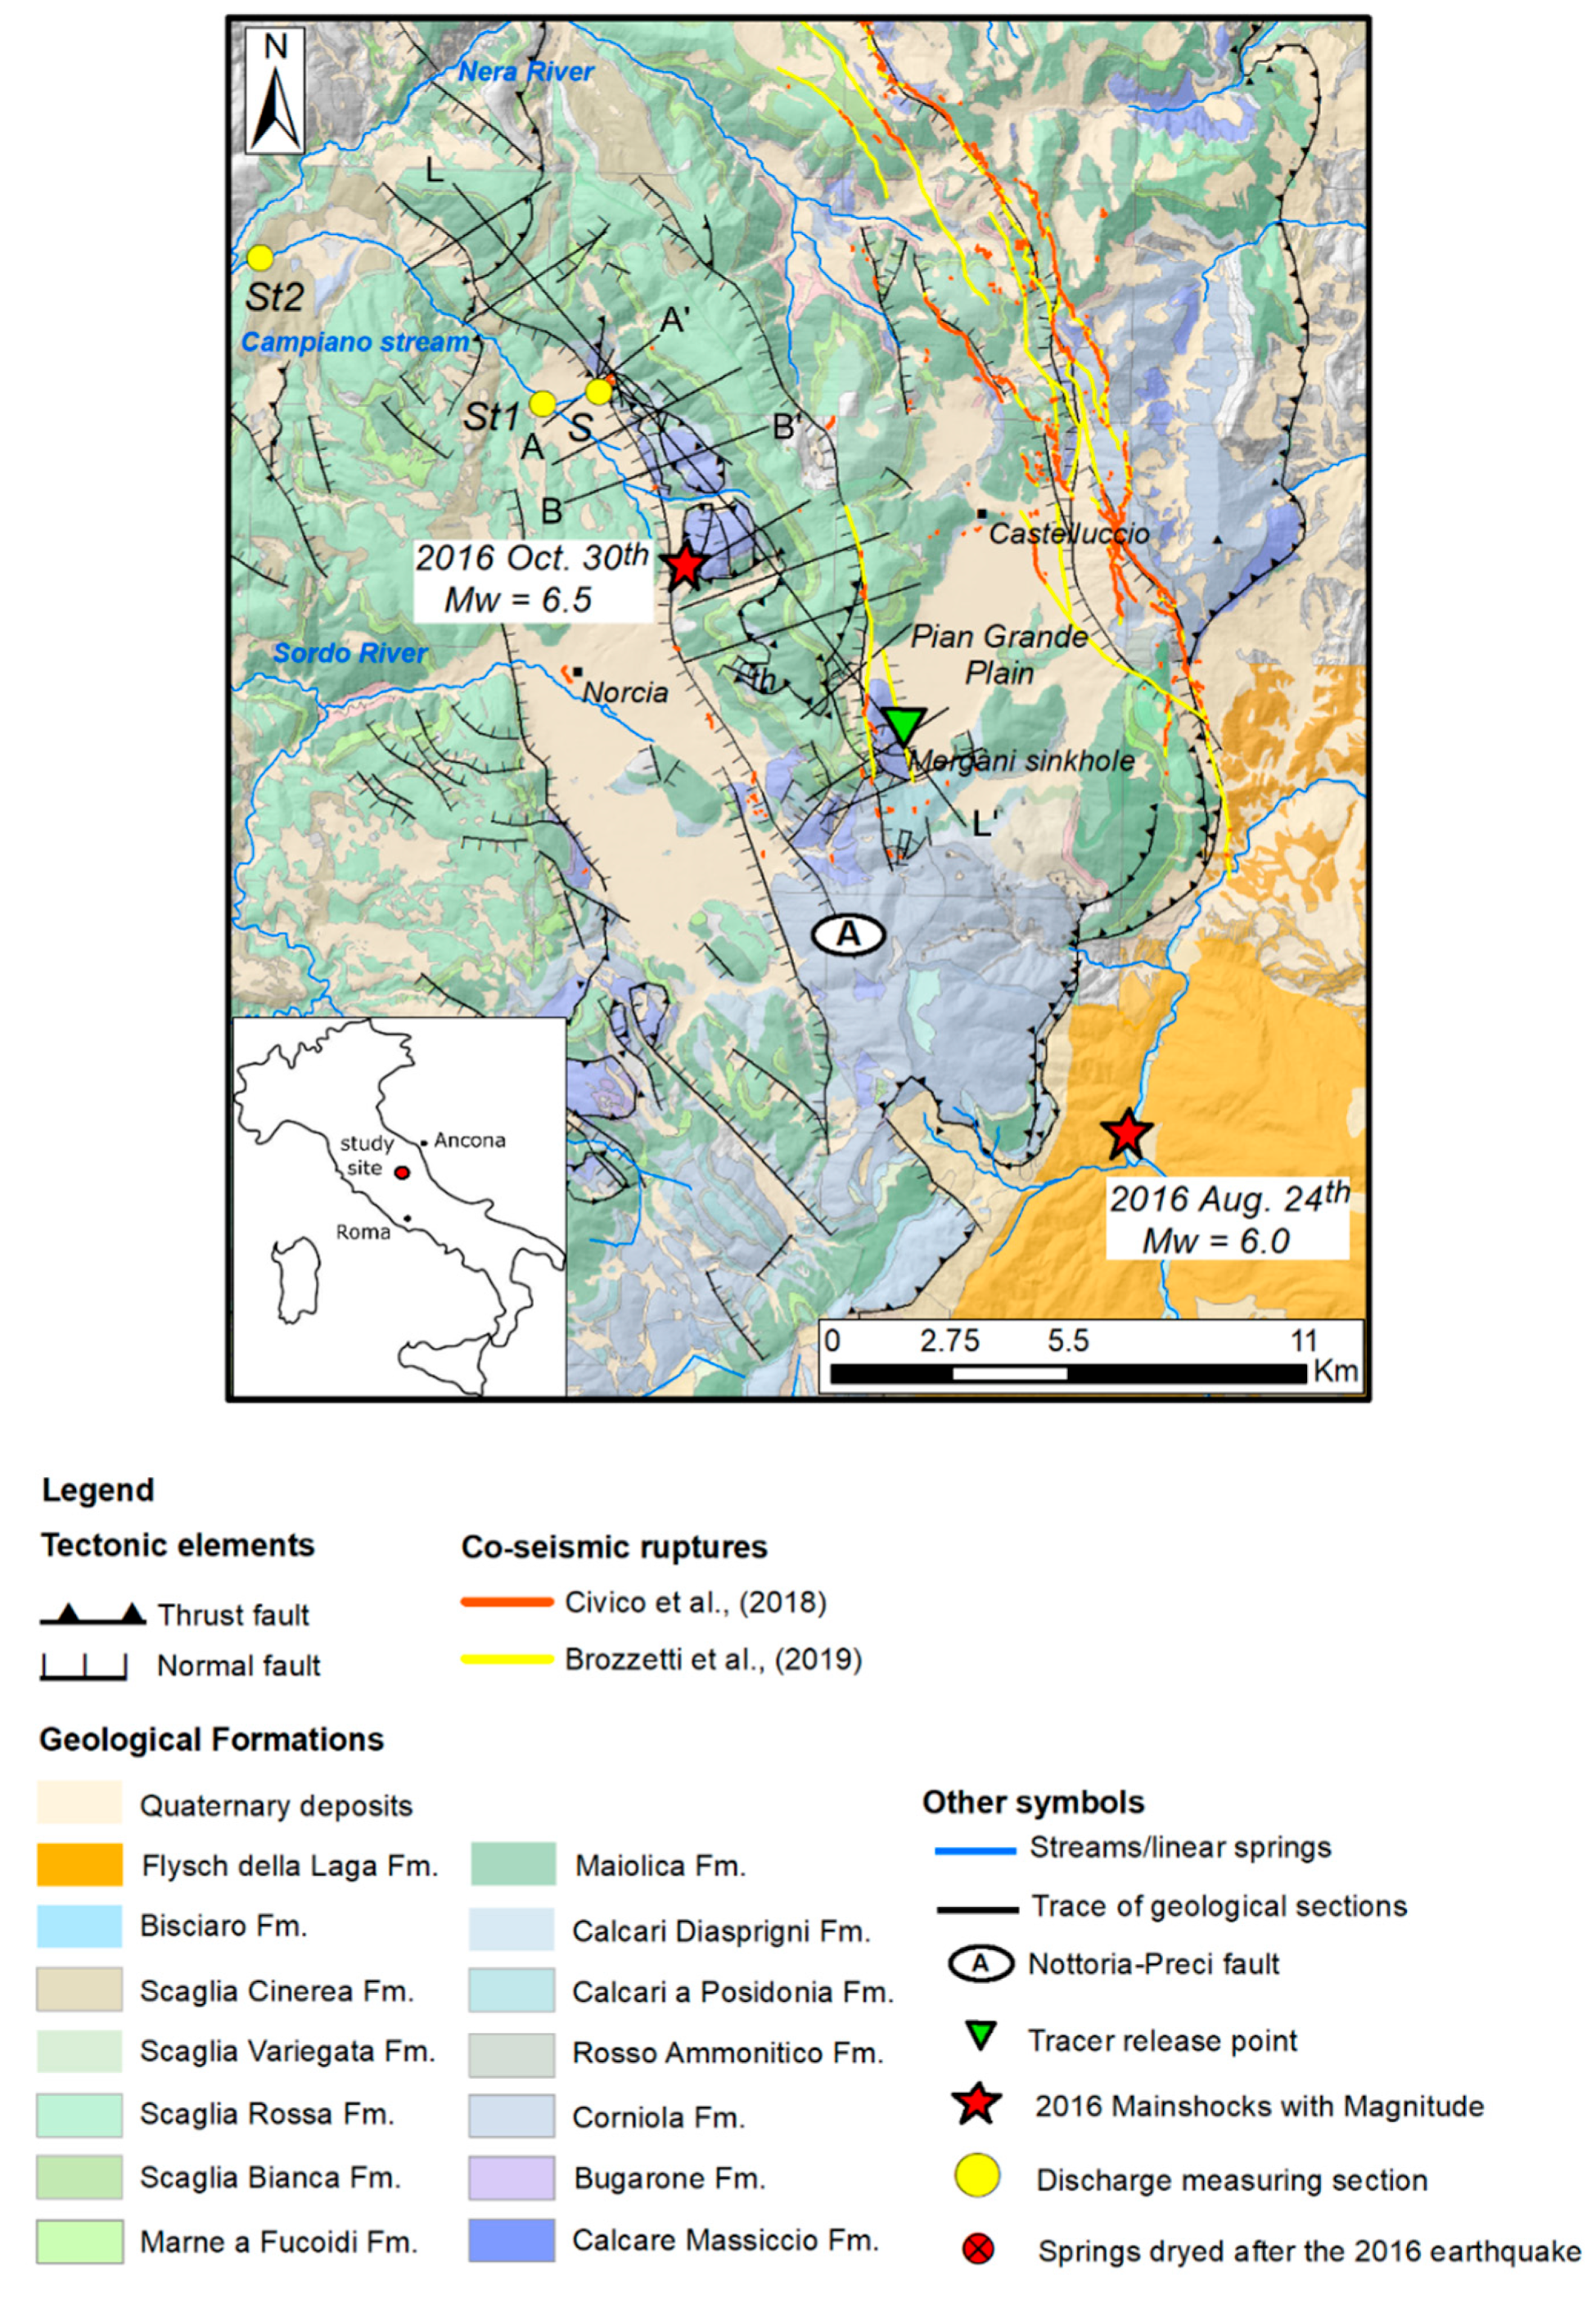
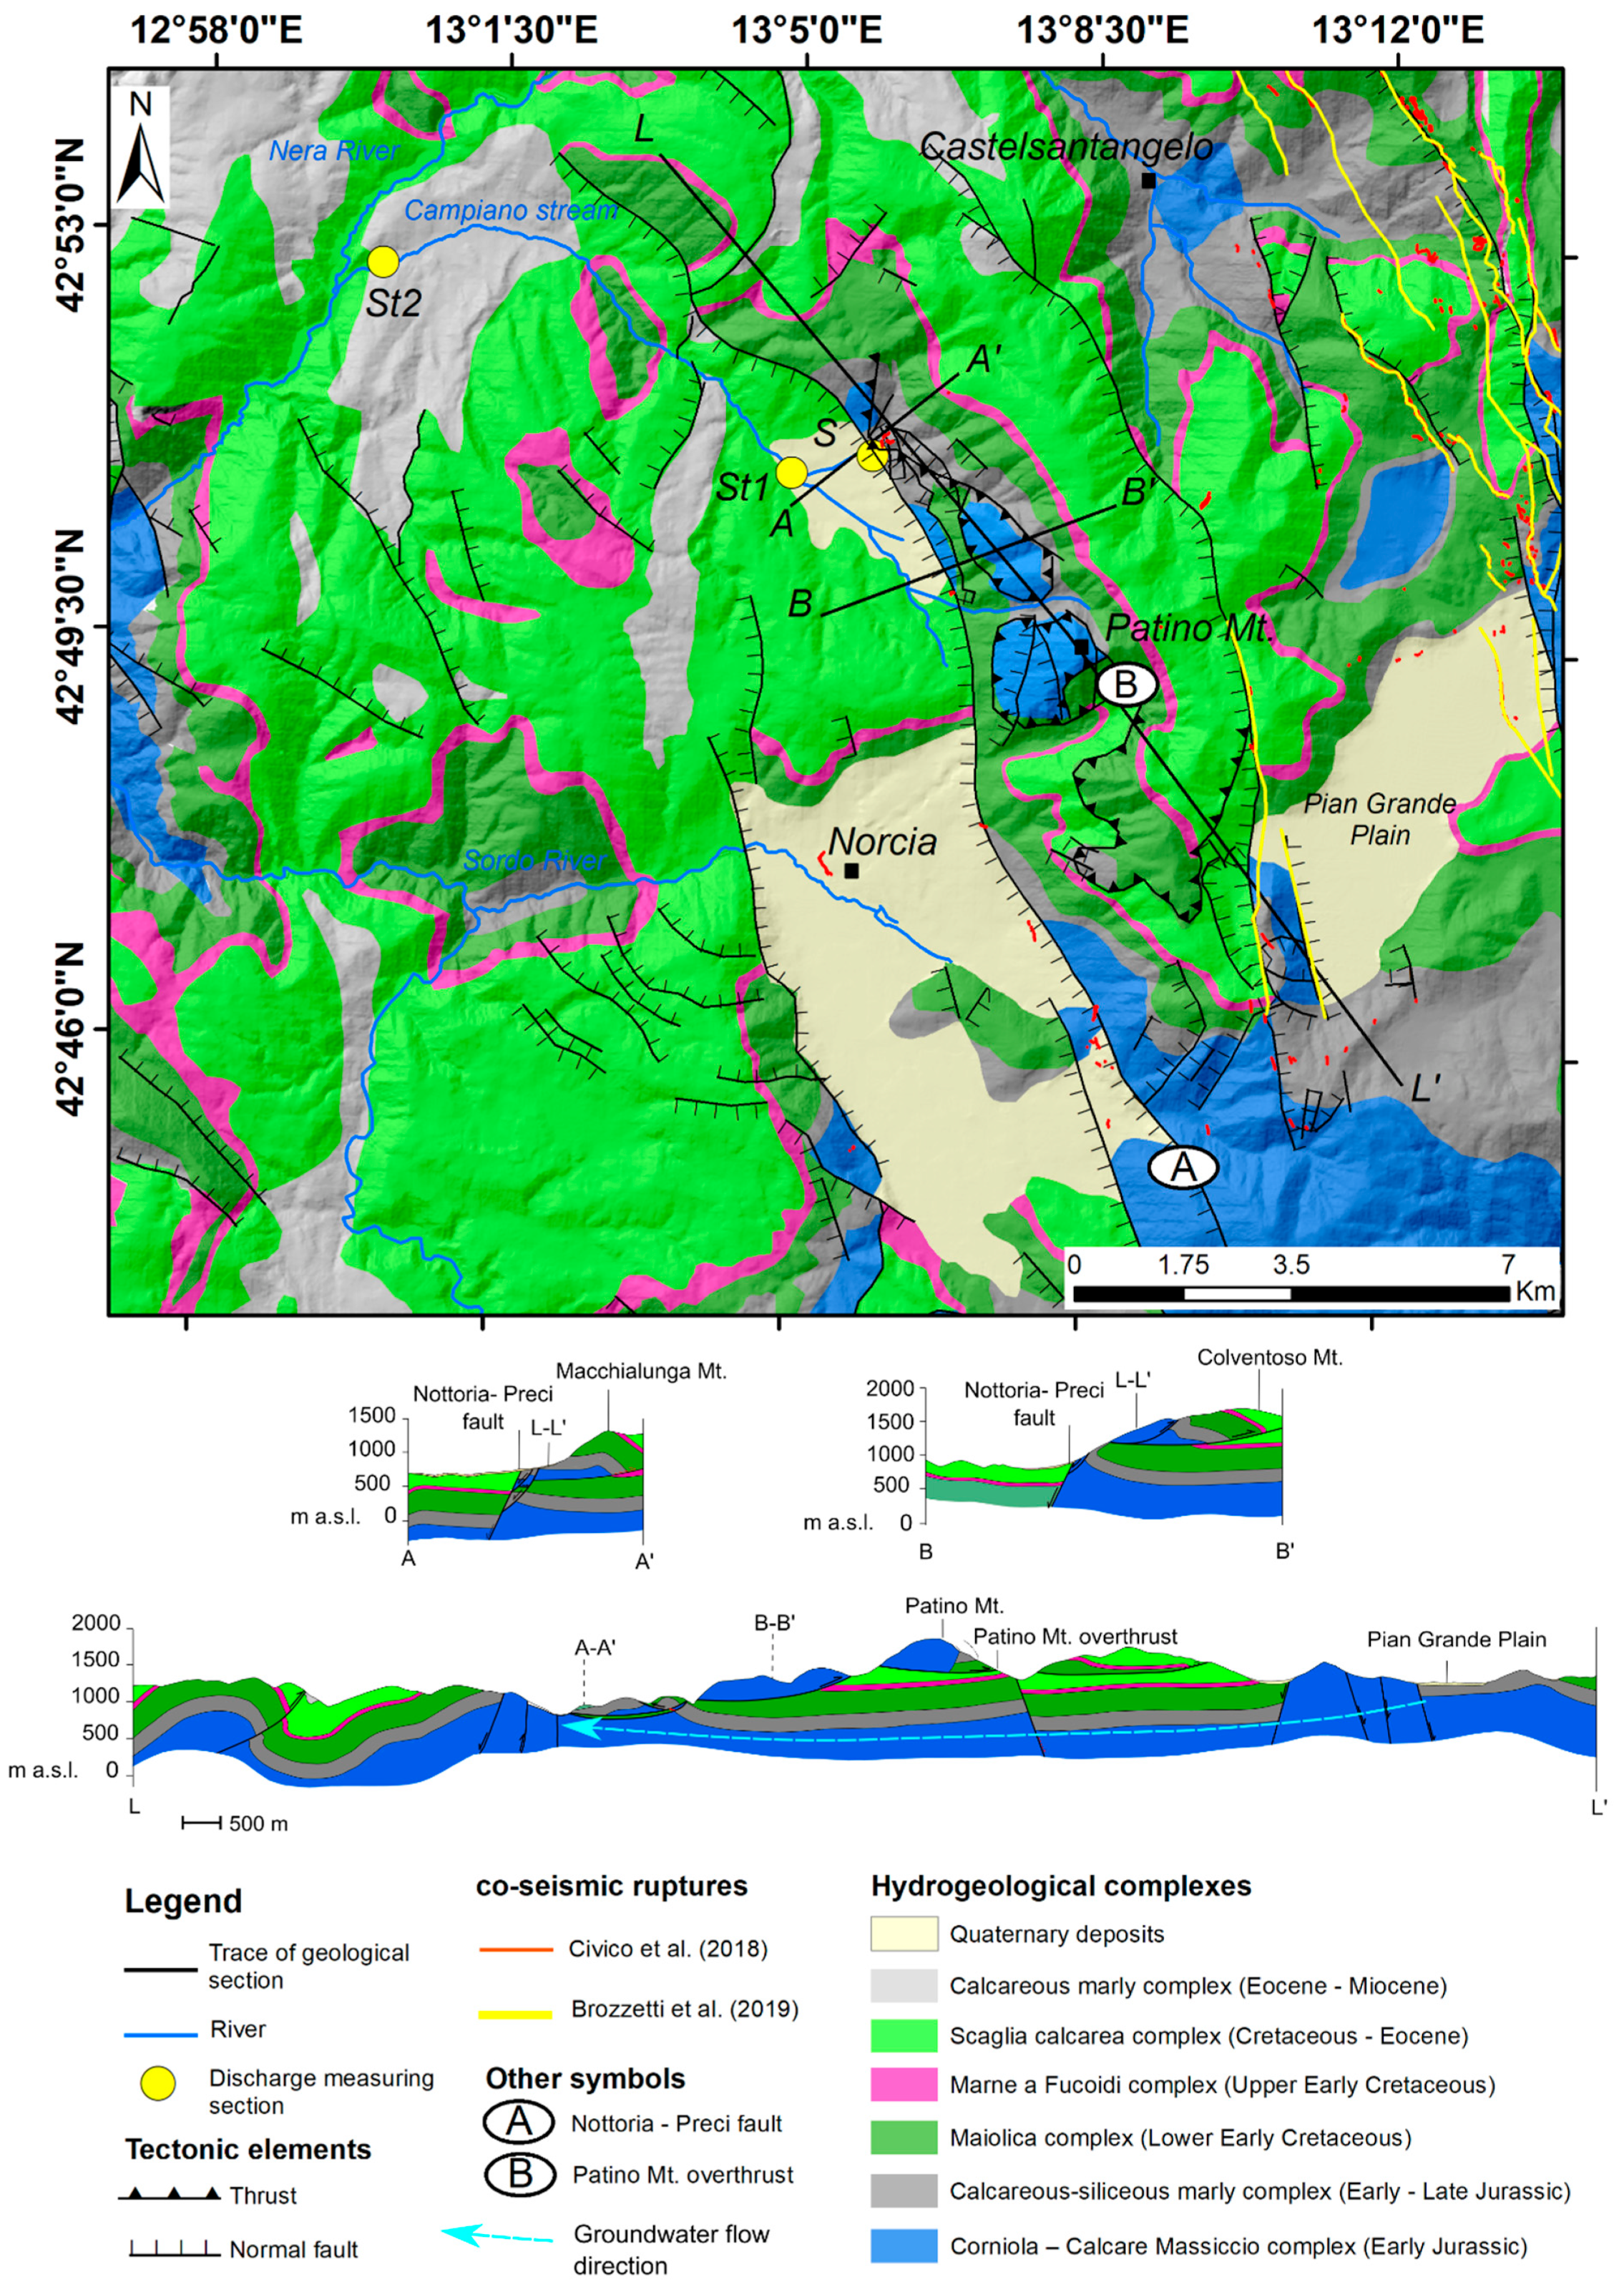
2. Geo-Structural Setting of the Area

The study area is part of the Sibillini Mts. chain representing the south-eastern portion of the Umbria-Marche Apennines, Central Italy. The Umbria-Marche Apennines are a thrust belt made of asymmetrical East-verging folds and thrusts that were formed during the middle-upper Miocene contractional tectonics, resulting from the convergence between the continental margins of Corsica-Sardinia and the Adria micro-plate [18]. The Umbria-Marche Stratigraphic Succession is made up of a thick sedimentary cover that is superimposed on a Paleozoic crystalline basement overlayed by continental and siliciclastic strata (Permo-Triassic). The sedimentary cover is constituted by Triassic evaporites (Anidriti di Burano Fm.), followed by the dominantly carbonate Umbria-Marche Stratigraphic succession (Jurassic-Oligocene), about 1500 m thick, starting from the Calcare Massiccio Fm. at the bottom up to the Scaglia Cinerea Fm. at the top. The Anidriti di Burano Fm. never crops out in the study area. The compressional tectonic phase was followed by an extensional one that began in the Early Pleistocene (currently still active), and gave origin to the depressions of Norcia, Cascia and Castelluccio (Pian Grande Plain) [12,19,20,21]. The Vettore Mt.–Bove Mt. and the Nottoria–Preci normal fault systems, each producing dislocations up to 1000 m [22,23,24,25,26], represent the main fault systems of the area with lengths > 30 km (Figure 1). The described extensional tectonic elements assumed a decisive role in the hydro-structural arrangement of the area, in the delimitation of large regional aquifers and in the identification of the main groundwater flow directions [12,21]. In Figure 1, the surface co-seismic ruptures [27,28,29] related to the main shocks of the 2016 earthquakes (Mw = 6.0 Amatrice and Mw = 6.5 Norcia), mapped along the above-mentioned normal faults, are reported. These data were collected for a length of more than 30 km in the days and weeks following the main seismic events. The co-seismic ruptures are systematically aligned with sets of normal faults [19,29,30] and are mostly coincident with the traces of the Mt. Vettore–Mt. Bove SW-dipping faults and the NE-dipping antithetic faults bordering westward of the Pian Grande Plain. Along the Nottoria–Preci fault, near the Norcia and Campi villages, some minor ruptures were also detected (Figure 1).

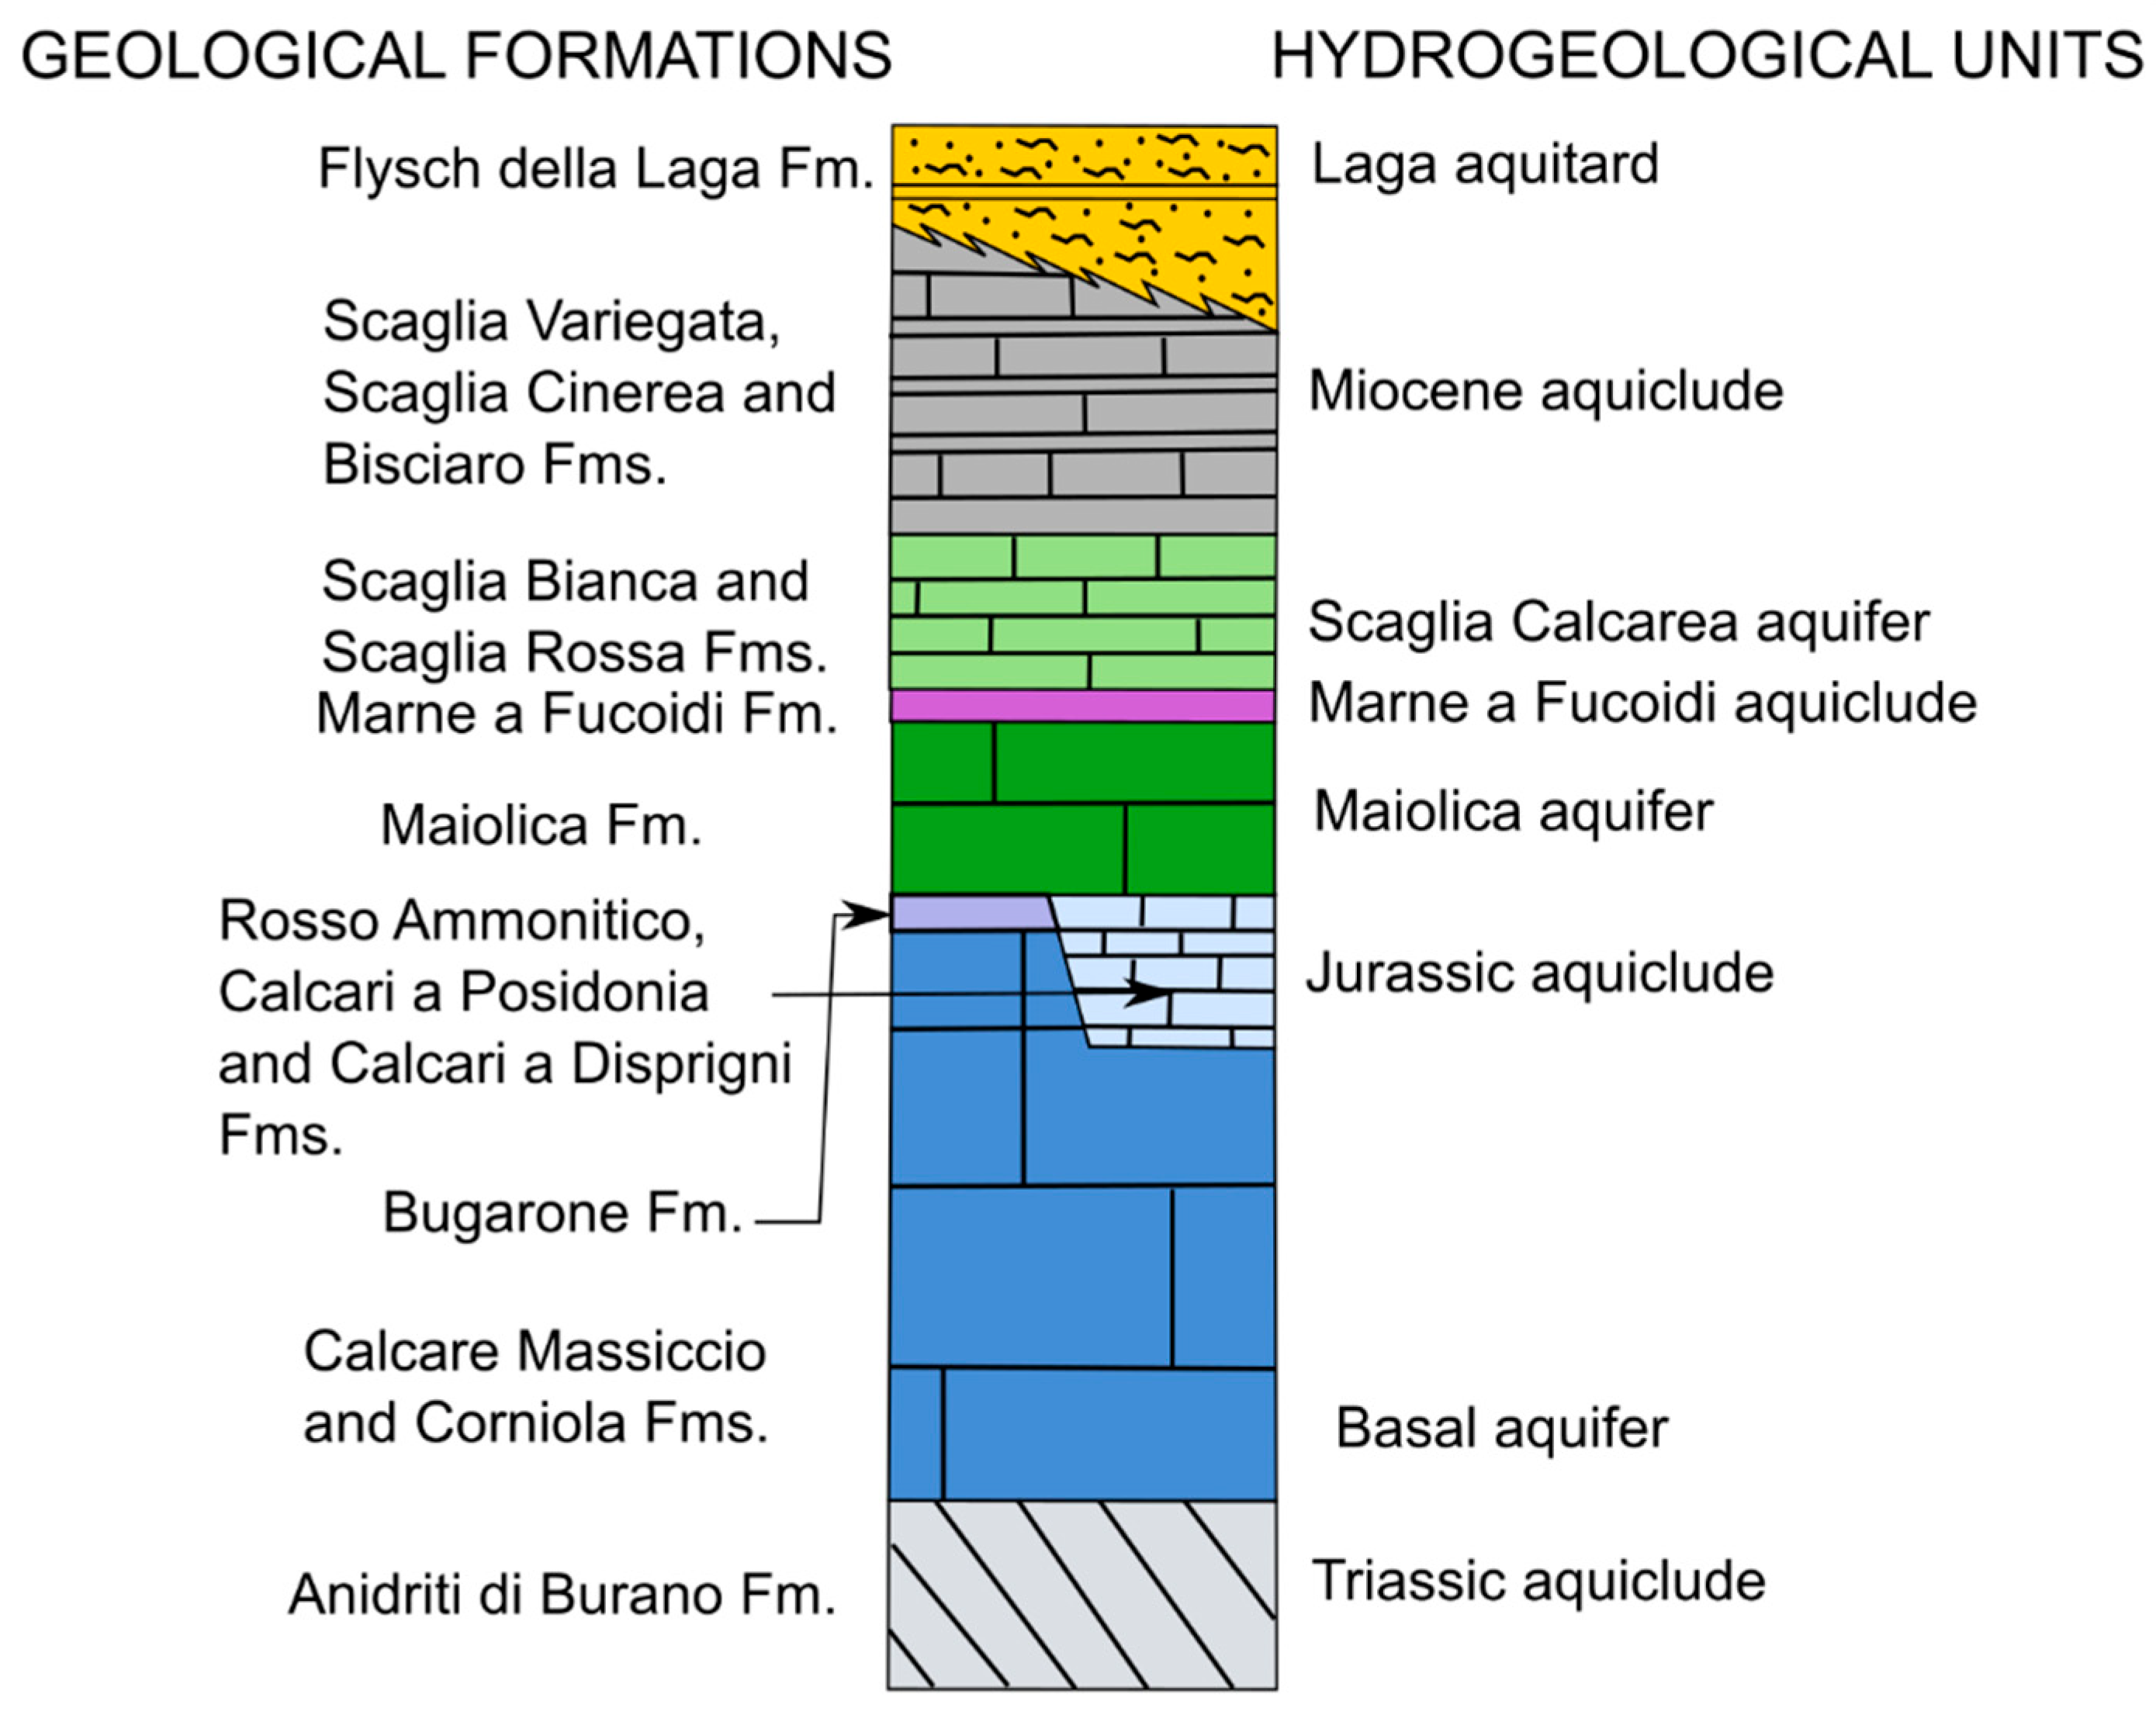
3. Hydrogeological Setting

The results obtained from the hydrological investigations were carried out for more than two decades in this area and are summarized in several studies that are available in the scientific literature and in technical reports [31,32,33,34,35,36,37,38,39,40,41,42,43,44]. The Umbria-Marche Stratigraphic Succession is made by eight hydrogeological complexes [21,45], among which the Basal aquifer (the regional one), the Maiolica aquifer and the Scaglia Calcarea aquifer are recognized (Figure 2). The Basal aquifer is hosted in the Calcare Massiccio, Bugarone and Corniola geological formations (Fms.) and is characterized by a well-developed karstic system; it overlies the Triassic dolomite and anhydrite sequence of the Anidiriti di Burano Fm. [46] and acts as a regional aquiclude complex. The Basal aquifer is responsible for the main discharge increases along streams and rivers with several linear springs occurring along the water courses.
The Maiolica aquifer is mainly composed by stratified micritic limestones, while the Scaglia Calcarea aquifer that is hosted within the Scaglia Bianca and Scaglia Rossa Fms. is composed of stratified limestones and is responsible for the local groundwater recharge of the linear or punctual springs of the area.
The main aquifers can be separated or connected with each other depending on the effectiveness of the role that the aquiclude and/or aquitard plays, affected by the low permeability complexes and the fault systems [13]. Based on the tectonic configuration of the area, three hydro-structures have been identified [21] in the Sibillini Mts. area. From east to west, the hydro-structures are separated from each other by regional normal faults and bounded by the main overthrusts (Sibillini Mts. overthrust and Coscerno Mt. overthrust). The trend of the tectonic discontinuities (oriented approximately NNW–SSE) coincides with the groundwater flow direction of the main aquifers in the area. At a regional scale, the extensional structures with the highest throw, such as the Vettore Mt.–Bove Mt. and the Nottoria–Preci fault systems, behave as barriers to the groundwater flow [21]. In particular, the Nottoria–Preci fault system is considered as a physical groundwater divide between the central and the westmost hydro-structure, except in the Norcia area where a groundwater transfer was observed before the 2016–2017 seismic sequence [47,48,49].

4. Materials and Methods

With the aim of deriving a hydrogeological conceptual model of the Campiano streams’ basin, used to highlight the post-seismic modification on the groundwater and surface water environments, a holistic approach involving hydrogeology techniques, geology and geochemistry was implemented. In this section, a description of the monitoring system of the main hydrogeological parameters will be presented.

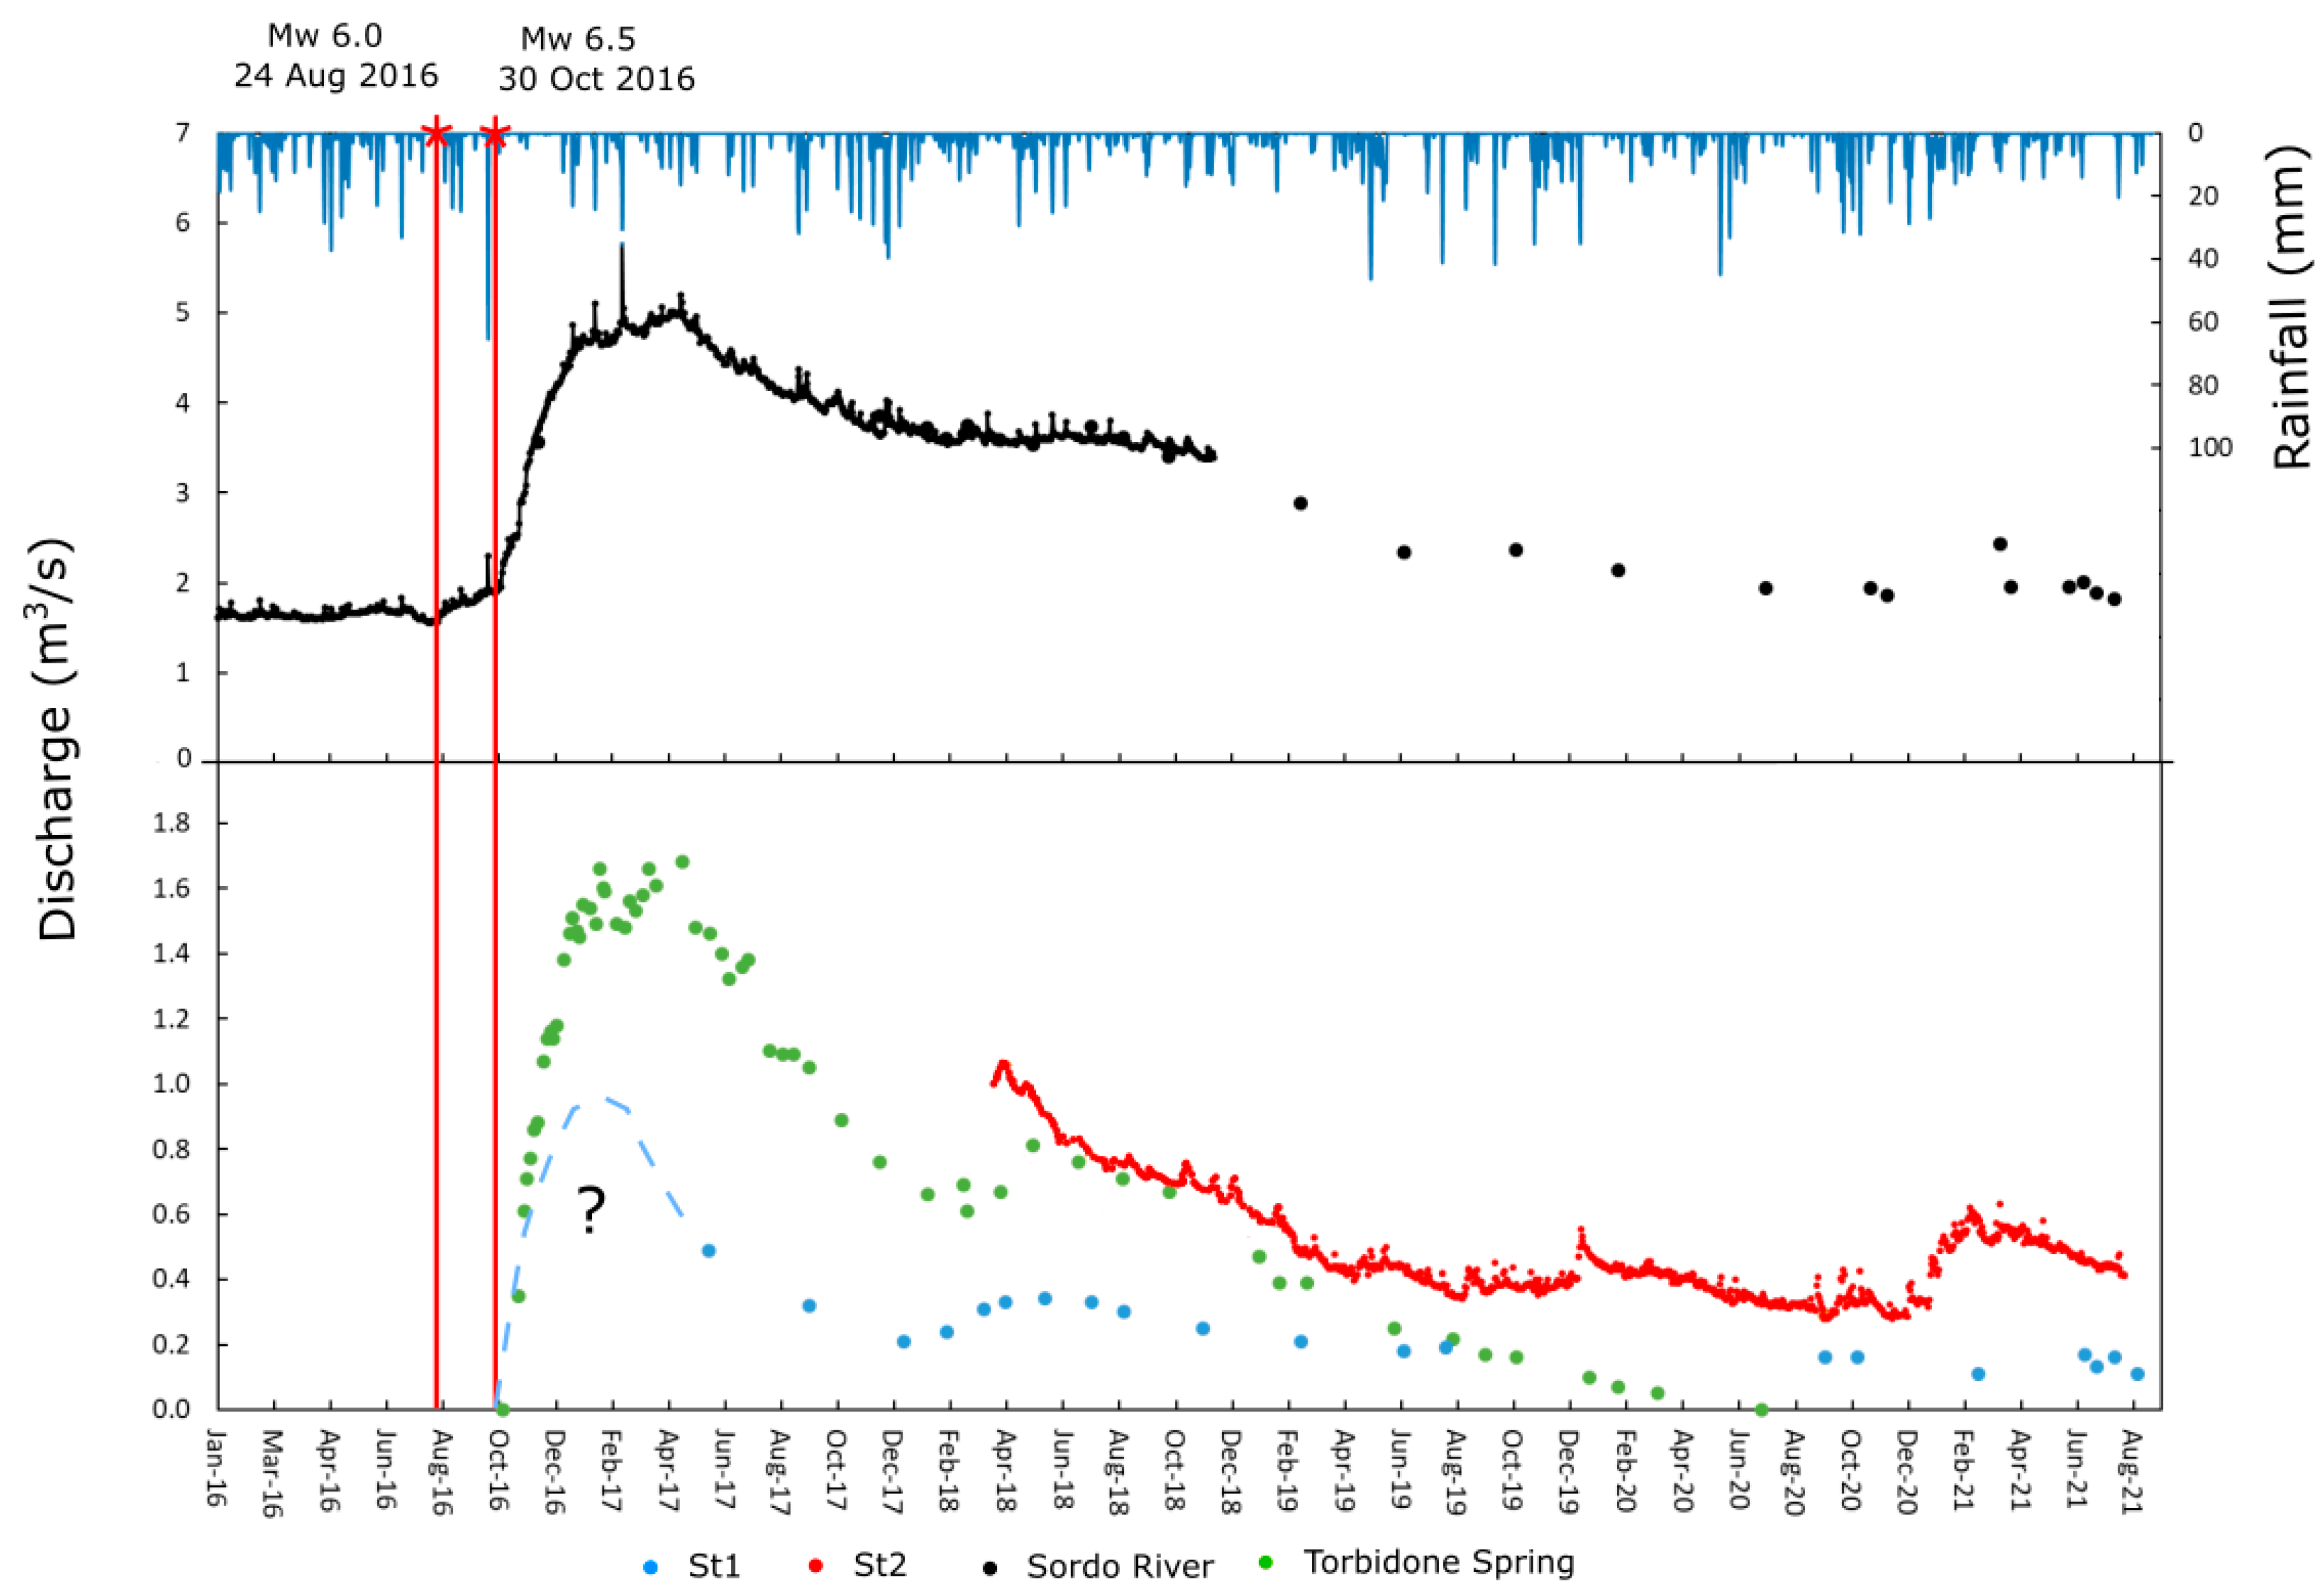
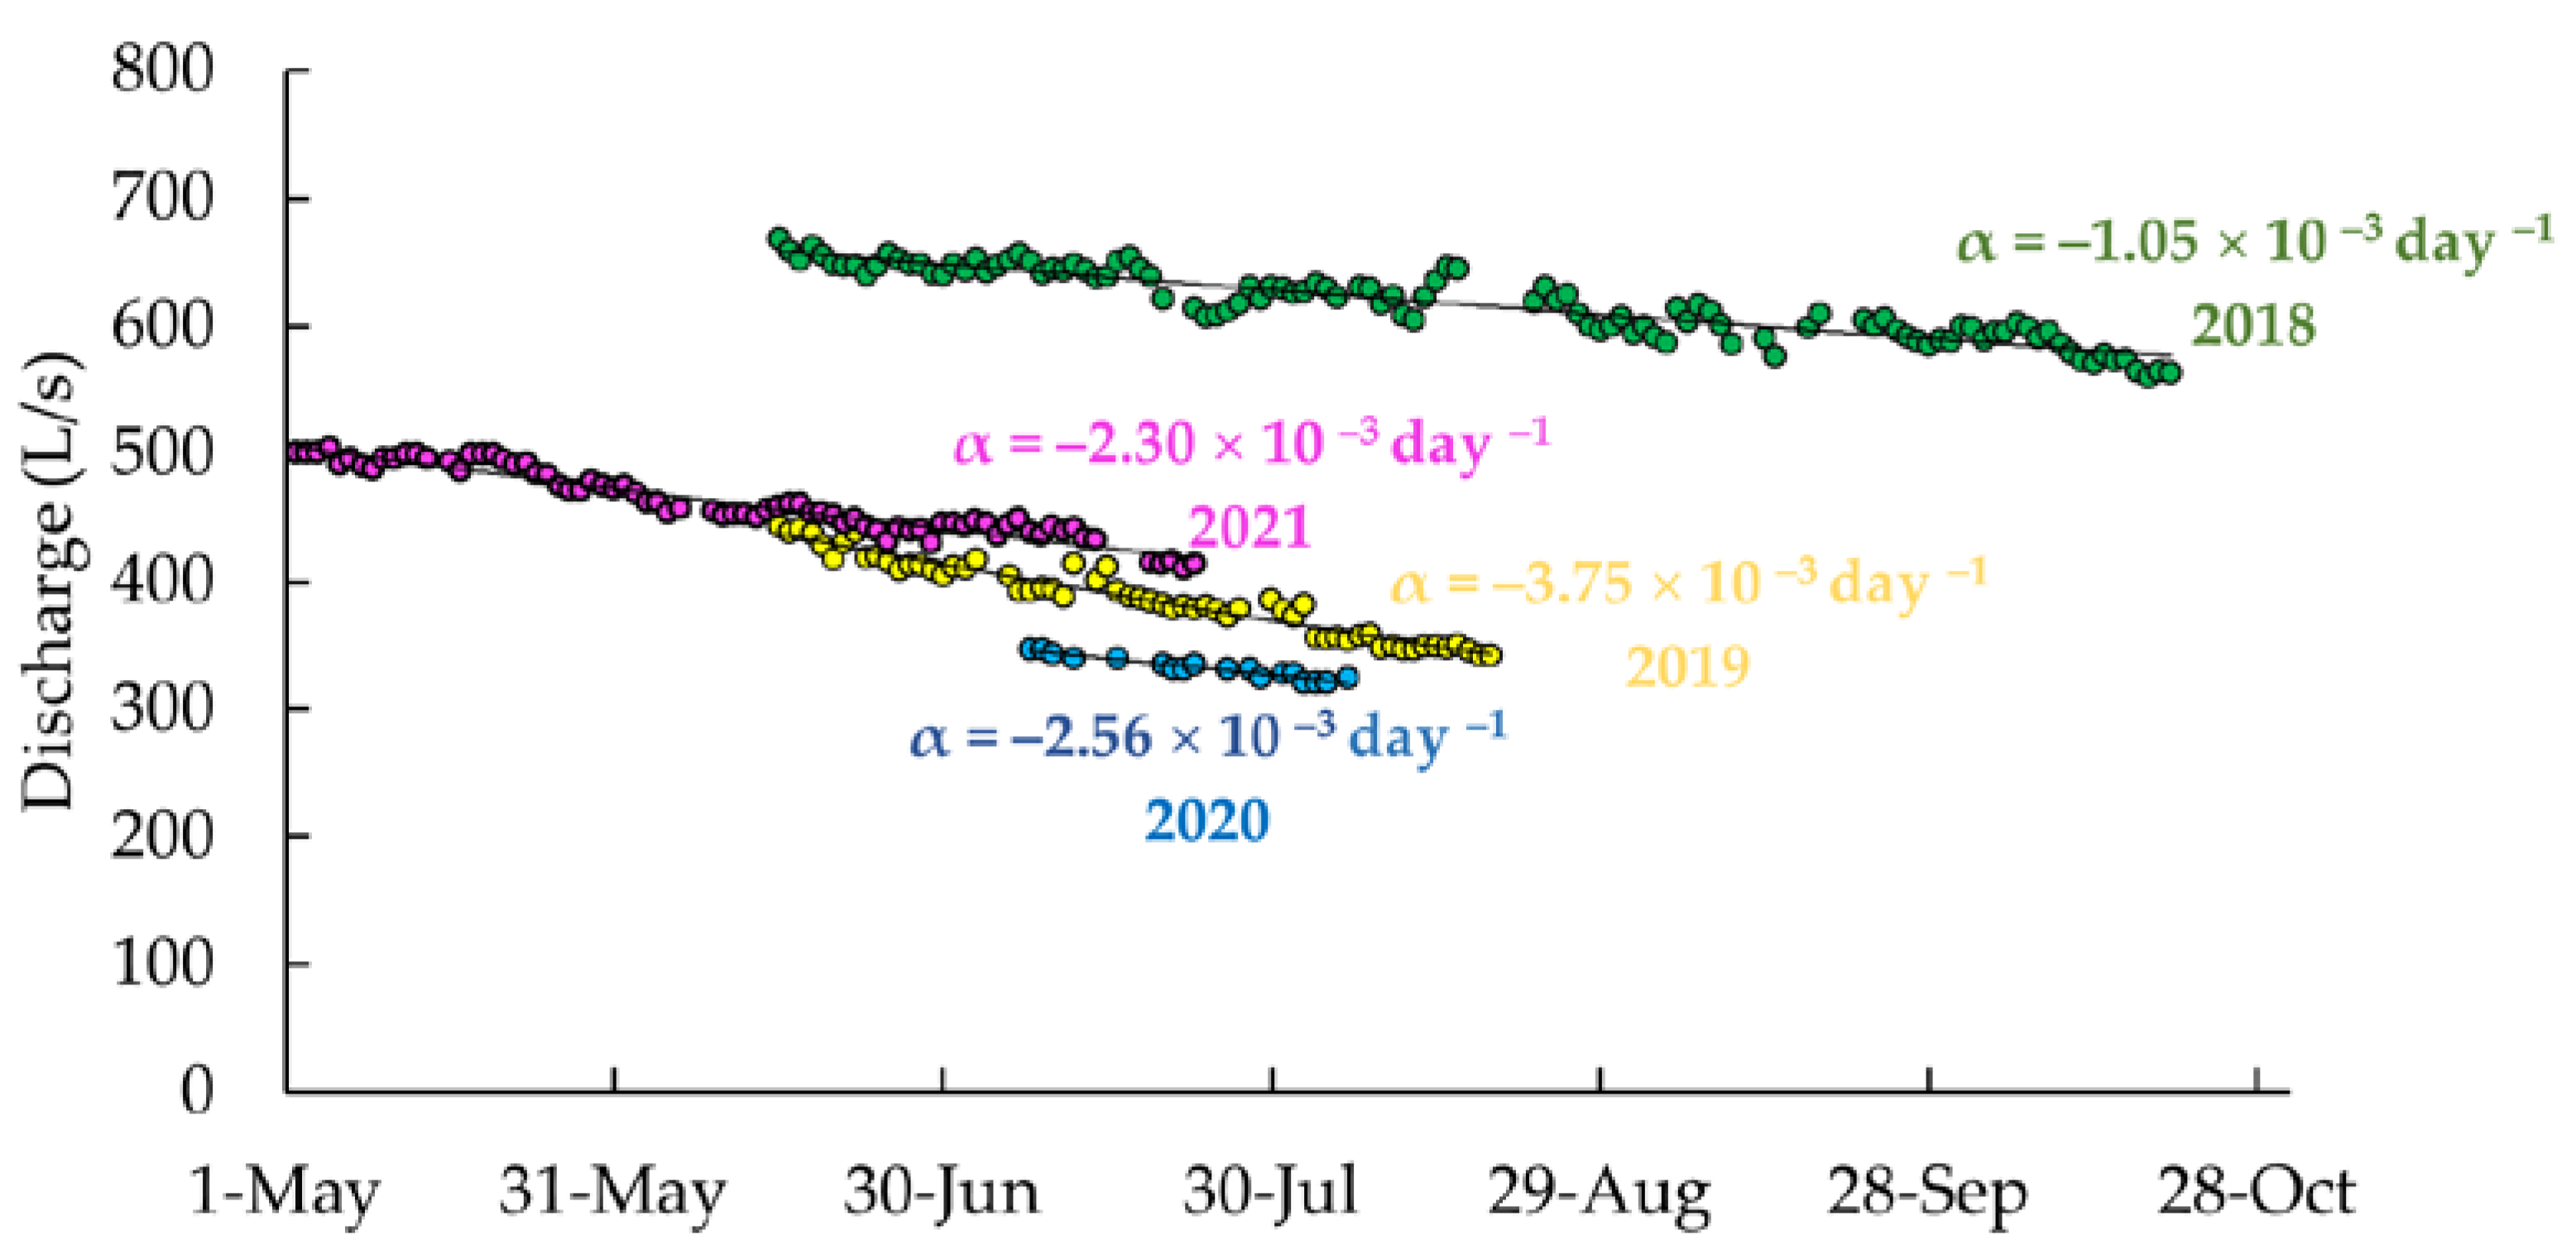
4.1. Analysis of Stream Hydrograph
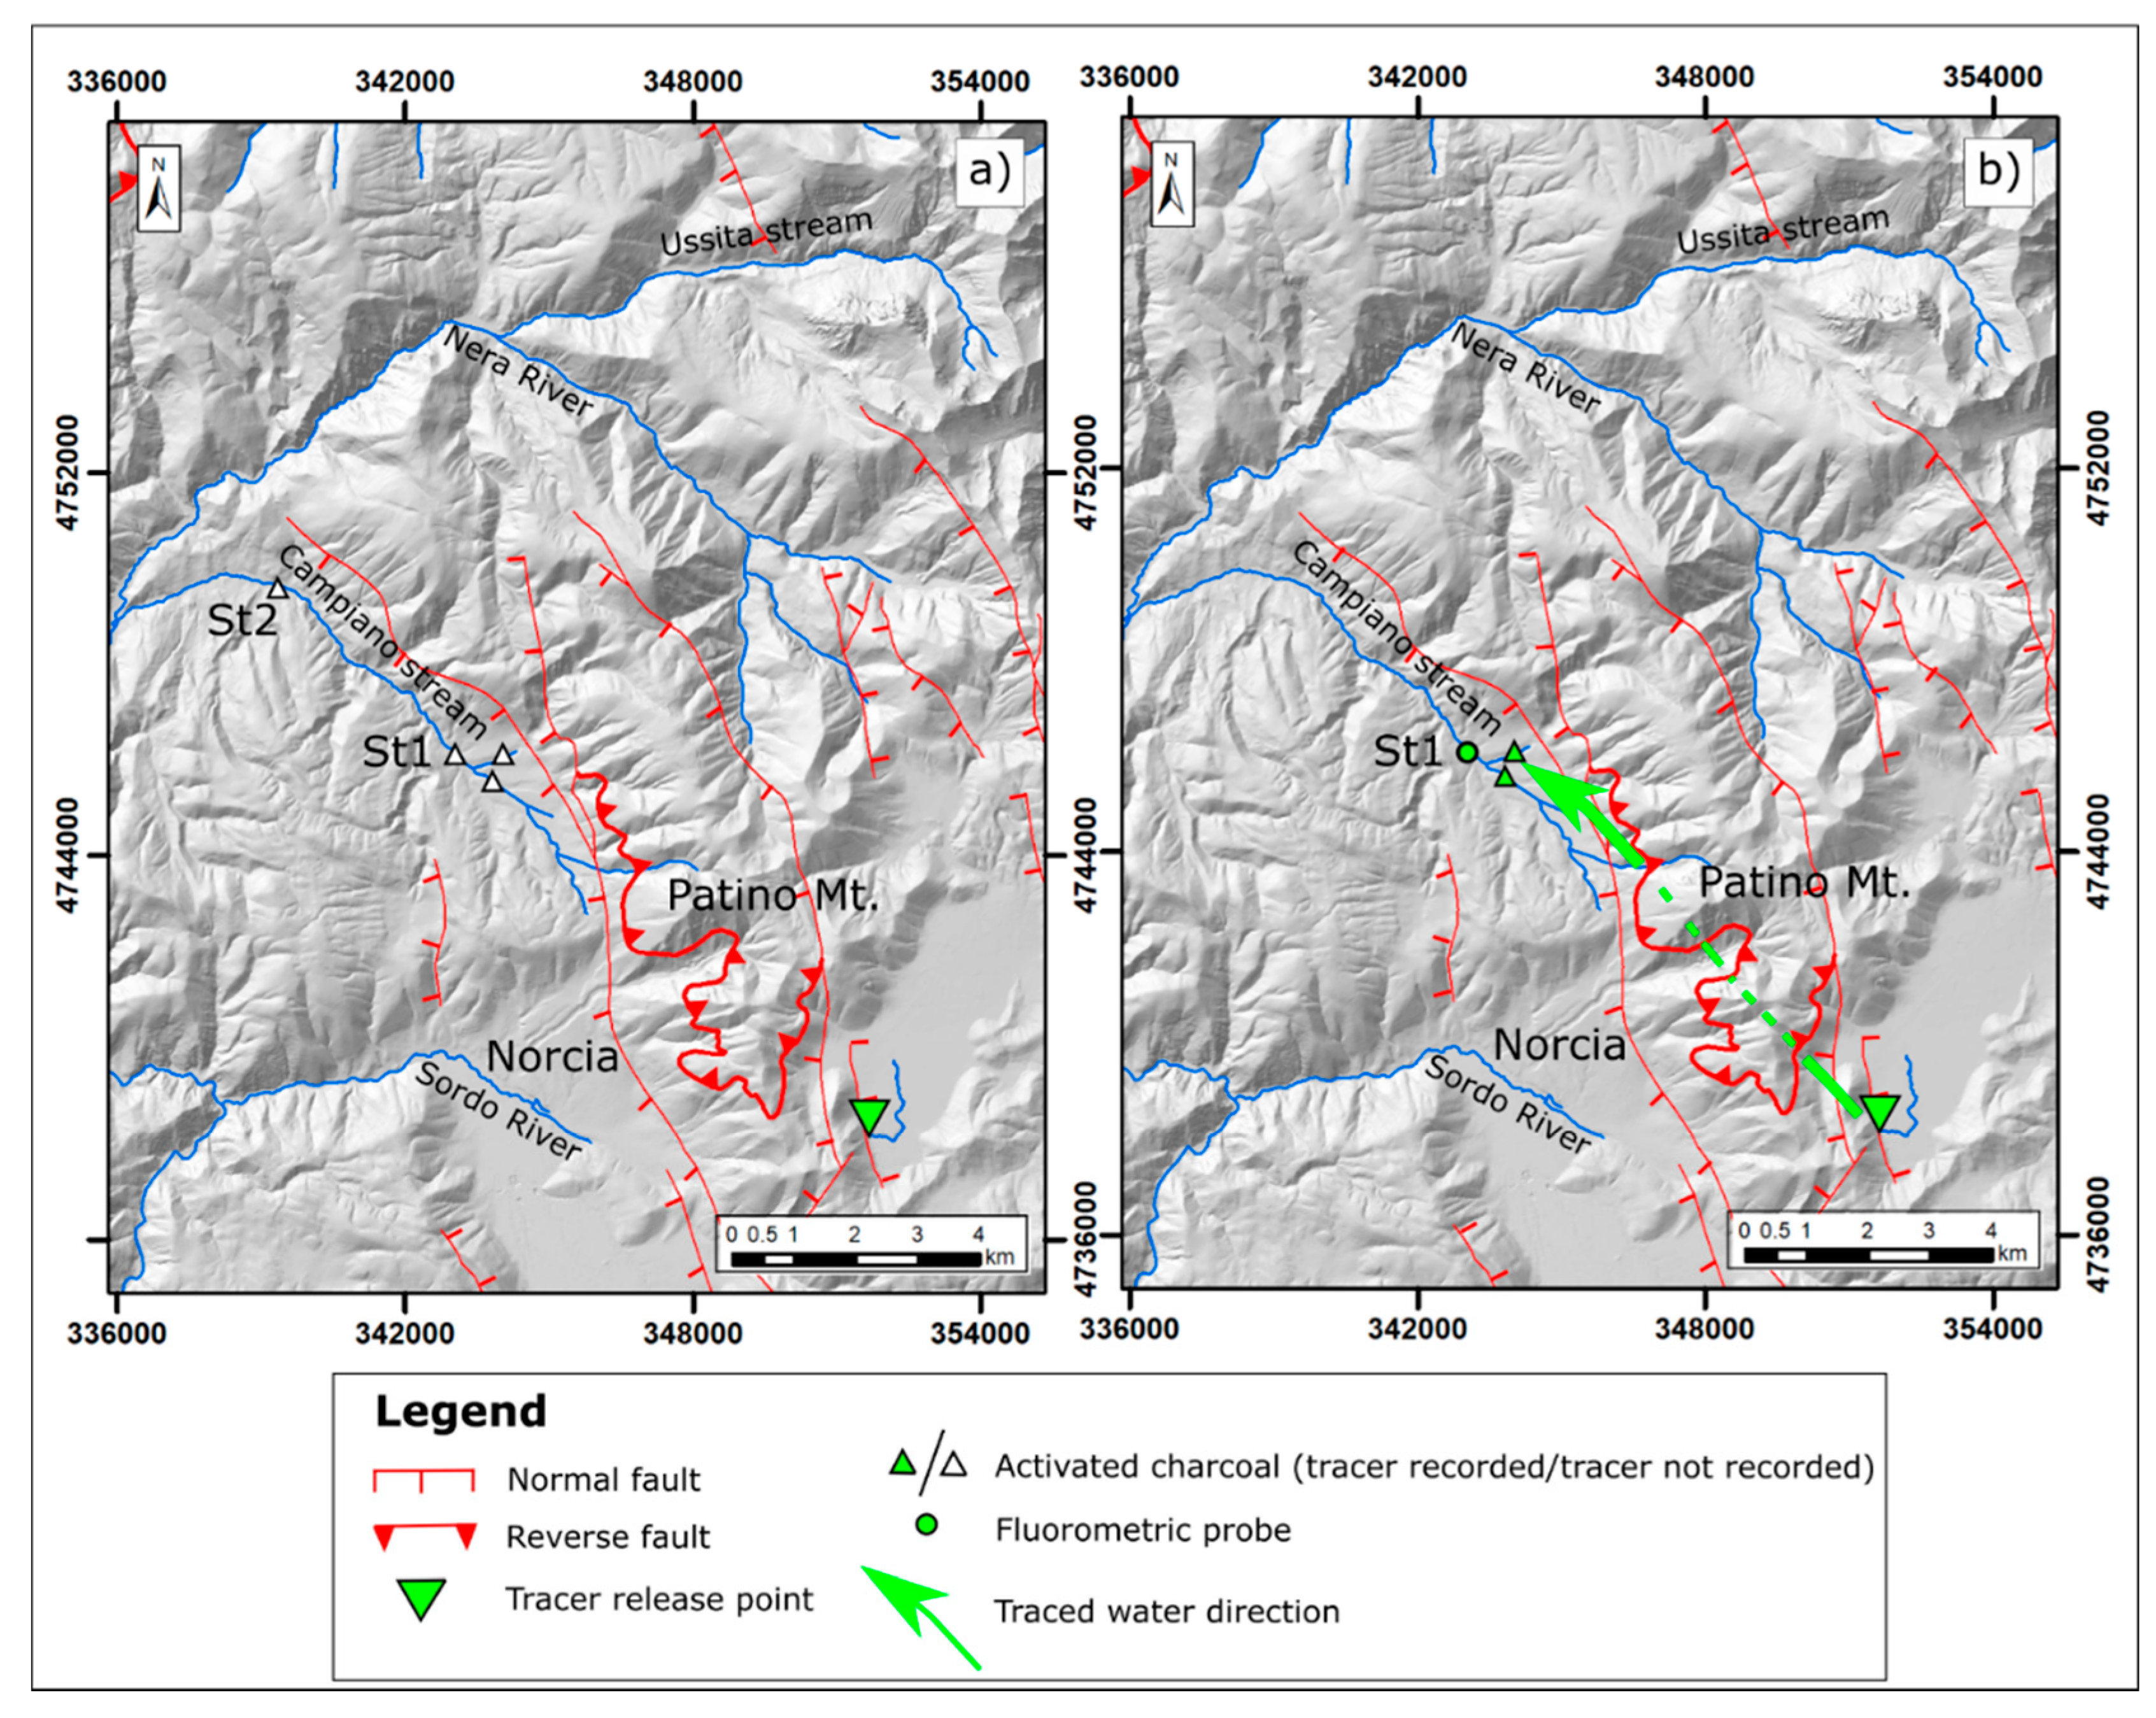
Discharge measurements were periodically run in the Campiano stream at the measurement station St1 (Figure 1) starting from June 2017, using the flowmeter FlowTracker produced by SonTek (San Diego, CA, USA). At St2, the discharge has been provided and continuously monitored on a daily scale since March 2018 by the fish farming company operating in the area. Data allowed for the average discharge calculation during a three-year long post-earthquake phase and for the comparison of these data with the pre-seismic ones, determined by Mastrorillo et al. [38]. Moreover, the discharge trends that were recorded in the monitoring points of the Campiano stream were compared to other monitoring points of springs and rivers located west of the Nottoria–Preci Fault system in the upper Sordo River Basin, near Norcia (Figure 1). In addition, the discharge regime was compared to the daily rainfall validated data recorded in Norcia which can be freely downloaded from the SIR-RU database (https://annali.regione.umbria.it/, accessed on 15 January 2022), managed by the Umbria Region Authority. The average annual rainfall of the analyzed period was about 762 mm, lower than the mean that was recorded in the previous decade (2007–2016) which was 830 mm.
Finally, the daily discharge data that were recorded at St2 were used to study the depletion coefficient throughout the analysed years. The recession periods were determined by fitting the data with the Maillet equation [50]. Several authors working on this area [48,51,52,53] have shown that this equation is the most suitable to fit the springs recession curves of the Sibillini Mts. domain. According to Maillet, the depletion curves can be described as follow:
Qt = Q0 e−αt,
where Q0 is the discharge at the beginning of the depletion period (t0), Qt is the discharge at time t (calculated from t0) and the parameter α is a depletion coefficient. Maillet depletion coefficients were determined on every depletion period individuated along the analyzed time interval (2018, 2019, 2020 and 2021).

4.2. Tracer Tests

Several long-time and periodic artificial tracer tests were conducted before, during and after the seismic period in the Sibillini Mts. area [49,51]. The tracer release was performed by applying the sudden injection method into the Mèrgani sinking stream (Figure 1). The stream disappears into a sinkhole in the south-eastern portion of the tectono-karstic depression of Pian Grande (about 1300 m a.s.l.) [54]. From a geological point of view, the Pian Grande Plain is a wide intra-mountain plateau, bordered by normal faults and filled by Quaternary fluvial-lacustrine deposits [55,56,57], while from a geomorphological standpoint, the presence of a well-developed epikarstic system within the plain is evidenced by the occurrence of several sinkholes [58]. Six tracer tests were performed in the area by alternately using Na-fluorescein (C20H10Na2O5) and Tinopal CBS-X (C28H20Na2O6S2), starting from February 2016 to June 2020. During the TEST1, performed in the pre-seismic phase, 2 kg of Na-fluorescein was released into the sinking stream on February 12th, 2016. This can be considered as the pilot-test for the area. The second test (TEST2), performed on 9 June 2016, and involving the pre- and co-seismic phase was characterized by the sudden release of 29 kg of Tinopal CBS-X.
After the main earthquakes, four tracer tests were conducted on 20 March 2017; 20 March 2018; 8 February 2019; and 12 June 2020, respectively. TEST3 consisted of the injection of 85 kg of Tinopal CBS-X. During TEST4 and TEST5, 16 kg and 27 kg of fluorescein were, respectively, introduced into the system through the sinkhole. During the last TEST6 (injection of 80 kg of Tinopal CBS-X) no tracer monitoring points were installed in the Campiano catchment. For each tracer test, the discharge in the sinking stream was measured. More specifications about the inflow in the sinkhole are reported in [51]. The monitoring points location was selected in accordance with the hydrogeological setting of the investigated area. In general, they were in the proximity of the discharge measurement points (St1, St2) and along the main linear springs belonging to the analysed stream. During the pre- and co- seismic period, tracer tests in each monitoring point in the analysed basins were equipped with activated charcoal. The active carbon traps were used to fix the tracer and were replaced every 15 days during the entire monitoring period. At the time of charcoal substitution, a water sample was manually collected in each monitoring point and stored in 100 mL glass amber bottles to prevent light decay of the tracer between sampling and analysis. Both Tinopal CBS-X and fluorescein were extracted by the carbon-active traps by a laboratory procedure using a potassium hydroxide solution in methanol. Once collected, the water samples and the solutions that were obtained by the extraction were analysed by a RF-6000 laboratory spectrofluorometer produced by Shimadzu Corporation (Milan, Italy). The analysis was preceded by the calibration of the Shimadzu spectrofluorometer by using three concentration standards (10, 20 and 100 ppb), prepared using the same water collected in the field, and a blank sample for each monitoring point, sampled before each new tracer injection. During the post-seismic tracer tests (TEST4 and TEST5), point St1 was instrumented by a continuous fluorometric probe produced by PME Inc. (Vista, CA, USA) which contained various optics for tracer detection. The probe has a standalone power supply and a data logger for the measured data storage. The sensor PME Cyclops-7 Logger is characterized by a detection limit of 0.01 ppb and 0.6 ppb for the fluorescein and the Tinopal CBS-X, respectively. The field fluorometric probe was calibrated before each test by using a blank sample; one calibration standard at 100 ppb of dye tracer was prepared using the same water that was collected in the monitoring point. Tracer concentration data were acquired every 10 minutes during the various tests. The memory data storage of the field fluorometric probe was periodically downloaded (2 months) to check the correct execution of the tests.
All the artificial tracer tests were made with the aim to:
i.
Label the water movement from the injection point to the main springs of the area;
ii.
Determine the interaction between the tectonic lineaments (faults) and the groundwater flow direction, and their possible modification due to the earthquakes;
iii.
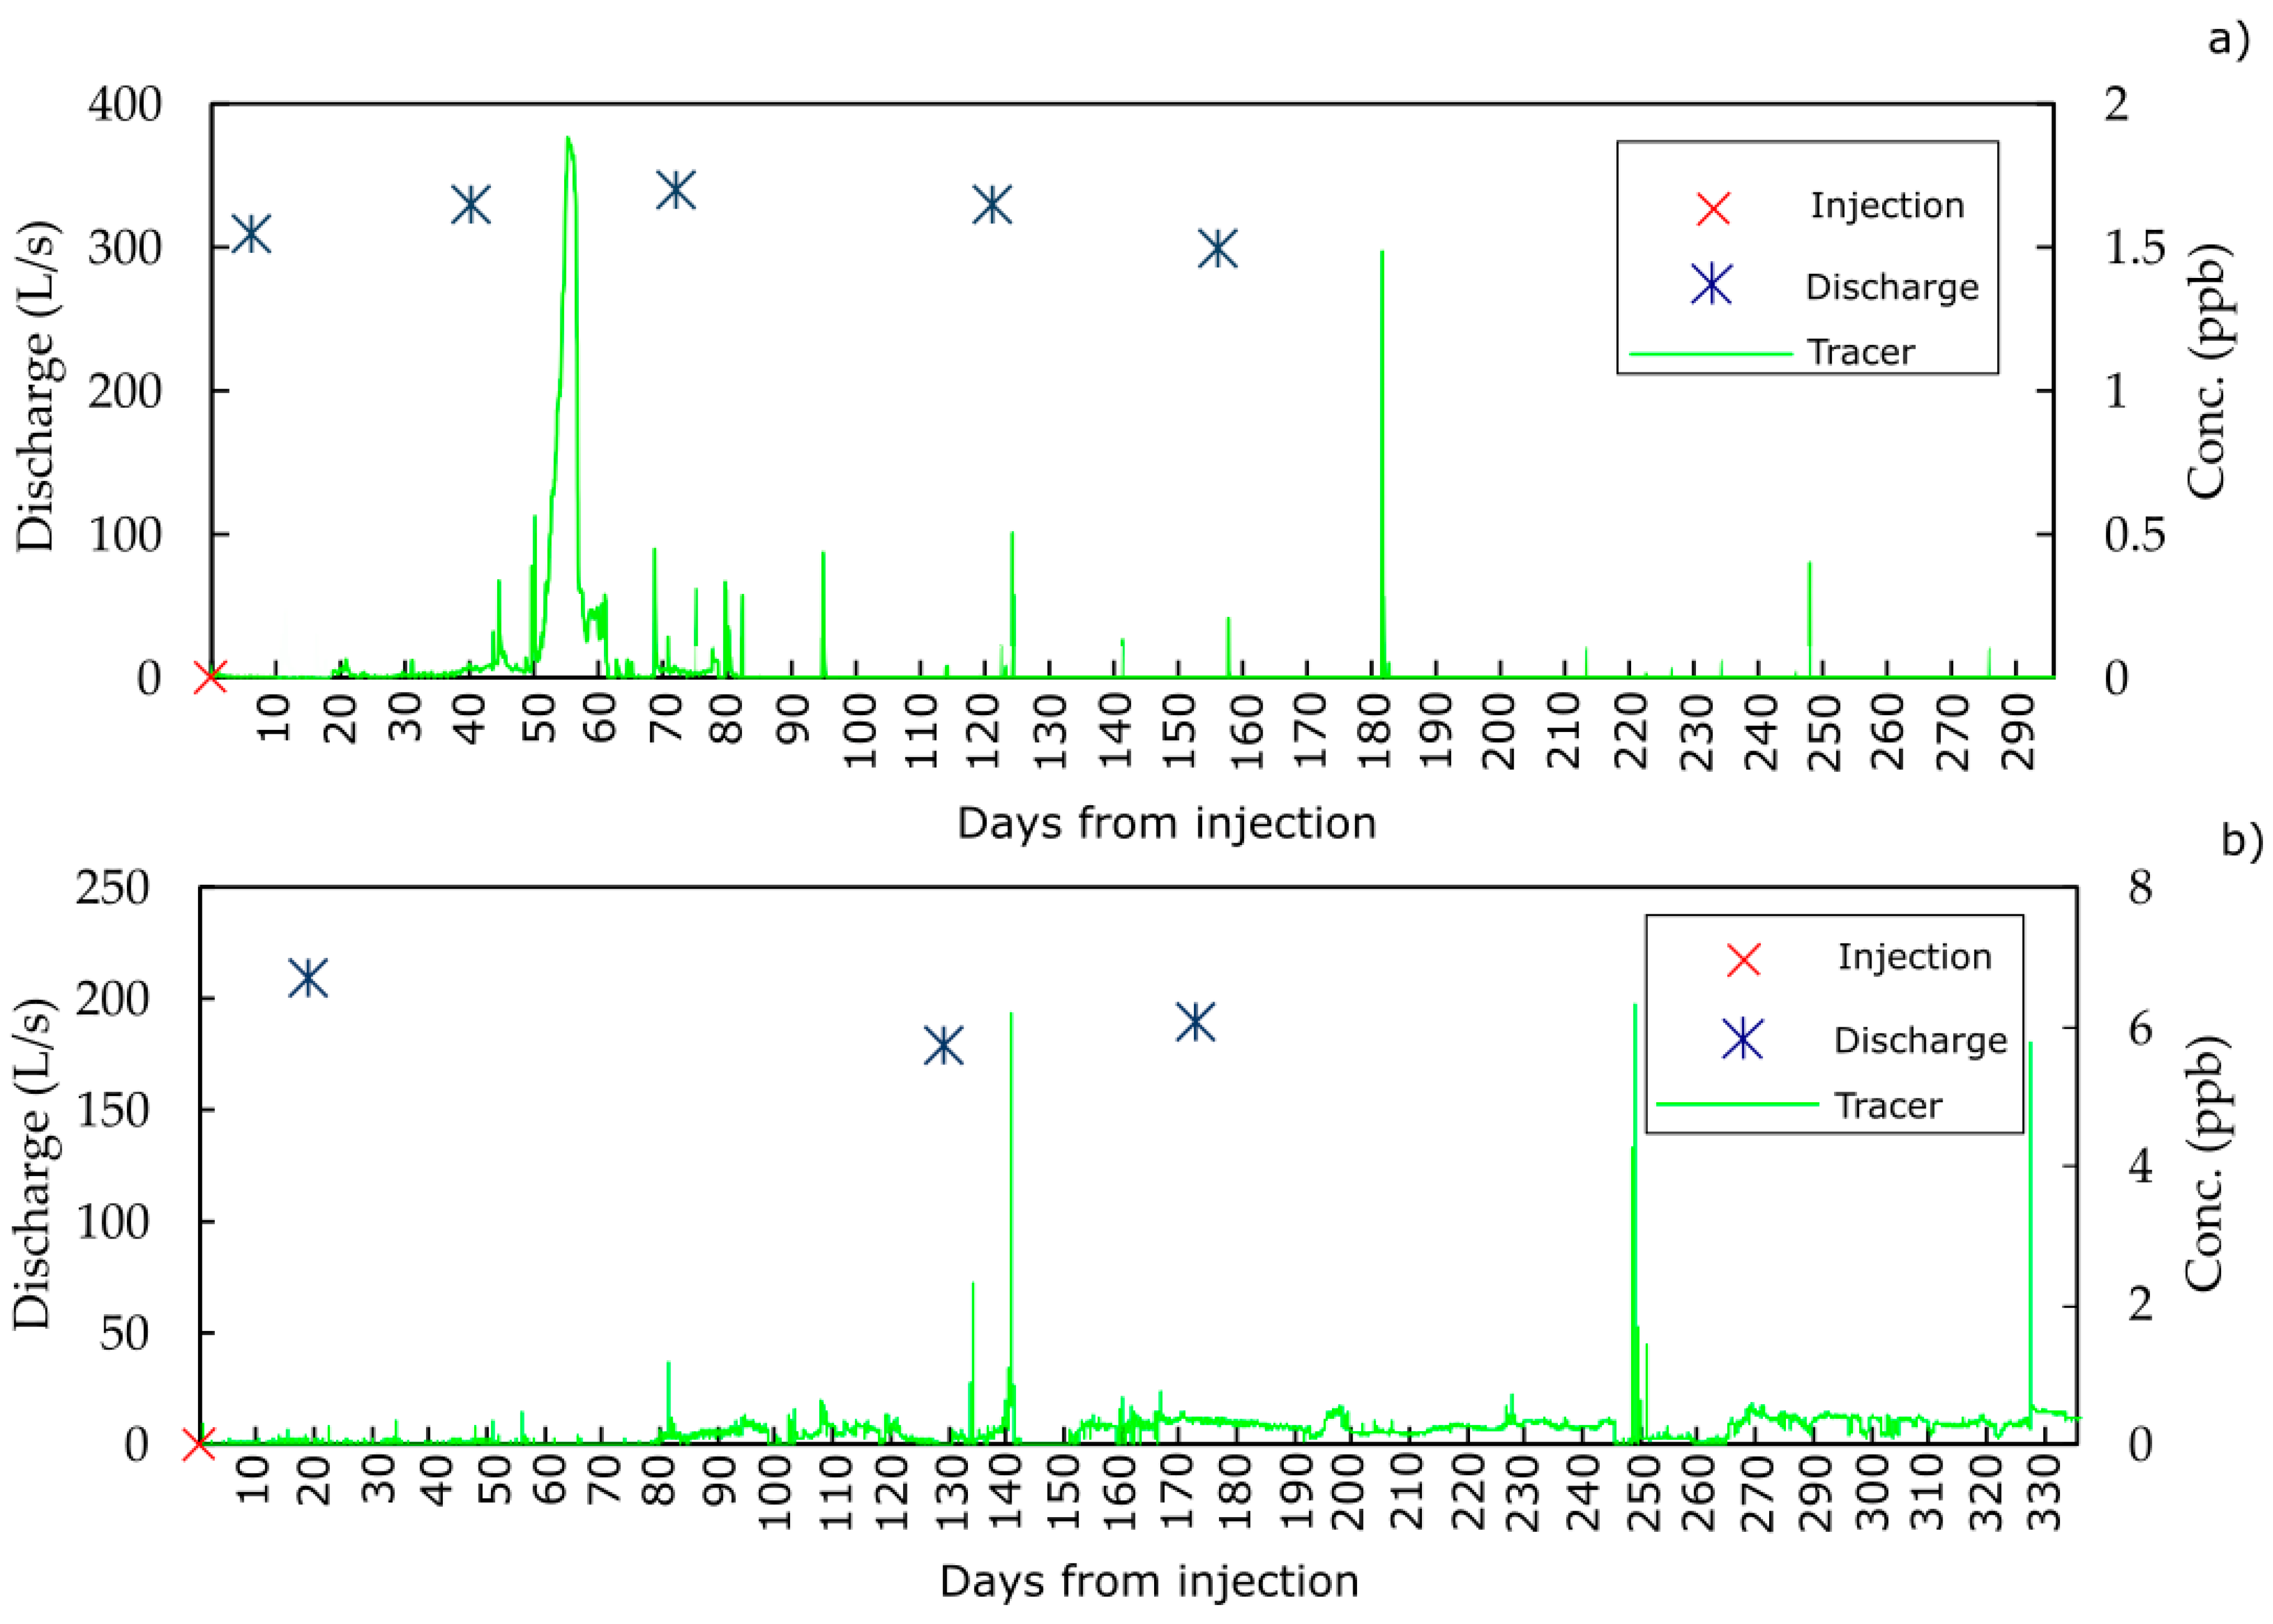
Assess the groundwater flow velocities (mean and maximum) by calculating the mean tracer transit time and the first peak arrival. To achieve this, after a denoising procedure on the tracer arrival signal recorded by the fluorometric probe, a quantitative tracer analysis was performed by Qtracer2 ver. 2 free software for the karst and fractured aquifers’ tracer tests interpretation [59].

4.3. Hydrochemical and Isotopic Analyses

Hydrochemical analysis on the major chemical elements was conducted in the punctual and linear springs of the Campiano catchment (S, St1 and St2 in Figure 1). During the sampling, the pH, Eh, electrical conductivity and HCO3 were measured in the field. The HCO3 concentration was determined by acid titration with 0.01 N HCl using methyl orange as an indicator. The pre-seismic sampling was performed between January and April 2016 and the chemical analyses were conducted at the Laboratory of the Università Politecnica delle Marche by using an ion chromatography system (ICS-1000, Dionex, Waltham, MA, USA). The post-seismic sampling was performed between September 2016 and September 2021. One of the sample aliquots was filtered upon sampling through 0.45 μm membrane filters and then acidified with 1% of 1:1 diluted HCl. Once sampled, the water was transported to the laboratory at a controlled temperature of 4 Celsius degrees. Chemical analyses were performed at the laboratory of Perugia University. Ca and Mg concentrations were determined by atomic absorption (AA) flame spectroscopy on the acidified sample, while Na and K were determined by atomic emission (AE) flame spectroscopy, using an Instrumentation Laboratory aa/ae spectrophotometer 951. Cl and SO4 were determined by ion chromatography using a Dionex DX-120 instrument.
With the aim of determining the recharge area mean elevation for the linear spring emerging along the stream, an isotopic investigation was carried out. Specifically, an isotopic sampling was performed on the punctual spring S and on the stream water in St1 during the recession period of 2017, 2018, 2019 and 2021. The survey was conducted far from intense rainfall events to avoid the runoff component sampling. Water samples for the isotopes analysis were collected in 50 mL high-density polyethylene bottles that were sealed by plastic inserts to avoid water evaporation. Isotopic analyses of oxygen of water were performed with a near infrared laser analyzer (L2130i, Picarro, Santa Clara, CA, USA) using the wavelength-scanned cavity ring down spectroscopy technique at the laboratory of INGV of Naples (analytical error δ18O ± 0.08‰; data reported vs Vienna Standard Mean Ocean Water, V-SMOW). The determination of the recharge area mean elevation for St1 was obtained by applying the δ18O gradient recently published by [13], valid for the entire Sibillini Mt. Massif. This result was compared to the hydrological basin’s mean elevation upstream of St1 as determined by a Digital Terrain Model (DTM) with 20 × 20 m cell size, available for the area.

4.4. Hydrogeological Map and Cross-Sections

With the aim of supporting the hydrogeological investigations and to build up a hydrogeological conceptual model of the area, we used the 1:40,000 geological map by Pierantoni et al. [30]; the 1:50,000 hydrogeological map by Viaroli et al. [21]; and the 1:10,000 geological maps of the Umbria and Marche regions. A set of geological sections across the north-western sector of the Nottoria–Preci fault (traces in Figure 1) were built. We drew 11 cross sections which were used jointly with the surface geological data to build up a longitudinal section connecting the Mergani sinkhole with the Campi area, in order to investigate the subsurface geology control on the groundwater circulation.
The geological sections allow to infer the subsurface geometry of both lithology and structures and to identify the subsurface groundwater flow direction. This information can efficiently be compared with infiltration heights, water provenance and composition that are derived from hydrogeochemical data and tracer tests, in order to understand how the earthquake crisis perturbed the groundwater flow directions and composition.

5. Results and Discussion

5.1. Discharge Modification Due to the Seismic Sequence

Observing the discharge trends of St1 and St2 during the post-seismic period (Figure 3), a strong decrease is visible starting from the first available data (i.e., June 2017 for St1 and March 2018 for St2). As St1 is concerned, the year 2017 is characterized by discharge values decreasing from about 0.5 m3/s to 0.2 m3/s. This phase is followed by an increase in discharge persisting until May 2018 (≈0.34 m3/s) due to the meteoric recharge that occurred in the autumn–winter period (between September and February 2018), evidenced by the rainfall is recorded in the Norcia area. Subsequently, a new discharge decrease is recorded until July 2019. The last two years are characterized by sparse discharge data whose values suggest a quasi-stationary flow regime of about 0.2 m3/s. The St2 behaviour is similar, but it is characterized by a much more apparent discharge increase in 2021, following the meteoric recharge that occurred between September 2020 and March 2021. At the same time, the punctual spring of the Campiano stream (S), characterized by a discharge value of 10 L/s during the pre-seismic period, experienced a strong discharge decrease just after the seismic sequence (Table 1).
Despite a lack of data immediately after the seismic sequence, by comparing the Campiano discharge trends with the discharge of the Sordo River and Torbidone spring (upper Sordo River basin), it is possible to hypothesize that St1 and St2 behaved similarly to them after the October 30th, 2016, earthquake. Right after this seismic shock, the Torbidone spring, the behaviour of which is recognised to be intermittent due to strong earthquakes [60], displayed a sudden increase in discharge passing from 0 to 1.6 m3/s in less than four months [15]. Thereafter, except during the recharge periods, its discharge values decreased during the years until summer 2020 when the spring totally dried. At the same time, the Sordo River, which is monitored just downstream of Norcia village, showed a rapid increase in discharge just after the October 30th earthquake (passing from 1.9 to 5.0 m3/s), preceded by a slight discharge increase after the 24 August 2016 earthquake (from 1.5 to 1.9 m3/s). Both increases are not justified by meteoric recharge processes [12]. Thereafter, the Sordo River discharge gradually decreased, except during the recharge periods. It can be observed that the decreasing discharge trend of St1 and St2 is quite similar to those observed on Torbidone spring and Sordo River, suggesting that, also for Campiano River, the decreasing trend was preceded by a significant discharge increase.
In fact, local people and the fish company’s staff reported a strong increase in river discharge immediately after the earthquake of 30 October 2016 (Figure 4b). In addition, Valigi et al. [48] highlighted that high elevation springs (elevation > 790 m a.s.l.) located eastward of Campi village (red dots in Figure 1) were both depleted following the earthquake of 30 October 2016 (Figure 4a). Reports by the fish company’s technical staff also indicate that since 30 October 2016, the water flowing along the ditches feeding the Campiano stream on its right side emerges at a lower elevation than in the pre-seismic period.
The decrease in the Campiano discharge is reported for two time intervals, respectively, 2017–2018 and 2019–2021 (Table 1) and compared to the pre-seismic mean discharge values that were measured by Mastrorillo et al. [38] in the same periods.
The identification of four recession periods in the St2 hydrograph allowed for the calculation of the depletion coefficients for all the years from 2018 to 2021 (Figure 5). The depletion phase of the linear spring feeding the Campiano occurred between late spring and early autumn. In all cases, by applying the Maillet’s equation, a coefficient (α) in the order of 10−3 day−1 was determined with a strong Pearson’s determination coefficient (R2 > 0.85). The low value of the depletion coefficient is characteristic of a fractured carbonate aquifer with high permeability and with a wide reservoir [45,61]. It is worthwhile to observe that the obtained α values are similar to that of Torbidone Spring (3.1·10−3 day−1) determined by [48]. Other authors [62,63] determined α coefficient of the same order for springs fed by the Basal aquifer, whereas the α coefficient of the Maiolica and Scaglia Calcarea aquifers are on the order of 10−2 day−1. This suggests that the Campiano spring is partially fed by the Regional Basal aquifer that is hosted in the Corniola and Calcare Massiccio geological Fms.

5.2. Tracer Hydrology Evidence

The graphical results of the tracer tests are summarized in the maps in Figure 6.
As evidenced by the left map (Figure 6a), the tracer was never recorded in the monitoring points before the seismic sequence (no tracer was found in the activated charcoal or in manual samples). As far as the post-seismic period is concerned, the main schematic flow paths from the Mèrgani sinkhole towards the analysed basin (represented by the green arrow in Figure 6b) highlight the hydrogeological connection between the Pian Grande Plain and St1. Indeed, the Na-fluorescein was detected both in the activated charcoal located upstream to St1 and by the field fluorometric probe during TEST4 and TEST5. The breakthrough (BTC) curves, showing the tracer concentration expressed in parts per billion (ppb) over time, are reported in Figure 7.
The monitored point St1 is located along the Campiano stream about 10.6 km from the injection point. The breakthrough curve during TEST4 (Figure 7a) shows a first significant arrival 45 days after the injection, characterised by an impulsive behaviour. Then, between 50 and 60 days from the injection, a bell shape was observed. This could be due to the arrival of a contribution from one of the two minor streams feeding the Campiano river on its right bank, upstream of the monitoring points (Figure 6). This contribution is likely to come from the more downstream of the two creeks whose course develops within the valley on sandy-gravel alluvial deposits. Subsequently, repeated impulsive arrivals were recorded. The most intense arrivals occurred 183 days after the injection (1.5 ppb) and are likely to be related to the contribution of the more upstream of the two mentioned creeks, whose first stretch flows within the carbonate rocks of the relieves bordering the valley eastward (Figure 6).
Figure 7b shows the tracer arrivals and the discharge values that were recorded during TEST5. The arrivals are characterised by a superposition of pulses lasting several hours with a dominant hydro-dispersive character. In particular, during May, October and December 2019, very concentrated peaks were recorded about 140, 250 and 330 days after the injection with concentrations up to 6.3 ppb. These peaks are superimposed on the classic bell-shape, denoting a typically dispersive hydrodynamic feature. The first significant arrival of the tracer during TEST5 is observed 81 days after the injection. Unfortunately, the lack of continuous discharge data does not permit correlation of the discharge regime with the tracer arrivals.
The free software Qtracer2 ver. 2 permitted calculation of the barycentric time (corresponding to the 50% of tracer-recovered mass in the same point) during the tests and consequently the mean tracer velocity ( v ¯ ). TEST4 is characterised by a v ¯ of 178 m day−1, while TEST5 is characterised by a v ¯ of 51 m day−1. This aspect suggests that the transient hydrodynamic perturbation due to the seismic sequence seems to decrease during the years. More generally, the groundwater circulation in such aquifers (fractured and karstic) is confirmed to be very fast [49] and the maximum tracer velocity is between 130 m day−1 (TEST5) and 235 m day−1 (TEST4).

5.3. Hydrochemical and Isotope Hydrology Approaches

The results of the hydrochemical analysis of the Campiano stream suggest a geochemical signature that is typical of water interacting with carbonate host rocks with an HCO3-Ca(Mg) facies (Figure 8). Focusing on Figure 8b, it is possible to observe some differences between the water compositions at the different sampling points and between the pre- and post-seismic periods. More in detail, in the post seismic period, an overall increase in Electrical Conductivity (EC), SO4 and Mg occurs between the S spring and the St1 measurement section with the average SO4 passing from 1.15 to 7.87 mg/L, together with an increase in the average Mg value from 0.84 to 2.78 mg/L (Table 2). This suggests that, in the post-earthquake sampling period (2017–2021), the Campiano stream was recharged between the emergence (S) and the St1 section by water components ascribable to the Basal aquifer, which in this region is generally characterised by relatively higher SO4 contents [13] due to the interaction with the evaporitic dolomites of the Anidriti di Burano geological Fm. which underlie the Basal aquifer. The Anidriti di Burano Fm. is uplifted in the Pian Grande plain and the anticlines bordering the plain to the south-east [21]. It is important to note that these hydrochemical signatures cannot be related to anthropogenic pollutants because, in the area, agricultural activities and fish farming operations are not responsible for the sulphate increase in the stream [13,64].
The mean δ18O content that was measured at sampling point St1 during the post-seismic phase (years 2018, 2019 and 2021) is equal to −9.67 ± 0.16 ‰ vs V-SMOW. By applying the δ18O elevation relation obtained by Fronzi et al. [13], a mean recharge area of 1371 ± 48 m a.s.l. is derived. Instead, the mean hydrologic basin elevation upstream to St1 (calculated from the DTM) is about 1106 m a.s.l. This result, together with the tracer test results, suggests that there is an external groundwater contribution towards St1 coming from the Pian Grande Plain (about 1300 m a.s.l.) that collects the rainfall water from the surrounding reliefs (having higher elevation). The mean δ18O content that was measured at the S sampling point after the seismic sequence is equal to −9.87 ± 0.17 ‰ vs V-SMOW. This value corresponds to an elevation of the recharge area that is equal to 1430 ± 51 m a.s.l. It can also be observed that the SO4 content of this spring is much lower than that observed in St1. This can be explained by observing that the recharge area of S spring is likely to be limited to the top area of Patino Mt., having an average elevation of about 1460 m a.s.l. In this area, part of the outcropping formations, including Calcare Massiccio, are overthrusted above the Maiolica and Scaglia Calcarea complexes (Figure 9) and do not interact with the evaporites, so the SO4 content is low.

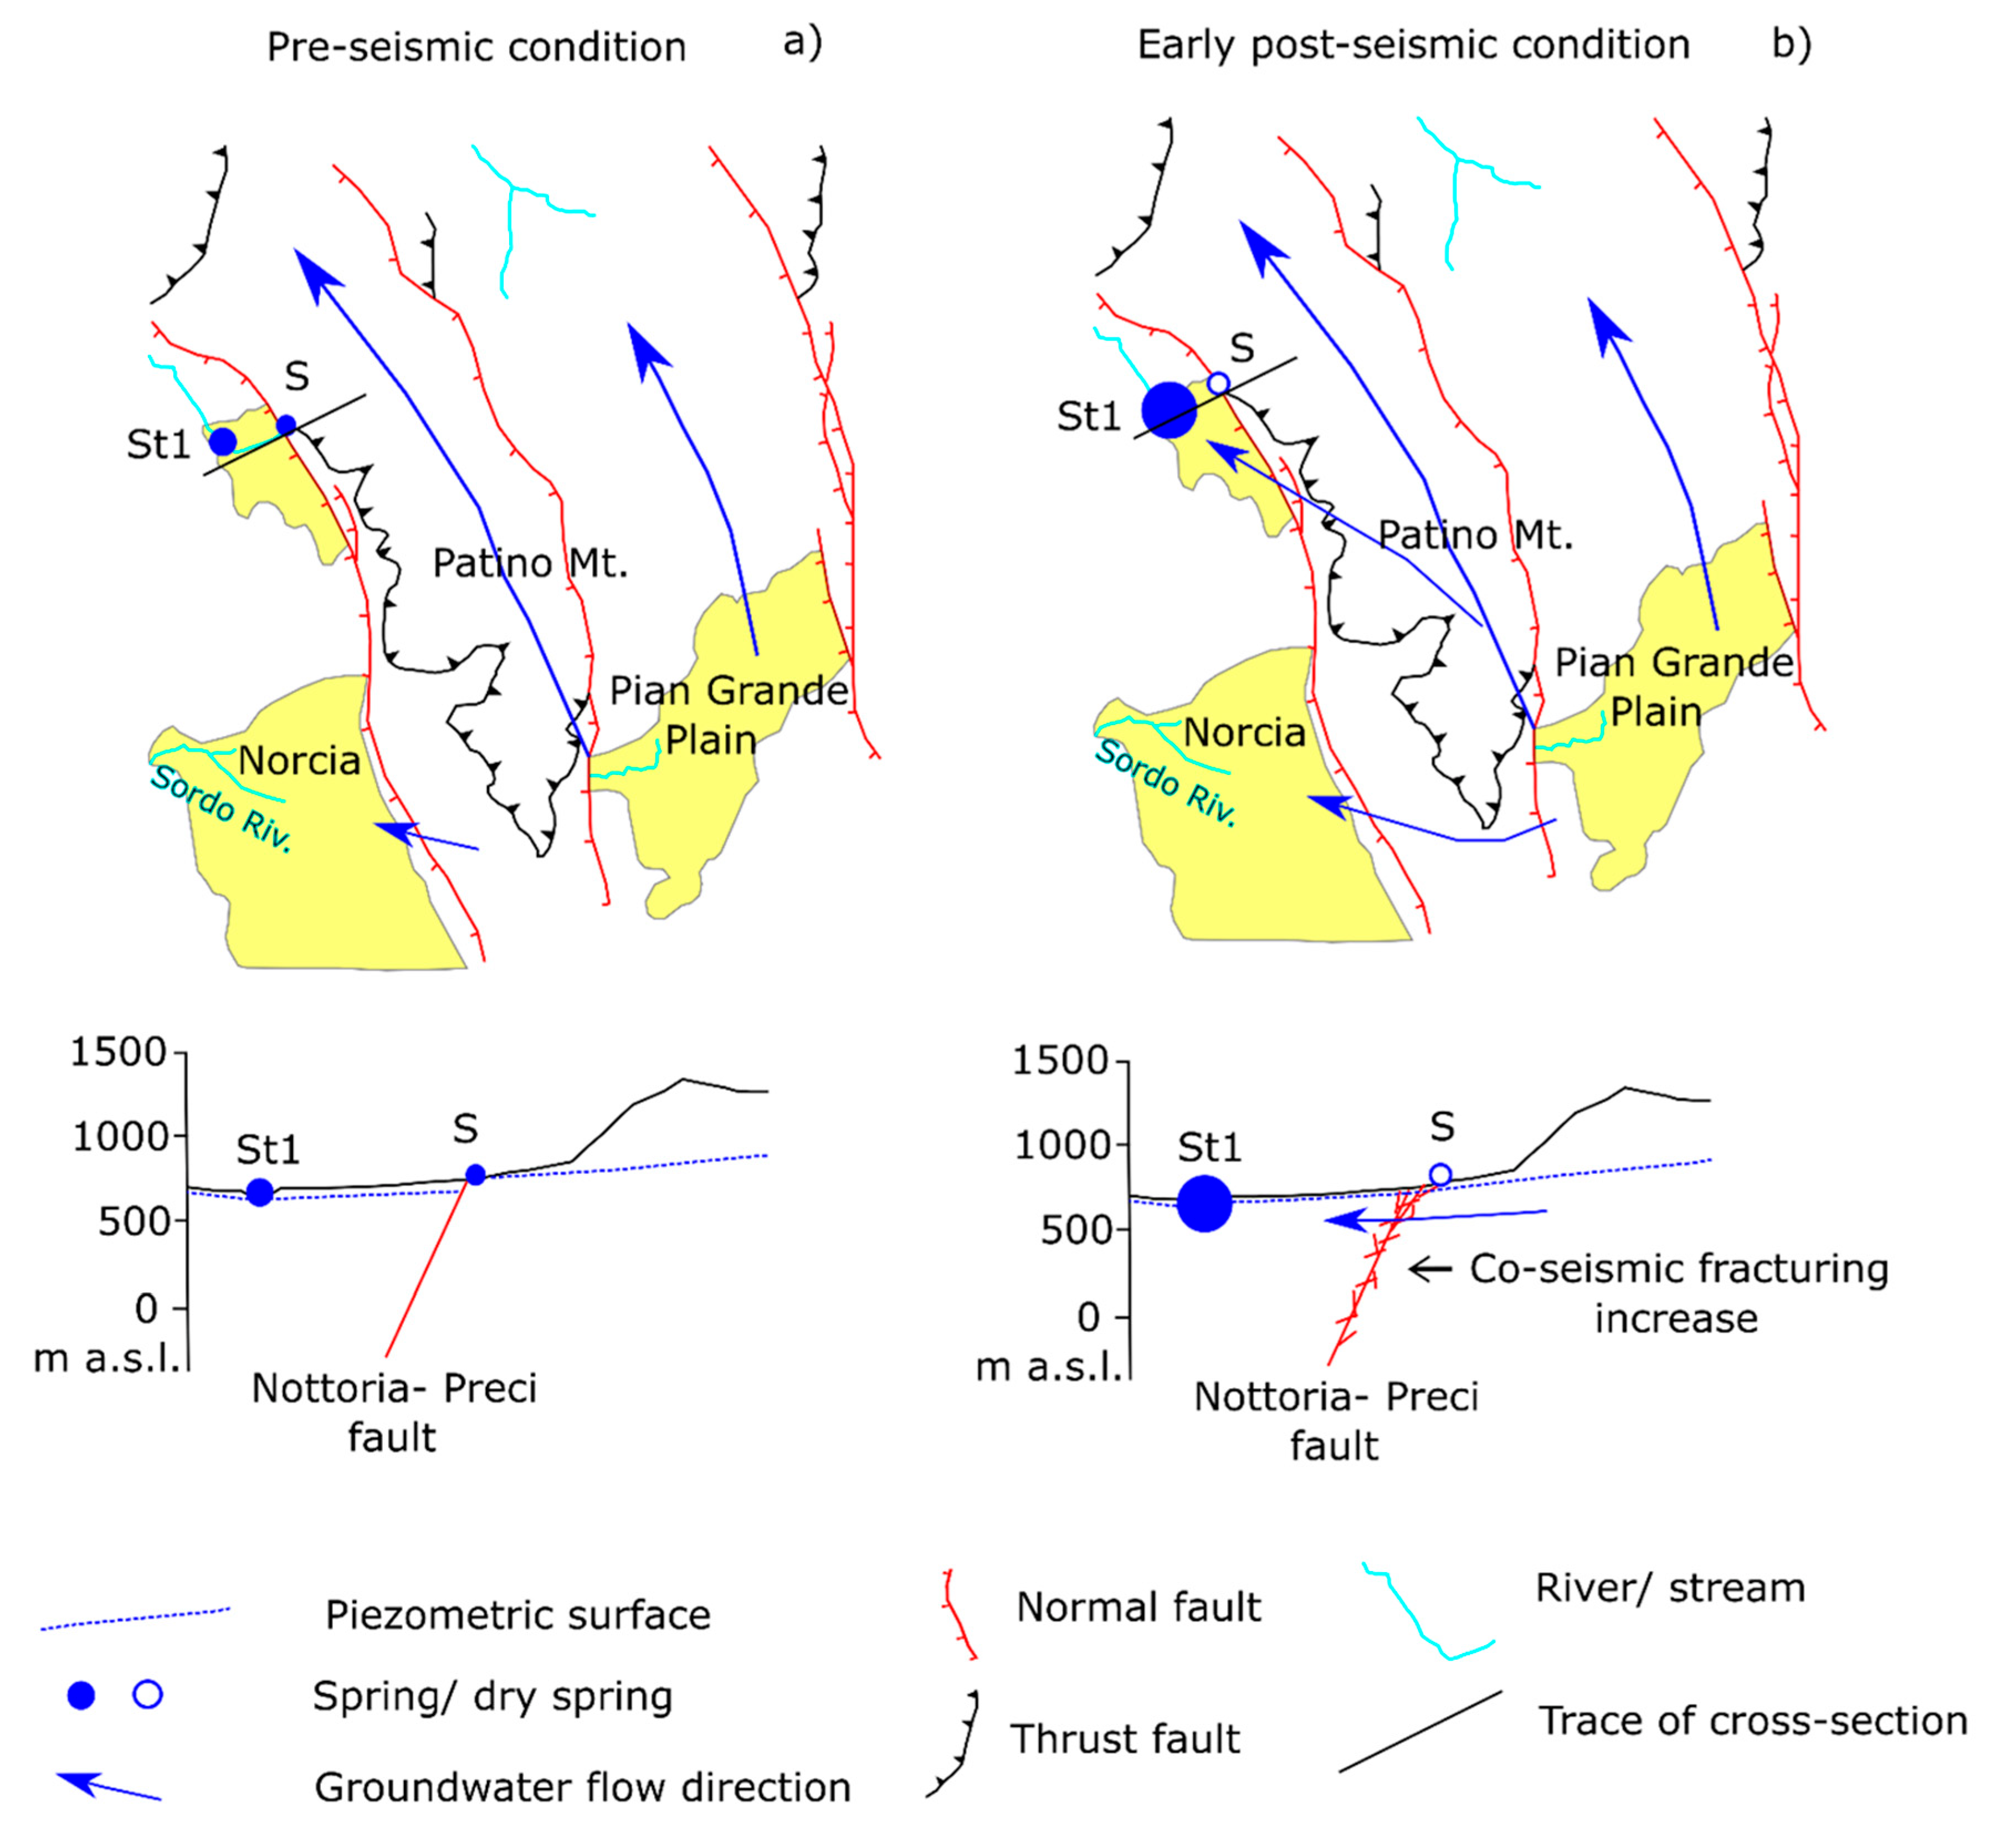
5.4. Hydrogeological Conceptual Model

The hydrogeological conceptual model proposed in this study is the result of a combined analysis of the geo-structural setting of the investigated area, associated with the outcomes of artificial tracer tests, hydrochemical and isotopic evidence, all validated by a deep observation of the hydrogeological sections. Figure 9 reports the hydrogeological map resulting from this study with schematic cross sections (Apennine and anti-Apennine direction) outlining the main contacts among aquifers and an overall indication of the groundwater flow direction within the Basal aquifer. During the pre-seismic period, regional normal faults acted as barriers to groundwater flow in the direction parallel to their strike [6,7], as also highlighted by other studies conducted in the area [14,48]. However, in the post-seismic period, other authors [14,15,48] demonstrated how the increase in permeability due to the co-seismic ruptures allowed a groundwater transfer from the eastern to the western sectors of the Sibillini Mts. This groundwater transfer has favoured a significant discharge increase in the co-seismic period in rivers located westward and northward of the Sibillini Mts. Massif [10], later followed by a gradual but years-long discharge decrease. This last aspect is also evidenced in this study for the Campiano stream (Figure 3) with discharge values decreasing from about 0.5 m3/s to 0.2 m3/s in St1 and from about 1.2 m3/s to 0.6 m3/s in St2.
With the aim of supporting the hydrogeological model of the Campiano stream area and to demonstrate the groundwater–surface water interaction after strong seismic events, artificial tracer tests provide extremely valuable information. Moreover, tracers were useful to validate the hydraulic contacts that were previously hypothesized by examining post-seismic discharge data, and to calculate some hydrodynamic parameters, such as mean tracer velocity and tracer transient time (first and mean). Indeed, during the post-seismic phase, a hydraulic connection between the hydrostructures located eastward of the Nottoria–Preci fault and the Campiano stream (in St1) was demonstrated. In fact, the tracer that was injected into the Mergàni sinking stream was detected in the Campiano stream during the post-seismic period after 45 days in TEST4 and 81 days in TEST5, providing robust evidence of the westward groundwater flow diversion across the fault and hence perpendicular to it. Tracer was not detected in the pre-seismic period [49], confirming the role of the hydraulic barrier played by the Nottoria–Preci fault in the inter-seismic period (before years 2016–2017). This aspect has also been highlighted by Viaroli et al. [21], who demonstrated that only the Scaglia Calcarea complex fed the Campiano stream, and that the Nottoria–Preci fault acted as a hydraulic barrier putting in contact the Basal aquifer and the Scaglia Calcarea aquifer (cross-section B–B’ in Figure 9). In this proposed hydrogeological conceptual model, the results of the hydrochemical analyses contributed to clarifying the provenience of the groundwater amount which is responsible for the post-seismic discharge increase in St1 and St2. In fact, the increasing discharge in the Campiano stream after the main earthquakes (as well as for the Sordo River and Torbidone spring) together with an occurrence of a sulphate rich component, strengthen the hypothesis of groundwater coming from the Basal aquifer, which has prolonged interaction with the Triassic evaporites. Eventually, isotope hydrology outcomes confirm the external groundwater contribution with respect to the hydrologic basin itself as they suggest that water comes from an elevation of about 1300 m a.s.l., consistent with the hypothesis of a contribution from Pian Grande Plain and its surrounding reliefs which are located at higher elevation with respect to the mean elevation of the Campiano stream area. The evidence from hydrochemistry, tracer tests and recession analyses of the stream hydrograph confirms this hydrogeological interpretation, according to which a groundwater transfer across the Nottoria–Preci fault occurred in the post-seismic period. The geological model shown in Figure 9 supports the hydrogeological interpretation that was proposed and explains the observed significant discharge variations. We show here the most representative cross-sections in the Campiano spring area (sections A–A’, B–B’ and L–L’ in Figure 9). The longitudinal section L-L’ of Figure 8 shows, in fact, a groundwater connection between the Pian Grande Plain and the Campiano stream, as evidenced by the light blue arrows. In this framework, the Nottoria–Preci fault plays a non-negligible role in groundwater connection between the Basal and the Scaglia Calcarea aquifer, as evidenced by the transversal cross-section A–A’ and B–B’ of Figure 9.
In this context, the increase in hydraulic conductivity across the Nottoria–Preci fault that is due to the intense fracturing produced by the seismic shocks, determined a faster drainage of the aquifer and a consequent lowering of the piezometric level (Figure 10). This led to the drying up of springs—located at a higher elevation in the fault area—(red dots in Figure 1) which are still dry, probably due also to a concomitant drought period during the post-seismic period. On the other hand, the arrival of water coming from the southeast through the Nottoria–Preci fault system caused an increase in discharge in the monitored rivers and streams located west of the Nottoria–Preci fault system, where co-seismic ruptures were observed [28,29]. Valerio et al. [65] reported the co-seismic ground deformations related to the Mw 6.5 Norcia earthquake evidencing a subsidence, up to 98 cm, in the area between the Vettore Mt.–Bove Mt. fault system and the Nottoria–Preci fault (where S is located) and a smaller uplift west of this last area (where St1 and St2 are located). These deformations seem to be less relevant than the co-seismic fracturing along the Nottoria–Preci on the post-seismic behaviour of the Campiano stream.

6. Conclusions

Discharge data that was collected from the monitoring points along the Campiano stream, and the analysis of their trends, compared with those of Torbidone spring and Sordo River, suggest that a groundwater surplus occurred immediately after the main seismic shock of 30 October 2016 (Mw = 6.5). A general progressive discharge decrease was then observed since, 2017. At the same time the drying up of the punctual springs located at a higher elevation along the Nottoria–Preci fault system was observed. We interpret these changes as due to an increase in the fault zone permeability due to co-seismic ruptures and a clean-up of existing fractures, which led to the lowering of the saturated zone and the drying of the spring. At the same time, a westward groundwater transfer across the strike of the fault determined an initial increase in streams and rivers discharge. This was followed by a progressive discharge decrease due to the emptying of the aquifer, to be related to an increase in permeability caused by the fracturing of the aquifer that was feeding the stream. The effect of the aquifer emptying was possibly amplified by the low groundwater recharge caused by low rainfall values. The superposition of the two effects could be investigated in more detail in future studies.
The proposed hydrogeological model is supported by tracer test evidence which highlights tracer arrivals after the seismic events that were not detected in the pre-seismic period.
The approach used in this study, which combines flow measurements; geochemical and isotopic data; tracer testing; and geological cross-sections, shows how the role of faults is essential in groundwater circulation, and how the latter, if directly connected to surface circulation, can influence the economic and social dynamics of an area.

Author Contributions

Conceptualization, E.M., D.F., C.C. (Costanza Cambi), F.M. and D.V.; methodology, E.M., D.F., C.C. (Costanza Cambi), F.M., C.C. (Carlo Cardellini), A.T. and D.V.; software, E.M., D.F.; validation, E.M., D.F., C.C. (Costanza Cambi), F.M., C.C. (Carlo Cardellini), and D.V.; formal analysis, E.M., D.F., S.C.; investigation, E.M., D.F., C.C. (Costanza Cambi), F.M., C.C. (Carlo Cardellini), and D.V.; resources, E.M., D.F., C.C. (Costanza Cambi), F.M., C.C. (Carlo Cardellini), and D.V.; data curation, E.M., D.F., D.V., C.C. (Costanza Cambi), C.C. (Carlo Cardellini), A.T. and F.M.; writing—original draft preparation, E.M., D.F.; writing—review and editing, C.C. (Costanza Cambi), F.M., C.C. (Carlo Cardellini) D.V.; visualization, E.M., D.F., E.P., F.M. and C.C. (Carlo Cardellini); supervision, D.V.; project administration, D.V.; funding acquisition, D.V., A.T. All authors have read and agreed to the published version of the manuscript.

Funding

This work was supported by Regione Umbria, Italy, under Grant ‘Interventi di emergenza previsti dall’Ordinanza del Capo del Dipartimento di Protezione Civile del 26 agosto 2016, n. 388′. This work was also supported by Autorità di Bacino Distrettuale dell’Appennino Centrale: Progetto “Restart-Obiettivo 2 “Riprogrammazione delle risorse idriche a causa degli eventi sismici indotti” attività A7 e A8. Ricerca finalizzata alla “revisione dei modelli concettuali dei corpi idrici sotterranei e valutazione dei relativi bilanci a seguito degli effetti indotti dagli eventi sismici del 2016–2017”.

Institutional Review Board Statement

Not applicable.

Informed Consent Statement

Not applicable.

Data Availability Statement

Not applicable.

Acknowledgments

The authors kindly acknowledge Roberto Checcucci as supervisor of the Regione Umbria Grant, and Manuela Ruisi (Autorità di Bacino Distrettuale dell’Appennino Centrale-Area Risorsa Idrica) as supervisor of the Restart project. The authors wish to acknowledge Marco Stelluti of the “Risorse Idriche e Rischio Idraulico” sector of Regione Umbria for having provided rainfall data, taken discharge measurements and provided valuable logistic support; Federico Marchettoni and Gianluca Tinarello for their support in discharge measurements; and Mirco Marcellini for supporting the laboratory analyses.

Conflicts of Interest

The authors declare no conflict of interest.

References

  1. Hauksson, E. Radon Content of Groundwater as an Earthquake Precursor: Evaluation of Worldwide Data and Physical Basis. J. Geophys. Res. Solid Earth 1981, 86, 9397–9410. [Google Scholar] [CrossRef] [Green Version]
  2. King, C.-Y.; Zhang, W.; Zhang, Z. Earthquake-Induced Groundwater and Gas Changes. Pure Appl. Geophys. 2006, 163, 633–645. [Google Scholar] [CrossRef]
  3. Ingebritsen, S.E.; Manga, M. Hydrogeochemical Precursors. Nat. Geosci. 2014, 7, 697–698. [Google Scholar] [CrossRef]
  4. Ingebritsen, S.E.; Manga, M. Earthquake Hydrogeology. Water Resour. Res. 2019, 55, 5212–5216. [Google Scholar] [CrossRef] [Green Version]
  5. Elkhoury, J.E.; Brodsky, E.E.; Agnew, D.C. Seismic Waves Increase Permeability. Nature 2006, 441, 1135–1138. [Google Scholar] [CrossRef]
  6. Bense, V.F.; Gleeson, T.; Loveless, S.E.; Bour, O.; Scibek, J. Fault Zone Hydrogeology. Earth-Sci. Rev. 2013, 127, 171–192. [Google Scholar] [CrossRef]
  7. Sibson, R.H. Fluid Flow Accompanying Faulting: Field Evidence and Models. Earthq. Predict. Int. Rev. 1981, 4, 593–603. [Google Scholar]
  8. Manga, M. Origin of Postseismic Streamflow Changes Inferred from Baseflow Recession and Magnitude-Distance Relations. Geophys. Res. Lett. 2001, 28, 2133–2136. [Google Scholar] [CrossRef] [Green Version]
  9. Mohr, C.H.; Manga, M.; Wang, C.-Y.; Korup, O. Regional Changes in Streamflow after a Megathrust Earthquake. Earth Planet. Sci. Lett. 2017, 458, 418–428. [Google Scholar] [CrossRef] [Green Version]
  10. Petitta, M.; Mastrorillo, L.; Preziosi, E.; Banzato, F.; Barberio, M.D.; Billi, A.; Cambi, C.; De Luca, G.; Di Carlo, G.; Di Curzio, D.; et al. Water-Table and Discharge Changes Associated with the 2016–2017 Seismic Sequence in Central Italy: Hydrogeological Data and a Conceptual Model for Fractured Carbonate Aquifers. Hydrogeol. J. 2018, 26, 1009–1026. [Google Scholar] [CrossRef] [Green Version]
  11. Wang, C.-Y.; Manga, M. New Streams and Springs after the 2014 Mw6.0 South Napa Earthquake. Nat. Commun. 2015, 6, 7597. [Google Scholar] [CrossRef] [PubMed] [Green Version]
  12. Valigi, D.; Fronzi, D.; Cambi, C.; Beddini, G.; Cardellini, C.; Checcucci, R.; Mastrorillo, L.; Mirabella, F.; Tazioli, A. Earthquake-Induced Spring Discharge Modifications: The Pescara Di Arquata Spring Reaction to the August–October 2016 Central Italy Earthquakes. Water 2020, 12, 767. [Google Scholar] [CrossRef] [Green Version]
  13. Fronzi, D.; Mirabella, F.; Cardellini, C.; Caliro, S.; Palpacelli, S.; Cambi, C.; Valigi, D.; Tazioli, A. The Role of Faults in Groundwater Circulation before and after Seismic Events: Insights from Tracers, Water Isotopes and Geochemistry. Water 2021, 13, 1499. [Google Scholar] [CrossRef]
  14. Mastrorillo, L.; Saroli, M.; Viaroli, S.; Banzato, F.; Valigi, D.; Petitta, M. Sustained Post-seismic Effects on Groundwater Flow in Fractured Carbonate Aquifers in Central Italy. Hydrol. Process. 2020, 34, 1167–1181. [Google Scholar] [CrossRef] [Green Version]
  15. Valigi, D.; Mastrorillo, L.; Cardellini, C.; Checcucci, R.; Di Matteo, L.; Frondini, F.; Mirabella, F.; Viaroli, S.; Vispi, I. Springs Discharge Variations Induced by Strong Earthquakes: The Mw 6.5 Norcia Event (Italy, October 30th 2016). Rend. Online Soc. Geol. Ital. 2019, 47, 141–146. [Google Scholar] [CrossRef]
  16. Howard, J.; Merrifield, M. Mapping Groundwater Dependent Ecosystems in California. PLoS ONE 2010, 5, e11249. [Google Scholar] [CrossRef] [Green Version]
  17. Lizundia, B.; Shrestha, S.N.; Bevington, J.; Davidson, R.; Jaiswal, K.; Jimee, G.K.; Kaushik, H.; Kumar, H.; Kupec, J.; Mitrani-Reiser, J. M7. 8 Gorkha, Nepal Earthquake on April 25, 2015 and Its Aftershocks. In EERI Earthquake Reconnaissance Team Report; Earthquake Engineering Research Institute: Oakland, CA, USA, 2016; pp. 1–185. [Google Scholar]
  18. Calamita, F.; Deiana, G. Evoluzione Strutturale Neogenico-Quaternaria Dell’Appennino Umbro-Marchigiano. In Proceedings of the Studi Geologici Camerti, Congresso Società Geologica Italiana 73°, Roma, Italy, 30 September–4 October 1986; pp. 91–98. [Google Scholar]
  19. Brozzetti, F.; Lavecchia, G. Seismicity and Related Extensional Stress Field: The Case of the Norcia Seismic Zone (Central Italy). Ann. Tecton. 1994, 8, 36–57. [Google Scholar]
  20. Porreca, M.; Minelli, G.; Ercoli, M.; Brobia, A.; Mancinelli, P.; Cruciani, F.; Giorgetti, C.; Carboni, F.; Mirabella, F.; Cavinato, G. Seismic Reflection Profiles and Subsurface Geology of the Area Interested by the 2016–2017 Earthquake Sequence (Central Italy). Tectonics 2018, 37, 1116–1137. [Google Scholar] [CrossRef]
  21. Viaroli, S.; Mirabella, F.; Mastrorillo, L.; Angelini, S.; Valigi, D. Fractured Carbonate Aquifers of Sibillini Mts.(Central Italy). J. Maps 2021, 17, 140–149. [Google Scholar] [CrossRef]
  22. Boccaletti, M.; Calamita, F.; Viandante, M.G. La Neo-Catena Litosferica Appenninica Nata a Partire Dal Pliocene Inferiore Come Espressione Della Convergenza Africa-Europa. Boll. Della Soc. Geol. Ital. 2005, 124, 87–105. [Google Scholar]
  23. Mazzoli, S.; Pierantoni, P.P.; Borraccini, F.; Paltrinieri, W.; Deiana, G. Geometry, Segmentation Pattern and Displacement Variations along a Major Apennine Thrust Zone, Central Italy. J. Struct. Geol. 2005, 27, 1940–1953. [Google Scholar] [CrossRef]
  24. Centamore, E.; Rossi, D. Neogene-Quaternary Tectonics and Sedimentation in the Central Apennines. Boll. Della Soc. Geol. Ital. 2009, 128, 73–88. [Google Scholar]
  25. Di Domenica, A.; Turtù, A.; Satolli, S.; Calamita, F. Relationships between Thrusts and Normal Faults in Curved Belts: New Insight in the Inversion Tectonics of the Central-Northern Apennines (Italy). J. Struct. Geol. 2012, 42, 104–117. [Google Scholar] [CrossRef]
  26. Scisciani, V.; Patruno, S.; Tavarnelli, E.; Calamita, F.; Pace, P.; Iacopini, D. Multi-Phase Reactivations and Inversions of Paleozoic–Mesozoic Extensional Basins during the Wilson Cycle: Case Studies from the North Sea (UK) and the Northern Apennines (Italy). Geol. Soc. Lond. Spec. Publ. 2019, 470, 205–243. [Google Scholar] [CrossRef]
  27. Chiaraluce, L.; Di Stefano, R.; Tinti, E.; Scognamiglio, L.; Michele, M.; Casarotti, E.; Cattaneo, M.; De Gori, P.; Chiarabba, C.; Monachesi, G. The 2016 Central Italy Seismic Sequence: A First Look at the Mainshocks, Aftershocks, and Source Models. Seismol. Res. Lett. 2017, 88, 757–771. [Google Scholar] [CrossRef]
  28. Civico, R.; Pucci, S.; Villani, F.; Pizzimenti, L.; De Martini, P.M.; Nappi, R.; Group, O.E.W. Surface Ruptures Following the 30 October 2016 M w 6.5 Norcia Earthquake, Central Italy. J. Maps 2018, 14, 151–160. [Google Scholar] [CrossRef] [Green Version]
  29. Brozzetti, F.; Boncio, P.; Cirillo, D.; Ferrarini, F.; De Nardis, R.; Testa, A.; Liberi, F.; Lavecchia, G. High-resolution Field Mapping and Analysis of the August–October 2016 Coseismic Surface Faulting (Central Italy Earthquakes): Slip Distribution, Parameterization, and Comparison with Global Earthquakes. Tectonics 2019, 38, 417–439. [Google Scholar] [CrossRef] [Green Version]
  30. Pierantoni, P.; Deiana, G.; Galdenzi, S. Stratigraphic and Structural Features of the Sibillini Mountains (Umbria-Marche Apennines, Italy). Ital. J. Geosci. 2013, 132, 497–520. [Google Scholar] [CrossRef]
  31. Principi, P. Idrologia Sotterranea Della Pianura Di Norcia. Boll. Soc. Geol. Ital. 1911, 30, 849–862. [Google Scholar]
  32. Lippi Boncambi, C. Idrologia Sotterranea Dell’Altipiano Di Castelluccio; Annali Istituto di Mineralogia e Geologia dell’Università degli Studi di Perugia: Perugia, Italy, 1969; pp. 104–118. [Google Scholar]
  33. Lippi Boncambi, C. Indagini Idrogeologiche Sull’altipiano Di Castelluccio Di Norcia. In Proceedings of the Atti del IX Congresso Nazionale di Speleologia, Trieste, Italy, 20 September–2 October 1963. [Google Scholar]
  34. Cencetti, C.; Dragoni, W.; Nejad Massoum, M. Contributo Alle Conoscenze Delle Caratteristiche Idrogeologiche Del Fiume Nera (Appennino Centro-Settentrionale). Geol. Appl. E Idrogeol. 1989, 24, 191–210. [Google Scholar]
  35. Boni, C.; Falcone, M.; Giaquinto, S.; Martini, E.; Zoppis, L.; Marchetti, G.; Martinelli, A. Risorse Idriche Sotterranee Dei Massicci Carbonatici Umbri. Acque Sotter. Umbria 1991, 413, 49–64. [Google Scholar]
  36. Nanni, T.; Vivalda, P. Caratteri Idrogeologici Delle Sorgenti Carbonatiche Dell’Appennino Marchigiano. Conv Naz Su Ri-Cerche E Prot. Delle Risorse Idriche Sotter. Delle Aree Montuose 1992, 1, 269–331. [Google Scholar]
  37. Boni, C.; Preziosi, E. Le Sorgenti Lineari Nell’alto Bacino Del Fiume Nera (Appennino Umbro–Marchigiano Italia Centrale). In Proceedings of the Atti dell’International Meeting for Young Researchers in Applied Geology, Peveragno, Italy, 11–13 October 1994; pp. 31–35. [Google Scholar]
  38. Mastrorillo, L.; Baldoni, T.; Banato, F.; Boscherini, A.; Cascone, D.; Checcucci, R.; Petitta, M.; Boni, C. Analisi Idrogeologica Quantitativa Del Dominio Carbonatico Umbro. Ital. J. Eng. Geol. Environ. 2009, 1, 137–155. [Google Scholar]
  39. Mastrorillo, L. Contributo Alla Valutazione Delle Risorse Idriche Sotterranee Dell’Appennino Carbonatico Marchigiano. Quad. Geol. Appl. 1996, 1, 25–35. [Google Scholar]
  40. Mastrorillo, L. Elementi Strutturali e Caratteristiche Idrogeologiche Della Dorsale Carbonatica Umbro-Marchigiana Interna. Mem. Della Soc. Geol. Ital. 2001, 56, 219–226. [Google Scholar]
  41. Boscherini, A.; Checcucci, R.; Natale, G.; Natali, N. Carta Idrogeologica Della Regione Umbria a Scala 1: 100.000. G. Geol. Appl. 2005, 2, 399–404. [Google Scholar]
  42. Tarragoni, C. Determinazione Della “Quota Isotopica” Del Bacino Di Alimentazione Delle Principali Sorgenti Dell’alta Valnerina. Geol. Romana 2006, 39, 55–62. [Google Scholar]
  43. Boni, C.; Ruisi, M. Le Grandi Sorgenti Che Alimentano Il Corso Del Fiume Nera-Velino: Una Importante Risorsa Strategica Nell’economia Dell’Italia Centrale. Atti Dei Convegni Lincei-Accad. Naz. Dei Lincei 2008, 232, 141. [Google Scholar]
  44. Boni, C.; Petitta, M. Redazione Informatizzata Della Cartografia Idrogeologica Tematica Del Territorio Della Regione Umbria. Tech. Note 2008, 2008, 131. [Google Scholar]
  45. Boni, C.F.; Baldoni, T.; Banzato, F.; Cascone, D.; Petitta, M. Studio Idrogeologico per l’identificazione, La Caratterizzazione e La Gestione Degli Acquiferi Del Parco Nazionale Dei Monti Sibillini. Ital. J. Eng. Geol. Env. 2010, 2, 21–39. [Google Scholar]
  46. Martinis, B. Alcune Informazioni Sulla Formazione Evaporitica Del Triassico Superiore Nell’Italia Centrale Meridionale. Mem. Soc. Geol. Ital. 1964, 4, 649–678. [Google Scholar]
  47. Petitta, M. Integrazione Della Base Conoscitiva per La Gestione Della Risorsa Idrica Sotterranea Del Parco Nazionale Dei Monti Sibillini; Technical Report for Internal Use; Parco Nazionale dei Monti Sibillini: Visso, Italy, 2011; p. 101. [Google Scholar]
  48. Valigi, D.; Cardellini, C.; Mirabella, F.; Tazioli, A.; Petitta, M.; Caliro, S.; Cambi, C.; Banzato, F.; Beddini, G.; Fronzi, D.; et al. Contributo Alla Ricerca Caratterizzazione Dei Sistemi Idrogeologici Del Territorio Umbro Influenzato Dagli Eventi Sismici Del 26–30 Ottobre 2016 e Valutazione Degli Effetti Del Sisma Sull’approvvigionamento Idrico 2019. 2019, pp. 1–212. Available online: https://www.regione.umbria.it/-/caratterizzazione-dei-sistemi-idrogeologici-del-territorio-umbro-influenzato-dagli-eventi-sismici-2016-e-valutazione-degli-effetti-del-sisma-su-approv (accessed on 29 April 2022).
  49. Nanni, T.; Vivalda, P.M.; Palpacelli, S.; Marcellini, M.; Tazioli, A. Groundwater Circulation and Earthquake-Related Changes in Hydrogeological Karst Environments: A Case Study of the Sibillini Mountains (Central Italy) Involving Artificial Tracers. Hydrogeol. J. 2020, 28, 2409–2428. [Google Scholar] [CrossRef]
  50. Maillet, E. Essais d’Hydraulique Souterraine et Fluviale [Underground and River Hydrology]; Hermann: Paris, France, 1905; p. 218. [Google Scholar]
  51. Fronzi, D.; Di Curzio, D.; Rusi, S.; Valigi, D.; Tazioli, A. Comparison between Periodic Tracer Tests and Time-Series Analysis to Assess Mid- and Long-Term Recharge Model Changes Due to Multiple Strong Seismic Events in Carbonate Aquifers. Water 2020, 12, 3073. [Google Scholar] [CrossRef]
  52. Di Matteo, L.; Dragoni, W.; Azzaro, S.; Pauselli, C.; Porreca, M.; Bellina, G.; Cardaci, W. Effects of Earthquakes on the Discharge of Groundwater Systems: The Case of the 2016 Seismic Sequence in the Central Apennines, Italy. J. Hydrol. 2020, 583, 124509. [Google Scholar] [CrossRef]
  53. Di Matteo, L.; Capoccioni, A.; Porreca, M.; Pauselli, C. Groundwater-Surface Water Interaction in the Nera River Basin (Central Italy): New Insights after the 2016 Seismic Sequence. Hydrology 2021, 8, 97. [Google Scholar] [CrossRef]
  54. Biella, G.; Lavecchia, G.; Lozey, A.; Pialli, G.; Scarascia, S. Primi Risultati Di Un’indagine Geofisica e Interpretazione Geologica Del Piano Di S. Scolastica e Del Piano Grande (Norcia, PG). In Proceedings of the Convegno Annuale G.N.G.T.S.; Atti 1° Convegno Gruppo Naz. Geof. Terra Solida, Roma, Italy. 1981, pp. 293–308. Available online: https://ricerca.unich.it/handle/11564/505514?mode=full.23#.XyDyzecRVPZ (accessed on 29 April 2022).
  55. Lippi Boncambi, C. Soil Observations on the Sibillini Mountains, in Particular on the Peaty Soils of the Castelluccio Di Norcia Plain. Boll. Soc. Geol. Ital. 1950, 69, 26–37. [Google Scholar]
  56. Villani, F.; Maraio, S.; Bruno, P.P.; Improta, L.; Wood, K.; Pucci, S.; Civico, R.; Sapia, V.; De Martini, P.M.; Brunori, C.A. High-Resolution Seismic Profiling in the Hanging Wall of the Southern Fault Section Ruptured During the 2016 Mw 6.5 Central Italy Earthquake. Tectonics 2021, 40, e2021TC006786. [Google Scholar] [CrossRef]
  57. Na, G.M. Geomineraria Nazionale Ligniti e Torbe Dell’Italia Centrale; Geo Mineraria Nazionale: Torino, Italy, 1962. [Google Scholar]
  58. Coltorti, M.; Farabollini, P. Quaternary Evolution of the Castelluccio Di Norcia Basin (Umbro-Marchean Apennines, Central Italy). Il Quat. 1995, 8, 149–166. [Google Scholar]
  59. Field, M.S. The QTRACER2 Program for Tracer-Breakthrough Curve Analysis for Tracer Tests in Karstic Aquifers and Other Hydrologic Systems; National Center for Environmental Assessment—Washington Office: Washington, DC, USA, 2002.
  60. Console, F.; Motti, A.; Pantaloni, M. L’intermittenza Delle Sorgenti Del Torbidone Nella Piana Di Norcia: Analisi Delle Fonti Storiche a Partire Dal XIV Secolo. Rend Online Soc. Geol. Ital. 2017, 43, 36–56. [Google Scholar] [CrossRef]
  61. Civita, M.V.; Fiorucci, A. The Recharge-Discharge Process of the Peschiera Spring System (Central Italy). Aqua. Mundi. 2010, 1, 161–178. [Google Scholar]
  62. Giacopetti, M.; Materazzi, M.; Pambianchi, G.; Posavec, K. Analysis of Mountain Springs Discharge Time Series in the Tennacola Stream Catchment (Central Apennine, Italy). Environ. Earth Sci. 2017, 76, 20. [Google Scholar] [CrossRef]
  63. Tamburini, A.; Menichetti, M. Groundwater Circulation in Fractured and Karstic Aquifers of the Umbria-Marche Apennine. Water 2020, 12, 1039. [Google Scholar] [CrossRef] [Green Version]
  64. ARPA. Umbria Monitoraggio Dell’impatto Ambientale Degli Impianti Di Troticoltura in Valnerina—Monitoring of the Environmental Impact of Trout Farms in Valnerina 2002; ARPA Umbria: Terni, Italy, 2002. [Google Scholar]
  65. Valerio, E.; Tizzani, P.; Carminati, E.; Doglioni, C.; Pepe, S.; Petricca, P.; De Luca, C.; Bignami, C.; Solaro, G.; Castaldo, R. Ground Deformation and Source Geometry of the 30 October 2016 Mw 6.5 Norcia Earthquake (Central Italy) Investigated through Seismological Data, DInSAR Measurements, and Numerical Modelling. Remote Sens. 2018, 10, 1901. [Google Scholar] [CrossRef] [Green Version]
Figure 1. Geological sketch of the area with indication of sections monitored for discharge measurements, co-seismic ruptures and mainshocks of the 2016 earthquakes. Geological cross-section traces are indicated.
Hydrology 09 00097 g001
Figure 2. Geological formations and the relative hydrogeological units identified by [45].
Hydrology 09 00097 g002
Figure 3. Discharge trends of St1, St2, Sordo stream and Torbidone Spring measurement sections. Daily rainfall data of Norcia station are reported. The main shocks of 24 August 2016 and 30 October 2016 are indicated with red vertical lines. The blue dashed line tagged with the question mark represents the engineering judgment of the St1 discharge curve for the period October 2016–May 2017.
Hydrology 09 00097 g003
Figure 4. (a) An example of a dried spring located eastward of Campi village; (b) evidence of river discharge increase after the earthquake of 30 October 2016.
Hydrology 09 00097 g004
Figure 5. Recession periods of St1 for the years 2018, 2019, 2020, 2021, with Maillet depletion coefficients. The black solid lines represent the exponential fitting of daily discharge data with R2 values ranging between 0.85 and 0.94 (not shown).
Hydrology 09 00097 g005
Figure 6. Main tracers’ direction from the release point (Mergàni sinking stream) to the analysed basin (Campiano catchment) location of the main tectonic lineaments. (a) Pre-seismic conditions; (b) post-seismic conditions.
Hydrology 09 00097 g006
Figure 7. Tracer Breakthrough Curves of (a) TEST4 and (b) TEST5. The principal vertical axes refer to the discharge recorded in St1 while the secondary vertical axes refer to the tracer concentrations expressed in ppb.
Hydrology 09 00097 g007
Figure 8. (a) Plot of the chemical composition of Campiano stream monitoring points (pre- and post-seismic data are available for St1, while only post-seismic data are available for S and St2) on the Langelier–Ludwig diagram. (b) Detail of the Langelier–Ludwig referring to the box reported in (a).
Hydrology 09 00097 g008
Figure 9. Hydrogeological map and hydrogeological sections of the Campiano River area, modified from [21].
Hydrology 09 00097 g009
Figure 10. Hydrological conceptual model. (a) Pre-seismic condition; (b) early post-seismic condition.
Hydrology 09 00097 g010
Table 1. Discharge variation due to the seismic sequence in three discharge measurement points along Campiano stream.
Discharge
Measurement
Point
Q Pre-Seismic
2007
(L/s)
Q Post-Seismic
2017–2018
(L/s)
Q Post-Seismic
2019–2021
(L/s)
S10<0.1<0.1
St1-290160
St2-770330
Where -: data not available.
Table 2. Geochemical analysis results of 2017–2021 (post-seismic) sampling period on S, St1 and St2 measuring points.
SPDate (dd/mm/yyyy)T (°C)pHEC (μS/cm)Ca2+ (mg/L)Mg2+ (mg/L)Na+ (mg/L)K+ (mg/L)HCO3 (mg/L)Cl (mg/L)SO42− (mg/L)δ18O
(‰ vs SMOW)
S20/06/201711.17.5428056.20.792.230.57180.63.200.97−9.80
S19/07/201797.6526753.90.741.820.41174.53.060.92−10.03
S21/09/20178.97.7227253.90.771.710.25166.53.291.15−9.92
S20/07/20189.37.8028255.00.891.820.24186.43.391.51−9.56
S26/06/201911.88.5727754.30.721.440.48170.23.071.14−9.97
S30/06/20219.47.9129863.01.101.900.52193.03.101.20−9.92
Mean
(post-seismic)
9.97.8727956.10.841.820.41178.53.191.15−9.87
St108/03/2016n.a.n.a.n.a.59.30.781.520.41181.83.281.27n.a.
St118/03/20168.57.5229158.50.711.520.43182.03.561.21n.a.
St129/03/2016n.a.7.63n.a.59.70.801.570.44181.33.791.29n.a.
St112/04/2016n.a.7.26n.a.59.20.781.560.44182.03.461.22n.a.
Mean
(pre-seismic)
8.57.4729159.20.771.540.43181.83.521.25n.a.
St120/07/201811.77.9034162.52.492.381.02205.64.387.72−9.56
St126/06/201913.58.3934663.12.461.981.07196.44.127.29−9.78
St130/06/202110.27.6336173.03.403.301.20242.04.808.60−9.73
Mean
(post-seismic)
11.87.9734966.22.782.551.10214.74.437.87−9.69
St220/07/201814.17.9738070.22.055.411.58233.910.145.28n.a.
St226/06/201910.98.5635867.42.023.143.19209.58.394.85n.a.
St230/06/202112.47.9541082.02.908.901.50280.07.206.10n.a.
Mean
(post-seismic)
12.478.16382.6773.202.325.822.09241.138.585.41n.a
Where: SP = sampling point, EC = electric conductivity and n.a. = data not available.
Publisher’s Note: MDPI stays neutral with regard to jurisdictional claims in published maps and institutional affiliations.

