Abstract
A snowpack’s δ2H and δ18O values evolve with snowfall, sublimation, evaporation, and melt, which produces temporally variable snowpack, snowmelt, and runoff isotope signals. As a snowpack ages, the relatively depleted δ2H and δ18O values of snow will become less depleted with sublimation and evaporation, and the internal distribution of isotope signals is altered with melt moving through and out of the snowpack. An examination of δ2H and δ18O values for snowpack, snowmelt, and ephemeral creek water in the Palouse Range of northern Idaho indicated an evolution from variably depleted snowpack to enriched snowmelt and relatively consistent isotope signals in springtime ephemeral creeks. Within the primary snow band of the mountain range and during the winter–spring period of 2019–2020, the snowpack had an isotope range of −130 to −75‰ for δ2H and −18 to −10.5‰ for δ18O with resulting snowmelt values of −120 to −90‰ for δ2H and −16.5 to −12.5‰ for δ18O. With runoff of snowmelt to ephemeral creeks, the isotope values compressed to −107 to −104‰ for δ2H and −15.5 to −14.5‰ for δ18O. Aging of the snowpack produced increasing densities in the base, middle, and upper layers along with a corresponding enrichment of isotope values. The highest elevation site indicated the least enrichment of δ2H and δ18O in the snowpack base layer, and the lowest elevation site indicated the strongest enrichment of δ2H and δ18O in the snowpack base layer. Deuterium excess decreased with snowpack aging processes of accumulation and melt release, along with the migration of water vapor and snowmelt within the snowpack. It is likely that winter melt (early depleted signal) is a primary contributor to creeks and groundwater along the Palouse Range, but the strong variability of snowpack isotope signals provides a wide range of possible isotope signals to surface-water and groundwater systems at the mountain front.
1. Introduction
Snow is an important hydrologic reservoir that has been exploited as a natural cycle of seasonally available water [,,,,,]. The stable isotopes of water (δ2H and δ18O) can be used to identify source waters and flowpaths [,,,,,,,], but the tracing of snow/snowmelt through a surface- and/or groundwater system can be difficult due to the temporal effect on isotope values with sublimation/evaporation during accumulation (snowpack), melt, and runoff/infiltration [,,,,,,,]. These temporal influences can result in dynamic water stores that contribute potential source waters with variable isotopic signals throughout the seasonal cycle of snowfall → snowpack → snowmelt [,,,,]. However, a snowpack typically contains fewer heavy isotopes (2H and 18O) compared to non-winter precipitation, which can allow for the tracing of snowmelt to other hydrologic systems [,,,,]. The goal of this study was to evaluate the seasonal evolution, or trend, of snowpack isotope signals at multiple elevations and depths, and in turn, understand snowmelt and runoff isotope signals in the snow-dominated Palouse Range of northern Idaho, USA (Figure 1). It was expected that the isotopic lapse rate would produce different isotope signals in the snowpack by elevation [,,] and snowpack evolution, or snowpack aging, would produce seasonal trends in δ2H, δ18O, and deuterium excess (d-excess). This study was part of a larger study examining water isotope signals within the South Fork Palouse River Basin and connections between source waters and surface-water and groundwater systems [,,,].
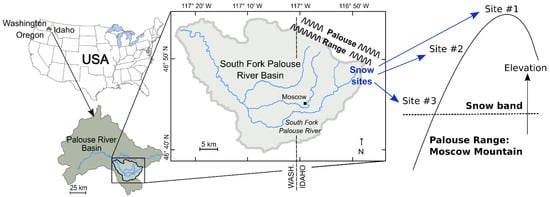
Figure 1.
Study area location in the Palouse Range of the South Fork Palouse River Basin, northern Idaho, USA. Snow sampling network consisted of three sample locations within the primary snow band of Moscow Mountain.
Snowpack is a dynamic reservoir of water storage [,,], where the physical and isotopic properties of a snowpack evolve, or age, from the initial retention of ground snow through to the final sublimation and melt [,,,,]. The aging of a snowpack has a strong influence on the isotopic composition, particularly the redistribution of isotope signals within a snowpack [,,,,]. Migration of water and vapor in a snowpack will occur with sublimation/condensation and evaporation/melt/freeze that will alter the internal distribution of isotope signals and subsequent snowmelt isotopic signals [,,,,,]. Melting of upper layers will produce isotopically different water that percolates through the snowpack and may refreeze at lower layers or exit the snowpack through the seasonal cycle [,,,]. Snowmelt isotope signals will vary with snow inputs and aging of the snowpack from accumulation through final melt and produce seasonally variable runoff isotope signals [,,,,,,,,,,,,,,,]. Additionally, these internal changes in snowpack isotope signals and subsequent snowmelt and runoff isotope signals can vary across a landscape because of temperature and insolation differences from elevation or orientation [,,]. The evolution of the snowpack at different elevations in the study area likely contributes different snowmelt/runoff isotope signals to the surface-water and groundwater systems fed by this mountain snowpack reservoir.
2. Study Area Climate and Precipitation Isotope Signals
To examine the evolution of the snowpack for evaluating snowmelt and runoff isotope signals, a multi-elevation sampling network was established in the Palouse Range of north-central Idaho, USA (Figure 1). The region’s climate is driven by its proximity to the Pacific Ocean and the northern Rocky Mountains, which produces a winter maritime climate and a summer continental climate [,,,]. Annually, this basin receives approximately 60 cm of precipitation (water equivalent), including 126 cm of snowfall []. The Palouse Range snowpack averages a snow-water equivalent of 50 cm at its highest elevations []. The snowpack will develop in late fall and typically last until late spring. Ephemeral creeks will respond to snowmelt and precipitation in winter/spring and may contain flow into summer. These creeks, along with subsurface water, feed downgradient intermittent and perennial creeks along with providing recharge to the local aquifer system of the basin [,,,]. The hydrologic reservoir and recharge source that is the Palouse Range snowpack has produced variable isotope signals in connected surface-water and groundwater systems [,,,].
Precipitation isotope values for the region were predicted to range from strongly depleted winter values (e.g., January values of −169 to −133‰ for δ2H and −22 to −13‰ for δ18O) to relatively enriched summer rainfall (e.g., July values of −103 to −78‰ for δ2H and −14 to −8‰ for δ18O) []. This seasonal contrast in precipitation isotope values results from changes in the northern Pacific jet stream that seasonally shifts vapor sources and precipitation patterns across the region [,,,,]. These shifts result in relatively dry summers with isotopically enriched late spring, summer, or fall rainfall and isotopically depleted and dominant winter/spring precipitation [,,,]. Along with these seasonal changes in isotope signals and precipitation patterns, d-excess typically is lower in the warmer summer/fall precipitation and higher in the winter precipitation [,,].
3. Sample Collection and Data Analysis
3.1. Sampling Sites
As part of a larger study examining water isotopes across the basin [,,], three Palouse Range sites were chosen for sampling of the snowpack and snowmelt in the primary snow band (Figure 1 and Figure 2) where snowfall typically occurs from late November into April. Sites were chosen with glade-like characteristics that would minimize forest effects and allow for snow accumulation in an open-field setting. The sites range in elevation from 1430 m NAVD88 at Site #1, 1300 m at Site #2, to 1190 m at Site #3. As described in Behrens et al. [], a snowpack sampling transect was established at each site to allow for interval trenching and collection of snow as a composite sample (full depth of the snowpack) and samples from the top, middle, and base layers of the snowpack. A snowmelt collector consisting of a 30-cm funnel pan with collection pipe and sampling tube, was installed adjacent to each snowpack transect []. During sampling, the density of the three sampling layers was determined through insertion and removal of a 160-cm3 tube (30 cm length × 2.5 cm diameter) that was weighed with a hanging scale (snowpack density = snow weight/tube volume []). All isotope samples were collected and stored for minimization of atmospheric influence (vacuum-sealed bags for snow, no headspace in glass containers with polyseal caps for water). All isotope samples were analyzed at Washington State University with a Los Gatos Research Liquid Water Isotope Analyzer (instrument precision was ±0.25‰ for δ2H and ±0.05‰ for δ18O). Sampling frequency was monthly from December through February, biweekly in March, and weekly from April until the end of sampling. Snow was present at the sites until April 24 (site #3), May 8 (#2), and May 29 (Site #1). After the loss of the snowpack at each site, rainfall was collected from the snowmelt collectors until June 27. Ephemeral creeks (upper (A), middle (B), and lower (C) ephemeral creeks) located between Sites #2 and #3 (Figure 2) were sampled from March through June when runoff was accessible. The ephemeral creeks consist of small drainages <1 m in width and are first order streams in the upper portion of the watershed.
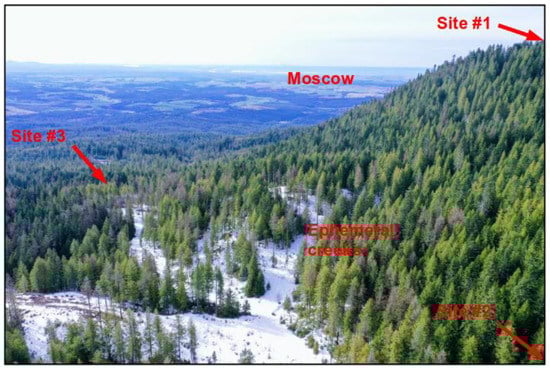
Figure 2.
Sample collection locations along the eastern Palouse Range from a drone view looking towards Moscow, Idaho, USA.
3.2. Snow Density and Isotope Trendlines
The results of the study were compared through seasonal shifts (trends) in snow density and δ2H and δ18O values of snow, snowmelt, and ephemeral creek water. Snow density values were compared by elevation and layer against time to evaluate the physical alteration of the snowpack with aging. Linear regression trendlines (meteoric water lines) of composite isotope values were used to evaluate isotopic shifts by elevation through changes in trendline slope. Density and δ18O trendlines were compared to evaluate the influence of snowpack aging on the isotope signal of the snowpack layers and redistribution of the isotope signals within the snowpack. Trendlines of layer values were used to evaluate shifts in each layer and expected snowmelt isotope signal from the release point (base layer). R values of the trendlines are provided to indicate strength and variability of the correlation (positively or negatively linear) for the trend direction. The goal of the linear regression trendline is to indicate an overall increase or decrease with the seasonal transition from winter to spring or the aging of the snowpack.
4. Results
Samples collected from the snow band of the Palouse Range in 2019–2020 produced a range of δ2H and δ18O values (Figure 3) that indicate highly variable isotope signals: snowpack values ranged from −130 to −75‰ for δ2H and −18 to −10.5‰ for δ18O and snowmelt values ranged from −120 to −90‰ for δ2H and from −16.5 to −12‰ for δ18O. With the transition of snowmelt to spring runoff, the range of isotope values decreased to −107 to −104‰ for δ2H and −15.5 to −14.5‰ for δ18O in the three ephemeral creeks. The range of snowpack isotope values highlights the variability of the snowpack isotope distribution throughout the winter–spring period, which does not directly translate to snowmelt and runoff. However, the transition to spring runoff did produce a relatively consistent springtime isotope signal in the runoff that fed the ephemeral creeks. The range of snowpack isotope signals indicates limited influence of elevation with the lowest elevation site recording the most depleted isotope signal, but the highest elevation site recording the lowest median isotope value (median δ18O values of −14.7, −14.1, and −14.3‰ for Sites #1–3, respectively). Site #2 had the largest field for snow accumulation, which may account for the more enriched isotope signals in the snowpack because of greater insolation and sublimation/evaporation.
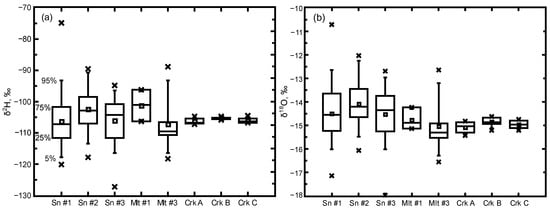
Figure 3.
Distribution of δ2H (a) and δ18O (b) for snowpack (Sn), snowmelt (Mlt), and ephemeral creeks (Crk) in the study area. Boxplots indicate the median, mean (□), interquartile range (25% to 75%), and whisker range of 5% to 95% along with outliers (×).
An examination of the snowpack composite δ2H and δ18O values collected from each site indicate a relatively similar grouping along a meteoric water line (Figure 4). Individual trendlines for Site #2 and Site #3 indicate a decrease in slope compared to Site #1, primarily because of outliers at Site #2 and Site #3. These outliers were collected during the same sample period in late March and do not appear to be reflective of the local meteoric water lines for the snowpack at these sites. Removal of these two outliers results in trendlines of similar slope for all three sites (7.2, 6.8, and 6.6, respectively for Sites #1–3), although there are slightly lower slopes for lower elevation sites. This decreasing slope with elevation is reflective of greater evaporation given warmer temperatures at the lower elevations. The range of δ2H and δ18O values of the composite snowpack samples corresponds to predicted values of Bowen [] for northern Idaho, although the snowpack did not contain the strongly depleted winter values (e.g., δ18O values < −20‰) of Bowen’s isoscapes.

Figure 4.
Linear regression trendlines (meteoric water lines) of δ2H and δ18O for snowpack composite samples collected at the three study sites. Outliers shown in (a) were removed to produce (b).
4.1. Snowpack Depth and Density
The range of isotope values for the snowpack, snowmelt, and ephemeral creeks occurred during a relatively average year for snowpack accumulation. The 2019–2020 snowpack at the SNOTEL site and the adjacent Site #1 (located in the same field area) were larger (160 cm peak) than the 30-year (1981–2010) average of 140 cm [], but the 2019–2020 snowpack lasted a relatively similar duration compared to the 30-year average (Figure 5). The lowest elevation site (#3) produced a similar accumulation trend compared to Site #1, but the mid-elevation site (#2) indicated a later accumulation peak, although an expected snowpack duration between the higher and lower elevation sites. The larger open field quality of Site #2 appears to have delayed peak accumulation that may correlate to the relatively more enriched isotope signals (Figure 3).
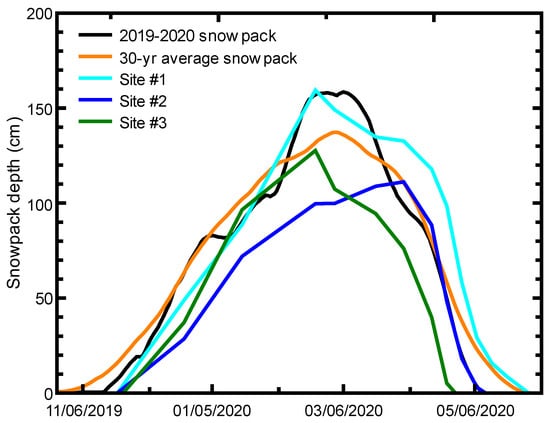
Figure 5.
Snowpack depth for 2019–2020 and average snowpack depth, 1981–2010, for the Natural Resources and Conservation Service snow telemetry site at Moscow Mountain (site #989) [] along with trendlines of snowpack-depth measurements at the three study sites (#1–3).
Linear trends in density of the snowpack layers at the three study sites indicate the highest densities and largest temporal increases in density at Site #1 (Figure 6), which is expected given the higher elevation, greater snowfall, and longer duration of the snowpack at this site (Figure 5). Sites #2 and #3 indicated overall smaller snowpack densities and variable density trends between layers (Figure 6). The density trends of the base layers at Site #2 and #3 were similar as opposed to the greater density increase in the base layer of Site #1. The greater snowfall (physical mass overlying the base layer) and longer duration (longer melt–refreeze sequence) of the snowpack at Site #1 likely allowed for increasing density in the base layer that also produced the sharper increasing density trend in all layers at this site. The difference in snowpack accumulation between Site #2 and #3 (Figure 5) resulted in Site #3 having slightly higher densities although similar temporal trends (slope) in the base layer density (Figure 6). At Site #2 and #3, the variability of isotope signals (Figure 3 and Figure 4), snowpack accumulation (Figure 5), and greater temperature influence were apparent in the variable strength (R values) of the linear trend for density of all layers. The difference in physical and isotopic characteristics and trends for the snowpack at Site #2 highlight the effect of orientation and landscape given the larger clearing for snow accumulation that made it more available to insolation and wind effects. The greater temperature influence and corresponding shorter duration of the snowpack at the lower elevation Site #3 increased the variability of the snowpack density trends (R = 0.3 to 0.7) and produced the lowest meteoric water line slope (Figure 4) indicative of greater evaporation.
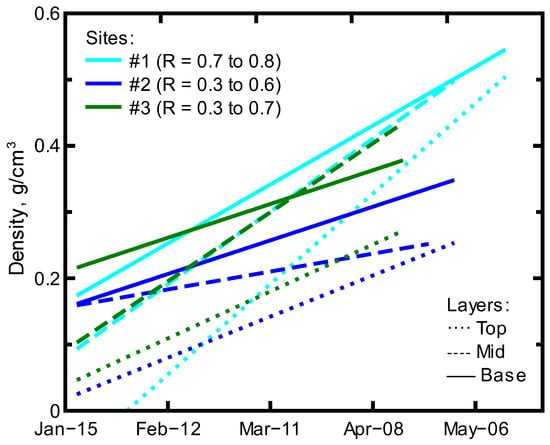
Figure 6.
Linear regression trendlines of the density data collected for each layer at the three study sites.
4.2. Isotope Signals in the Snowpack Layers
The aging of the snowpack from accumulation through melt that produced variable densities by layer also produced variable isotope signals by layer (Figure 7). Similar to the density trends, the temporal relationships between δ2H and δ18O indicate variable changes between layers at each site. Isotope trendlines for the snowpack layers at Site #1 indicate a decreasing slope from the top layer to base layer. This isotope signal evolution with depth was not as apparent at the lower elevation sites (#2 and #3), but the base layer at each of these sites had the lowest trendline slope. These base layers represent the earliest or oldest snow that also receives melt from subsequent layers (accumulation of the evaporation/sublimation signal as melt residual). The rotation of the layer trendlines (lower slope) from top to base layer reflect the aging of the older snow or middle and base layers. An examination of δ18O vs. time (Figure 7) indicates an enrichment trend in the base layer with aging of the snowpack. Top layers at Site #1 and #3 indicate the most depleted initial δ18O values that also became more enriched with time and became the most enriched values of all the layers. The mid-elevation Site #2 had similar trends in δ18O values for the top and base layers, and sampling of the middle layer captured a trend similar to that seen in the top layer, but at a more depleted signal.
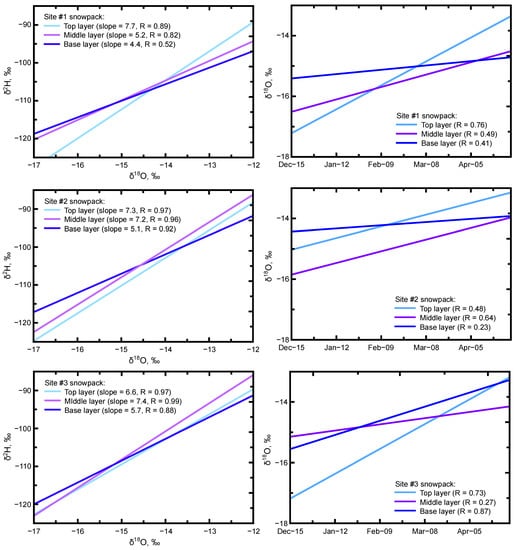
Figure 7.
Linear regression trendlines of δ2H and δ18O and δ18O with time for the snowpack sampling sites by layer.
4.3. Deuterium Excess
While the δ2H and δ18O relationship can indicate the effects of evaporation/sublimation, the second order isotopic parameter of d-excess can indicate vapor re-circulation/transport or the conditions in an evolving system such as a snowpack. D-excess is a function of the isotopic composition of hydrogen (δ2H) and oxygen (δ18O) in water (d-excess = δ2H − 8 × δ18O) [], where the d-excess will be altered during circulation because of diffusivity differences from differences in molecular weight (e.g., 1H2H16O = 19 g·mol/mol compared to 1H1H18O = 20 g·mol/mol). D-excess responds to humidity/evaporation changes at the vapor source and with precipitation (subcloud evaporation) [,,]. Redistribution in a system, such as through the movement of vapor and melt in a snowpack, can produce additional isotope signal differences as melt water and water vapor migrate through a snowpack and undergo freezing (re-deposition) or are lost from the system. Snowfall in the study area is expected to have a relatively large d-excess that is greater with elevation [], which will be altered with aging of the snowpack. The linear trends of d-excess with time (Figure 8) indicate an overall decrease in d-excess in all layers at all three snowpack sites. This trend is inverse to the enrichment trend in δ18O with time (Figure 7). This d-excess trend is reflective of vapor and melt migration in the snowpack during aging, which corresponds to the enrichment trend of δ18O.
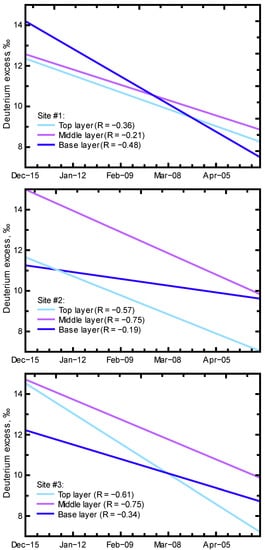
Figure 8.
Linear regression trendlines of deuterium excess with time at the three snowpack sites.
The decreasing d-excess trend is not the same for each layer at each site or between sites, indicating different internal signals from the snow/vapor/melt/freeze/loss distribution of the water. D-excess values at Site #1 indicated similar temporal trends, although with a larger decrease in d-excess in the base layer. This initially larger d-excess and greater decrease in d-excess in the base layer of Site #1 is expected given the duration of the snowpack where early winter, upper elevation snow contained a relatively large d-excess value that decreased with later distribution of melt and loss as snowmelt from the snowpack. A similar base layer d-excess trend was not present at the lower elevation sites, which reflects differing evolution of the snowpack at these sites because of the different temperature regimes. The lower initial d-excess and lower slope of the d-excess trend in the base layers of Site #2 and #3 indicate differences in base layer water accumulations and release as snowmelt. This difference in the base layers of the lower elevation sites aligns with the greater variability in δ2H and δ18O values recorded for the snowmelt collected at Site #3 compared to Site #1.
4.4. Persistence and Variability of the Snowmelt and Runoff Isotope Signals
The aging of the snowpack produced variable snowpack isotope signals but less variable signals in the subsequent snowmelt and ephemeral creeks (Figure 3). The wide range of snowpack isotope values (e.g., δ18O range of −18 to −10.5‰) translated to a slightly smaller range of snowmelt isotope values (e.g., δ18O range of −16.5 to −12‰) and a very limited range of relatively depleted isotope values in the springtime, ephemeral creeks (e.g., δ18O range of −15.5 to −14.5‰). The compression of the isotope signal from snowpack → snowmelt → runoff indicates substantial loss of snowpack water through evaporation/sublimation and early (winter) melt that was visible in the enrichment of the snowpack isotope signals (Figure 7) and the alteration of d-excess values (Figure 8) from winter through spring. The snowpack-to-snowmelt evolution produced a consistent, relatively depleted isotope signal for runoff in the upper watershed, ephemeral creeks. This consistent isotope signal in the springtime ephemeral creeks was not influenced by subsequent enriched rainfall (Figure 9). The compressed range of relatively depleted isotope signals in the springtime ephemeral creeks suggests a strong influence from early melt (winter melt) because of the relative weighting of the creek water towards the depleted portion of the snowpack and snowmelt δ2H and δ18O range of values.
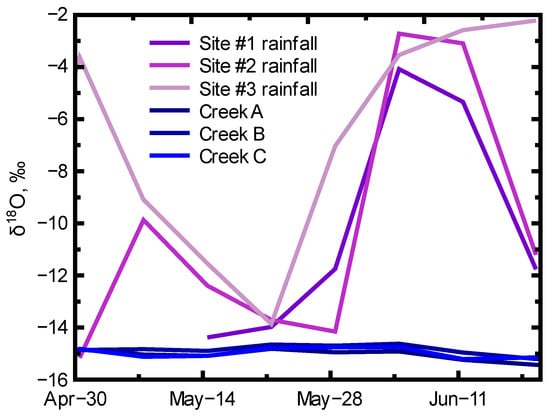
Figure 9.
Temporal trends of δ18O values for spring rainfall collected at the three snowpack sampling locations (Sites #1–3) and the three (A, B, and C) ephemeral creeks located between sites #2 and #3.
Given the dominance of the depleted isotope signal in ephemeral creek runoff (~−15‰ for δ18O, Figure 9) and no discernible difference in runoff isotope signals between the three ephemeral creeks over the springtime sampling period, it appears the snowpack → snowmelt → runoff process is dominated by high elevation and/or early melt with a sufficient diversity of pathways to create a steady isotopic signal for upper watershed, creek water. Base layer isotope signals of Site #1 (δ18O median of −14.9‰) and Site #2 (δ18O median of −14.2‰) along with a Site #1 snowmelt median of −14.9‰ (Figure 3) suggest large contributions of upper elevation snowmelt to the ephemeral creek runoff. However, the wide range of snowmelt values at Site #3 (Figure 3, δ18O median of −15.3‰) indicates the availability of relatively depleted runoff at lower elevations. Such a range of snowmelt and runoff isotope signals parallels the wide range of isotope signals found in a downgradient perennial creek (Crumarine Creek: range of −17.7 to −13.7‰ (mean = −15.2‰) by Sanchez-Murillo et al. [] and isotope signals in two downgradient, shallow groundwater wells (range of −16.0 to −14.8‰ (well 9) and −15.6 to −14.6‰ (well 14)) by Candel et al. [] (Figure 10). The wide range of snowpack and snowmelt isotope signals can produce a consistent isotope signal for high elevation, ephemeral creek water, but other pathways (e.g., snowmelt infiltration/percolation = subsurface water) can allow for substantial variation in isotope signals in lower elevation surface-water and groundwater systems (Figure 10).
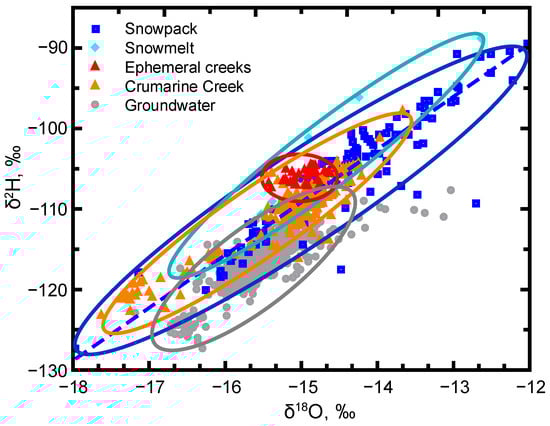
Figure 10.
Groupings of δ2H and δ18O values indicative of the evolution and variability of the isotope signals from snowpack and snowmelt to local surface-water and groundwater systems. Crumarine Creek and groundwater values are from Sanchez-Murillo et al. [] and Candel et al. [], respectively.
5. Conclusions
As a snowpack ages, δ2H and δ18O values will vary according to the inputted snow values and will evolve in their distribution within the snowpack as melt moves through and out of the snowpack. An examination of δ2H and δ18O values for snowpack, snowmelt, and ephemeral creek water in a snow-dominated basin of northern Idaho indicated an evolution of δ2H and δ18O values from variably depleted snowpack to enriched snowmelt and relatively consistent isotope signals in springtime ephemeral creeks. Spatial and temperature influences on the winter/spring snowpack produced an isotope range of −130 to −75‰ for δ2H and −18 to −10.5‰ for δ18O, which produced snowmelt values ranging −120 to −90‰ for δ2H and −16.5 to −12‰ for δ18O. With the transport of snowmelt to springtime ephemeral creeks, the isotope values compressed to −107 to −104‰ for δ2H and −15.5 to −14.5‰ for δ18O. The aging of the snowpack produced increasing densities in the base, middle, and top layers along with a corresponding temporal enrichment of isotope values. However, the snowpack produced a variable pattern of isotope enrichment at the three different sampling elevations. The highest elevation site indicated the least enrichment of the isotope signal in the snowpack base layer, and the lowest elevation site indicated the strongest enrichment of the isotope signal in the snowpack base layer. The linear trends of d-excess with time indicate an overall decrease in d-excess in all layers at all three snowpack sites, which was inverse to the enrichment trend in δ18O with time. The decreasing d-excess trend was not the same for each layer at each site, or between sites, indicating different internal signals from snow/vapor/melt/freeze/loss distribution of the water. The d-excess trends are reflective of vapor and melt migration in the snowpack, which is a substantial influence on isotope signals during snowpack aging and can produce a relatively consistent temporal trend of enriched isotope signals.
The accumulation of the snowpack provides a dominant water source for infiltration and runoff from the mountain system, which provides water to the creek system and recharge to the local aquifer system. The evolution of the isotope signal from snowpack to snowmelt to ephemeral creek aligns with some groundwater isotope signals found in the lower elevations along the mountain front, but more strongly depleted isotope signals have been found in other groundwater and perennial creek water in the same area. It is likely that winter melt (early depleted signal) is a primary contributor to creeks and groundwater, but this early melt was not well captured by the current study. However, the snowpack and snowmelt isotope signals recorded for this study captured the evolution of and variation in isotope signals that feed the surface-water and groundwater systems of the basin.
Supplementary Materials
The following supporting information can be downloaded at: https://www.mdpi.com/article/10.3390/hydrology9060094/s1, Supplementary File.
Author Contributions
Conceptualization, J.B.L., J.M. and E.G.; methodology, J.B.L. and J.B.; validation, J.B.; formal analysis, J.B.L., J.M., E.G., J.B. and D.B.; investigation, J.B.L.; writing—original draft preparation, J.B.L., J.M., E.G., J.B. and D.B.; writing—review and editing, J.B.L., J.M., E.G., J.B. and D.B.; visualization, J.B.L., J.M. and E.G.; project administration, J.B.L.; funding acquisition, J.B.L. and J.B. All authors have read and agreed to the published version of the manuscript.
Funding
This project was funded in part by the Palouse Basin Aquifer Committee and the US Geological Survey 104b program as administered through the Idaho Water Resources Research Institute (grant # G16AP00050).
Data Availability Statement
The data presented in this study are openly available as Supplementary Materials.
Acknowledgments
We acknowledge the support of the Palouse Basin Aquifer Committee (PBAC) to make this research possible. We would also like to acknowledge the contributions of Jennifer Dodd, John Dodd, and Robert Kane with sample collection and processing.
Conflicts of Interest
The funding agency had no role in the design of the study; in the collection, analyses, or interpretation of data; in the writing of the manuscript, or in the decision to publish the results.
References
- Simpkins, G. Snow-Related Water Woes. Nat. Clim Chang. 2018, 8, 945. [Google Scholar] [CrossRef]
- Viviroli, D.; Dürr, H.H.; Messerli, B.; Meybeck, M.; Weingartner, R. Mountains of the World, Water Towers for Humanity: Typology, Mapping, and Global Significance. Water Resour. Res. 2007, 43, W07447. [Google Scholar] [CrossRef]
- Rodhe, A. Chapter 12—Snowmelt-Dominated Systems. In Isotope Tracers in Catchment Hydrology; Kendall, C., McDonnell, J.J., Eds.; Elsevier: Amsterdam, The Netherlands, 1998; pp. 391–433. ISBN 978-0-444-81546-0. [Google Scholar]
- Siirila-Woodburn, E.R.; Rhoades, A.M.; Hatchett, B.J.; Huning, L.S.; Szinai, J.; Tague, C.; Nico, P.S.; Feldman, D.R.; Jones, A.D.; Collins, W.D.; et al. A Low-to-No Snow Future and Its Impacts on Water Resources in the Western United States. Nat. Rev. Earth Environ. 2021, 2, 800–819. [Google Scholar] [CrossRef]
- Fayad, A.; Gascoin, S.; Faour, G.; López-Moreno, J.I.; Drapeau, L.; Page, M.L.; Escadafal, R. Snow Hydrology in Mediterranean Mountain Regions: A Review. J. Hydrol. 2017, 551, 374–396. [Google Scholar] [CrossRef]
- Armstrong, R.L.; Rittger, K.; Brodzik, M.J.; Racoviteanu, A.; Barrett, A.P.; Khalsa, S.-J.S.; Raup, B.; Hill, A.F.; Khan, A.L.; Wilson, A.M.; et al. Runoff from Glacier Ice and Seasonal Snow in High Asia: Separating Melt Water Sources in River Flow. Reg. Environ. Chang. 2019, 19, 1249–1261. [Google Scholar] [CrossRef]
- Araguás-Araguás, L.; Froehlich, K.; Rozanski, K. Deuterium and Oxygen-18 Isotope Composition of Precipitation and Atmospheric Moisture. Hydrol. Processes 2000, 14, 1341–1355. [Google Scholar] [CrossRef]
- Gonfiantini, R.; Frohlich, K.; Araguas-Araguas, L.; Rozanski, K. Isotopes in Groundwater Hydrology. In Isotope Tracers in Catchment Hydrology; Elsevier Science B.V.: Amsterdam, The Netherlands, 1998; pp. 203–246. ISBN 0-444-50155-X. [Google Scholar]
- Klaus, J.; McDonnell, J.J. Hydrograph Separation Using Stable Isotopes: Review and Evaluation. J. Hydrol. 2013, 505, 47–64. [Google Scholar] [CrossRef]
- Rodgers, P.; Soulsby, C.; Waldron, S. Stable Isotope Tracers as Diagnostic Tools in Upscaling Flow Path Understanding and Residence Time Estimates in a Mountainous Mesoscale Catchment. Hydrol. Processes 2005, 19, 2291–2307. [Google Scholar] [CrossRef]
- Maule, C.P.; Chanasyk, D.S.; Muehlenbachs, K. Isotopic Determination of Snow-Water Contribution to Soil Water and Groundwater. J. Hydrol. 1994, 155, 73–91. [Google Scholar] [CrossRef]
- Vogel, T.; Sanda, M.; Dusek, J.; Dohnal, M.; Votrubova, J. Using Oxygen-18 to Study the Role of Preferential Flow in the Formation of Hillslope Runoff. Vadose Zone J. 2010, 9, 252–259. [Google Scholar] [CrossRef]
- Maulé, C.P.; Stein, J. Hydrologic Flow Path Definition and Partitioning of Spring Meltwater. Water Resour. Res. 1990, 26, 2959–2970. [Google Scholar] [CrossRef]
- Yuan, F.; Sheng, Y.; Yao, T.; Fan, C.; Li, J.; Zhao, H.; Lei, Y. Evaporative Enrichment of Oxygen-18 and Deuterium in Lake Waters on the Tibetan Plateau. J. Paleolimnol. 2011, 46, 291–307. [Google Scholar] [CrossRef]
- Penna, D.; Ahmad, M.; Birks, S.J.; Bouchaou, L.; Brenčič, M.; Butt, S.; Holko, L.; Jeelani, G.; Martínez, D.E.; Melikadze, G.; et al. A New Method of Snowmelt Sampling for Water Stable Isotopes. Hydrol. Processes 2014, 28, 5637–5644. [Google Scholar] [CrossRef]
- Beria, H.; Larsen, J.R.; Ceperley, N.C.; Michelon, A.; Vennemann, T.; Schaefli, B. Understanding Snow Hydrological Processes through the Lens of Stable Water Isotopes. Wiley Interdiscip. Rev. Water 2018, 5, e1311. [Google Scholar] [CrossRef]
- Cooper, L.W.; Solis, C.; Kane, D.L.; Hinzman, L.D. Application of Oxygen-18 Tracer Techniques to Arctic Hydrological Processes. Arct. Alp. Res. 1993, 25, 247–255. [Google Scholar] [CrossRef]
- Cooper, L.W. Chapter 4—Isotopic Fractionation in Snow Cover. In Isotope Tracers in Catchment Hydrology; Kendall, C., McDonnell, J.J., Eds.; Elsevier: Amsterdam, The Netherlands, 1998; pp. 119–136. ISBN 978-0-444-81546-0. [Google Scholar]
- Laudon, H.; Hemond, H.F.; Krouse, R.; Bishop, K.H. Oxygen 18 Fractionation during Snowmelt: Implications for Spring Flood Hydrograph Separation. Water Resour. Res. 2002, 38, 1258. [Google Scholar] [CrossRef]
- Taylor, S.; Feng, X.; Kirchner, J.W.; Osterhuber, R.; Klaue, B.; Renshaw, C.E. Isotopic Evolution of a Seasonal Snowpack and Its Melt. Water Resour. Res. 2001, 37, 759–769. [Google Scholar] [CrossRef]
- Laudon, H.; Seibert, J.; Köhler, S.; Bishop, K. Hydrological Flow Paths during Snowmelt: Congruence between Hydrometric Measurements and Oxygen 18 in Meltwater, Soil Water, and Runoff. Water Resour. Res. 2004, 40, W03102. [Google Scholar] [CrossRef]
- Schmieder, J.; Garvelmann, J.; Marke, T.; Strasser, U. Spatio-Temporal Tracer Variability in the Glacier Melt End-Member—How Does It Affect Hydrograph Separation Results? Hydrol. Processes 2018, 32, 1828–1843. [Google Scholar] [CrossRef]
- Ala-aho, P.; Tetzlaff, D.; McNamara, J.P.; Laudon, H.; Kormos, P.; Soulsby, C. Modeling the Isotopic Evolution of Snowpack and Snowmelt: Testing a Spatially Distributed Parsimonious Approach. Water Resour. Res. 2017, 53, 5813–5830. [Google Scholar] [CrossRef]
- Laudon, H.; Sjöblom, V.; Buffam, I.; Seibert, J.; Mörth, M. The Role of Catchment Scale and Landscape Characteristics for Runoff Generation of Boreal Streams. J. Hydrol. 2007, 344, 198–209. [Google Scholar] [CrossRef]
- N’da, A.B.; Bouchaou, L.; Reichert, B.; Hanich, L.; Ait Brahim, Y.; Chehbouni, A.; Beraaouz, E.H.; Michelot, J.-L. Isotopic Signatures for the Assessment of Snow Water Resources in the Moroccan High Atlas Mountains: Contribution to Surface and Groundwater Recharge. Env. Earth Sci. 2016, 75, 755. [Google Scholar] [CrossRef]
- Jeelani, G.; Bhat, N.A.; Shivanna, K. Use of Δ18O Tracer to Identify Stream and Spring Origins of a Mountainous Catchment: A Case Study from Liddar Watershed, Western Himalaya, India. J. Hydrol. 2010, 393, 257–264. [Google Scholar] [CrossRef]
- Moser, H.; Stichler, W. Deuterium and Oxygen-18 Contents as an Index of the Properties of Snow Covers. Int. Assoc. Hydrol. Sci. 1974, 114, 122–135. [Google Scholar]
- Zongxing, L.; Qi, F.; Wei, L.; Tingting, W.; Xiaoyan, G.; Zongjie, L.; Yan, G.; Yanhui, P.; Rui, G.; Bing, J.; et al. The Stable Isotope Evolution in Shiyi Glacier System during the Ablation Period in the North of Tibetan Plateau, China. Quat. Int. 2015, 380–381, 262–271. [Google Scholar] [CrossRef]
- Winograd, I.J.; Riggs, A.C.; Coplen, T.B. The Relative Contributions of Summer and Cool-Season Precipitation to Groundwater Recharge, Spring Mountains, Nevada, USA. Hydrogeol. J. 1998, 6, 77–93. [Google Scholar] [CrossRef]
- Jasechko, S.; Perrone, D.; Befus, K.M.; Bayani-Cardenas, M.; Ferguson, G.; Gleeson, T.; Luijendijk, E.; McDonnell, J.J.; Taylor, R.G.; Wada, Y.; et al. Global Aquifers Dominated by Fossil Groundwaters but Wells Vulnerable to Modern Contamination. Nat. Geosci. 2017, 10, 425–429. [Google Scholar] [CrossRef]
- Behrens, D.; Langman, J.B.; Brooks, E.S.; Boll, J.; Waynant, K.; Moberly, J.G.; Dodd, J.K.; Dodd, J.W. Tracing δ18O and δ2H in Source Waters and Recharge Pathways of a Fractured-Basalt and Interbedded-Sediment Aquifer, Columbia River Flood Basalt Province. Geosciences 2021, 11, 400. [Google Scholar] [CrossRef]
- Duckett, K.A.; Langman, J.B.; Bush, J.H.; Brooks, E.S.; Dunlap, P.; Welker, J.M. Isotopic Discrimination of Aquifer Recharge Sources, Subsystem Connectivity and Flow Patterns in the South Fork Palouse River Basin, Idaho and Washington, USA. Hydrology 2019, 6, 15. [Google Scholar] [CrossRef]
- Duckett, K.A.; Langman, J.B.; Bush, J.H.; Brooks, E.S.; Dunlap, P.; Stanley, J.R. Noble Gases, Dead Carbon, and Reinterpretation of Groundwater Ages and Travel Time in Local Aquifers of the Columbia River Basalt Group. J. Hydrol. 2020, 581, 124400. [Google Scholar] [CrossRef]
- Medici, G.; Engdahl, N.B.; Langman, J.B. A Basin-Scale Groundwater Flow Model of the Columbia Plateau Regional Aquifer System in the Palouse (USA): Insights for Aquifer Vulnerability Assessment. Int. J. Environ. Res 2021, 15, 299–312. [Google Scholar] [CrossRef]
- Sturm, M. White Water: Fifty Years of Snow Research in WRR and the Outlook for the Future. Water Resour. Res. 2015, 51, 4948–4965. [Google Scholar] [CrossRef]
- Cohen, J.S.; Zeff, H.B.; Herman, J.D. Adaptation of Multiobjective Reservoir Operations to Snowpack Decline in the Western United States. J. Water Resour. Plan. Manag. 2020, 146, 04020091. [Google Scholar] [CrossRef]
- Rhoades, A.M.; Jones, A.D.; Ullrich, P.A. The Changing Character of the California Sierra Nevada as a Natural Reservoir. Geophys. Res. Lett. 2018, 45, 13,008–13,019. [Google Scholar] [CrossRef]
- Viallon-Galinier, L.; Hagenmuller, P.; Lafaysse, M. Forcing and Evaluating Detailed Snow Cover Models with Stratigraphy Observations. Cold Reg. Sci. Technol. 2020, 180, 103163. [Google Scholar] [CrossRef]
- Domine, F.; Morin, S.; Brun, E.; Lafaysse, M.; Carmagnola, C.M. Seasonal Evolution of Snow Permeability under Equi-Temperature and Temperature-Gradient Conditions. Cryosphere 2013, 7, 1915–1929. [Google Scholar] [CrossRef]
- Lee, J.; Feng, X.; Faiia, A.M.; Posmentier, E.S.; Kirchner, J.W.; Osterhuber, R.; Taylor, S. Isotopic Evolution of a Seasonal Snowcover and Its Melt by Isotopic Exchange between Liquid Water and Ice. Chem. Geol. 2010, 270, 126–134. [Google Scholar] [CrossRef]
- Earman, S.; Campbell, A.R.; Phillips, F.M.; Newman, B.D. Isotopic Exchange between Snow and Atmospheric Water Vapor: Estimation of the Snowmelt Component of Groundwater Recharge in the Southwestern United States. J. Geophys. Res. Atmos. 2006, 111, D09302. [Google Scholar] [CrossRef]
- Kendall, C.; Caldwell, E.A. Chapter 2—Fundamentals of Isotope Geochemistry. In Isotope Tracers in Catchment Hydrology; Kendall, C., McDonnell, J.J., Eds.; Elsevier: Amsterdam, The Netherlands, 1998; ISBN 978-0-08-092915-6. [Google Scholar]
- O’Neil, J.R. Hydrogen and Oxygen Isotope Fractionation between Ice and Water. J. Phys. Chem. 1968, 72, 3683–3684. [Google Scholar] [CrossRef]
- Stichler, W.; Rauert, W.; Martinec, J. Environmental Isotope Studies of an Alpine Snowpack. Hydrol. Res. 1981, 12, 297–308. [Google Scholar] [CrossRef]
- Dahlke, H.E.; Lyon, S.W. Early Melt Season Snowpack Isotopic Evolution in the Tarfala Valley, Northern Sweden. Ann. Glaciol. 2013, 54, 149–156. [Google Scholar] [CrossRef]
- Dietermann, N.; Weiler, M. Spatial Distribution of Stable Water Isotopes in Alpine Snow Cover. Hydrol. Earth Syst. Sci. 2013, 17, 2657–2668. [Google Scholar] [CrossRef]
- Hood, E.; Williams, M.; Cline, D. Sublimation from a Seasonal Snowpack at a Continental, Mid-Latitude Alpine Site. Hydrol. Processes 1999, 13, 1781–1797. [Google Scholar] [CrossRef]
- Unnikrishna, P.V.; McDonnell, J.J.; Kendall, C. Isotope Variations in a Sierra Nevada Snowpack and Their Relation to Meltwater. J. Hydrol. 2002, 260, 38–57. [Google Scholar] [CrossRef]
- Gustafson, J.R.; Brooks, P.D.; Molotch, N.P.; Veatch, W.C. Estimating Snow Sublimation Using Natural Chemical and Isotopic Tracers across a Gradient of Solar Radiation. Water Resour. Res. 2010, 46, W12511. [Google Scholar] [CrossRef]
- Reba, M.L.; Pomeroy, J.; Marks, D.; Link, T.E. Estimating Surface Sublimation Losses from Snowpacks in a Mountain Catchment Using Eddy Covariance and Turbulent Transfer Calculations. Hydrol. Processes 2012, 26, 3699–3711. [Google Scholar] [CrossRef]
- Shanley, J.B.; Kendall, C.; Albert, M.R.; Hardy, J.P. Chemical and Isotopic Evolution of a Layered Eastern U.S. Snowpack and Its Relation to Stream-Water Composition. In Proceedings of the International Association of Hydrological Sciences: Biogeochemistry of Seasonally Snow-Covered Catchments. Symposium during the XXI Assembly of the International Union of Geodesy and Geophysic, Boulder, CO, USA, 2–14 July 1995; Volume 228, pp. 329–338. [Google Scholar]
- Soulsby, C.; Malcolm, R.; Helliwell, R.; Ferrier, R.C.; Jenkins, A. Isotope Hydrology of the Allt a’ Mharcaidh Catchment, Cairngorms, Scotland: Implications for Hydrological Pathways and Residence Times. Hydrol. Processes 2000, 14, 747–762. [Google Scholar] [CrossRef]
- Feng, X.; Taylor, S.; Renshaw, C.E.; Kirchner, J.W. Isotopic Evolution of Snowmelt 1. A Physically Based One-Dimensional Model. Water Resour. Res. 2002, 38, 1217. [Google Scholar] [CrossRef]
- Carey, S.K.; Quinton, W.L. Evaluating Snowmelt Runoff Generation in a Discontinuous Permafrost Catchment Using Stable Isotope, Hydrochemical and Hydrometric Data. Hydrol. Res. 2004, 35, 309–324. [Google Scholar] [CrossRef]
- Schmieder, J.; Hanzer, F.; Marke, T.; Garvelmann, J.; Warscher, M.; Kunstmann, H.; Strasser, U. The Importance of Snowmelt Spatiotemporal Variability for Isotope-Based Hydrograph Separation in a High-Elevation Catchment. Hydrol. Earth Syst. Sci. 2016, 20, 5015–5033. [Google Scholar] [CrossRef]
- Evans, S.L.; Flores, A.N.; Heilig, A.; Kohn, M.J.; Marshall, H.-P.; McNamara, J.P. Isotopic Evidence for Lateral Flow and Diffusive Transport, but Not Sublimation, in a Sloped Seasonal Snowpack, Idaho, USA. Geophys. Res. Lett. 2016, 43, 3298–3306. [Google Scholar] [CrossRef]
- Finklin, A.I. Climate of Priest River Experimental Forest, Northern Idaho; Gen. Tech. Rep. INT-159; US Department of Agriculture, Forest Service, Intermountain Forest and Range Experiment Station: Ogden, Utah, USA, 1983; Volume 159, 53p. [Google Scholar] [CrossRef][Green Version]
- Rutz, J.J.; Steenburgh, W.J.; Ralph, F.M. Climatological Characteristics of Atmospheric Rivers and Their Inland Penetration over the Western United States. Mon. Weather Rev. 2014, 142, 905–921. [Google Scholar] [CrossRef]
- Hu, Q.; Feng, S. AMO- and ENSO-Driven Summertime Circulation and Precipitation Variations in North America. J. Clim. 2012, 25, 6477–6495. [Google Scholar] [CrossRef]
- Neiman, P.J.; Ralph, F.M.; Wick, G.A.; Lundquist, J.D.; Dettinger, M.D. Meteorological Characteristics and Overland Precipitation Impacts of Atmospheric Rivers Affecting the West Coast of North America Based on Eight Years of SSM/I Satellite Observations. J. Hydrometeorol. 2008, 9, 22–47. [Google Scholar] [CrossRef]
- Western Regional Climate Center Cooperative Climatological Data Summaries, NOAA Cooperative Stations, Pullman Experimental Station-Climate Summary. Available online: https://wrcc.dri.edu/cgi-bin/cliMAIN.pl?id6152 (accessed on 9 January 2021).
- Northwest River Forecast Center Temperature and Precipitation Monthly Means. Available online: https://www.nwrfc.noaa.gov/snow/snowplot.cgi?MSCI1 (accessed on 19 April 2021).
- Sánchez-Murillo, R.; Brooks, E.S.; Elliot, W.J.; Boll, J. Isotope Hydrology and Baseflow Geochemistry in Natural and Human-Altered Watersheds in the Inland Pacific Northwest, USA. Isot. Environ. Health Stud. 2015, 51, 231–254. [Google Scholar] [CrossRef] [PubMed]
- Candel, J.; Brooks, E.; Sánchez-Murillo, R.; Grader, G.; Dijksma, R. Identifying Groundwater Recharge Connections in the Moscow (USA) Sub-Basin Using Isotopic Tracers and a Soil Moisture Routing Model. Hydrogeol. J. 2016, 24, 1739–1751. [Google Scholar] [CrossRef]
- Bowen, G.J. Statistical and Geostatistical Mapping of Precipitation Water Isotope Ratios. In Isoscapes: Understanding Movement, Pattern, and Process on Earth through Isotope Mapping; West, J.B., Bowen, G.J., Dawson, T.E., Tu, K.P., Eds.; Springer: Dordrecht, The Netherlands, 2010; pp. 139–160. ISBN 978-90-481-3354-3. [Google Scholar]
- Ellis, A.W.; Barton, N.P. Characterizing the North Pacific Jet Stream for Understanding Historical Variability in Western United States Winter Precipitation. Phys. Geogr. 2012, 33, 105–128. [Google Scholar] [CrossRef]
- Zhang, W.; Villarini, G. Uncovering the Role of the East Asian Jet Stream and Heterogeneities in Atmospheric Rivers Affecting the Western United States. Proc. Natl. Acad. Sci. USA 2018, 115, 891–896. [Google Scholar] [CrossRef]
- Lackmann, G.M.; Gyakum, J.R. Heavy Cold-Season Precipitation in the Northwestern United States: Synoptic Climatology and an Analysis of the Flood of 17–18 January 1986. Weather Forecast. 1999, 14, 687–700. [Google Scholar] [CrossRef]
- Ma, X.; Xie, F.; Li, J.; Zheng, X.; Tian, W.; Ding, R.; Sun, C.; Zhang, J. Effects of Arctic Stratospheric Ozone Changes on Spring Precipitation in the Northwestern United States. Atmos. Chem. Phys. 2019, 19, 861–875. [Google Scholar] [CrossRef]
- Welker, J.M. Isotopic (δ18O) Characteristics of Weekly Precipitation Collected across the USA: An Initial Analysis with Application to Water Source Studies. Hydrol. Processes 2000, 14, 1449–1464. [Google Scholar] [CrossRef]
- Li, S.; Levin, N.E.; Chesson, L.A. Continental Scale Variation in 17O-Excess of Meteoric Waters in the United States. Geochim. Et Cosmochim. Acta 2015, 164, 110–126. [Google Scholar] [CrossRef]
- Kennedy, C.D.; Bowen, G.J.; Ehleringer, J.R. Temporal Variation of Oxygen Isotope Ratios (Δ18O) in Drinking Water: Implications for Specifying Location of Origin with Human Scalp Hair. Forensic Sci. Int. 2011, 208, 156–166. [Google Scholar] [CrossRef] [PubMed]
- Bowen, G.J.; Cai, Z.; Fiorella, R.P.; Putman, A.L. Isotopes in the Water Cycle: Regional- to Global-Scale Patterns and Applications. Annu. Rev. Earth Planet. Sci. 2019, 47, 453–479. [Google Scholar] [CrossRef]
- Froehlich, K.; Gibson, J.J.; Aggarwal, P.K. Deuterium Excess in Precipitation and Its Climatological Significance; International Atomic Energy Agency (IAEA): Vienna, Austria, 2002; pp. 54–66. [Google Scholar]
- Bershaw, J.; Hansen, D.D.; Schauer, A.J. Deuterium Excess and 17O-Excess Variability in Meteoric Water across the Pacific Northwest, USA. Tellus B Chem. Phys. Meteorol. 2020, 72, 1–17. [Google Scholar] [CrossRef]
- U.S., Department of Agriculture, U.S. Soil Conservation Service, West National Technical Center, Water Supply Forecasting Center, Snow Survey Sampling Guide, Agriculture Handbook 169, GPO 594-305, 1984. Available online: https://www.nrcs.usda.gov/wps/wcm/connect/wcc/89bb470a-b54c-4d22-a205-42e47c886293/SnowSurveySamplingGuideHandout.pdf?MOD=AJPERES&CVID=mnjJXyZ&CVID=mnjJXyZ (accessed on 19 April 2021).
- Dansgaard, W. Stable Isotopes in Precipitation. Tellus 1964, 16, 436–468. [Google Scholar] [CrossRef]
- Gat, J.R.; Carmi, I. Evolution of the Isotopic Composition of Atmospheric Waters in the Mediterranean Sea Area. J. Geophys. Res. 1970, 75, 3039–3048. [Google Scholar] [CrossRef]
Publisher’s Note: MDPI stays neutral with regard to jurisdictional claims in published maps and institutional affiliations. |
© 2022 by the authors. Licensee MDPI, Basel, Switzerland. This article is an open access article distributed under the terms and conditions of the Creative Commons Attribution (CC BY) license (https://creativecommons.org/licenses/by/4.0/).