Article

Change in Winter Precipitation Regime across Ontario, Canada

1
Water Resources Engineering, School of Engineering, University of Guelph, Guelph, ON N1G 2W1, Canada
2
Department of Civil Engineering and Technology, NED University of Science and Technology, Karachi 75270, Pakistan
3
Ministry of the Environment, Conservation and Parks, Etobicoke, ON M9P 3V6, Canada
4
MNS Department of Agriculture, University of Agriculture, Multan 60000, Pakistan
*
Author to whom correspondence should be addressed.
Hydrology 2022, 9(5), 81; https://doi.org/10.3390/hydrology9050081
Submission received: 15 March 2022 / Revised: 5 May 2022 / Accepted: 6 May 2022 / Published: 10 May 2022
(This article belongs to the Section Hydrology–Climate Interactions)

Abstract

:
The focus of this study is to investigate the effects of climate change on the hydrologic regimes in Ontario, Canada. The variables include total precipitation, the form of precipitation (snowfall and rainfall), and the temperature during winter. The winter season is hydrologically significant for Canadian conditions. The historical data for 70 years, from 1939 to 2008, on total precipitation, snowfall, rainfall, and temperature over the winter period were analyzed using least-squares regressions, Alexandersson’s Standard Normal Homogeneity Test, and the Mann–Kendall test for 13 stations across Ontario to identify positive and negative trends and their significance. The analysis of the precipitation indices reveals no significant trend in the winter total precipitation, decreasing trends in winter snowfall, and increasing trends in winter rainfall. The snowy day analysis depicts a large scatter across the province, with the number ranging from 40 days to 80 days, which shows that the number of snowy days varies considerably over the years at all stations. The analysis showed that the change in snowy-rainy days is attributed to the significant upward trend of the daily mean winter minimum temperature for almost all the stations. Therefore, the changes in the form of precipitation during winter may affect water management including streamflow, tile drainage flow, soil erosion, sediment and nutrient transport to surface water bodies, and the effectiveness of best management practices being used for managing non-point source pollution.

1. Introduction

Global warming, due to an increase in greenhouse gases, is one of the most fundamental aspects of the climate system and it can be implicated as one of the basic factors contributing to rising of environmental temperatures. An increase in temperature can affect human lifestyles, economics, and ecosystems, as well as human health and social well-being [1]. Also, the United States Global Change Research Program (USGCRP) reported that the global average surface temperature has increased at an average rate of 0.17°F per decade since 1901. It was also found that this rate of warming is similar to the rate in the US, which has become faster than the global rate since the late 1970s [2].
Nerantzaki et al. [3] recently discussed the effects of global warming by providing an insight into the fluctuation of future water requirements and a quantification of future water deficits. By using the Water Exploitation Index for the spatial variability of future water stresses, a decrease in both surface and karstic spring flows is foreseen, especially after 2060. Canada has also experienced a warming trend at a higher rate due to its high latitude [4]. In southern Canada, the annual mean temperature increased by between 0.5 and 1.5 °C from 1900 to 1998. The minimum temperatures have been rising more rapidly than the maximum temperatures [5], thus contributing to most of the warming across various regions.
The unusual rise in temperatures across the globe has prompted researchers to further examine the variability of temperature and precipitation trends. Multiple investigations related to temperature and precipitation were conducted during the twentieth century and attracted the interest of researchers worldwide [6,7,8,9,10,11,12,13].
Hydrological impact assessments under climate change most often focus on likely precipitation changes in the future. The focus has recently begun to include the increasing role of warmer temperatures as a driver of changing precipitation patterns [14]. The warmer temperatures may increase the evaporation and moisture losses from the atmosphere and earth’s surface, increase the rain fraction of precipitation, or alter the snowmelt timings [15].
Climate change affects the overall hydrological cycle and thus the regional water availability. Padrón et al. [16] have validated the evidence of drier dry seasons in future especially in Europe, western North America, northern Asia, southern South America, Australia and eastern Africa. The intensified dry season is found to be the result of increased evapotranspiration and not decreasing precipitation.
It has been well-observed that patterns of temperature and precipitation have changed spatially and temporally globally. Likewise, changes in temperature and precipitation have been recognized and reported in Canada. Precipitation has increased by more than 10% on average during the 20th century in Canada and annual snowfall increased in the northern part and decreased in the southwestern part between 1900 and 2009 [17]. Zhang et al. [13] reported a 12% increase in annual precipitation in Southern Canada between 1900 and 1998 and also reported an increase in snowfall as the ratio of snow to winter precipitation increased. Vincent and Mikes [18] reported that the number of rainy days has increased in Canada during the last hundred years, whereas the average daily intensity of precipitation decreased. Their study of the precipitation variables also specified an increase in the number of days with precipitation and a lower maximum number of successive dry days.
Krasting et al. [19] studied how total snowfall and the ratio of snowfall to total precipitation are expected to change during the 21st century. Based on simulations of 18 coupled atmosphere–ocean global climate models from phase 5 of the Coupled Model Intercomparison Project (CMIP5), annual snowfall is expected to decrease across most of the Northern Hemisphere with a substantial increase at higher latitudes. A seasonal trend analysis revealed that most regions experience decreasing snowfall during fall and spring. The authors also performed a sensitivity analysis, which suggested that the change in snowfall is not an early indicator of climate change because of its greater interannual variability.
Another study supported the findings of [19] that the response of snowfall extremes to the changing climate is not very clear. The climate model simulations were still found to predict a decreased mean annual snowfall with warming temperatures across most of the regions in the Northern Hemisphere [20].
A study was conducted in Iran by Sharafati et al. [21] to evaluate the effects of climate change on rainfall and river flow using a Soil and Water Assessment Tool (SWAT). Five General Circulation Models (GCMs), including EC-EARTH, GFDL-CM3, HadGEM2-ES, MIROC5, and MPI-ESM-MR, were considered in the study. The results showed that the amount of future annual rainfall and, consequently, river flow, increased significantly by 81% and 142%, respectively. In addition, the uncertainty analysis results showed that various future climate scenarios have significant variability in future extreme events; however, extreme river discharge was found to be less sensitive to various return periods.
Homsi et al. [22] studied the effects of possible climate change on the precipitation of Syria using two methods: the symmetrical uncertainty (SU) method, and the multi-criteria decision-analysis (MCDA) method, based on the projections of General Circulation Models (GCMs). Four methods for bias correction were used in downscaling the GCM-simulated precipitation for four representative concentration pathways (RCPs), 2.6, 4.5, 6.0, and 8.5. The study found that the best-suited GCMs for climate projection in Syria were HadGEM2-AO, CSIRO-Mk3-6-0, NorESM1-M, and CESM1-CAM5. Overall, the study concluded that precipitation will decrease in the entire country for RCP 6.0, whereas it will increase in a few areas during the wet season.
Any changes due to natural or human activity in climate variables such as precipitation may lead to flood or drought conditions. A study was conducted by Zhao et al. [23] to evaluate the possibility of drought conditions using the Gravity Recovery and Climate Experiment (GRACE). This work is a GRACE-based modulated water deficit (GRACE-MWD) process for drought monitoring under the modulated annual cycle (MAC) reference frame for Southwest China. The modeling results of the study showed good agreement with the standardized precipitation evapotranspiration index, which ranged from 0.48 to 0.84. In addition, the drought severity index ranged from 0.48 to 0.68. However, when these results were compared with remote sensing datasets, they were found to be less affected by seasonality from land-cover categories. Overall, the study concluded that GRACE-MWD has potential through an adaptive reference frame for generalizing it to global applications.
Some studies have shown that the average winter temperature in Canada and Ontario has increased by 1.5 °C to 3.08 °C between 1950 and 2015, resulting in a decrease in the number of record-cold temperatures [24,25]. Also, the record extreme cold temperatures were shown to have decreased between 1971 and 2000 [26]. Variable changes in mean annual temperatures have been experienced in the northern part of Ontario, whereas a significant increasing trend has been observed in the southern part. The most noticeable warming in winter has been experienced in southern Ontario around the Great Lakes and St. Lawrence River. However, these changes are less intense than those occurring in western and northern Canada.
Mekis and Vincent [27] noticed an increase in rainfall across Canada over a 60-year period (from 1950 to 2009) and the highest increase in rainfall was observed during spring. The most noticeable increase in precipitation (by up to 50%) was observed in northwestern Ontario. They have also acknowledged a 4% increase in the national mean annual snowfall for the same period. However, both spatially and temporally, the trends were irregular across the country. The most significant increase (by almost 10–30%) was observed in winter in southern Ontario.
Vincent et al. [28] evaluated daily temperature and precipitation for two periods: for all stations across Canada (1948–2016) and for US stations along the USA-Canada border (1900–2016). The results indicated warming trends for cold temperatures in winter, hence, frost-free days increased, and the growing season is now getting longer. The precipitation data analysis showed an increase in the number of days with rainfall and a decrease in the number of days with snowfall. Also, it was observed that the maximum number of consecutive dry days has decreased in the south.
Some studies show that warmer climate does not affect water availability in regions such as Canada. However, some more recent studies reported on the sensitivity of rainfall-runoff to rising temperatures. The impacts may include a general decrease in the observed streamflow caused by a shift from snowfall to rainfall in the USA and an increase in streamflow in Canada [29]. Shrestha et al. [30] assessed the climate change impacts on freshwater resources in the Athabasca River Basin (ARB) in Canada. The streamflow was expected to increase in spite of the decrease in future winter precipitation due to increased snowmelt driven by warmer temperatures. This results in a decrease in snowpack volume and spring water availability, despite an increase in precipitation and temperature during this season.
Wang et al. [31] evaluated the regional temporal climate change patterns for Ontario, Canada, for the past century based on historical data. The results of the study showed no or negligible correlations between the total precipitation and the mean temperature for most of the stations; however, the results showed significant negative correlations for 54% of stations for summer. In addition, there were significant warming trends across the province and increasing annual rainfall (by 1–3 mm year−1) for most of the gauged stations. No significant trend in annual snowfall was observed across the province. Suriano and Leathers [32] observed a decreasing trend of snowfall in some portions of the Great Lakes due to the lake effect during the past few decades. They attributed this change in snowfall to large-scale atmospheric and oceanic variability.
Previous studies conducted of Canada and the US show mixed trends for rainfall and snowfall patterns. In addition, in light of growing concerns regarding climate change, the scarcity and inconclusiveness of climate trend studies show the variability in climate change in Ontario, more specifically in the Southern part of the province, related to winter precipitation and temperature regimes. To the best of our knowledge, no study has examined the changes in precipitation type (snowfall and rainfall) during winter and the corresponding changes in winter temperatures. Therefore, the objectives of the study were (1) to identify the existence and nature of trends in total precipitation, snowfall, rainfall, the number of snowy days, the number of rainy days, and for selected stations across Southern Ontario, and (2) to explore the possible correlations between winter rainfall and snowfall with daily mean winter minimum temperatures.

2. Methodology

The weather statistics for Ontario reveal that almost all snowfalls have occurred during the months of November through April [33,34]. Therefore, the six-month period from November to April was considered winter.

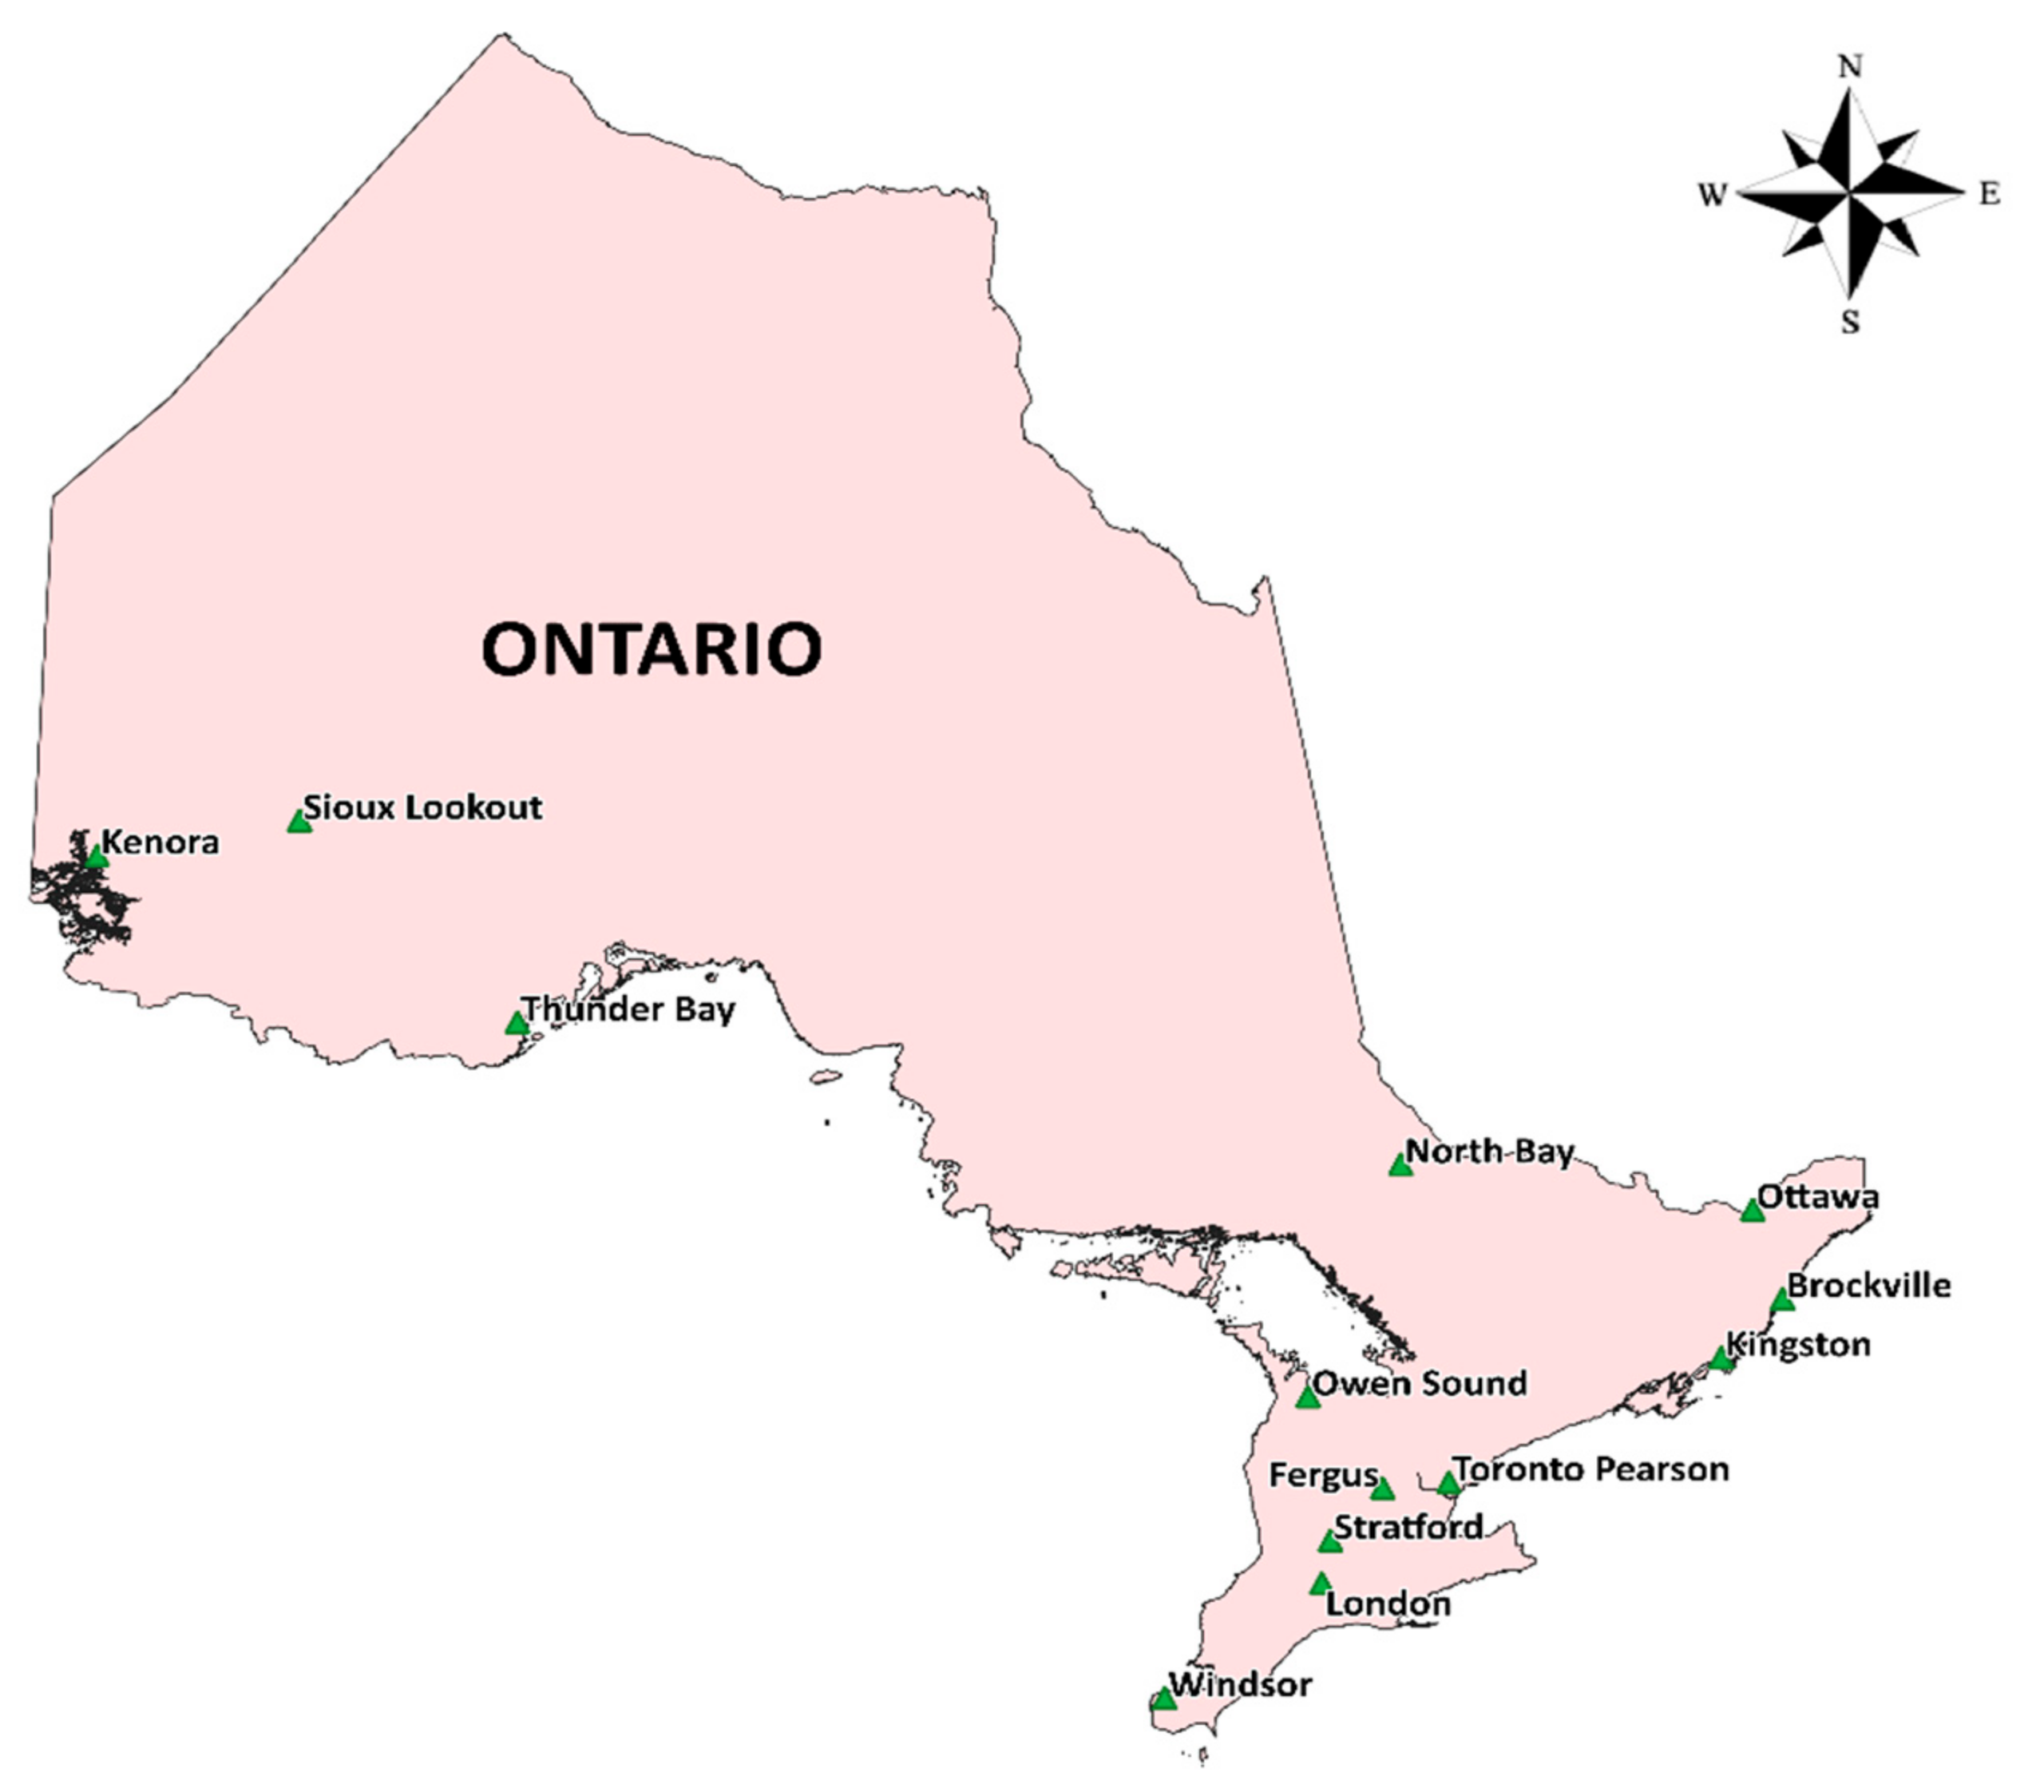
2.1. Selection of Stations and Periods of Record

The climatological stations in Ontario were selected from the Environment Canada database on the basis of the following criteria: (1) the selected station is active and has a relatively long period of continuous records for both temperature and precipitation; and (2) the set of stations should be distributed across the province and should be representative of the climatic conditions of the region. Using the above criteria, 13 stations were selected (Figure 1 and Table 1). The thirteen selected stations have been grouped into 3 broad geographic regions: Northwest (Sioux Lookout, Kenora, and Thunder Bay), Southeast (North Bay, Ottawa, Brockville, Kingston Pumping Station, and Toronto), and Southwest (London, Windsor, Fergus Shand Dam, Owen Sound, and Stratford) Ontario. The daily minimum temperature and precipitation (snowfall & rainfall) were collected from Environment Canada.
Information on snow water equivalent (SWE) of snow cover for the vertical depth of water is important and critical for streamflow, flood, and drought conditions. SWE is also an important environmental factor for climate analysis. There are various SWE measurement methods available to provide in situ knowledge. The snow water equivalent of snowfall for most stations was estimated by assuming the snow density of 0.1 g per cubic centimeter. Hence, one centimeter of snow was equal to one millimeter of rain. The variables relating to winter were the total precipitation (Pw), total rainfall (Rw), and total snowfall (Sw).

2.2. Description of Statistical Analysis

Five types of statistical analyses were performed to explore the existence and nature of trends in a time series of the selected temperature and precipitation variables and the existence and extent of correlation amongst those variables. The analysis included the Mann–Kendall (MK) test, Sen’s Slope, Alexandersson’s Standard Normal Homogeneity Test (SNHT), Linear regression analysis, and Correlation Analysis.

2.2.1. Mann–Kendall Test

The Mann–Kendall (MK) test is a non-parametric test for the detection of trends in a time series. The MK test was found to be one of the most suitable techniques for the analysis of trends in a climatological time series [35]. The equation developed by Onoz and Bayazit [36] for the MK test was used for detecting the existence and significance of trends in a time series of temperature and precipitation variables. The null hypothesis (H0) for the MK test indicates that there was no trend in the time series data and the alternative hypothesis (HA) indicates that there was a decreasing or increasing trend. The significance level (0.05) means the confidence level is 95%. In other words, it measures the strength of association of the cross-tabulations [37].

2.2.2. Alexandersson’s Standard Normal Homogeneity Test (SNHT)

The SNHT detects variations in the time series of rainfall data. This test is widely used to test the homogeneity in the time series data. It also provides the temporal location of heterogeneity. As such, the test was applied to a series of ratios to compare the observations of a measuring station with the average of numerous stations. The test was performed at a 5% significance level and was performed under two hypotheses: the null hypothesis states that the data are homogenous, and an alternative hypothesis indicates that heterogeneity exists in the data. The p-value helped determine the heterogeneity in the data set.

2.2.3. Linear Regression Analysis

Linear regression, a parametric trend analysis method, is an effective technique to determine the existence and significance of a trend in time series data. Parametric methods presume that the time series data are independent and the deviations from the fitted regression line are normally distributed. In this study, the linear regression method was applied to identify the existence, nature, and significance of trends in the time series data established for the various temperature and precipitation variables.

2.2.4. Correlation Analysis

In statistics, correlation, R, is a statistical relationship between two or more random variables or observed data. R lies between −1 and +1 and signifies the nature and strength of the relationship between the two variables. Correlation does not confirm causation.

2.2.5. Pre-Whitening and Sen’s Slope Techniques

One of the issues in detecting trends in hydro-climate data is the presence of serial correlation which refers to persistence in the data. Therefore, the pre-whitening method suggested by Zhang et al. [13] was used to evaluate the historical observed data.
The minimum number of readings (n) required for the Mann–Kendall test is 50. In this study data from 13 stations is analyzed for trend detection using the Mann–Kendall test. Out of these 13 stations, 4 stations have less than 50 years of datasets, namely, Brockville, Kingstone, Own Sound, and Stratford. The test results are summarized in Table 2. Pre-whitening analysis showed no change for most of the variables across Ontario; however, some variables showed a significant change as indicated by p-values (Supplementary Materials, Table S1). The significance level used was 5%. The null hypothesis is that there is no trend in the series, whereas the alternative hypothesis states that there is a trend in the series. For all p-values less than 0.05, the null hypothesis was rejected and the alternate hypothesis was accepted. Sens’s slope was also calculated for all 13 stations. The Sen’s slope value was not affected by outliers; therefore, it gave the most robust estimate of the trend slope.
Alexandersson’s Standard Normal Homogeneity Test (SNHT) was also applied to the data for all selected stations. All the data (temperature and precipitation) were checked for homogeneity. SNHT also provided the temporal location of heterogeneity. The details of the SNHT test are given in Table S1. The significance level was kept at 5%. The null hypothesis states that the data are homogenous, whereas the alternate hypothesis states that heterogeneity exists in the data.

3. Results and Discussion

Historical winter precipitation, snowfall, and rainfall trends for all stations were studied and the results of the data and statistical analysis are summarized in the following section.

3.1. Spatial Trend in Winter Precipitation, Snowfall, and Rainfall during Winter

3.1.1. Spatial Variation of Winter Precipitation

The mean winter precipitation values range from 190 mm to 579 mm, revealing a more than 3-fold spread across different stations (Table 1 and Table 3). The highest mean winter precipitation (579 mm) and the highest mean winter snowfall (330 mm) were observed at Owen Sound, and the lowest mean snowfall was at Toronto. The overall mean appeared to be 400 mm/year.
The coefficients of variation for winter precipitation ranging from 0.13 to 0.29 with a mean of 0.19, reveal that at each station, about two-thirds of the time the annual winter precipitation values are within ± 19% of the mean (Table 3). In other words, about one-third of the time, the annual winter precipitation values are greater than 1.19 times the mean or less than 0.81 of the mean. The relatively constant coefficients of variation compared to the wide range in mean winter precipitation values, reveal that the temporal variability of winter precipitation values is somewhat proportional to the mean values
To explore the relationship of the mean winter precipitation with latitudinal location (Table 1), the station means versus locations are shown in Table 3. The data reveals that the winter mean precipitation decreases with increasing latitude. The most northerly stations (Sioux Lookout, Kenora, and Thunder Bay) exhibit a mean winter precipitation of 227 mm using Table 3 data, whereas the average of the mean winter precipitation for the remaining 10 southerly stations is 452 mm. Therefore, the mean winter precipitation values for the northwestern stations are about 50% of the winter precipitation values observed at the southerly stations. The average of the five southwestern stations (Owen Sound, Fergus, Stratford, London, and Windsor) exhibits a mean winter precipitation of 480 mm. At the five southeastern stations (North Bay, Ottawa, Brockville, and Kingston), the mean winter value is 426 mm. These values clearly indicate geographical differences between the northern and southern stations.

3.1.2. Spatial Variation in Winter Snowfall

The mean winter snowfall values reveal a large scatter across the stations ranging from 119.2 mm to 330.6 mm (Table 3). These data also show no direct link between snowfall and latitude; however, the scatter in the mean values is much greater for the southern stations. The wide scatter in snowfall across the south of the province is attributable to the occurrence of the ‘lake effect’ in snowfalls in the various parts of this region [38]. The lake effect is defined as localized areas of heavy snow downwind of the Great Lakes and occurs in the fall and winter as cold air moves over the relatively warmer lakes.
The coefficients of variation for winter snowfall, ranging from 0.23 to 0.41 with a mean of 0.25, reveal that at each station, about two-thirds of the time the annual winter snowfall values are within ± 25% of the mean (Table 3). In other words, about one-third of the time the annual winter snowfall values are greater than 1.25 times the mean or less than 0.75 times the mean. The relatively constant coefficients of variation, the mean of 0.25, further indicate that the temporal variability of winter snowfall is roughly proportional to the mean values.

3.1.3. Spatial Variation of Winter Rainfall

The coefficients of variation for winter rainfall range from 0.20 to 0.69, with a mean of 0.33, revealing that at each station, about two-thirds of the time the annual winter rainfall values are within ± 33% of the mean (Table 3). The coefficients of variation for the northwestern stations range from 0.48 to 0.69 with a mean of 0.58, and for the more southerly stations range from 0.20 to 0.33 with a mean of 0.25. That is, the relative variability of winter rainfall in the northwest region of the province, which is almost twice the relative variability of winter rainfall in the southern region of the province, despite the fact that the absolute variability (Sd) is the smallest in the northwest region, which is about half that in the southwest region. These differences in absolute and relative variability are the result of the large difference in means between the northwestern and more southwestern stations.
The mean winter rainfall in Table 3 also shows that there is a wide variability of winter rainfall magnitude across the province, from 39.6 mm to 316.9 mm, the largest values being 8 times the smallest values. The winter mean rainfall decreases with increasing latitude (Table 3). The most northerly stations (Sioux Lookout, Kenora, and Thunder Bay) exhibit an average mean winter rainfall of 55 mm, whereas the average of the winter rainfall means of the remaining 10 southerly stations is 261 mm. The mean winter rainfall values for the northwestern stations are on average about 21% of the winter rainfall values observed at the southern stations. The average mean winter rainfall for the five southwestern stations is 277 mm and the resulting mean and variability statistics are reported in Table 3. The average of the five southeastern stations exhibits a mean value of 244 mm. These results reveal that the overall mean in the southeast is slightly lower than the overall mean in the southwest and that the variability of station means is greater in the southeast.

3.2. Effects of Variations in Winter Temperature on Precipitation, Snowfall, and Rainfall

The effects of temporal variation in the daily temperature were investigated to describe the temporal variations in the nature of precipitation (rainfall or snowfall), the number of snowy days and rainy days, and the ratio of winter snowfall and rainfall to total winter precipitation.

3.2.1. Temporal Variation in Winter Precipitation

The winter precipitation trend analysis results (Table 4) show that winter precipitation values have mixed non-significant trends, increasing at some locations and decreasing at other locations. The Mann–Kendall test and the regression analysis results reveal five decreasing trends and eight increasing trends. All three stations in the northwestern region of the province exhibited decreasing trends. The trend slopes for the winter precipitation amounts are quite small. The mean positive slope is +0.65 mm/year, the mean negative slope is −0.90 mm/year, and the mean overall slope is +0.06 mm/year. Therefore, it is reasonable to say that winter precipitation has not changed significantly across Ontario during the period from 1939 to 2008.
The regression lines for winter precipitation, snowfall, and rainfall for selected stations (Sioux Lookout, Ottawa, Toronto Pearson, and London) are presented in Figure 2. The trend lines reveal that snowfall has been the dominant form of winter precipitation for the northern stations such as Sioux Lookout. Winter rainfall and snowfall have been roughly equal each year for Ottawa and winter rainfall has been the dominant form of winter precipitation for the southern stations (Toronto Pearson and London). Overall, in Ontario winter rainfall has been increasing, snowfall has been decreasing, and total winter precipitation has remained essentially unchanged for all stations considered.

3.2.2. Temporal Trend of Winter Snowfall

The data for winter snowfall for all stations have been analyzed and mentioned in Table 3. Also, Figure 2 includes the fitted linear regression line for summary and comparative purposes. In addition, the statistical results from the Mann–Kendall test and the linear regression analyses for winter snowfall have been summarized in Table 4. The winter snowfall analyses indicate that total winter snowfall values have increased at some locations and decreased at other locations. The Mann–Kendall analysis reveals nine decreasing trends and four increasing trends, and the linear regression analysis also shows nine negative or decreasing slopes and four positive or increasing slopes. The trends indicated by the two types of analyses match exactly. Generally, winter snowfall was identified to be significant (i.e., for only 6 of the 13 stations) perhaps once again due to large variability in the time series. Five of the nine decreasing trends and one of the four increasing trends were significant. Total winter snowfall has decreased at all 3 northwestern stations, and at 6 of the 10 southern stations.
Table 4 also shows that the mean negative slope is −0.79 mm/year and the mean overall slope is −0.46 mm/year. The average trend slope of winter snowfall at the three northwestern stations is −0.727 mm/year, whereas the average trend slope at the five southwestern stations is −0.17 mm/year. The average trend slope of winter snowfall at the five southeastern stations is −0.60 mm/year. These regional mean values further reveal the wide variability across the southern part of the province, with no simple latitudinal impact. The relative trend slopes of winter snowfall range from −9% to 6% per year for the 13 stations with a mean of −2.40%. Therefore, it can be concluded that although the nature and magnitude of trend slopes for winter snowfall varies considerably across Ontario, there is some evidence that the snowfall amounts have been decreasing temporally.

3.2.3. Temporal Trend of Winter Rainfall

The temporal trend in winter rainfall analysis reveals that winter rainfall values have increased at all stations except Kingston (Table 4). The Mann–Kendall analysis reveals 12 increasing trends and 1 decreasing trend, and the linear regressions analysis also reveals 12 positive or increasing slopes and 1 negative or decreasing slope. Only half the trends were identified to be significant at the 95% level of confidence, inevitably a result of the large variability in the dataset or no significant trend in the data. The regression lines for winter rainfall for selected stations of the broad geographic regions Sioux Lookout (northwest), Ottawa, Toronto Pearson (southeast), and London (southwest) are also presented in Figure 2. The most significant aspect of winter rainfall is that nearly all the station trends other than Kingston were found to be increasing across Ontario.

3.3. Variations in Winter Temperature and Precipitation

The temporal variation in the daily temperature was investigated to describe the temporal variations in the nature of precipitation (rainfall or snowfall), the number of snowy days and rainy days, and the ratio of winter snowfall and rainfall to winter precipitation.
Generally, it is expected that the sum of the winter rainfall and winter snowfall trend slopes would be similar to the total winter precipitation trend slope at each station. However, the values in Tables S2 and S3 reveal that this expectation is not always realized. The large variability in the time series and the different proportions of rainfall and snowfall, cause the slopes of the winter precipitation time series to vary from the sums of the rainfall and snowfall trend slopes. This may be considered a weakness of the Sen’s slope estimates. Since changing snowfall into rainfall is dependent on change in minimum temperature during winter, the following discussion explains the effects of winter minimum temperature on precipitation.
The data in Table 5 reveals the results from the rainfall versus winter temperature and snowfall versus winter temperature regressions. It is observed that the mean minimum and the mean temperature have increased across the province since 1939. The rate of increase is somewhat location-dependent, i.e., lower in the north; however, the variations in the rate of increase across the south are not very clear.

3.3.1. Trend of Winter Precipitation, Rainfall, and Snowfall

The results in Table S2 also show that winter precipitation has increased at some stations and decreased at others, and a pattern is different to ascertain. Winter snowfall has decreased at most locations and the trend and rate of change is also location-dependent. Winter rainfall has increased across the province and the rate of increase appears to be location-dependent, with the rate of increase appearing less for the northern stations.

3.3.2. Spatial Variability in Winter Temperature

To explore the spatial variability in the temperature, the winter mean minimum temperature for some stations (lower and higher latitude) are shown in Figure 3 and these data reveal that the winter mean minimum temperatures decrease with increasing latitude.

3.3.3. Temporal Trends of Winter Minimum Mean Temperature

The results of the temporal winter mean minimum temperature trend analyses are presented in Table S3. This analysis reveals that the mean minimum temperature has increased at all stations except Kingston. Again, for analysis purposes and for maintaining consistency with the precipitation data, the stations have also been grouped into three broad geographic regions: northwest, southwest, and southeast. The regression lines for the winter mean minimum temperature for the selected station in a region (Sioux Lookout (northwest), Ottawa, Toronto Pearson (southeast), and London (southwest)) are presented in Figure 4. These lines show similar trends for twelve stations except for one station (Kingston) that has a decreasing trend. Also, 50% of the increasing trends are significant at the 95% level (i.e., six of the mean minima time series).
It is likely that the relatively small trend slope values in conjunction with the very substantial variances have prevented more trends from being statistically significant. Nonetheless, the occurrence of 12 increasing trends with 12 positive linear regression slopes for the temperature time series analyzed, provides strong evidence that the winter minimum temperature has been increasing over the last 70 years. The data in Table 4 also shows that the Kingston data were only for a 29-year period; therefore, it could be the reason for the anomaly when compared with the trends for other stations. In a study by Ahmed et al. [39], it was mentioned that 35 to 40 years of data should be used for trend analysis.

3.3.4. Correlations of Daily Mean Temperature and Winter Precipitation

Interactions between the amount of snowfall, rainfall, and minimum temperature during winter were also investigated. The results of the statistical analysis are summarized in Table 5. The analysis revealed that the time series of snowfall and rainfall versus the mean minimum temperature during winter have a correlation for all 13 stations. With the increase in winter mean minimum temperature, snowfall has decreased and rainfall has increased for almost all the stations (Figure 4 and Table S3). This shift in the type of precipitation (snowfall versus rainfall) will have crucial implications for overall water management in the region.
These data also indicate that the linear regression slopes vary somewhat across the southern part of the province. The overall mean regression slope between snowfall and the mean minimum winter temperature is −16.08 mm/°C, the highest (−8.26 mm/°C) for the southwestern stations and the lowest (−17.28 mm/°C) for the northwestern stations. Similarly, the overall mean regression between the rainfall and mean minimum winter temperature is 14 mm/°C, the highest (23.86 mm/°C) and the lowest (6.77) for the southern stations, and the highest (9.61) and the lowest (1.74 mm/°C) for the northwestern stations. In other words, winter snowfall has been decreasing at a rate of 16 mm/°C and rainfall has been increasing at a rate of 14 mm/°C. The decrease in the amount of snowfall would impact the timing and the rapid and slow components of streamflow and may also impact evapotranspiration in various regions.

3.3.5. Variability of Number of Snowy days

To further strengthen the analysis of the changes in precipitation amount and form, a summary of the changes in the number of snowy days and with respect to latitude is presented in Table 6 and Table 7. The mean snowy day values depict a large scatter across the province, with the means ranging from 40 days to 80 days (Table 6). The standard deviations and coefficients of variation listed in Table 6 at each station over time reveal that the number of snowy days varies considerably over the years at all stations. The coefficients of variation, ranging from 0.13 to 0.26 with a mean of 0.19, reveal that at each station about two-thirds of the time, annual winter snowy day values are within ± 19% of the mean. The relatively constant coefficients of variation, with a mean of 0.19, further indicate that the temporal variability of the number of snowy days is roughly proportional to the mean values. In addition, the relationship between mean snowy days and latitude given in Figure 5 helps clarify that the mean values are weakly linked to the latitude. Mean snowy days at the northwestern stations varied from 60 days to 74 days, the full range of 40 days to 80 days occurring at the southern stations.

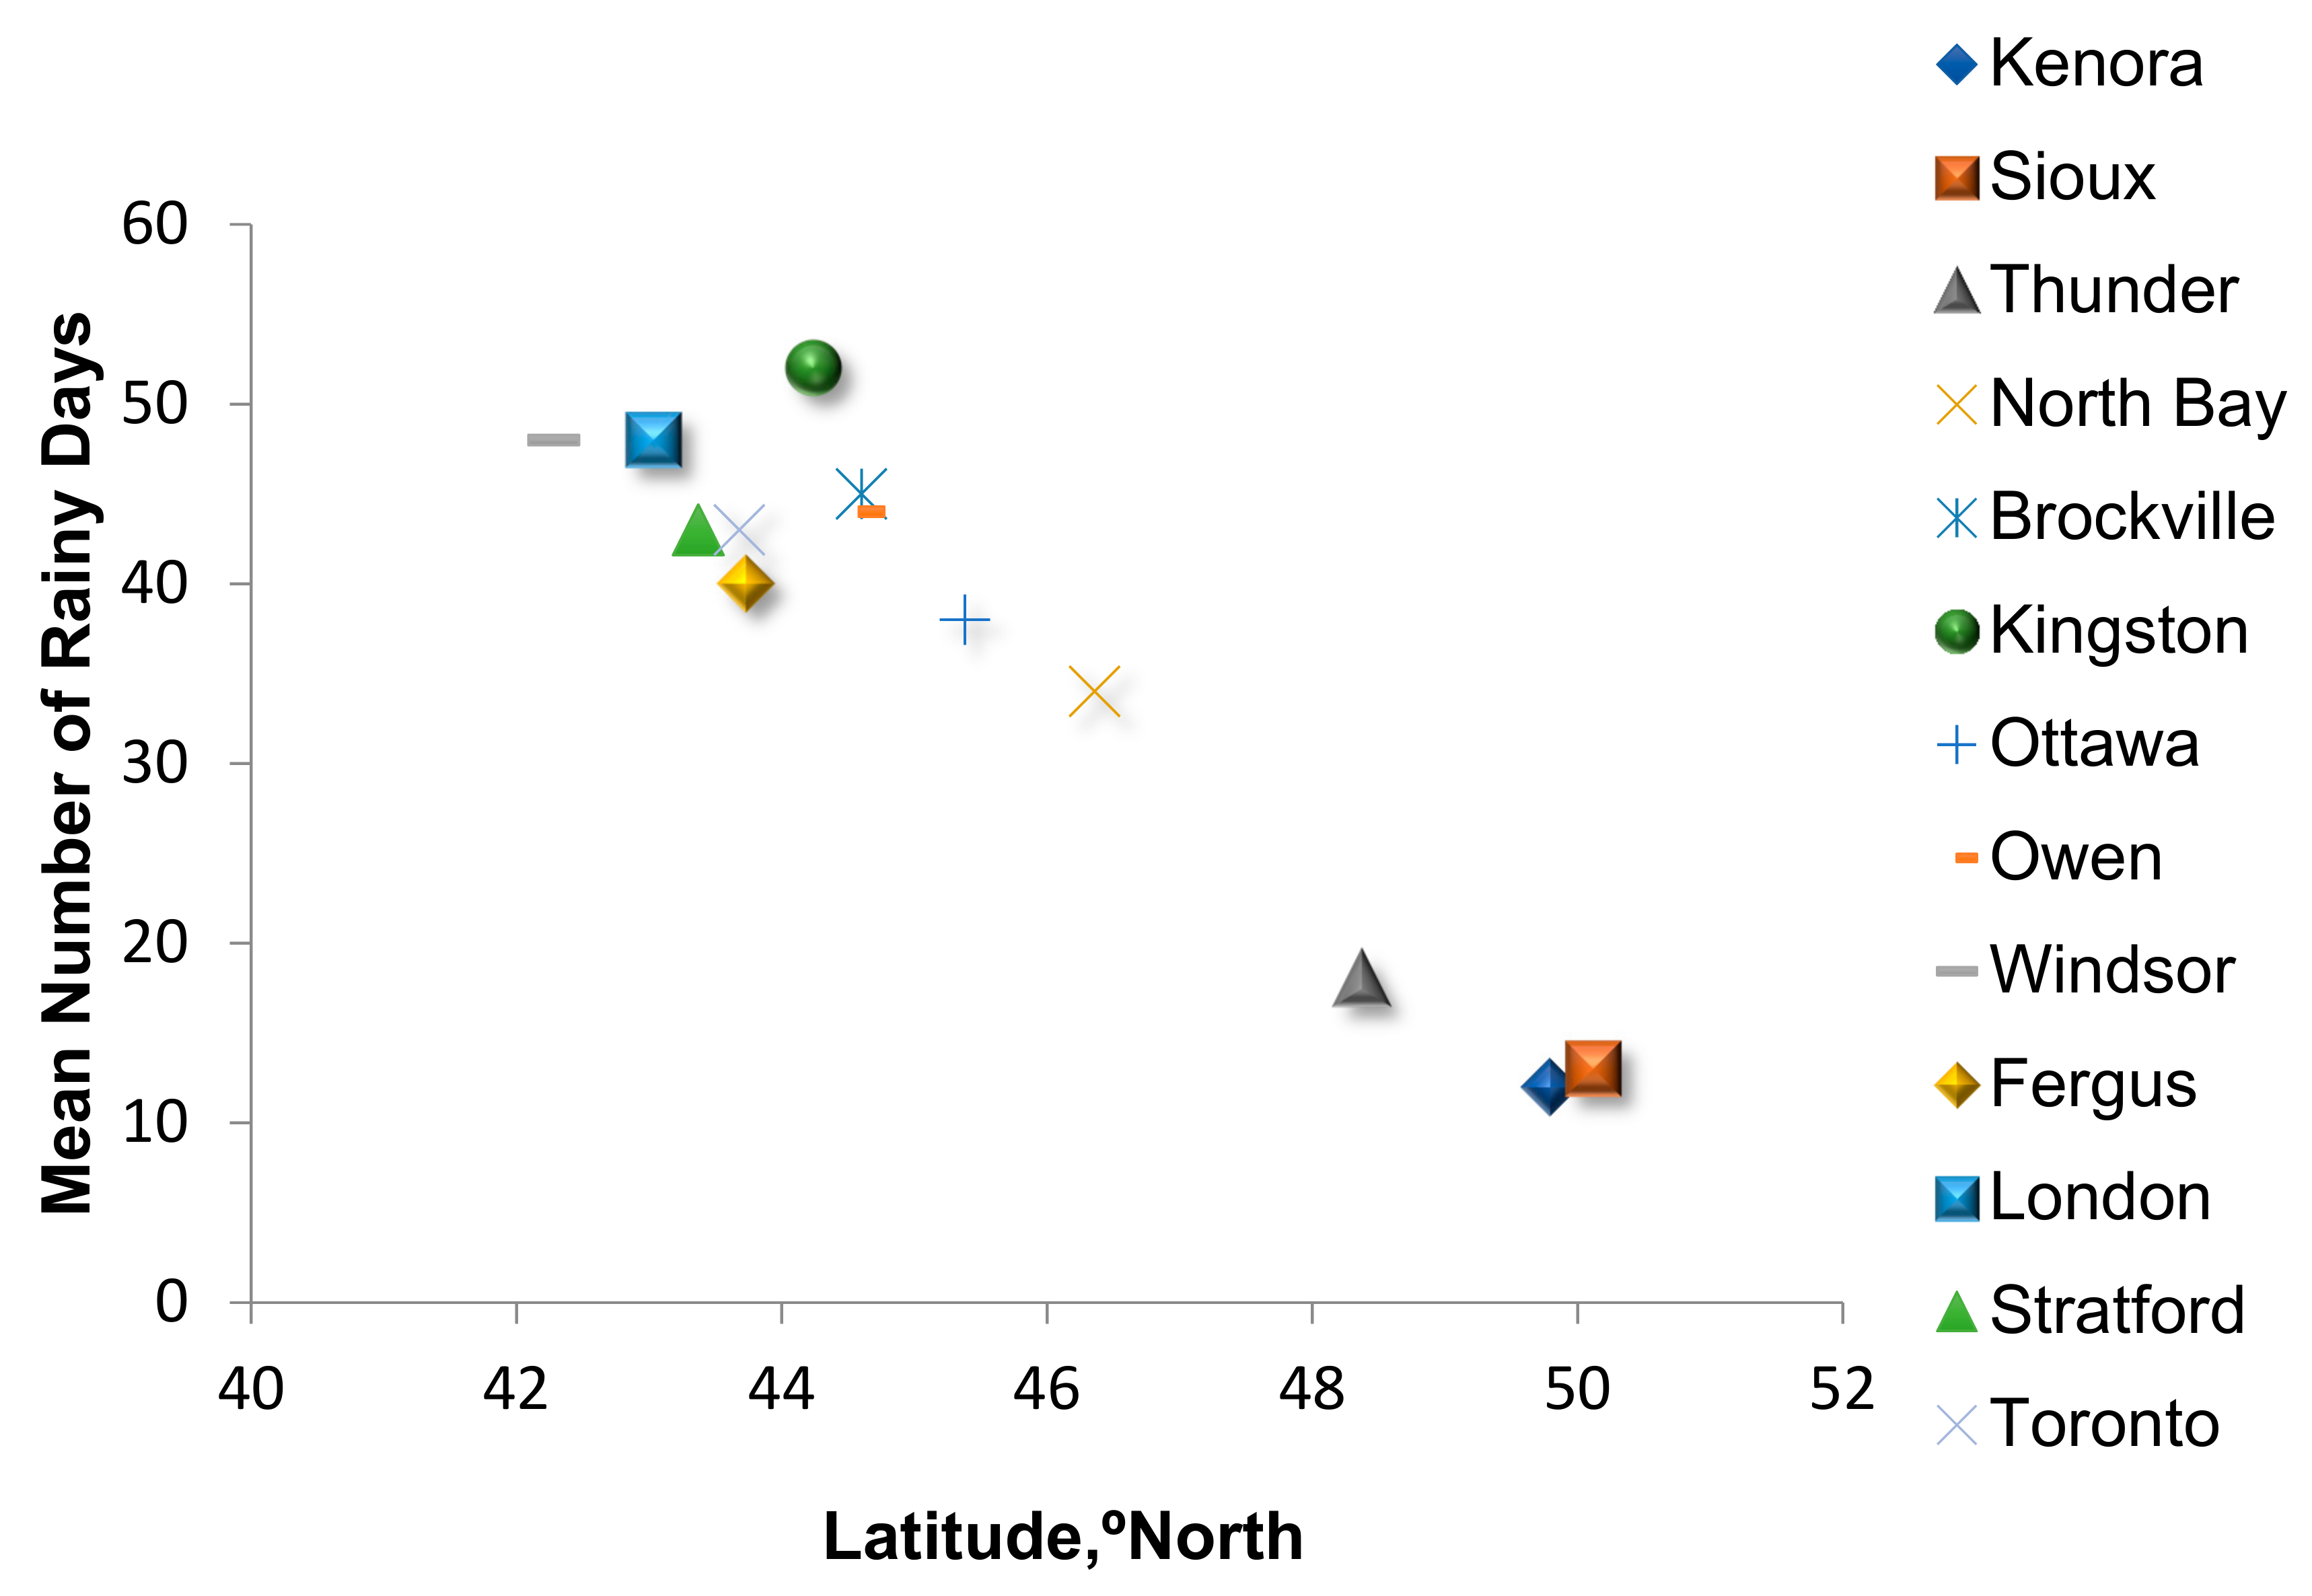
3.3.6. Number of Rainy Days in Space and Time

A summary of pertinent statistics and data has also been presented to clarify the variability in the number of rainy days across the province (Table 6). The mean number of rainy day values shown in Table 6 depicts a wide range across the province, from 12 days to 48 days. Perhaps more significantly, the station means appear to be strongly linked to the latitude. To clarify this linkage, the station means have been plotted versus the latitude in Figure 6. As shown in Table 7 and Figure 7, the lowest number of rainy days occur at the northwestern stations. The highest mean number of rainy days occurs at the southwest and southeastern stations.
The standard deviations and coefficients of variation listed in Table 6 and the absolute and relative indices of the variability of rainy days at each station over time, show that the number of rainy days varies considerably over time at all stations. The coefficients of variation range from 0.15 to 0.38 with a mean of 0.23, revealing that at each station about two-thirds of the time, the annual winter rainfall values are within ± 23% of the mean.
The time series plots of the number of rainy days for all stations using the fitted linear regression lines for summary and comparative purposes are shown in Table S2 and Figure S1. The statistical results from the Mann–Kendall tests and the linear regression analyses have been summarized in Table 7.
The trend analysis of the number of rainy days presented in Table 7 shows that the rainy days are increasing at most stations. The Mann–Kendall analysis reveals 11 increasing trends and 2 decreasing trends, and the linear regression analysis depicts 11 negative or decreasing slopes and 2 positive or increasing slopes. In addition, both analyses gave similar results. About half the trends (five increasing and one decreasing) were identified to be significant at the 95% level. The overall mean trend slope is +0.13 days/year, which appears small but worth noting. The mean positive slope is +0.16 days/year, the mean negative slope is −0.06 days/year, and the mean overall slope ranges from −0.12 to 0.43 days/year, with two-thirds of the values falling between 0.06 and 0.19 days/year.
The overall mean R2 of 0.12 reveals that the linear regression trend slopes account for about 12% of the variability in the datasets, reflecting once again the substantial variability in the data. Nonetheless, the large number of increasing trends, many of which are significant, indicate that the number of rainy days is likely increasing during winter across Ontario.

3.4. Central Tendency and Variability in the Proportions of Winter Rainfall and Snowfall

To further strengthen the results, Table 8 shows the data and the results of the statistical analysis to clarify the variability of the relative amounts of rainfall to total precipitation (R/P) and the snowfall to total precipitation (S/P) ratios for the periods of record. The mean winter R/P and S/P values shown in Table 8 are quite revealing about the proportion of rain and snow in winter precipitation across Ontario. The overall mean values are about 0.50 (i.e., 50 percent of the precipitation is rain and 50 percent is snow). However, there is a large variation in the station mean values across the province (from 0.17 to 0.73 for R/P, and from 0.29 to 0.86 for S/P). The trends show a significant link between the station R/P and S/P means and the latitude. To explore these linkages further, the station means have been plotted and, along with the analysis of the mean values (Table S1), they also clearly reveal that the R/P decreases and the S/P increases with increasing northern latitude in the province.
The analysis also shows that winter R/P and winter S/P values vary considerably over time at all stations, as revealed by the standard deviations and coefficients of variation. The standard deviations shown in Table 8 exhibit a virtually constant value of 0.11 for R/P and S/P for all stations. It is also presented that the coefficients of variation vary somewhat as the R/P and S/P mean values vary with the station; the mean Cv value was found to be approximately 0.25.
Overall, winter S/P has decreased at most of the stations, whereas winter R/P has increased at all stations. The number of snowy days has decreased at most locations and the trend and rate of change are not location-dependent. The number of rainy days has increased across all stations, the rate of increase is location-dependent, and the rate of increase appears small for the northern stations.

4. Possible Hydrological Implications

Overall, the study findings show the effect of minimum temperature change on winter precipitation, winter snowfall, and winter rainfall. The results show that the magnitude of total precipitation is essentially unchanged. The increasing and decreasing trends are non-significant. However, there are decreasing trends of snowfall and increasing trends of winter rainfall. In general, the warm temperatures may possibly affect the hydrological cycle and consequently change the hydrological water balance of the province. In addition, the temperature may enhance evapotranspiration, which may lead to water availability issues in the area in the future. The change in precipitation regimes from snowfall to rainfall will result in reduced snowpack, tile flow, and soil erosion during winter
The study area is dominantly agricultural and dependent on streams and rivers for water availability for multiple uses. The reduction in snowfall may affect the amount of base flow in the future since snowmelt is a source of base flow through the seasons. In addition, it will have an impact on the tile flow during winter. Preliminary observations indicate that the tile flow occurs more frequently during winter. In addition, an increase in rainfall will increase the amount of surface runoff. The increased surface runoff could result in more soil erosion, sediment, and nutrient transport to the streams and reservoirs and flooding of low-lying areas. Further, a decrease in base flow during spring and an increase in surface runoff during winter may lead to possible drought conditions during the growing season, assuming an increase in the minimum temperature as well.

5. Conclusions

Based on a comprehensive analysis of 70 years of precipitation (rainfall and snowfall) and temperature data at several stations across Ontario, the following conclusions are drawn:
(a)
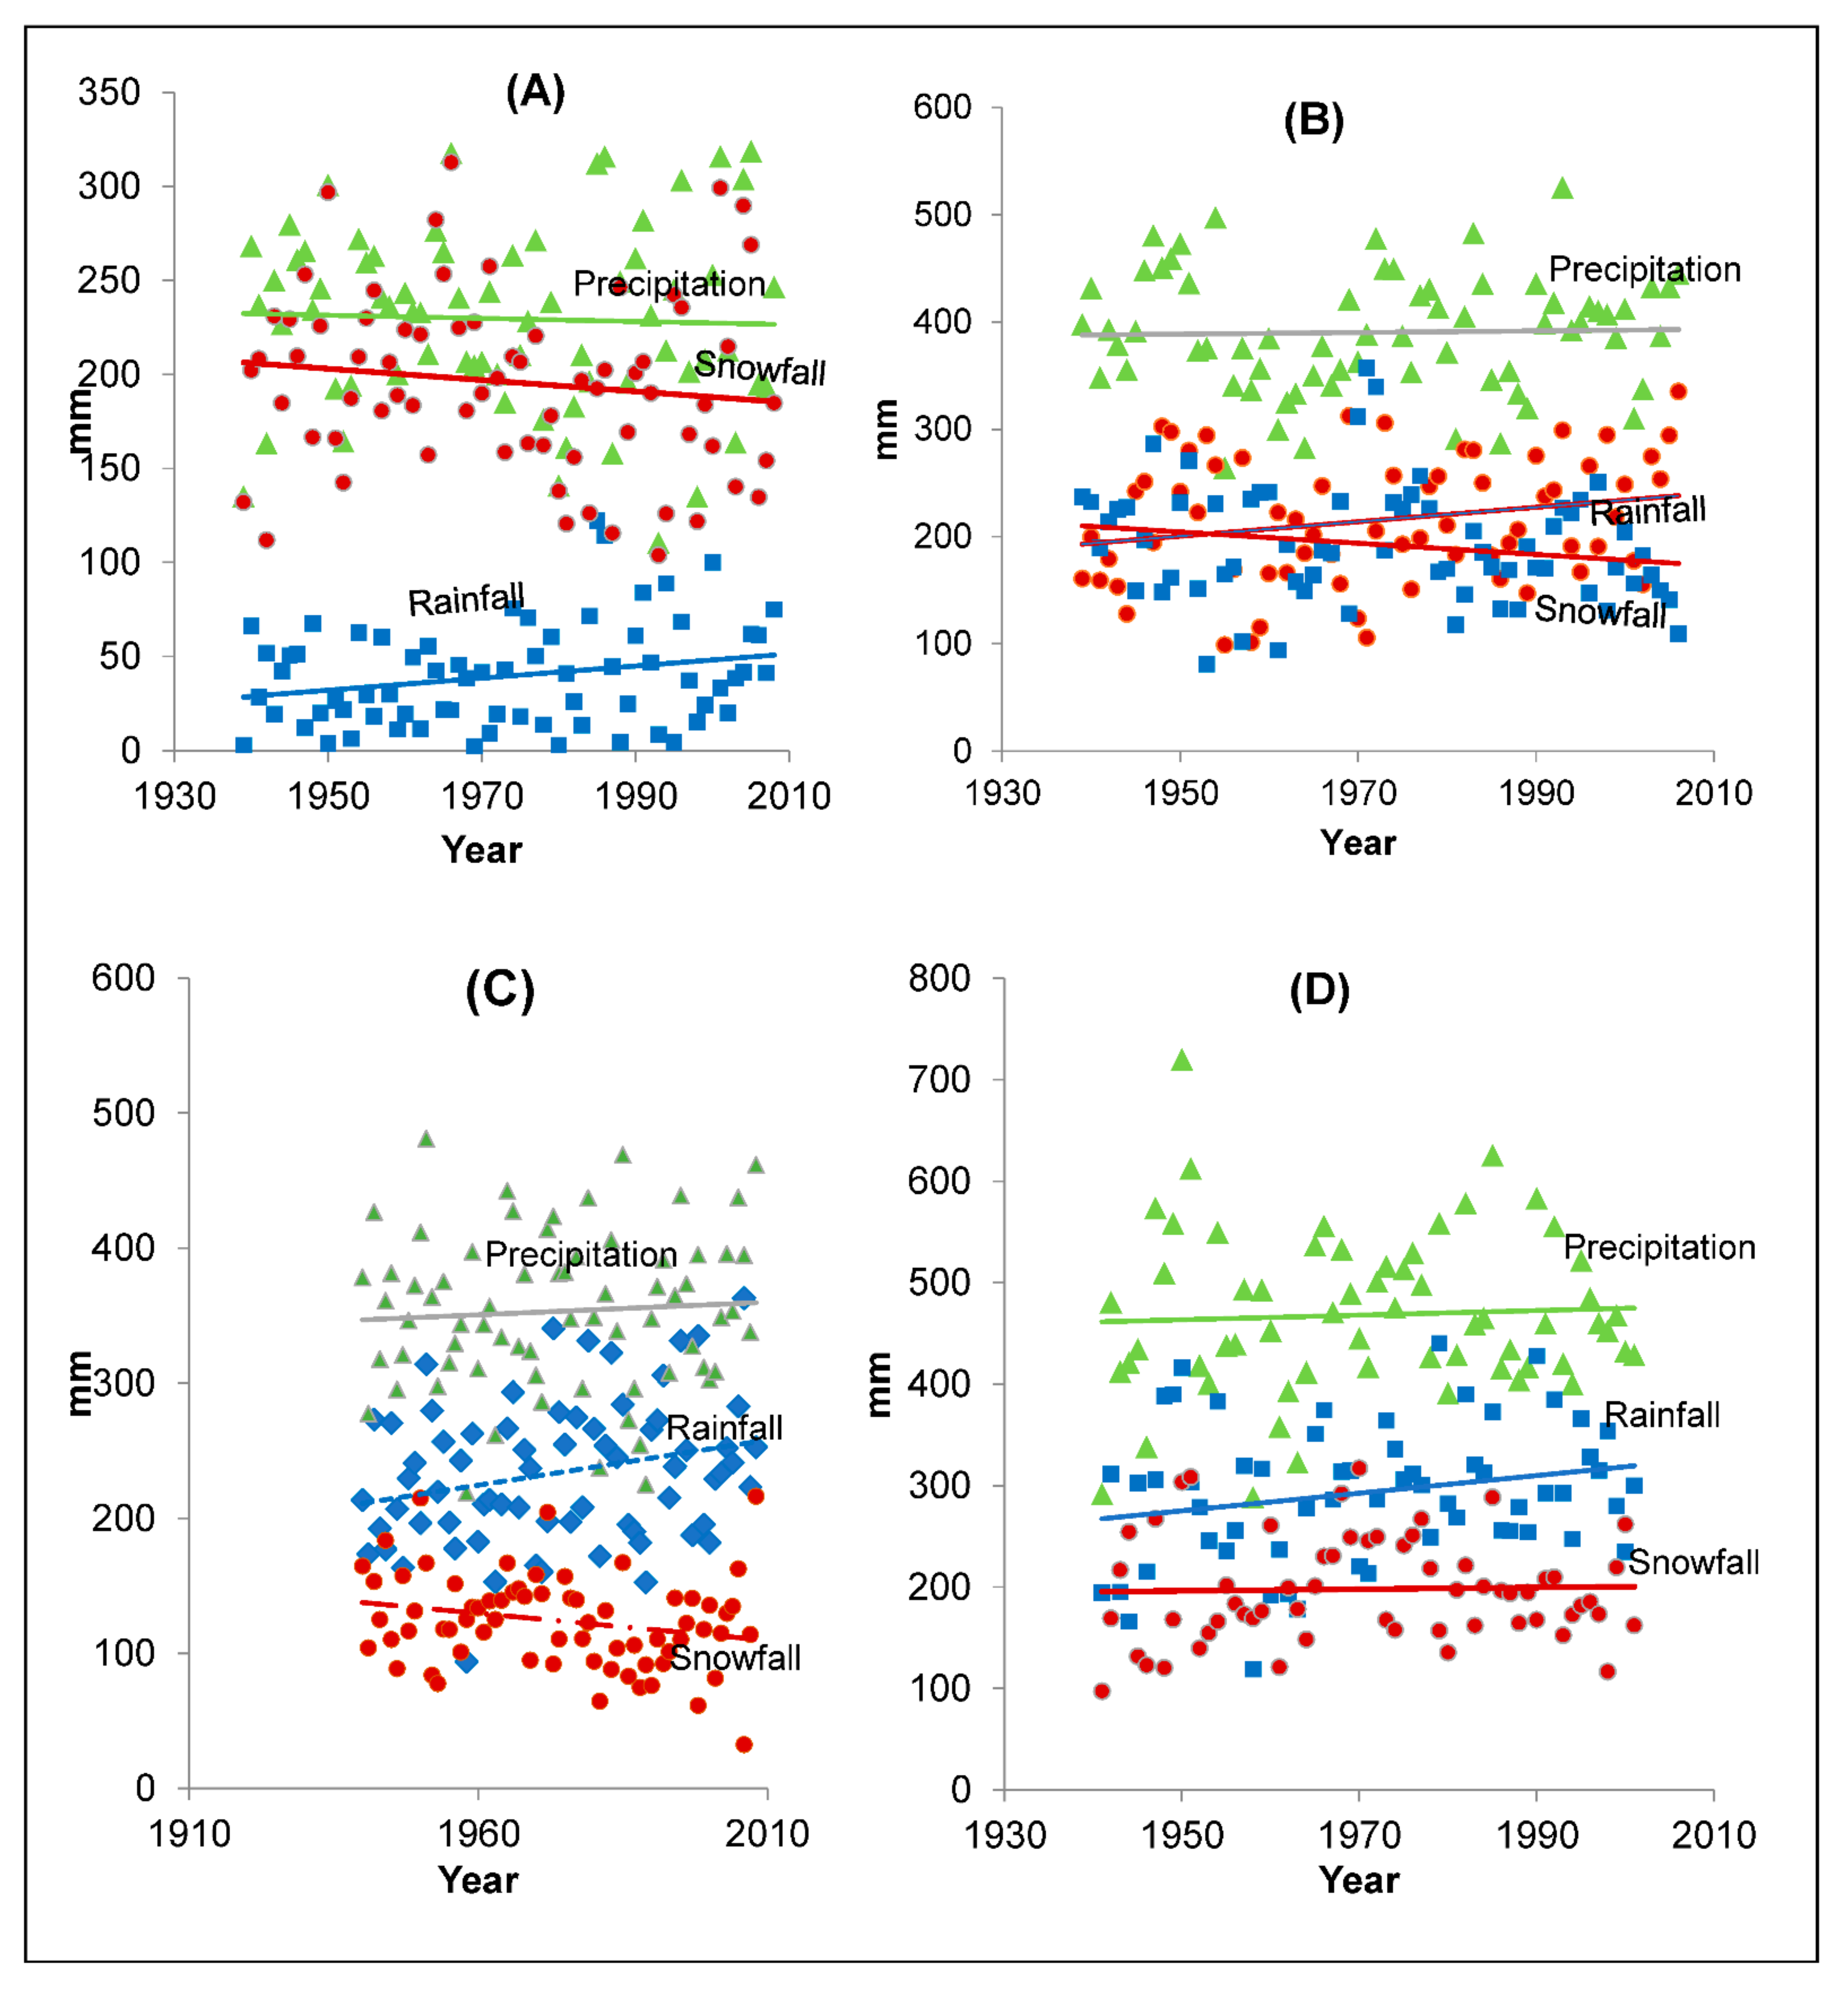
There is a significant spatial variation in the total winter precipitation in Ontario. There are also significant temporal trends in the total winter precipitation. At some stations, there is a slight increase and at other stations a slight decrease in the total precipitation. Essentially, the total winter precipitation remained unchanged during the study period.
(b)
The mean winter snowfall across the province shows a large scatter ranging from 119.2 mm to 330.6 mm. The scatter is much greater for the southwestern region. The winter rainfall across the province varies from 39.6 mm to 316.9 mm with a coefficient of variation ranging from 0.20 to 0.69, with a mean of 0.33, revealing that at each station about two-thirds of the time, the annual winter rainfall values are within ± 33% of the mean. The snowfall is decreasing and winter rainfall is increasing at most of the stations. The winter mean rainfall decreases northward in the province.
(c)
The snowy day analysis depicts a large scatter across the province, with the average number varying from 40 days to 80 days; this analysis also shows that the number of snowy days varies considerably from year to year at all stations.
(d)
The changes in the precipitation regime will have future hydrological implications for water management.
It is important to mention the limitations of the study regarding the climatic data. The variable years for the precipitation/temperature data for all the stations was one of the limitations of a robust analysis of the historical data. For further studies, more recent years can be included with the same or different statistical analyses to conclude/support the current findings. The study can also be extended by comparing the streamflow in respective watersheds with the change in precipitation on a temporal basis, and hydrologic modeling can be performed after calibration for future stream- or river flow analysis.
The results of the study are also relevant for future hydrologic assessments of the availability and use of water based on the changes in climatic variables and their effects on water resources availability and management for future demand.

Supplementary Materials

The following supporting information can be downloaded at: https://www.mdpi.com/article/10.3390/hydrology9050081/s1, Figure S1: Linear regression of number of rainy days versus years for 13 stations across Ontario; Table S1: Alexandersson’s Standard Normal Homogeneity Test (SNHT) performed for all 13 stations. Table S2: Trend slopes for precipitation, rainfall and snowfall over winter period. Table S3: Temporal trend analysis for winter daily minimum mean temperature for all stations.

Author Contributions

All of the analysis of the data, and the preparation of the manuscripts were primarily completed by S.I.A. and A.A., under the supervision of R.R., T.D. and P.G.; Conceptualization, R.R., S.I.A., A.A., T.D. and P.G.; methodology, S.I.A., A.A., R.R. and P.G.; formal analysis, S.I.A. and A.A.; investigation, S.I.A., A.A., R.R. and P.G.; resources, R.R.; data curation, A.A.; writing—original draft preparation, A.A., S.I.A., K.S. and A.K.; writing—review and editing, S.I.A., A.A., R.R., P.G., K.S. and A.K.; visualization, S.I.A. and A.A.; supervision, R.R.; project administration, R.R. All authors have read and agreed to the published version of the manuscript.

Funding

This research received no external funding.

Institutional Review Board Statement

Not applicable.

Informed Consent Statement

Not applicable.

Data Availability Statement

Not applicable.

Conflicts of Interest

The authors declare no conflict of interest.

References

  1. Environmental Protection Agency. 2010. Available online: https://www.epa.gov/climate-indicators (accessed on 5 March 2021).
  2. USEPA (U.S. Environmental Protection Agency). Available online: www.epa.gov/ghgemissions/inventory-us-greenhouse-gas-emissions-and-sinks (accessed on 23 June 2021).
  3. Nerantzaki, S.D.; Efstathiou, D.; Giannakis, G.V.; Kritsotakis, M.; Grillakis, M.G.; Koutroulis, A.G.; Tsanis, I.K.; Nikolaidis, N.P. Climate change impact on the hydrological budget of a large Mediterranean island. Hydrol. Sci. J. 2019, 64, 1190–1203. [Google Scholar] [CrossRef]
  4. Cunderlik, J.M.; Simonovic, S.P. Hydrological Extremes in a Southwestern Ontario River Basin under Future Climate Conditions. J. Hydrol. Sci. 2005, 50, 631–654. [Google Scholar] [CrossRef]
  5. Bonsal, B.R.; Zhang, X.; Vincent, L.A.; Hogg, W.D. Characteristics of Daily and Extreme Temperatures Over Canada. J. Clim. 2001, 14, 1959–1976. [Google Scholar] [CrossRef]
  6. Bonell, M.; Sumner, G. Autumn and Winter Daily Precipitation in Wales, 1982–1983 to 1986–1987. Int. J. Climatol. 1992, 12, 77–102. [Google Scholar] [CrossRef]
  7. Folland, C.K.; Karl, T.R.; Vinnikov, K.Y. Observed Climate Variations and Change. In Climate Change: The Scientific Basis; Houghton, J.T., Jenkins, G.J., Ephraums, J.J., Eds.; Cambridge University Press: Cambridge, UK, 1993; pp. 195–238. [Google Scholar]
  8. Jones, P.D.; Conway, D. Precipitation in the British Isles: An Analysis of the Area-Average Data Updated to 1995. Int. J. Climatol. 1997, 17, 427–438. [Google Scholar] [CrossRef]
  9. Vega, A.J.; Sui, C.H.; Lau, K.M. Interannual to Interdecadal Variations of the Regionalized Surface Climate of the United States and Relationships to Generalized Flow Parameters. Phys. Geogr. 1998, 19, 271–291. [Google Scholar] [CrossRef]
  10. Salinger, M.J.; Mullan, A.B. New Zealand: Temperature and precipitation variations and their links with atmospheric circulation 1930–1994. Int. J. Climatol. 1999, 18, 1049–1071. [Google Scholar] [CrossRef]
  11. Lee, S.E.; Press, M.C.; Lee, J.A. Observed Climate Variations During the Last 100 Years in Lapland, Northern Finland. Int. J. Climatol. 2000, 20, 329–346. [Google Scholar] [CrossRef]
  12. Osborn, T.J.; Hulme, M.; Jones, P.D.; Basnett, T.A. Observed Trends in the Daily Intensity of United Kingdom Precipitation. Int. J. Climatol. 2000, 20, 347–364. [Google Scholar] [CrossRef]
  13. Zhang, X.; Vincent, L.A.; Hogg, W.D.; Niitsoo, A. Temperature and Precipitation Trends in Canada during the 20th Century. Atmos. Ocean 2000, 38, 395–429. [Google Scholar] [CrossRef]
  14. Overpeck, J.T.; Udall, B. Climate change and the aridification of North America. Proc. Natl. Acad. Sci. USA 2020, 117, 11856–11858. [Google Scholar] [CrossRef] [PubMed]
  15. Cook, B.I.; Mankin, J.S.; Anchukaitis, K.J. Climate change and drought: From past to future. Curr. Clim. Chang. Rep. 2018, 4, 164–179. [Google Scholar] [CrossRef]
  16. Padrón, R.S.; Gudmundsson, L.; Decharme, B.; Ducharne, A.; Lawrence, D.M.; Mao, J.; Peano, D.; Krinner, G.; Kim, H.; Seneviratne, S.I. Observed changes in dry-season water availability attributed to human-induced climate change. Nat. Geosci. 2020, 13, 477–481. [Google Scholar] [CrossRef]
  17. Mekis, E.; Hogg, W.D. Rehabilitation and Analysis of Canadian Daily Precipitation Time Series. Atmos. Ocean 1999, 37, 53–85. [Google Scholar] [CrossRef]
  18. Vincent, L.A.; Mekis, É. Changes in Daily and Extreme Temperature and Precipitation Indices for Canada Over the Twentieth Century. Atmos. Ocean 2006, 44, 177–193. [Google Scholar] [CrossRef] [Green Version]
  19. Krasting, J.P.; Broccoli, A.J.; Dixon, K.W.; Lanzante, J.R. Future changes in Northern Hemisphere snowfall. J. Clim. 2013, 26, 7813–7828. [Google Scholar] [CrossRef] [Green Version]
  20. O’Gorman, P.A. Contrasting responses of mean and extreme snowfall to climate change. Nature 2014, 512, 416–418. [Google Scholar] [CrossRef] [Green Version]
  21. Zhao, C.P.; Huang, Y.; Li, Z.; Chen, M. Drought Monitoring of Southwestern China Using Insufficient GRACE Data for the Long-term Mean Reference Frame under Global Change. J. Clim. 2018, 31, 6897–6911. [Google Scholar] [CrossRef]
  22. Homsi, R.; Shiru, M.S.; Shahid, S.; Ismail, T.; Harun, S.B.; Al-Ansari, N.; Chau, K.W.; Yaseen, Z.M. Precipitation projection using a CMIP5 GCM ensemble model: A regional investigation of Syria. Eng. Appl. Comput. Fluid Mech. 2020, 14, 90–106. [Google Scholar] [CrossRef]
  23. Sharafati, A.; Elnaz, P. A strategy to assess the uncertainty of a climate change impact on extreme hydrological events in the semi-arid Dehbar catchment in Iran. Theor. Appl. Climatol. 2020, 139, 389–402. [Google Scholar] [CrossRef]
  24. Government of Canada. Available online: https://www.canada.ca/en/environment-climate-change/services/climate-change/science-research-data/climate-trends-variability/quarterly-bulletins/great-lakes-march-2015.html (accessed on 14 July 2020).
  25. Vincent, L.A.; Wang, X.L.; Milewska, E.J.; Wan, H.; Yang, F.; Swail, V. A second generation of homogenized Canadian monthly surface air temperature for climate trend analysis. J. Geophys. Res. Atmos. 2012, 117, 1–13. [Google Scholar] [CrossRef]
  26. Allen, M.J.S.; William, A.; Mohsin, T. Changes in the frequency of extreme temperature records for Toronto, Ontario, Canada. Theor. Appl. Climatol. 2015, 119, 481–491. [Google Scholar] [CrossRef]
  27. Mekis, É.; Vincent, L.A. An overview of the second generation adjusted daily precipitation dataset for trend analysis in Canada. Atmos. Ocean 2011, 49, 163–177. [Google Scholar] [CrossRef] [Green Version]
  28. Vincent, L.A.; Zhang, X.; Mekis, É.; Wan, H.; Bush, E.J. Changes in Canada’s Climate: Trends in Indices Based on Daily Temperature and Precipitation Data. Atmos. Ocean 2018, 56, 332–349. [Google Scholar] [CrossRef] [Green Version]
  29. Tan, X.; Gan, T.Y. Contribution of human and climate change impacts to changes in streamflow of Canada. Sci. Rep. 2015, 5, 17767. [Google Scholar] [CrossRef] [PubMed]
  30. Shrestha, N.K.; Du, X.; Wang, J. Assessing climate change impacts on fresh water resources of the Athabasca River Basin, Canada. Sci. Total Environ. 2017, 601, 425–440. [Google Scholar] [CrossRef]
  31. Wang, X.; Huang, G.; Liu, J. Observed regional climatic changes over Ontario, Canada, in response to global warming. Meteorol. Appl. 2016, 23, 140–149. [Google Scholar] [CrossRef]
  32. Suriano, Z.J.; Leathers, D.J. Synoptic climatology of lake-effect snowfall conditions in the eastern Great Lakes region. Int. J. Climatol. 2017, 37, 4377–4389. [Google Scholar] [CrossRef]
  33. Pope, A.W. Ontario’s Water Resources; Ontario Government: Ontario, ON, Canada, 1984; pp. 34–42.
  34. Marwaha, T. Change in Minimum Temperature and Frost Free Days Across Southern Ontario; School of Engineering, University of Guelph: Guelph, ON, Canada, 2011. [Google Scholar]
  35. Goossens, C.; Berger, A. Annual and Seasonal Climatic Variations over the Northern Hemisphere and Europe during the Last Century. Ann. Geophys. 1986, 4, 385–399. [Google Scholar]
  36. Önöz, B.; Bayazit, M. The Power of Statistical Tests for Trend Detection. Turk. J. Eng. Environ. Sci. 2003, 2, 247–251. [Google Scholar]
  37. Kendall, M.G. Rank Correlation Methods, 4th ed.; Charles Griffin: London, UK, 1975; p. 202. [Google Scholar]
  38. Weather Phenomenon and Elements. Available online: www.heidorn.info/keith/weather/elements/lkefsnw3.htm (accessed on 13 April 2021).
  39. Ahmed, S.I.; Rudra, R.; Dickinson, T.; Ahmed, M. Trend and Periodicity of Temperature Time Series in Ontario. Am. J. Clim. Chang. 2014, 3, 272–288. [Google Scholar] [CrossRef] [Green Version]
Figure 1. Spatial Distribution of the stations for the study area across Southern Ontario.
Hydrology 09 00081 g001
Figure 2. Trends of total precipitation, rainfall, and snowfall during winter at Sioux Lookout (A), Ottawa (B), Toronto (C), and London (D), Ontario.
Hydrology 09 00081 g002
Figure 3. Time series plots of winter minimum temperature at Sioux Lookout (A), Ottawa (B), Toronto (C), and London (D), Ontario.
Hydrology 09 00081 g003
Figure 4. Time series plot of winter rainfall, winter snowfall versus minimum temperature at Sioux Lookout (A), Ottawa (B), Toronto (C) and London (D), Ontario.
Hydrology 09 00081 g004
Figure 5. The variation in number of snowy days with latitude.
Hydrology 09 00081 g005
Figure 6. The variation of number of rainy days with latitude.
Hydrology 09 00081 g006
Figure 7. Annual variation in number of rainy days during winter across Ontario.
Hydrology 09 00081 g007
Table 1. Location and period of record for 13 stations across Ontario.
S. No.StationLatitudeLongitudeAltitudeDaily Record Period
1Sioux Lookout50.12−91.90383.41939–2008
2Kenora49.79−94.37409.71939–2008
3Thunder Bay48.37−89.331991942–1992
4North Bay46.36−79.42370.31940–2008
5Ottawa45.38−75.7279.21939–2006
6Brockville44.6−75.67961966–2006
7Owen Sound44.58−80.93178.91965–2006
8Kingston44.24−76.4876.51978–2006
9Fergus43.73−80.33417.61940–2006
10Toronto Pearson43.68−79.63173.41940–2008
11Stratford43.37−813451960–2006
12London43.03−81.152781941–2001
13Windsor42.28−82.96189.61941–2008
Table 2. Mann–Kendall tau and Sen’s slope analysis for Winter Mean Minimum Daily Temperature (°C).
StationNo. of
Readings (n)
Mann–Kendall Trend Analysis
p-ValueSen’s Slope
(°C/year)
Trend
Sioux Lookout700.070.02No Trend
Kenora700.020.02Positive
Thunder Bay510.670.01No Trend
North Bay690.090.01No Trend
Ottawa680.0010.01Positive
Brockville410.0010.06Positive
Owen Sound420.030.03Positive
Kingston290.130.05No Trend
Fergus670.000.02Positive
Toronto690.100.02No Trend
Stratford47<0.00010.04Positive
London610.350.01No Trend
Windsor680.020.02Positive
Table 3. Variability and central tendency of winter precipitation.
StationStatistics
PrecipitationSnowfallRainfall
MeanSd *Cv **MeanSdCvMeanSdCv
Sioux Lookout229.548.20.2119045.160.2439.627.230.69
Kenora190.845.930.24150.943.430.2939.923.40.59
Thunder Bay261.376.480.29175.971.470.4185.440.580.48
North Bay434.373.30.17251.556.920.23182.959.690.33
Ottawa397.055.210.14174.847.950.27215.458.240.27
Brockville466.472.770.16195.662.710.32270.969.120.26
Owen Sound579.61000.17330.694.480.2924967.940.27
Kingston476.659.670.13159.750.030.31316.964.550.2
Fergus417.184.310.2164.452.70.32252.766.550.26
Toronto Pearson353.257.960.16119.236.240.323452.970.23
Stratford530.5101.10.19237.176.970.32293.366.410.23
London468.179.650.17293.5268.090.23174.6245.680.26
Windsor406.979.220.19299.3869.340.23107.4836.690.34
* Sd: Standard deviation; Cv **: Coefficient of variation.
Table 4. Trend analysis of the total precipitation, rainfall, and snowfall during winter.
StationLinear RegressionMann–Kendall Statistics
PrecipitationSnowfallRainfallPrecipitationSnowfallRainfall
Slope (mm/year)Slope (mm/year)Slope (mm/year)TrendTrendTrend
Sioux Lookout−0.08−0.400.32D *D *I *
Kenora−0.66−0.840.18D D I *
Thunder Bay−2.11−2.230.12D D *I *
North Bay0.04−0.930.97I *I *I
Ottawa0.08−0.600.67I *D I *
Brockville−0.44−1.731.29D *D I *
Owen Sound2.770.052.71I I *I
Kingston−1.17−0.63−0.55D *D *D *
Fergus0.28−0.690.97I *D I
Toronto Pearson0.19−0.480.67I *D I
Stratford0.45−0.911.36I *D *I
London0.23−0.640.87I *I *I *
Windsor1.210.680.9I I I
I—increasing trend; D—decreasing trend; *—Non-Significant; †—Significant.
Table 5. Linear regression and correlation statistics for winter rainfall and winter snowfall versus winter mean minimum temperature.
StationWinter Rainfall versus Winter Mean Minimum TemperatureWinter Snowfall versus Winter Mean Minimum Temperature
Slope (mm/°C)R-SquareTrendSlope mm/°CR-SquareTrend
Sioux Lookout1.740.01I −7.740.10D
Kenora2.550.04I−9.850.18D
Thunder Bay9.610.13I−17.280.24D
North Bay15.940.13I−15.850.13D
Ottawa19.070.24I−18.950.32D
Brockville11.860.06I−25.720.35D
Owen Sound23.870.21I−30.690.17D
Kingston6.770.02I−16.150.17D
Fergus19.590.19I−10.700.12D
Toronto Pearson14.850.13I−11.660.23D
Stratford22.890.21I−24.020.17D
London11.180.04I−12.180.17D
Windsor22.160.13I−8.260.08D
Increasing, Decreasing.
Table 6. Central tendency and variability statistics relating to number of snowy days and rainy days for selected stations across Ontario.
StationSnowy DayRainy Day
Mean 1Sd 2Cv 3Mean 1Sd 2Cv 3
Sioux Lookout7411.280.15134.950.38
Kenora679.820.15123.960.33
Thunder Bay608.840.15184.90.27
North Bay8010.170.13348.60.25
Ottawa509.960.20388.260.22
Brockville438.950.21457.750.17
Owen Sound6313.960.22448.240.19
Kingston408.640.22529.540.18
Fergus5113.260.264010.890.27
Toronto Pearson469.640.21437.490.17
Stratford57130.23437.770.18
London6512.710.20487.050.15
Windsor449.640.22488.530.18
1 Mean number of rainy days. 2 Standard deviations of number of rainy day time series at each station. 3 Coefficient of variation of number of rainy day time series at each station.
Table 7. Trend analyses of number of snowy days and rainy days during winter.
StationSnowy DayRainy Day
Linear RegressionMann–KendallLinear RegressionMann–Kendall
Slope (day/year)R2TrendSlope (day/year)R2Trend
Sneyers (1990)Onoz & Bayazit (2003)Sneyers (1990)Onoz & Bayazit (2003)
Sioux Lookout−0.020.00D *D −0.010.00D D
Kenora−0.010.00D *D *0.060.09I *I *
Thunder Bay−0.070.01D *D *0.080.05I *I *
North Bay−0.150.04D *D *0.020.00I *I *
Ottawa0.060.02I *I *0.160.15I I
Brockville0.030.00I *I *0.190.08I *I *
Owen Sound−0.250.05D *D *0.350.27I *I *
Kingston−0.080.01D *D *−0.120.01D *I *
Fergus0.400.34I I 0.430.59I I
Toronto0.120.03I *I *0.190.14I I
Stratford−0.350.14D D 0.110.04I *I *
London−0.030.00D *D *0.100.07I *I *
Windsor0.140.05I *I *0.090.03I I
*—Non-Significant; †—Significant.
Table 8. Variability of ratio of rainfall to total precipitation (R/P) and snowfall to total precipitation (S/P) during winter.
StationWinter Rainfall/Precipitation
(R/P)
Winter Snowfall/Precipitation (S/P)
MeanSdCvMeanSdCv
Sioux Lookout0.170.110.650.860.110.13
Kenora0.210.110.520.850.130.15
Thunder Bay0.330.140.420.780.180.23
North Bay0.420.110.260.650.110.17
Ottawa0.550.120.220.500.130.26
Brockville0.580.110.190.420.120.29
Owen Sound0.430.110.260.570.110.19
Kingston0.660.100.150.340.100.29
Fergus0.610.100.160.400.100.25
Toronto Pearson0.660.090.140.350.090.26
Stratford0.560.100.180.440.090.20
London0.620.090.150.430.100.23
Windsor0.730.080.110.290.090.31
Publisher’s Note: MDPI stays neutral with regard to jurisdictional claims in published maps and institutional affiliations.

