Abstract
Páramos are particular ecosystems of the Tropical Andes, where fog and low-intensity rainfall such as drizzle are commonly frequent—but the contribution of these water sources to soil water replenishment and discharge is not yet clear, mainly because the development of techniques for separating fog from drizzle and wind-driven rainfall has been challenging. Fog was measured with a cylindrical Juvik gauge and types of precipitation other than fog with a high-resolution disdrometer. Soil moisture was measured at 100 mm depth by means of Water Content Reflectometers, then Effective precipitation (EP) was calculated. We categorized events as two types: fog only (FO) and cloud water (CW). We found that in the case of FO events, only small amounts reached the soil (EP ranged between 0.1 and 0.2 mm); in contrast, greater amounts of EP originated from CW events (maximum value of 4.3 mm). Although we found that FO events are negligible for stream water contribution; they are ecologically important for maintaining high relative humidity, low net radiation, and consequently low evapotranspiration rates. Our research provides new insights into the hydrological role of fog, enabling us to better understand to what extent its input influences the water resources of the Andean páramo.
1. Introduction
The tropical Andes extend over approximately 1.5 million km2, running from 11° N to 23° S, and include peaks topping 3500 m.a.s.l, steep slopes, valleys, and plateaus []. They encompass a variety of ecosystems—montane forests, páramo grasslands, wetlands, glaciers []—that exhibit complex interactions among species and between species and their environments []. As a result of the advection of clouds, these mountains are commonly covered in fog [], the intensity and frequency of which affect water inputs and outputs [], thus playing an important ecological and hydrological role. At high elevations, fog transported by wind deposits liquid water droplets on plant canopies that then seep down to the soil surface [,]. Herein, we define as fog-only (FO) events those that are 100% fog; and as cloud-water (CW) events those consisting of fog combined with drizzle and/or light rain, but fog is the major contributor (percentages between 50% and 99%) [].
Montane grasslands and shrublands known as páramos, found above the tree line in the upper region of the northern Andes, are characterized by low temperatures and high radiation []. They are home to distinct plant communities [], dominated by tussock grasses and cushion plants with forest patches (Polylepis sp.) growing along water streams. The main soil types are Andosols and Histosols. The wet and cold climate favor organic matter accumulation. This, together with the volcanic ash accumulation is responsible for the dark, humic and acid soils, with an open pore structure []. The vast capacity of páramo soils to store water and buffering capacity are other important features [,]. In these natural grasslands, evapotranspiration rates are relatively low since the frequent presence of fog—in addition to the cloud cover presence, high relative humidity, and low temperatures—results in low transpiration rates [].
Several studies have found that CW deposition represents an important water input for tropical montane cloud forests [,], and in the Andes it additionally makes a valuable contribution to the regional water supply []. The water input through fog deposition in páramo tussock grasslands is less well understood since this function is related to regional climate []. Only a few studies have focused on fog water input in the Andean páramo [,,]; and although Cárdenas et al. [] assessed the contribution of occult precipitation (fog and drizzle) to soil moisture, there is still insufficient data showing whether FO water reaches the soil, thereby increasing soil moisture. The paucity of such data is mostly due to the lack of appropriate instrumentation and the technological challenges of separating fog from drizzle and wind-driven rain. Overcoming this obstacle is a primary need, because better understanding of the hydrological role of fog in the Andean páramo is essential for accurately estimating the water balance. Previous attempts to quantify fog water deposition have been based on various methods, including measurement of net precipitation [], modeling of fog water deposition [,], measurement of increases in plant weight when exposed to fog [,], and the eddy covariance method [,,].
The availability of water for plants and for soil–plant–atmosphere transfer processes is determined by soil water content [,]. In the Andes, the high organic matter content of the soils gives them a strong water regulation capacity. To what extent fog water deposition contributes to soil moisture dynamics has been studied mostly in forested regions, less so in grasslands [,]. Fischer et al. [] estimated fog drip in pine forests, showing that its effects on soil moisture helped maintain tree functions such as leaf–water relations, sap flux dynamics, and growth rates. Similarly, Eugster et al. [] showed that in elfin mountain cloud forests, inputs from fog water deposition—although not a very large component of the hydrological budget—were nevertheless considerable. In the tropical Andean cloud forests of Colombia, Tobón [], working at three sites, showed that soil moisture remained close to field capacity and saturation owing to low intensity rainfall—including fog events—and the high organic matter content. With respect to grasslands, Ingraham and Mark [] found at a New Zealand site that fog intercepted by tussock grasses represented a substantial contribution to the water yield.
While the question of fog water contribution to the hydrological system has been addressed in various environments, much uncertainty still exists regarding fog drip and soil moisture gains due to fog in the tussock grasslands of páramos. For this reason, our work focuses on the analysis of FO and CW events, to assess whether the water intercepted by the vegetation is able to reach the soil. The three primary aims of this study were (1) to ascertain to what extent water deposited through FO events can contribute to soil moisture; (2) to evaluate whether water deposited through CW events reaches the soil; and (3) to analyze meteorological conditions or variables related to soil water content changes.
2. Materials and Methods
2.1. Study Area
The study site is located within the Zhurucay Ecohydrological Observatory, on the western side of the Andes in Southern Ecuador (Figure 1a,b). Zhurucay has a drainage area of 7.53 km2 and elevations ranging from 3200 to 3900 m.a.s.l. The climate is influenced by the Pacific regime and the predominant continental air masses of the Amazon Basin, resulting in conditions that are frequently cloudy and foggy with minor seasonal differences during the year. The climate belongs to the Cfc class (warm temperate climate, fully humid, with cool summer and cold winter) according to Köppen-Geiger classification []. Mean annual precipitation is 1210 ± 101 mm year−1 [], some 50% of which occurs at intensities of 2 mm h−1 or less []. On average, cloud water flux is about 340.1 mm, and fog occurs 68% of the time []. Although fog can be present at any time of the day in the Andean páramo, it is most common in the early morning and at night []. The mean annual temperature is 6.1 °C, mean relative humidity is 93.6%, and mean daily total solar radiation is 14 MJ m−2. Wind blows predominantly from the east or northeast and wind speeds vary seasonally, with a monthly mean of 3.21 m s−1 from October to April and 4.77 m s−1 from May to September. The mean daily actual evapotranspiration is 1.7 mm day−1, with a cumulative annual value of 622 mm [,]. Vegetation at the study site is dominated (>80% coverage) by tussock grasses (genera Calamagrostis and Festuca), commonly known as “pajonal”, which are perennial plants that reach heights between 30 and 80 cm. Soils correspond mainly to volcanic origin Andosols [], which are black loamy soils with a high organic matter content and low bulk density (0.2–0.8 g cm3) [,]; their depth ranges from 0.5 m at the hillslope-top to 1.1 m at hillslope-bottom. The surface horizon (Ah) has a clay-loam texture with a granular structure without rocks; organic matter is 57.41% with a density of 0.40 g cm−3. This horizon has a dark color and a high-water retention capacity: Field capacity is 0.72 cm3 cm−3 (pF = 2.52), wilting point is 0.5 cm3 cm−3 (pF = 4.2), and saturation point is 0.8 cm3 cm−3 (pF = 0) []. Below the Ah horizon there is a mineral horizon (C), with a low content of organic matter (6.52%). Field capacity is 0.4 cm3 cm−3, wilting point is 0.2 cm3 cm−3, and saturation point is 0.65 cm3 cm−3 []. The horizons are acid with a pH ranging between 4 and 6 []. The water table is between 2 to 5 m deep, therefore the topsoil is not supplied with groundwater.
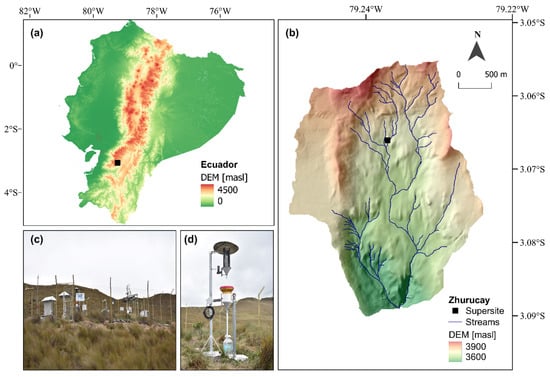
Figure 1.
Zhurucay Ecohydrological Observatory: (a) location within Ecuador; (b) location of super-site within Observatory; (c) instrumented super-site hillslope; (d) Juvik fog gauge.
2.2. Instrumentation
The Zhurucay Ecohydrological Observatory encompasses a monitoring super-site located in a hillslope at 3770 m.a.s.l. (Figure 1c) equipped with a variety of instrumentation, including (1) a meteorological station that records variables such as solar radiation and long- and short-wave net radiation (Campbell Scientific CS300 Apogee pyranometer), wind velocity and direction (CNR2–Kipp and Zonen Met-One 034B Windset anemometer), atmospheric pressure (Vaisala barometer PTB110), and air temperature and relative humidity (Vaisala thermometer/hygrometer HMP155 with a radiation shield); (2) CS616 Campbell Scientific Water Content Reflectometers (WCRs) installed horizontally at the hillslope-top, at a soil depth of 10 cm and 4 m apart, to measure soil water content. There is no lateral flow at the measurement site. WCRs accuracy is 2.5% with standard calibration, whereas resolution and precision are better than 0.1%; (3) a laser disdrometer (Thies Clima Laser Precipitation Monitor [LPM] 5.4110.00.000 V2.4 × STD, with a resolution of 0.01 mm), which measures the size and fall velocity of drops and is well suited for the detection of different types of precipitation (e.g., drizzle, rain, and mixed precipitation); (4) a tipping-bucket rain gauge (RG) (Texas Electronics tipping-bucket TE525MM, with a resolution of 0.1 mm); (5) a cylindrical modified Juvik fog gauge (FG) (dimensions 40.5 cm high, 14 cm outer diameter, 567 cm2 cross-sectional area) having a louvered aluminum shade screen collection surface with a 50-cm-diameter protective cover and two plastic funnels—one underneath the screen and one underneath the tipping-bucket rain gauge, which in turn is connected to a bucket via a plastic pipe to drain the collected water; the tipping-bucket rain gauge and the bucket were covered with plastic to avoid vertical precipitation (Figure 1d). To estimate the cloud water flux, the FG effective capture area was defined as the projected capture area (cylinder diameter × height).
In a prior study [], we measured cloud water interception with different passive fog collectors—two cylindrical types (Juvik and Wire Harp) and two flat-screen types—oriented to the two main wind directions. Our results showed that for our study site, cylindrical Juvik type FG performed the best, yielding better fog and cloud water estimations. For this reason, all the analyses for the current study were done with this FG. All of the variables (e.g., fog, rainfall, volumetric water content, meteorological variables) were continuously recorded at 5-min intervals from September 2017 to December 2019. Weather conditions during the study period are shown in Figure 2.
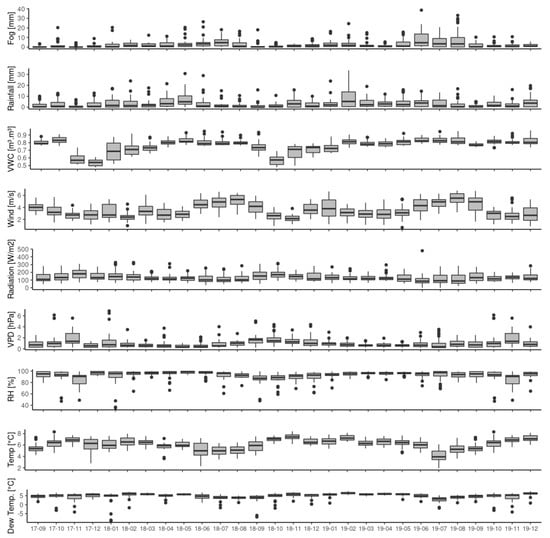
Figure 2.
Fog input, precipitation, volumetric water content (VWC), and meteorological variables for the study site during September 2017 to December 2019.
2.3. Selection of Events and Determination of Effective Precipitation
For our analysis, we selected FO and CW events lasting longer than 10 min and separated by 4 h (according to Ochoa-Sánchez et al. [], this time gap allows for the assumption that tussock grass leaves have dried before the next event).
As noted earlier, we characterized each event as one of two types: (i) Fog-only (FO) events, defined as those captured by the FG but not by either the LPM or the RG (i.e., the event consisted of 100% fog); and (ii) cloud-water (CW) events, defined as those for which the water collected by the FG was greater than the amount recorded by the LPM and the RG (i.e., the fog proportion of the total collected was between 50% and 99%). In addition, to reduce the bias due to wind-driven precipitation, all the CW events with wind speeds higher than 4 m s−1 were excluded from the study [].
To measure volumetric water content (VWC) in cubic meter per cubic meter with the CS616 WCR output period (P) in microseconds, a calibration curve shown in Equation (1) was developed for this site, as described in Ochoa-Sánchez et al. []:
For a more detailed information about the calibration procedure, the reader is referred to supplementary material in Ochoa-Sánchez et al. []. In order to obtain a data set that shows which events reached the soil, we included only events that met the following criteria: (1) VWC remained at a minimum (0.01 m3 m3) or did not change for at least 2 h before the event; (2) VWC increased during the event, caused by a water input from drizzle, light rain, and/or high-intensity fog; and (3) the change in VWC during the event had a value higher than the precision and resolution of the WCR (0.1% VWC). These criteria rule out interference from other processes, such as lateral flows.
To calculate the change in soil water storage (SWch), we multiplied the increase in VWC (recorded by the average of two WCRs) over the course of the event by the installation depth of the sensor (10 cm). For the purposes of this study, we use the term effective precipitation (EP) to represent the amount of increase in SWch. Thus, each event was further classified according to EP: Class I for FO and CW events with EP (i.e., SWch > 0 mm) and Class II for FO and CW events without EP, (i.e., SWch = 0 mm). This classification yielded 30 Class I events (9 FO and 21 CW) and 52 Class II events.
2.4. Identification of Events Consisting of Fog and Rainfall Combined
To determine what other type(s) of precipitation (drizzle, light rain, rain, heavy rain) occurred in combination with fog during the CW events, we used the LPM, which is highly sensitive to small drops. Its data telegram generates a matrix that provides the number of drops detected at 22 different drop sizes (from 0.125 to 8 mm) and at 20 different velocities (from 0 to 10 m s−1). First, we obtained the number concentration of raindrops per unit volume per unit size—N(D)—from the LPM counts using Equation (2), where N(Di) is the number concentration in ith size class (mm−3 mm−1), Di is the mid-size diameter of the ith class (mm), A is the cross-sectional area of the sensor (m2), t is the measuring time (seconds), nij is the number of drops within the ith size and jth velocity class, and Vj is the fall speed of the jth velocity class (m s−1).
Then, we calculated the mean volume diameter Dm (mm) at 5-min intervals from a normalized distribution. In Equation (3), N(D) is the drop size distribution, D is the particle diameter, and D3 and D4 are the third and fourth moments calculated for each spectrum.
According to Orellana-Alvear et al. [], working at the same study site, the 0.1 < Dm [mm] ≤ 0.5 corresponds to drizzle, the 0.5 < Dm [mm] ≤ 1.0 corresponds to light rain, the 1.0 < Dm [mm] ≤ 2.0 corresponds to rain, and the Dm [mm] > 2.0 is defined as heavy rain. On that basis, we calculated the amounts of different kinds of precipitation for each of the CW events (independently of whether they had been classified as Class I or Class II). To identify what type of precipitation commonly reaches the soil, we used a bar plot for the Class I events; and to observe how fog and cloud water depth relate to EP, we calculated the percentages of fog and of other kinds of precipitation for each of the 82 events, then used them to construct a scatter plot.
2.5. Relationship between Effective Precipitation and Meteorological Variables
To determine how EP amounts might be influenced by climatic variables and by the various types of precipitation, we plotted the following variables using scatter plots and heat maps: EP amounts; fog depth, drizzle, light rain, and rain; intensity of events; duration of events; mean wind speed, relative humidity, radiation, temperature, dew temperature, and vapor pressure deficit. A linear model and Pearson correlations were performed to analyze the independence of EP and meteorological variables. All these analyses were coded in R x86_64-pc-linux version 3.6.3 software using the lubridate, dplyr, ggplot2, stringr, reshape, psych, corrplot, and heatmap packages.
3. Results
3.1. Selection of Events and Determination of Effective Precipitation
From the dataset, 82 events were selected for analysis: 45 FO events and 37 CW events. Of these, 30 were designated Class I (effective precipitation > 0 mm) and 52 were designated Class II (effective precipitation = 0 mm). Figure 3 shows an example of each classification for each event type, four hours pre event and after event were plotted to observe that changes in volumetric water content are due to the water input during the event and not for other prior events nor by lateral flow processes. Table 1 summarizes the main characteristics of the FO and CW events and the calculated effective precipitation for each. Even though the FO events outnumbered the CW events, their total duration was around three times shorter. The combined total depth from the FO and CW events was 146.6 mm, of which 21.5 mm (15%) reached the soil as EP. Total EP consisted of 57% from the CW events but only 20% from the FO events. The composition of the CW events’ total depth was 69% fog, 17% light rain, and 14% drizzle.
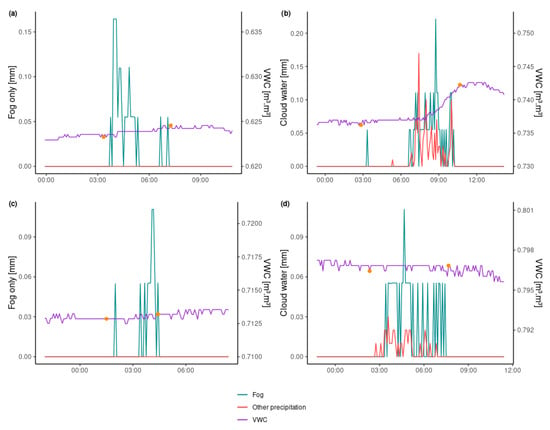
Figure 3.
Some examples of the eighty two fog-only and cloud-water events and their corresponding soil volumetric water content (VWC) plotted considering four hours before and after the event. The orange dots represent a reference for the start and the end of the event, to calculate the change in VWC: (a) event 23, Class I event (producing an increase in VWC) (b) event 19, Class I event (producing an increase in VWC); (c) event 59, Class II event (producing no increase in VWC), and (d) event 40, Class II event (producing no increase in VWC).

Table 1.
Characteristics of fog-only and cloud-water events. Values of volumetric water content and meteorological variables are the mean value for each type of event independently they belong to Class I or Class II.
3.2. Identification of Events Consisting of Fog and Rainfall Combined
Figure 4 shows the total depth for the 30 events that reached the soil, as well as the composition of the CW events. The Class I FO events yielded between 0.1 and 3.1 mm of fog water, whereas the yield of the Class I CW events included between 0.3 and 11.3 mm of water from fog. Drizzle and/or light rain were the most common types of precipitation that contributed to soil moisture increase: half the CW events contained between 5 mm and 16.8 mm, while the other half contained less than 5 mm.
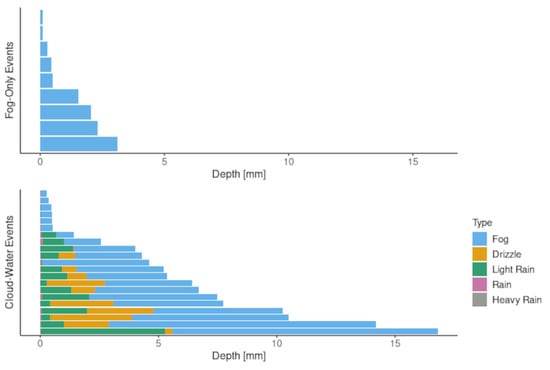
Figure 4.
Total depth for the nine fog-only and the 21 cloud-water events that produced effective precipitation (Class I), and composition of cloud-water events.
Effective precipitation, measured as an increase in VWC, ranged from 0.1 to 0.2 mm for all Class I FO events. Similarly, for Class I CW events, EP ranged from 0.1 to 0.3 mm, with fog accounting for over 90% of the total (Figure 5). For cases in which the fog proportion was lower (70%–80%) and the drizzle and light rain proportion was higher, EP was also higher—0.3–2.2 mm; and for cases in which the fog proportion was lower still (50%–70%) with even higher amounts of drizzle and light rain, EP rose as high as 4.3 mm. In other words, the CW events with relatively higher EP (over 1 mm) were those having relatively lower percentages of fog and a higher total depth (over 5 mm). We can infer, then, that EP increases with total amount per event and with greater proportions of drizzle and light rain rather than fog.
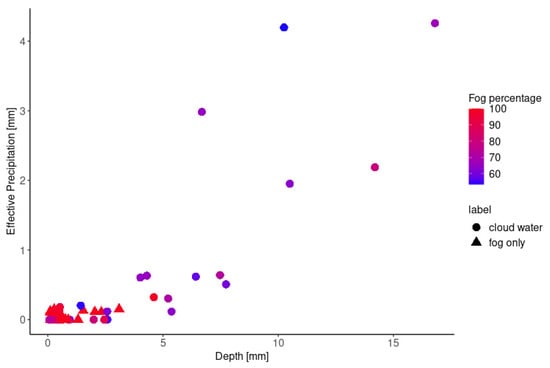
Figure 5.
Relationship between events depth and effective precipitation.
3.3. Relationship between Effective Precipitation and Meteorological Variables
The FO and CW events were plotted on heat-maps in ascending order of their EP amounts, together with the mean values of total depth, duration, and intensity of the events, as well as the available meteorological variables (wind speed, air temperature, dew temperature, relative humidity, radiation, and vapor pressure deficit, see Appendix A). For both FO and CW events, duration, intensity, and total event depth were directly related with increasing EP. Figure 6 shows the linear regression for EP and meteorological variables, the coefficient of determination and p-value from the regression indicate a poor fit of the model; values of R2 < 0.1 were obtained for all the meteorological variables assessed. In addition, Pearson correlation for the same variables showed low coefficients < 0.2 (Figure 7); which demonstrates that EP and the considered meteorological variables are not linearly related.
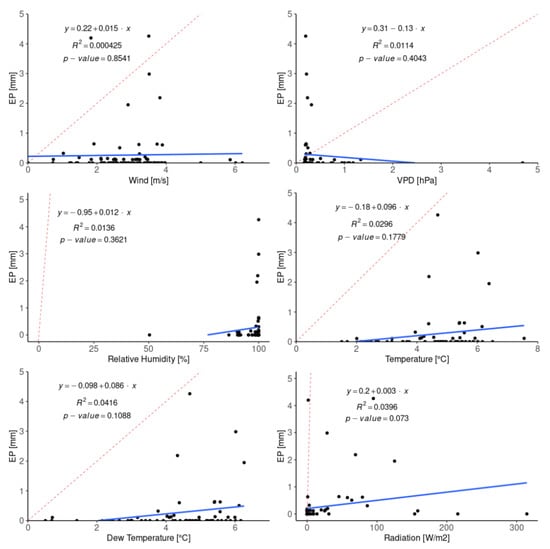
Figure 6.
Effective precipitation (EP) versus meteorological variables for the two types of events fog-only and cloud-water (black dots), with the corresponding coefficient of determination, where the blue line represents the linear regression model and the red line is the identity line (slope = 1).
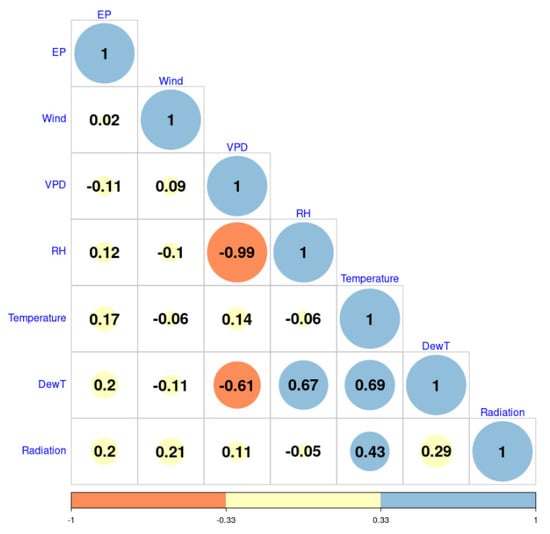
Figure 7.
Effective precipitation (EP) versus meteorological variables for the two types of events fog-only and cloud-water, with the corresponding correlation coefficient.
For both FO and CW events, the most important event characteristics related to EP were duration and depth; these are shown in Figure 8, plotted against EP. The FO events—of which 44% lasted less than 1 h and 56% lasted from 1 to 8 h—produced little EP. For the Class II FO events duration was highly variable and did not show any pattern; for the Class I FO events, at least 1 h was needed for water to reach the soil. The CW events produced considerably more EP—as high as 4.25 mm for an event of 14 h’ duration and depth of over 10 mm. Even though the Class I CW events showed higher EP values overall, they varied widely in both duration and depth. In the páramo, events lasting more than 13 h and yielding more than 10 mm are potentially important in the hydrological cycle, because of their higher EP. The four events in this category during our study consisted mainly of fog combined with drizzle and light rain (Figure 8), in the following amounts as measured by the instrumentation: fog = 11.3 mm, 11.2 mm, 6.6 mm, and 5.5 mm; drizzle = 1.9 mm, 0.3 mm, 3.5 mm, and 2.8 mm; and light rain = 1 mm, 5.2 mm, 0.4 mm, and 1.9 mm.
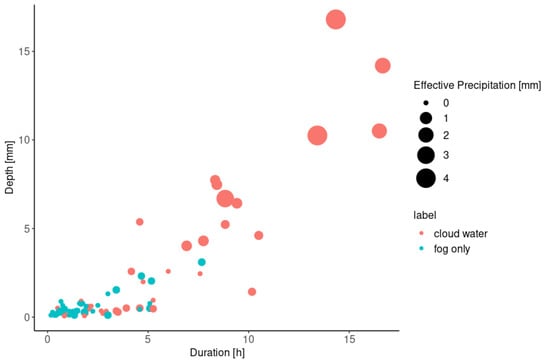
Figure 8.
Relationship among duration, total event depth and effective precipitation for the 82 events.
4. Discussion
4.1. Quantification of Effective Precipitation
As shown in Table 1, of the 146.6-mm total water yield from the 82 FO and CW events we analyzed, 15% became EP (added to soil moisture). In Table 2 we compare our results with findings from other ecosystems (even though the methodologies used for these other studies varied, the estimations obtained are useful for understanding the importance of fog- and cloud-water contributions to soil moisture). During our 26-month study, only a small percentage of the total water collected from the FO events ended up reaching the soil (1.1 mm, or 4.5%)—suggesting that in the Andean páramo, fog water contribution to the net hydrological input is negligible. Fleischbein et al. [], working in montane forests in Ecuador, reported also negligible fog water inputs. In contrast, the studies of Clark et al. [] and Liu et al. [] for cloud and rain forests respectively, found higher values—the latter showing an average annual fog contribution amounting to about 5% of annual rainfall at a site in southwest China.

Table 2.
Studies of fog and cloud-water deposition in ecosystems with different types of vegetation around the world.
Soil moisture is measurably higher beneath tree canopies [], but fog inputs also depend on the density and frequency of fog []. Despite the high frequency of fog in the Andean páramo, days with FO and no precipitation are rare [], and most of the FO events that reached the soil occurred in the early morning, when evaporation is low. In these grasslands, fog water is intercepted by the tussock leaves, diminishing water input to the ground, although the water storage capacity of tussock grasses (approximately 2 mm) [] is smaller than that of forests, which have more complex canopies []. Variations in fog drip are affected by the type, size, location, and density of the foliage []. In the páramo, the low intensity of fog is not sufficient to saturate the tussock grasses leaves; causing no drip. On the contrary, in forests, their denser foliage allows capturing more fog water.
The amount of water collected from CW events was higher than that from FO events; however, the EP was also low (Table 1), accounting for only 17% (20.4 mm) of the total depth (122.2 mm). Our findings are in agreement with those of other studies, e.g., Herckes et al. []; Gomez Peralta et al. [], working in cloud forests below 2500 m, where CW input might be insignificant; and Giambelluca et al. [], working in a dry cloud forest where the majority of intercepted water was re-evaporated from the wet vegetation and never reached the ground.
In páramo, soil is constantly saturated, which means soil water content is normally above 80% []. To study the gain in soil moisture from FO and CW we needed events when soil is not saturated and for this reason, we excluded from our analysis events with soil water content ≥ 80%. Cárdenas et al. [] reported gains in VWC in Colombian páramo soils under field capacity conditions, following large occult precipitation events; however, it should be noted that in this study, the contribution of occult precipitation to soil moisture was not separated from that of rainfall.
4.2. The Impact of Cloud-Water Deposition on Effective Precipitation
The high-resolution laser disdrometer, with its ability to measure small drops, proved to be an effective instrument for monitoring the other types of precipitation that accompany fog during CW events. We determined that (as shown in Figure 4) the CW events that resulted in EP consisted mainly of fog combined with drizzle and/or light rain and had a total amount per event ranging from 0.3 to 11.3 mm. In addition, all the events occurred in the early morning; and wind speeds during the events varied between 1.5 and 3.4 m s−1. Since fog water contribution is also influenced by fog density and frequency as well as wind speed [], it is plausible that the CW events with low total depth had high fog density and occurred at lower wind speeds.
At higher wind speeds, deposition via impaction increases; for instance, Liu et al. [] attributed low fog-drip to the low wind speeds (<2 m s−1), and Holwerda et al. [] reported low amounts of CW in a secondary forest and in a mature cloud forest (about 6% and 8%, respectively, of dry season rainfall) due to low wind speeds. As noted earlier, all the events included in our analysis occurred at wind speeds below 4 m s−1 therefore deposition on vegetation by these events was also low despite differences in plant height and complexity of plant leaves between tussock grasses and forests. This hypothesis is supported by previous findings that the most important factors affecting fog deposition rate are fog droplet size distribution [], the topography of the field site [], fog duration, surface area, and geometry of the vegetation [].
The CW events having higher percentages of drizzle and light rain recorded the higher amounts of EP (Figure 5), suggesting that EP is related to a major presence of drizzle and light rain rather than fog. Since drizzle and light rain droplets are bigger than fog droplets, and their fall velocity is higher, during these larger events it is likely that the tiny droplets of fog were more susceptible to being blown away and dried before deposition on tussock grass leaves. In addition, from field observations we know that fog occurs only intermittently during the day and most of the time is of brief duration, while drizzle occurs frequently enough in the páramo that only 12% of the days are completely dry [].
4.3. Relationship between Effective Precipitation and Meteorological Variables
None of the meteorological variables analyzed (relative humidity, vapor pressure deficit, wind speed, air temperature, dew temperature, and solar radiation) showed any relationship with EP, for either FO or CW events (Figure 6 and Figure 7). All the FO events that resulted in EP occurred at relative humidities over 90%, and all the CW events that resulted in EP occurred at humidities higher than 98%. While fog formation generally takes place under high relative humidity—conditions ranging from undersaturated to slightly supersaturated []—relative humidity was not a determinant of EP; FO events occurring at humidities between 80% and 100% resulted in no EP. Similarly, we found no relationship between EP and vapor pressure deficit, dew temperature, air temperature, wind speed or solar radiation, suggesting that meteorological variables are not drivers for EP.
For both FO and CW events, three characteristics did show a direct relationship with EP: duration, total amount per event and intensity (see Appendix A). The duration of FO events varied between 1 h and 8 h (Figure 8), whereas CW events were longer and with intensities > 0.5 mm h−1, which produced higher amounts of EP. Fog density information was beyond the scope and possibilities of this current study, then we assume that FO events were dense enough to cause fog drip to the ground and resulted in EP despite small total depth.
In the Andean páramo, hydrological regulation capacity might be related to the high frequency of fog and low-intensity rainfall (drizzle). But although it is widely acknowledged that fog plays an important hydrological role in different ecosystems, from our findings we can suggest that fog has an important ecological role in the páramo mainly due to its availability for vegetation—reducing CO2 uptake, transpiration, and evaporative losses []; however, its contribution to streamflow is negligible. From a hydrological point of view, inputs from CW are more important. For this reason, water balance studies should focus on observations of low-intensity rainfall rather than fog.
5. Conclusions
This study was initiated to assess the importance of fog-only (FO) and cloud-water (CW) events in contributing to soil moisture in the Andean páramo. The two types of events were divided into two classes according to whether or not they produced effective precipitation (EP), i.e., increases in soil water storage: Class I = EP > 0 mm; Class II = EP of 0 mm. Hence, we focused on the analysis of Class I events.
The total depth from all the FO events was 24.4 mm, only 4.5% of which reached the soil, whereas for CW events 16.7% of the total depth (122.2 mm) turned into EP. The water yield for the FO events was less than 5 mm per event, the maximum duration was 8 h, and at least 1 h was needed for water to reach the soil. Although FO events make a negligible contribution to streamwater, their presence contributes to the maintenance of high relative humidity and low net radiation rates translating to decreased evapotranspiration rates. In contrast, CW events are potentially important for both soil moisture and streamflow in the Andean páramo, because of their long duration (averaging over 13 h) and high total depth per-event (over 10 mm)—owing to the large proportion of drizzle and light rain.
We found no relationship between EP and meteorological variables (wind speed, air temperature, dew temperature, vapor pressure deficit, solar radiation, and relative humidity) since low coefficients of determination and correlation were obtained. While the contribution of fog water to soil moisture is related to fog deposition on vegetation, these meteorological variables are not determinant factors in the estimation of EP amounts.
Because our study was based on rainfall data from a high-resolution disdrometer as well as fog data from equipment tested for monitoring fog in the Andean páramo, we were able to carry out a comprehensive study of various types of precipitation. We believe that our findings significantly advance our understanding of the hydrological role of fog and cloud water in these environments.
Author Contributions
Conceptualization, G.B., P.C. and R.C.; methodology, G.B., P.C. and A.O.-S.; software, G.B.; formal analysis, G.B.; data curation, G.B.; writing—original draft preparation, G.B.; writing—review and editing, P.C., A.O.-S., B.P.W. and R.C.; supervision, P.C. and R.C.; funding acquisition, R.C. All authors have read and agreed to the published version of the manuscript.
Funding
This study was executed in the framework of the project “A research network for the resilience of headwater systems and water availability for downstream communities across the Americas” and was funded by the Vice-rectorate for Research of University of Cuenca.
Institutional Review Board Statement
Not applicable.
Informed Consent Statement
Not applicable.
Data Availability Statement
All data, models, and code that support the findings of this study are available from the corresponding author upon reasonable request.
Acknowledgments
This manuscript is an outcome of the Doctoral Programme in Water Resources, offered by Universidad de Cuenca, Escuela Politécnica Nacional and Universidad Técnica Particular de Loja. GB gratefully acknowledges University of Cuenca for funding her PhD scholarship. Special thanks are due to the staff and students that contributed to the monitoring. We also thank Comuna Chumblín Sombrederas (Azuay, San Fernando) and INV Metals (Canada), Project Loma Larga-Ecuador, for providing logistical support.
Conflicts of Interest
The authors declare no conflict of interest.
Appendix A
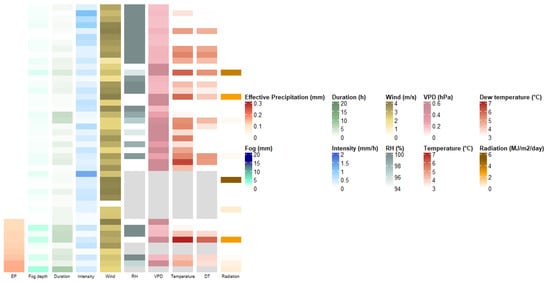
Figure A1.
Heat-map for fog-only events as they relate to effective precipitation, the event characteristics, and the meteorological variables (wind, relative humidity, vapor pressure deficit, temperature, dew temperature, and radiation) analyzed to find an influence on soil moisture gain. Each bar represents a FO event and they are organized by effective precipitation increasing values.

Figure A2.
Heat-map for cloud-water events as they relate to effective precipitation, the event characteristics, and the meteorological variables (wind, relative humidity, vapor pressure deficit, temperature, dew temperature, and radiation) analyzed to find an influence on soil moisture gain. Each bar represents a CW event and they are organized by effective precipitation increasing values.
References
- Josse, C.; Cuesta, F.; Navarro, G.; Barrena, V.; Becerra, M.T.; Cabrera, E.; Chacón-Moreno, E.; Ferreira, W.; Peralvo, M.; Saito, J.; et al. Climate Change and Biodiversity in the Tropical Andes. Mt. Res. Dev. 2012, 32, 258. [Google Scholar] [CrossRef]
- Schoolmeester, T.; Saravia, M.; Andresen, M.; Postigo, J.; Valverde, A.; Jurek, M.; Alfthan, B.; Giada, S. Outlook on Climate Change Adaptation in the Tropical Andes mountains. In Mountain Adaptation Outlook Series 2016; United Nations Environment Programme, GRID-Arendal and CONDESAN: Nairobi, Kenya; Arendal, Norway; Vienna, Austria; Lima, Peru, 2016. [Google Scholar]
- Young, B.E.; Young, K.R.; Josse, C. Vulnerability of tropical andean ecosystems to climate change. In Climate Change and Biodiversity in the Tropical Andes; Inter-American Institute for Global Change Research (IAI) and Scientific Committee on Problems of the Environment (SCOPE): Montevideo, Uruguay, 2011; pp. 170–181. [Google Scholar]
- Walmsley, J.L.; Schemenauer, R.S.; Bridgman, H.A. A Method for Estimating the Hydrologic Input from Fog in Mountainous Terrain. J. Appl. Meteorol. 1996, 35, 2237–2249. [Google Scholar] [CrossRef] [Green Version]
- Aparecido, L.M.T.; Teodoro, G.S.; Mosquera, G.; Brum, M.; de Barros, F.V.; Pompeu, P.V.; Rodas, M.; Lazo, P.; Müller, C.S.; Mulligan, M.; et al. Ecohydrological drivers of Neotropical vegetation in montane ecosystems. Ecohydrology 2018, 11, e1932. [Google Scholar] [CrossRef]
- Delay, J.K.; Giambelluca, T.W. History of fog and cloud water interception research in hawai’i. In Tropical Montane Cloud Forests: Science for Conservation and Management; International Hydrology Series; Cambridge University Press: Cambridge, UK, 2011; pp. 332–341. [Google Scholar] [CrossRef]
- Katata, G. Fogwater deposition modeling for terrestrial ecosystems: A review of developments and measurements. J. Geophys. Res. Atmos. 2014, 119, 8137–8159. [Google Scholar] [CrossRef]
- Berrones, G.; Crespo, P.; Wilcox, B.P.; Tobón, C.; Célleri, R. Assessment of fog gauges and their effectiveness in quantifying fog in the Andean páramo. Ecohydrology 2021, 14, e2300. [Google Scholar] [CrossRef]
- Wright, C.; Kagawa-Viviani, A.; Gerlein-Safdi, C.; Mosquera, G.M.; Poca, M.; Tseng, H.; Chun, K.P. Advancing ecohydrology in the changing tropics: Perspectives from early career scientists. Ecohydrology 2018, 11, e1918. [Google Scholar] [CrossRef]
- Crespo, P.J.; Feyen, J.; Buytaert, W.; Bücker, A.; Breuer, L.; Frede, H.G.; Ramirez, M. Identifying controls of the rainfall-runoff response of small catchments in the tropical Andes (Ecuador). J. Hydrol. 2011, 407, 164–174. [Google Scholar] [CrossRef]
- Buytaert, W.; Sevink, J.; De Leeuw, B.; Deckers, J. Clay mineralogy of the soils in the south Ecuadorian páramo region Geoderma. Geoderma 2005, 127, 114–129. [Google Scholar] [CrossRef]
- Buytaert, W.; Cuesta-Camacho, F.; Tobón, C. Potential impacts of climate change on the environmental services of humid tropical alpine regions. Glob. Ecol. Biogeogr. 2011, 20, 19–33. [Google Scholar] [CrossRef]
- Bruijnzeel, L.A. Hydrology of tropical montane cloud forests: A re-evaluation. Land Use Water Resour. Res. 2001, 1, 1.1–1.18. [Google Scholar]
- Bendix, J.; Rollenbeck, R.; Göttlicher, D.; Cermak, J. Cloud occurrence and cloud properties in Ecuador. Clim. Res. 2006, 30, 133–147. [Google Scholar] [CrossRef] [Green Version]
- Ingraham, N.L.; Mark, A.F.; Frew, R.D. Fog deposition by snow tussock grassland on the Otago uplands: Response to a recent review of the evidence. J. Hydrol. N. Z. 2008, 47, 107–122. [Google Scholar]
- Tobón, C.; Gil Morales, E.G. Capacidad de interceptación de la niebla por la vegetación de los páramos andinos. Av. Recrusos Hidráulicos 2007, 15, 35–46. [Google Scholar]
- Cárdenas, M.F.; Tobón, C.; Buytaert, W. Contribution of occult precipitation to the water balance of páramo ecosystems in the Colombian Andes. Hydrol. Processes 2017, 31, 4440–4449. [Google Scholar] [CrossRef]
- Sampurno Bruijnzeel, L.A.; Eugster, W.; Burkard, R. Fog as a Hydrologic Input. In Encyclopedia of Hydrological Sciences; Anderson, M., McDonnell, J.J., Eds.; John Wiley & Sons: Chichester, UK, 2005; pp. 559–582. [Google Scholar] [CrossRef]
- Katata, G.; Nagai, H.; Kajino, M.; Ueda, H.; Hozumi, Y. Numerical study of fog deposition on vegetation for atmosphere-land interactions in semi-arid and arid regions. Agric. For. Meteorol. 2010, 150, 340–353. [Google Scholar] [CrossRef]
- Chang, S.-C.; Lai, I.-L.; Wu, T. Estimation of fog deposition on epiphytic bryophytes in a subtropical montane forest ecosystem in northeastern Taiwan. Atmos. Res. 2002, 64, 159–167. [Google Scholar] [CrossRef]
- Eugster, W.; Burkard, R.; Klemm, O.; Wrzesinsky, T. Fog Deposition Measurements with the Eddy Covariance Method. In Proceedings of the Second International Conference on Fog and Fog Collection Fog Conference, St. John’s, NL, Canada, 15–20 July 2001; Volume 2001, pp. 1–4. [Google Scholar]
- Holwerda, F.; Burkard, R.; Eugster, W.; Scatena, F.N.; Meesters, A.G.C.A.; Bruijnzeel, L.A. Estimating fog deposition at a Puerto Rican elfin cloud forest site: Comparison of the water budget and eddy covariance methods. Hydrol. Processes 2006, 20, 2669–2692. [Google Scholar] [CrossRef]
- Schmid, S.; Burkard, R.; Frumau, K.F.A.; Tobón, C.; Bruijnzeel, L.A.; Siegwolf, R.; Eugster, W. Using eddy covariance and stable isotope mass balance techniques to estimate fog water contributions to a Costa Rican cloud forest during the dry season. Hydrol. Processes 2011, 25, 429–437. [Google Scholar] [CrossRef]
- Famiglietti, J.S.; Rudnicki, J.W.; Rodell, M. Variability in surface soil moisture content along a hillslope transect: Rattlesnake Hill, Texas. J. Hydrol. 1998, 210, 259–281. [Google Scholar] [CrossRef] [Green Version]
- Tobón, C. Ecohydrology of Tropical Andean Cloud Forests. In The Andean Cloud Forest; Myster, R.W., Ed.; Springer: Cham, Switzerland, 2021. [Google Scholar] [CrossRef]
- Ingraham, N.L.; Mark, A.F. Isotopic assessment of the hydrologic importance of fog deposition on tall snow tussock grass on southern New Zealand uplands. Austral Ecol. 2000, 25, 402–408. [Google Scholar] [CrossRef]
- Fischer, D.T.; Still, C.J.; Ebert, C.M.; Baguskas, S.A.; Park Williams, A. Fog drip maintains dry season ecological function in a California coastal pineforest. Ecosphere 2016, 7, e01364. [Google Scholar] [CrossRef] [Green Version]
- Eugster, W.; Burkard, R.; Holwerda, F.; Scatena, F.N.; Bruijnzeel, L.A. Sampurno. Characteristics of fog and fogwater fluxes in a Puerto Rican elfin cloud forest. Agric. For. Meteorol. 2006, 139, 288–306. [Google Scholar] [CrossRef] [Green Version]
- Rubel, F.; Kottek, M. Observed and projected climate shifts 1901-2100 depicted by world maps of the Köppen-Geiger climate classification. Meteorol. Z. 2010, 19, 135–141. [Google Scholar] [CrossRef] [Green Version]
- Carrillo-Rojas, G.; Silva, B.; Rollenbeck, R.; Célleri, R.; Bendix, J. The breathing of the Andean highlands: Net ecosystem exchange and evapotranspiration over the páramo of southern Ecuador. Agric. For. Meteorol. 2019, 265, 30–47. [Google Scholar] [CrossRef]
- Padrón, R.S.; Wilcox, B.P.; Crespo, P.; Célleri, R. Rainfall in the Andean Páramo—New Insights from High-Resolution Monitoring in Southern. J. Hydrometeorol. 2017, 16, 985–996. [Google Scholar] [CrossRef]
- Ochoa-Sánchez, A.; Crespo, P.; Carrillo-Rojas, G.; Sucozhañay, A.; Célleri, R. Actual evepotranspiration in the high andean grasslands: A comparison of measurement and estimation methods. Front. Earth Sci. 2019, 7, 55. [Google Scholar] [CrossRef] [Green Version]
- IUSS Working Group WRB World Reference Base for Soil Resources. 2014, Update 2015 International Soil Classification System for Naming Soils and Creating Legends for Soil Maps; FAO: Rome, Italy, 2015. [Google Scholar]
- Ochoa-Sánchez, A.; Crespo, P.; Célleri, R. Quantification of rainfall interception in the high Andean tussock grasslands. Ecohydrology 2018, 11, e1946. [Google Scholar] [CrossRef]
- Montenegro-Díaz, P.; Ochoa-Sánchez, A.; Célleri, R. Impact of tussock grasses removal on soil water content dynamics of a tropical mountain hillslope. Ecohydrology 2019, 12, e2146. [Google Scholar] [CrossRef]
- Orellana-Alvear, J.; Célleri, R.; Rollenbeck, R.; Bendix, J. Analysis of rain types and their Z-R relationships at different locations in the high andes of southern Ecuador. J. Appl. Meteorol. Climatol. 2017, 56, 3065–3080. [Google Scholar] [CrossRef]
- Fleischbein, K.; Wilcke, W.; Valarezo, C.; Zech, W.; Knoblich, K. Water budgets of three small catchments under montane forest in Ecuador: Experimental and modelling approach. Hydrol. Processes 2006, 20, 2491–2507. [Google Scholar] [CrossRef]
- Clark, K.E.; Torres, M.A.; West, A.J.; Hilton, R.G.; New, M.; Horwath, A.B.; Fisher, J.B.; Rapp, J.M.; Robles Caceres, A.; Malhi, Y. The hydrological regime of a forested tropical Andean catchment. Hydrol. Earth Syst. Sci. 2014, 18, 5377–5397. [Google Scholar] [CrossRef] [Green Version]
- Liu, W.; Meng, F.R.; Zhang, Y.; Liu, Y.; Li, H. Water input from fog drip in the tropical seasonal rain forest of Xishuangbanna, South-West China. J. Trop. Ecol. 2004, 20, 517–524. [Google Scholar] [CrossRef]
- Gomez-Peralta, D.; Oberbauer, S.F.; McClain, M.E.; Philippi, T.E. Rainfall and cloud-water interception in tropical montane forests in the eastern Andes of Central Peru. For. Ecol. Manag. 2008, 255, 1315–1325. [Google Scholar] [CrossRef]
- Chang, S.C.; Yeh, C.F.; Wu, M.J.; Hsia, Y.J.; Wu, J.T. Quantifying fog water deposition by in situ exposure experiments in a mountainous coniferous forest in Taiwan. For. Ecol. Manag. 2006, 224, 11–18. [Google Scholar] [CrossRef]
- Herckes, P.; Mirabel, P.; Wortham, H. Cloud water deposition at a high-elevation site in the Vosges Mountains (France). Sci. Total Environ. 2002, 296, 59–75. [Google Scholar] [CrossRef]
- Liu, W.J.; Ping Zhang, Y.; Mei Li, H.; Hong Liu, Y. Fog drip and its relation to groundwater in the tropical seasonal rain forest of Xishuangbanna, Southwest China: A preliminary study. Water Res. 2005, 39, 787–794. [Google Scholar] [CrossRef] [PubMed]
- Ramírez, B.H.; Teuling, A.J.; Ganzeveld, L.; Hegger, Z.; Leemans, R. Tropical Montane Cloud Forests: Hydrometeorological variability in three neighbouring catchments with different forest cover. J. Hydrol. 2017, 552, 151–167. [Google Scholar] [CrossRef]
- Goodman, J. The Collection of Fog Drip. Water Resour. Res. 1985, 21, 392–394. [Google Scholar] [CrossRef]
- Giambelluca, T.W.; Delay, J.K.; Nullet, M.A.; Scholl, M.; Gingerich, S.B. Interpreting canopy water balance and fog screen observations: Separating cloud water from wind-blown rainfall at two contrasting forest sites in Hawai’i. In Tropical Montane Cloud Forests: Science for Conservation and Management; Cambridge University Press: Cambridge, UK, 2011; pp. 342–351. [Google Scholar] [CrossRef]
- Célleri, R.; Feyen, J. The Hydrology of Tropical Andean Ecosystems: Importance, Knowledge Status, and Perspectives. Mt. Res. Dev. 2009, 29, 350–355. [Google Scholar] [CrossRef]
- Holwerda, F.; Bruijnzeel, L.A.; Muñoz-Villers, L.E.; Equihua, M.; Asbjornsen, H. Rainfall and cloud water interception in mature and secondary lower montane cloud forests of central Veracruz, Mexico. J. Hydrol. 2010, 384, 84–96. [Google Scholar] [CrossRef]
- Tav, J.; Masson, O.; Burnet, F.; Paulat, P.; Bourrianne, T.; Conil, S.; Pourcelot, L. Determination of fog-droplet deposition velocity from a simple weighing method. Aerosol Air Qual. Res. 2018, 18, 103–113. [Google Scholar] [CrossRef]
- Gultepe, I.; Tardif, R.; Michaelides, S.C.; Cermak, J.; Bott, A.; Bendix, J.; Müller, M.D.; Pagowski, M.; Hansen, B.; Ellrod, G.; et al. Fog Research: A Review of Past Achievements and Future Perspectives. Pure Appl. Geophys. 2007, 164, 1121–1159. [Google Scholar] [CrossRef]
Publisher’s Note: MDPI stays neutral with regard to jurisdictional claims in published maps and institutional affiliations. |
© 2022 by the authors. Licensee MDPI, Basel, Switzerland. This article is an open access article distributed under the terms and conditions of the Creative Commons Attribution (CC BY) license (https://creativecommons.org/licenses/by/4.0/).