4.1. Numerical Studies
Ref. [
8] studied the results of models using 7 different turbulence models to investigate which one performed the best when simulating a Parshall flume. The simulations were constructed based on experimental setup by Ref. [
12] where the water level was recorded. OpenFOAM, an open-source Computational Fluid Dynamic (CFD) software package was utilized to solve the flow equations. The turbulence models were chosen from three different main methods, i.e., Reynolds Average Navier–Stokes (RANS), Large Eddy Simulation (LES), and Detached Eddy Simulation (DES). The VOF method was implemented to reveal the boundary between fluid and air. Considering all different approaches to solve the flow equations, the performance of each turbulence model was evaluated by calculating the standard average error. This was done for 7 well-distributed cross-sections along the flume by comparing simulation results with experimental data. Results of the comparison revealed that the best performance was achieved with the standard
model from the RANS family, followed by the Dynamic one-equation approach from the LES approach.
Due to the variety of the turbulence models used in the study by Heyrani et al., the latter was considered to be one of the most comprehensive resources to study the application of numerical modeling in Venturi flumes, specifically the Parshall flume. Overall, the results from all turbulence models were considered acceptable due to the low error percentage values, i.e., less than 2.53%, where the highest was recorded for
SST and
SST-DES from RANS and DES families, respectively. The authors showed that due to the fluctuations recorded at the first cross-section, the average error percentage recorded was higher.
Figure 6 shows the comparison between the numerical data versus the experimental results.
In conclusion, the application of numerical modeling as a tool to enhance the hydraulic design of hydraulic structures was highly recommended by Heyrani et al. [
8]. This was mainly due to the time and cost saving nature of the CFD approach. Additionally, the reasonably low computational resource allocation for numerical modeling of the Parshall flume made it a good candidate to be applied in order to rectify complicated engineering challenges.
The implementation of nonlinear turbulence models in OpenFOAM was pursued by Ref. [
7] in conjunction with their previous comprehensive study on 7 linear turbulence models. Three different turbulence models, i.e., Shih et al. (1998) [
13] Quadratic
Model (SQ), Lien, 1996 [
14] Cubic Turbulence Model (LC) and
, from the RANS family were selected to simulate the flow in a modified 3-in Parshall flume. The modification was focused on the throat section parameters, i.e., the width, the length, and the overall bed drop of the throat. Various flowrates were used in the simulation model, as the experimental data were available in the other study, Ref. [
8], mentioned above. A comparison was made between numerical and experimental data. The maximum average error was obtained by SQ model, i.e., 8.69%, while the
model provided an average error value of 1.79%, the lowest among not only the three nonlinear models used in this study, but also the seven linear models that were used previously by Heyrani et al. [
8] in another study, with the same experimental setup.
The authors concluded that the use of CFD software with a non-linear turbulence model to simulate the flow in Parshall flumes was feasible due to the quality of the results and the amount of time spent to achieve them. The level of accuracy within not only the three nonlinear models, but also the other linear turbulence models used previously were considered acceptable, as all of the average error values were below 3% except the SQ model. Hence, it was recommended that the CFD results be implemented for any further modifications in the design of Parshall flumes, as the numerical simulations closely mimic the actual scenarios.
Figure 7 is an example of what was discussed above regarding the numerical simulation reliability.
Ref. [
15] conducted a study on the effects of nonstandard conditions with respect to Parshall flumes. The most common criteria that are neglected by scholars are the presence of longitudinal bed slope at the placement location and the existence of distortion in the velocity profile upstream of the flume’s entrance. The Parshall flume used in Ref. [
15] experiments was a 6-in flume. As a simulation tool, SOLA-FLUMP, a three-dimensional, free-surface finite-difference code was utilized to rectify the errors that arose due to such non-structural issues. The use of SOLA-FLUMP is strictly limited to the cases where non-submerged flows are passing through Parshall flumes. The comparison of the simulation results and experimental data were reported to be good even though the viscosity parameter in the model was neglected.
Implementing a V-Notch Weir in the system provides a flowrate reading with an accuracy of up to 1.25% when calibration was done in place. There was a modification on the entrance wing-walls that made the flume geometry different from the standard one. One of the reasons for this modification was to improve the simplicity of the model’s performance, while it was claimed that shifting the wingwall’s location to 2.44 m upstream of the inlet entry point did not make any changes to the flume’s overall performance. It was also highlighted that due to lack of computational resources, the numerical simulations were all performed on symmetric geometry around the centerline of the flume. Asymmetric simulations were possible to achieve with improvements of the computational hardware. The authors concluded that the SOLA-FLUMP code was accurate enough to be used as a resource to provide guidelines for the use of Parshall flumes in nonstandard situations.
Ref. [
11] compiled numerous numerical simulations and physical experiments to investigate the accuracy of two field-scaled Parshall flumes placed in a parallel setup. The application of two flumes (0.91 and 1.22 m) was used as a tool to measure the flow rate in a wastewater system in Minnesota. VFS-Geophysics code, an open-source simulation model that was available in-house to the researchers, was used to develop the numerical simulations. Volume of Fluid (VOF), Large Eddy Simulation (LES), and level-set methods were also used as numerical tools to determine the water surface level and turbulent flow, as two-phase flow conditions were assumed. A combination of LES and level-set methods provided instantaneous water level values at any point in the flume.
Overall, the study was conducted over four different flowrates, i.e., 500, 700, 1000, and 1500
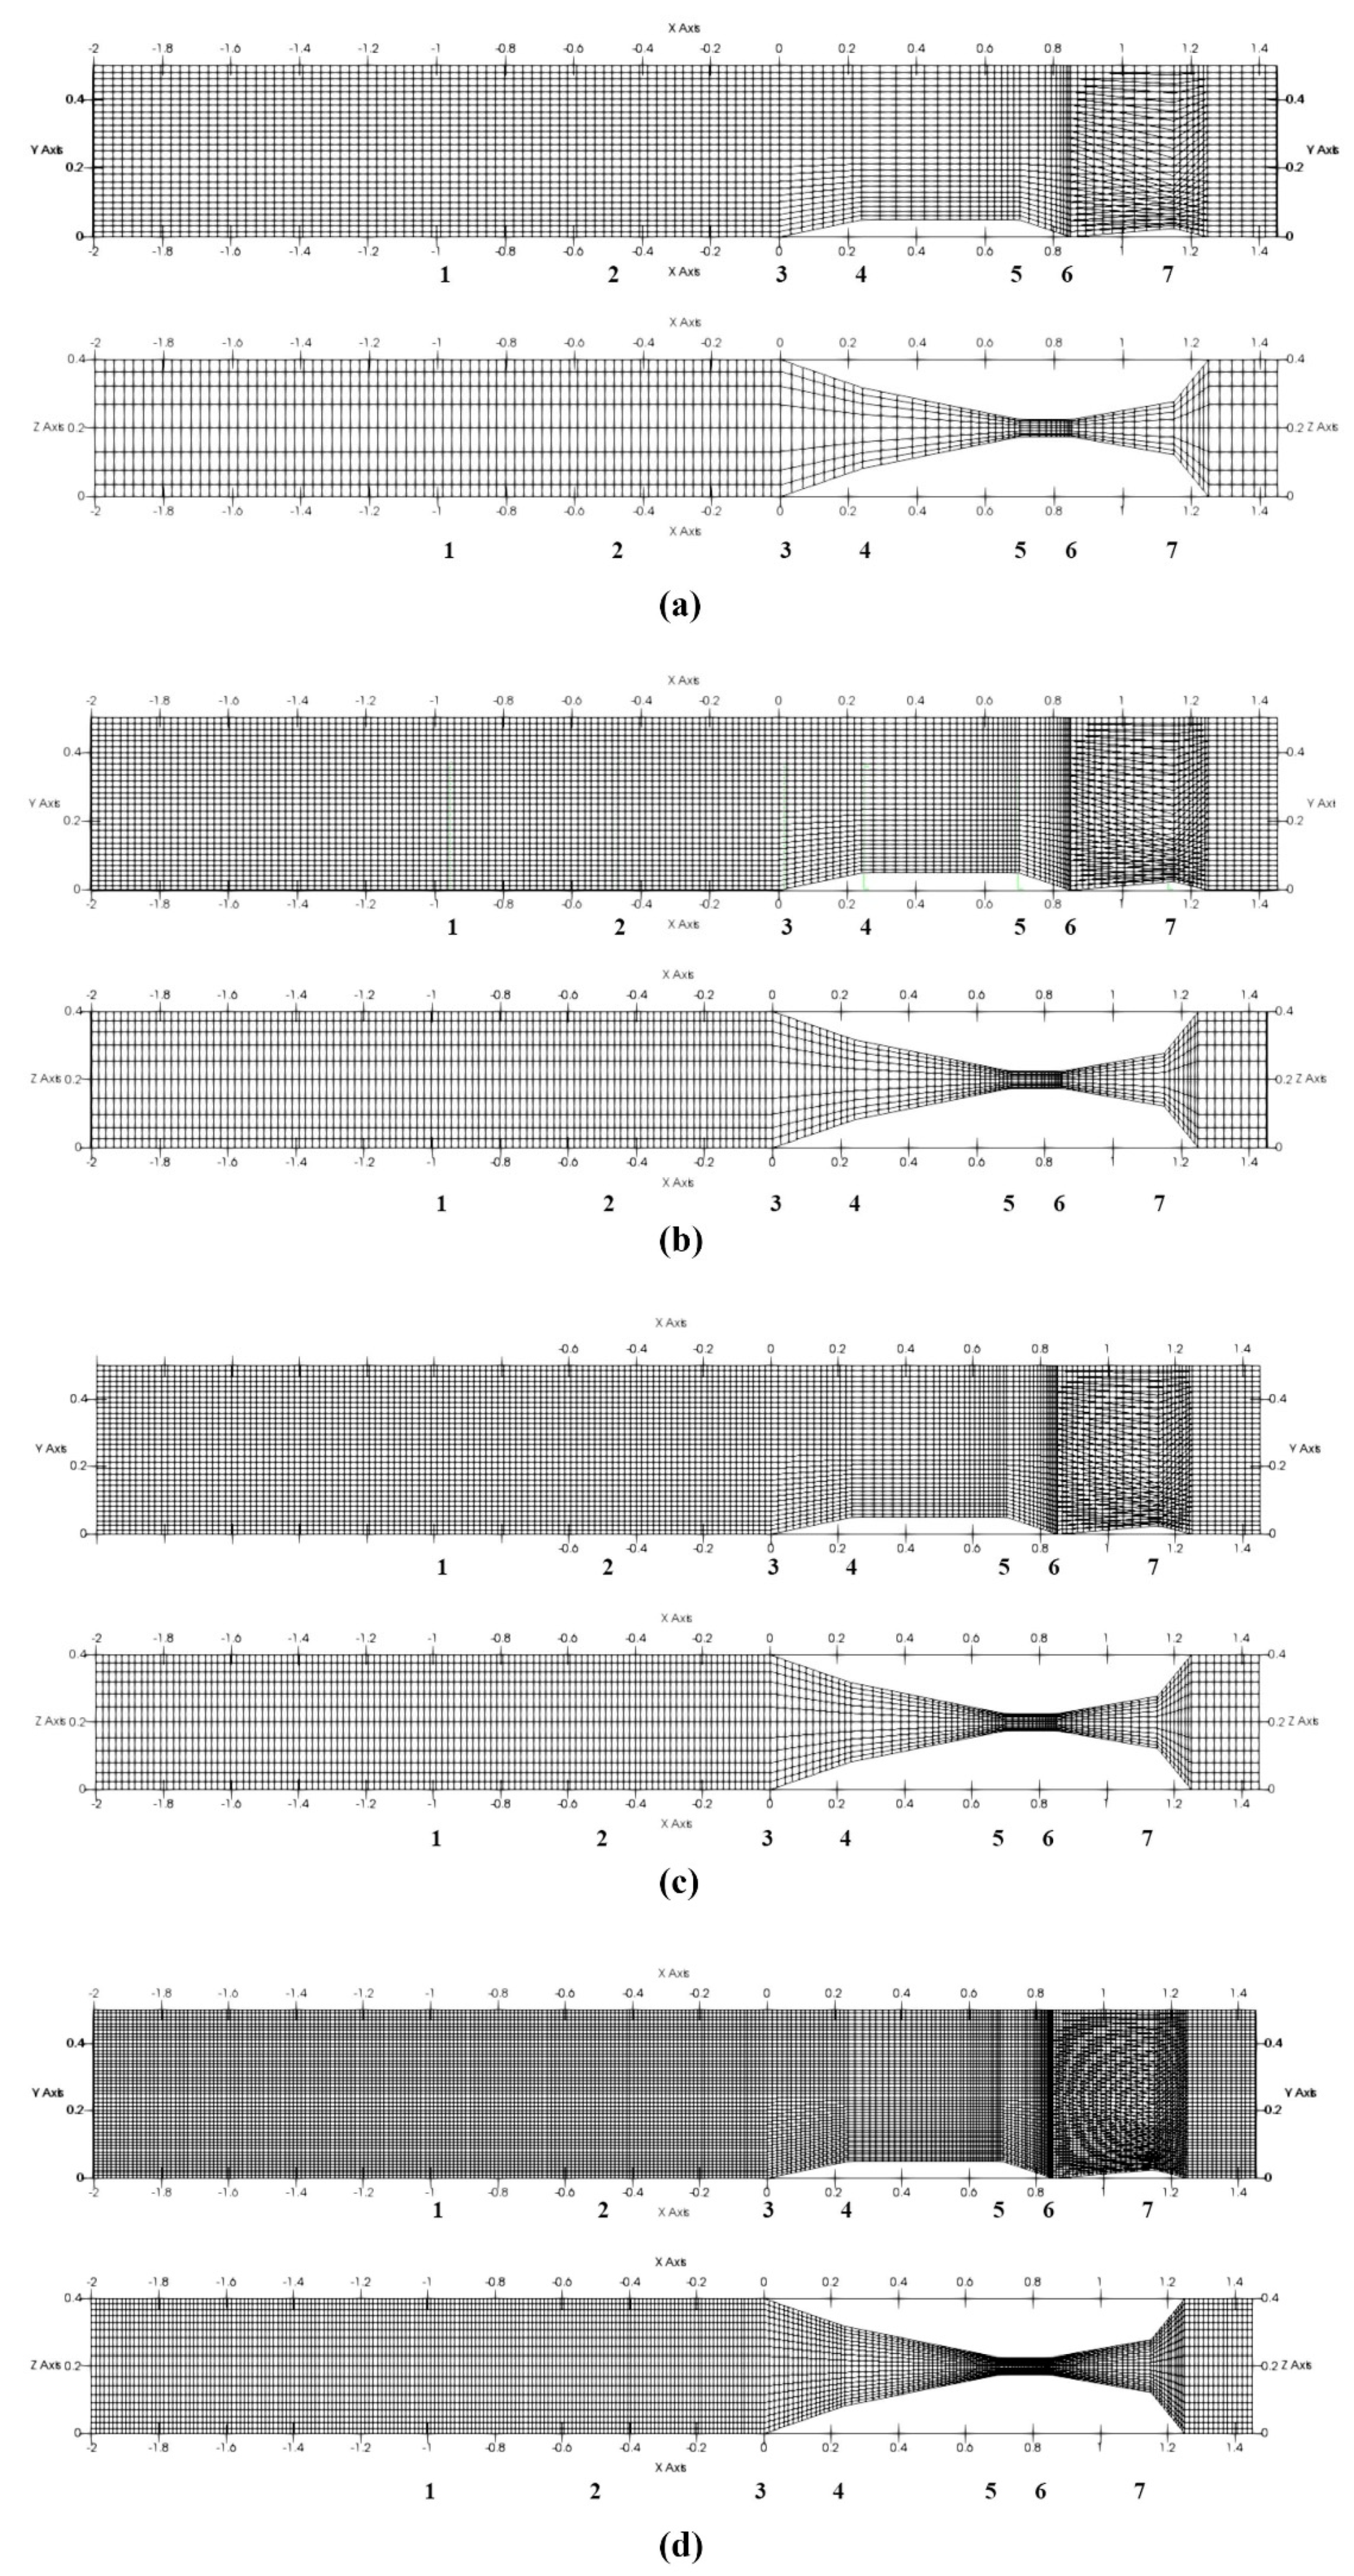
, where the total number of nodes in the grid system was reported as 6.5 million nodes. The experimental study was carried out using dye dilution method along with different flowrate measurement devices to determine the discharge passing through Parshall flumes. The authors reported that the best discharge results were obtained using an interval of one hour for time-averaged flow rate data. The main objective in the comparison of numerical results and experimental data in this study was to demonstrate that the numerical model is a reliable method of finding the margin of error of the full-scale flume under working condition; also, it is an applicable tool to determine the range of water surface level fluctuations over the Parshall flume. The comparison between simulation results and experimental data showed up to 8% variation in one Parshall flume’s rating curve, while the other one demonstrated a 3% error at high flow rates. The error increased up to 10% when low discharge was introduced to the second flume.
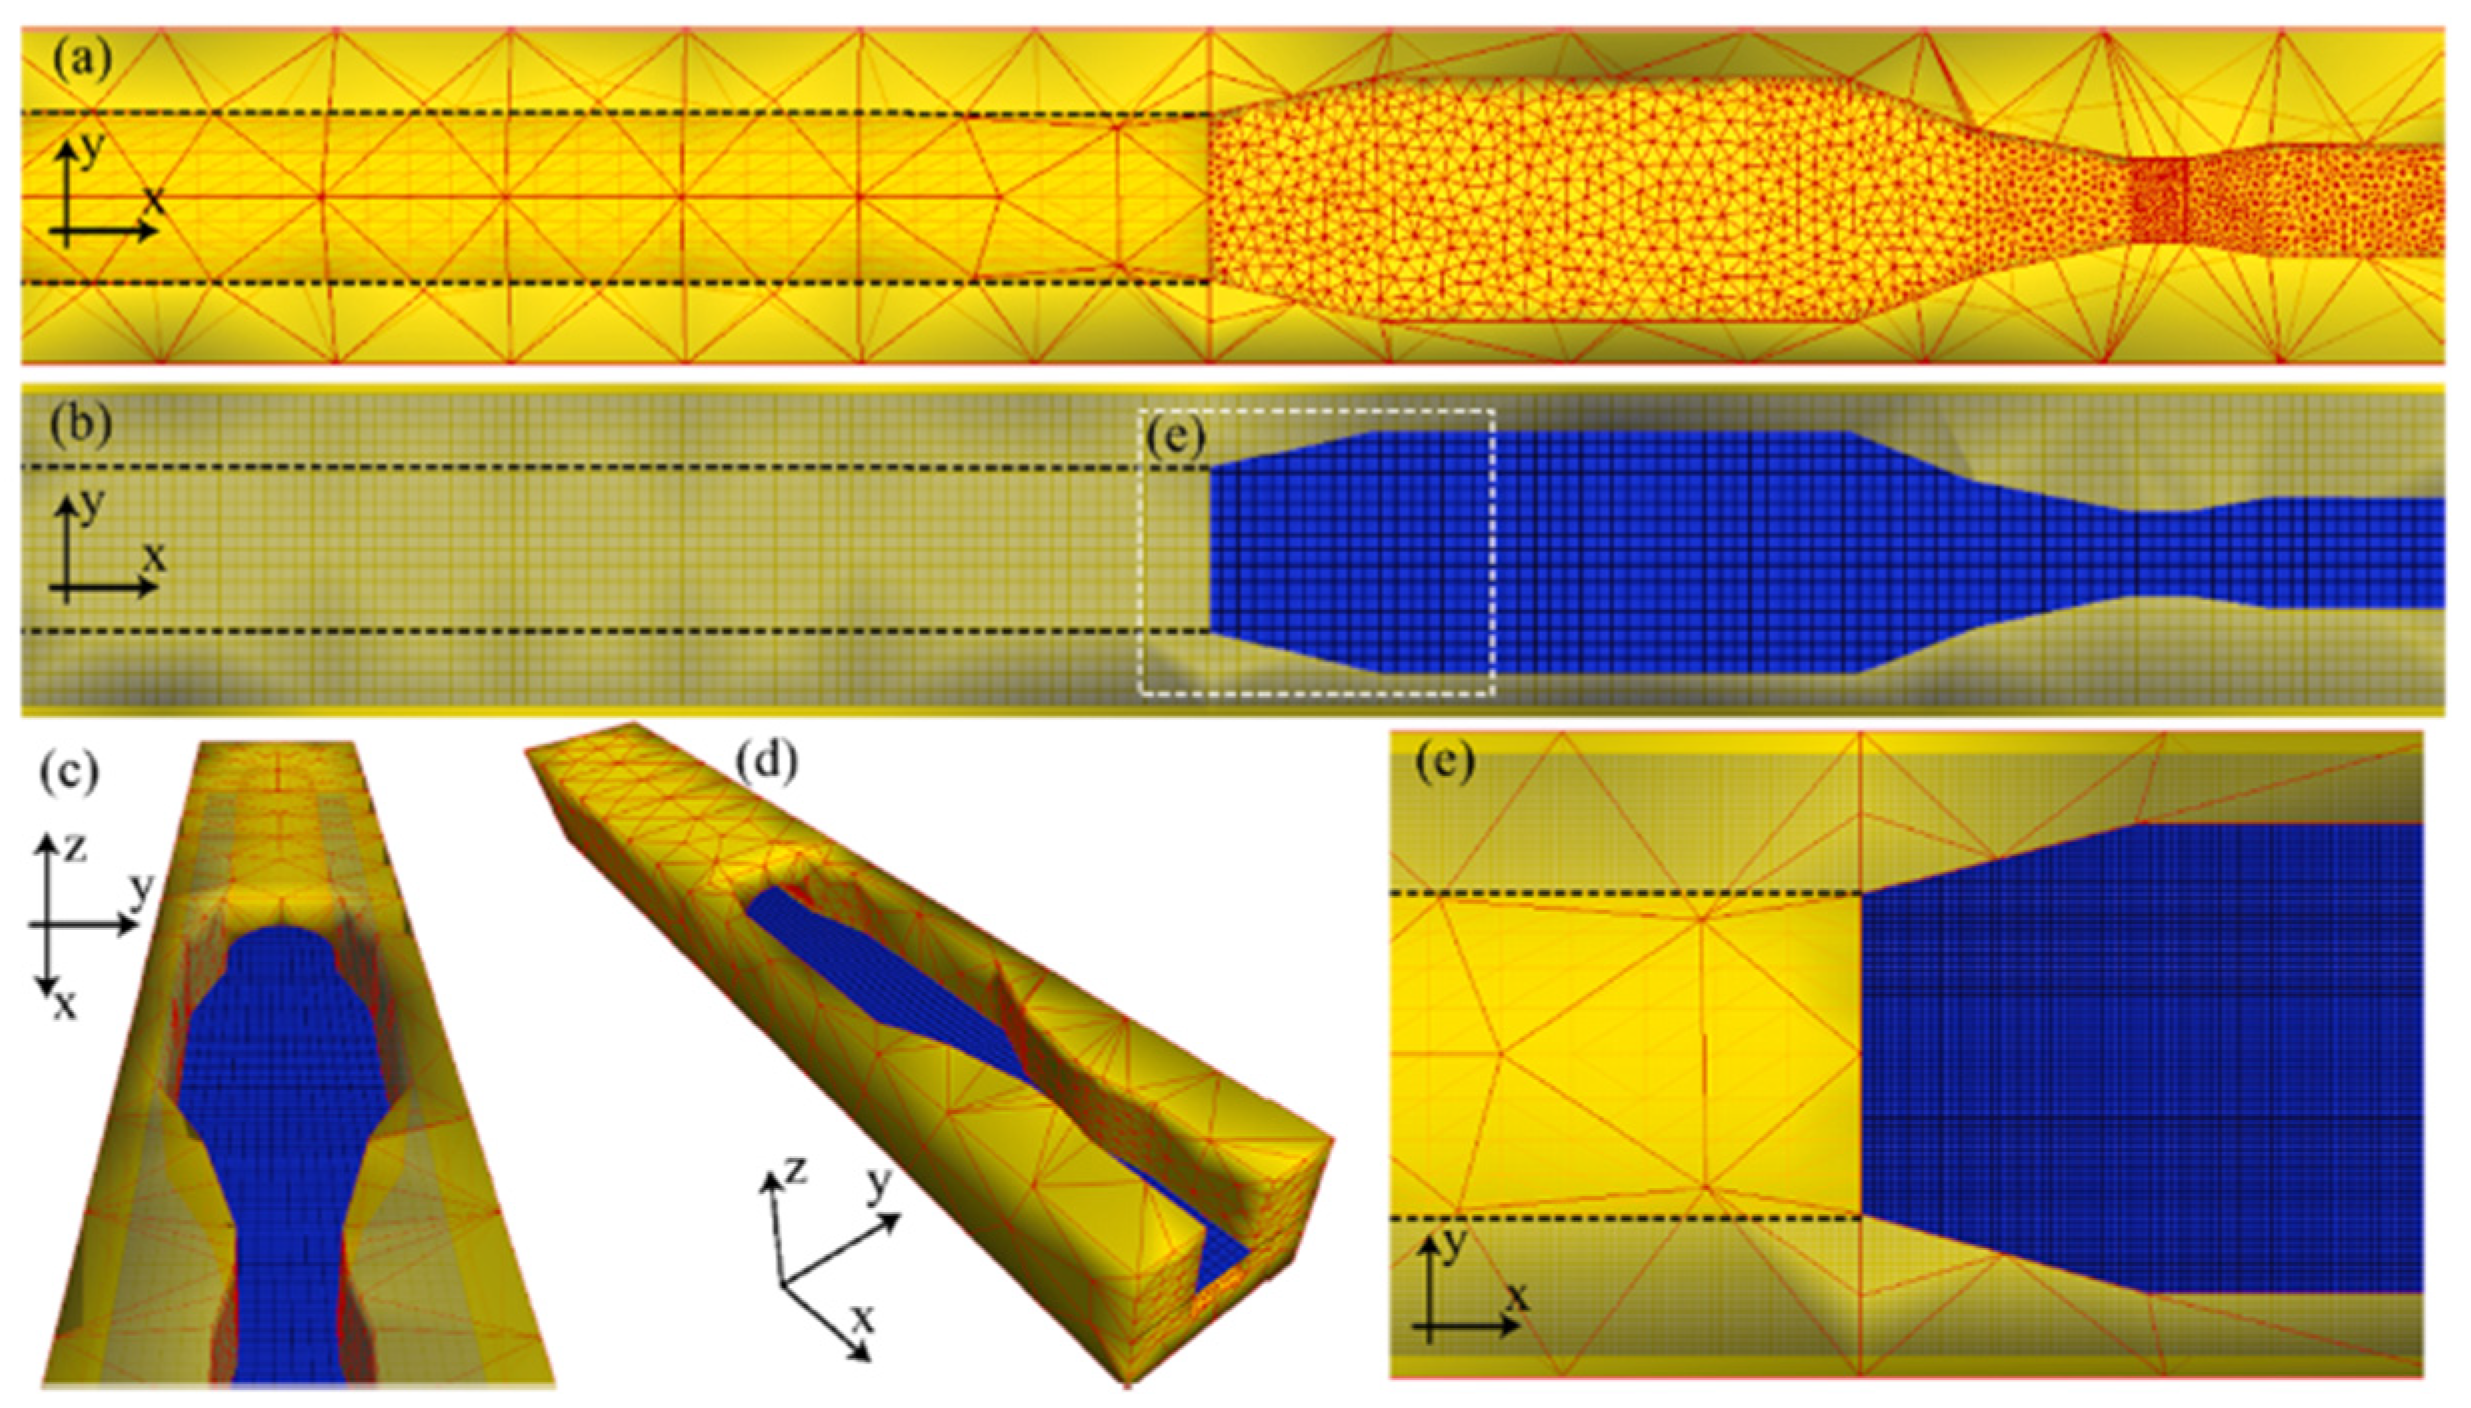
Figure 8 illustrates the grid system on the Side A (right) Parshall flume in the parallel system.
In a study by Ref. [
16], the advantages of using a flume, specifically a short-throat flume, was explored. It was highlighted that the application of a flume or flume set with smaller size to provide more accurate discharge control at the inlet of the field was neglected by different researchers. The TruVOF technique together with the principles of critical flow were implemented in a 76 mm wide flume in FLOW-3D. The Re-Normalization group (RNG)
turbulence model was used in the numerical simulation to evaluate the hydraulic performance of the flume under 16 different conditions. The maximum discharge of up to 40 L/s was assumed during the experiments. Simulation results were then compared to the time-averaged flow field, flow pattern, Froud number, and velocity distribution. The results of the application of a portable short-throat flume revealed lower head loss compared to the long-throat flume. Moreover, free flow condition confirmed less head loss versus having submerged condition.
A short throat flume with a flat bottom was used in their study. There were, in total, 11 cross-sections considered as the data collection points, starting with 259 mm width at cross-section 1 to 178 mm width at the last cross-section. The throat size of 76 mm was recorded for cross-sections 5 to 9. The comparison of results indicated that a ± 10% error is unavoidable. In addition, the constructed regression model used to illustrate the relation between the upstream depth and discharge in various tested conditions showed an error of 9.16%, a value that is acceptable when it comes to the flow measurement in irrigation areas. With respect to the long-throat flume, the head loss of a portable short-throat flume in the field was determined to be considerably low. Further, head loss under the free flow condition was less than the one under the submerged flow condition of portable short-throat flume with a flat base in the field.
In another study by Ref. [
17], by developing a numerical model, the importance of consideration of the fluid viscosity was explored. The focus of the study was on flow with low discharge in a Parshall flume. As mentioned in the paper, the original rating equation by Parshall paid no attention to the fluid viscosity for low discharge flows. Therefore, a numerical model was introduced for four different sizes of Parshall flume to predict the fluid viscosity’s effect on the depth–discharge relation. The use of the original rating equation along with several experimental data shows an overprediction of discharge. This happened for a discharge of around less than 15% of the maximum rated discharge for the flume. Moreover, inconsistency was up to 25% when the flume operated within its recommended flowrate. Therefore, the coefficients of the initial rating equation were reconstructed for low discharges using the numerical results. It was highlighted that the simulation results were in perfect accordance with experimental data.
The numerical model was constructed based on two concepts of energy conservation and the formation of the boundary layer on the sides and bed of the Parshall flume. The physical Parshall flume model used for experimental investigation could accommodate two different setups: 3- and 6-in, which acted as a 1/4 scale model of 1- and 2-ft setups. The flowrate was measured for each experiment with a calibrated Venturi meter, a separate procedure in addition to the main experiments. Alternative rating equation coefficients were proposed for various Parshall flumes when the flow is in submerged condition at low discharge, but it was recommended that the original Parshall’s equation constants be used for higher flowrates.
Ref. [
18] investigated the importance of maintaining the main design parameters as originally proposed for the Parshall flume. The proper design criteria from Parshall himself can lead to discharge accuracy of ± 3–5%. Meanwhile, the negligence of common parameters, such as specifying the correct location for head measurement upstream and the selection of the proper wingwalls design at the entrance, caused the rating curve to be produced with inaccurate discharge results. As an example, a possible error of up to 60% was unavoidable when the submergence condition was not fully considered with no free-flow condition involved. In addition, measuring the flow head upstream anywhere but the specific location proposed by Parshall can also introduce an error of up to 60%. Therefore, to rectify the issue of applying nonstandard Parshall flumes in flow measurements over free-flow conditions, numerical simulation was utilized as a cost saving tool to provide numerus flow parameters over various sizes of Parshall flumes. The CFD results were investigated to provide a procedure to correct the flowrate for different sizes of flumes ranging from 2- to 8-ft. The application of CFD in this study was considered as an alternative to the traditional build–test method, which was considered inefficient with respect to over-allocation of some resources such as time and cost.
The results and procedures provided by Heiner and Barfuss followed the approach of collecting the head measurement at different points on the wingwalls and centerline anywhere within the convergence section except the standard location. For each flume size studied by Heiner and Barfuss, three different wingwall arrangements were considered, i.e., standard radius wingwall, 45-degree wingwall, and no wingwall. The CFD model used was FLOW-3D, while the VOF method was used to determine the boundary condition of the free surface. The FAVOR method was implemented to distinguish the boundary line between solid surfaces and the flow.
Ref. [
19] validated the application of the numerical modeling by providing the correction coefficient for different sizes of Parshall flumes. Common problems in nonstandard Parshall flumes include dislocation of staff gauge and the presence of undefined entrance conditions such as different wingwall arrangements in the flumes, which can increase the calculated flowrate error up to 60%. Introducing a suitable correction factor, in the majority of cases, was able to produce results of (±) 3–5% in error and improve the biased data of the rating curve. The correction value was obtained by using data from a physical model of a 61 cm Parshall flume. Geometrical dissimilarity across the various sizes of Parshall flumes made it impossible to implement a single calibrated equation to remove the biases from the calculated flow rates of all nonstandard flumes. Therefore, numerical modeling was employed to rectify this problem.
Up to 18 cross sections within the converging area of a Parshall flume were defined to evaluate water level, while various wingwall configurations were introduced to the flume, i.e., radius of curvature of entrance wingwalls, 45-degree angled, and no wingwall. Multiple locations within the cross sections were chosen to record the water surface data: at centerline, close to side walls, and at the sides attached to the stilling well. In total, 54 points were designated to be studied. The locations of the cross sections were selected based on the data collected during a field visit to the nonstandard flumes.
FLOW-3D was used as the CFD tool while the VOF method was implemented to provide the free surface of the flow. As wall function, the Fractional Area/Volume Obstacle Representation (FAVOR) method was chosen. In order to minimize the simulation time, the channel was only defined up to the beginning of the downstream section. Running the simulation only for the left side of the longitudinal centerline allowed further reduction in computational time since the geometry of the flume was symmetric. Due to the ability of RNG
model to simulate hydraulic jumps, this turbulence model was used in FLOW-3D. Based on 10 s time averaged data of water surface, pressure, and velocity, a small deviation was observed against the instantaneous data. Based on the study on wingwall configuration, a ± 5% deviation was expected to occur in the measured flow. The use of a numerical model was recommended by Ref. [
19], based on the good performance of the numerical results, i.e., deviation of 5% for 90 to 95% of the data, against bias corrected physical findings.
Ref. [
20] investigated the sources of flow problems in short-throated flumes. The empirical models that were derived from physical experiments were pointed out to be a fundamental tool in constructing the rating curve of the flume. The quality and efficiency of the derived equation is in direct proportion to the size of the samples collected under different conditions, i.e., flume sizes and flow discharges. The conventional approaches, such as hydrostatic pressure method, were incapable of modeling the hydraulic characteristics of flows passing through Venturi flumes. Instead, a one-dimensional model was used to simulate the flow and clarify various characteristics of the flow, such as water level and pressure gradient over various sections. Finally, measured data were compared against the simulated data. The comparison between numerical and experimental data confirmed good model performance.
The study was divided into two main categories. For an open channel flow, a high-order model was developed with no consideration of pressure or vertical velocity assumptions for the flow. It was claimed that the one-dimensional model had higher computational efficiency than the 2D non-hydrostatic and quasi-3D numerical models. With respect to simplicity in application, it was considered as computationally efficient. The capability in providing the rating curve via a convenient method for free flow condition in flumes like Venturi and Parshall made the proposed model even more competent.
The other pertinence of this study was the provision of numerical simulation for short-throated flumes with or without bottom hump. Total losses of energy considered in the study were due to the flow turbulence and roughness of the walls and floor, where it was believed that surface friction caused the majority of the losses. Overall, the results from the proposed one-dimensional model satisfied the free flow data in a Parshall flume as well as in the other short-throated flumes when compared with the 2D model results.
Figure 9 illustrates the comparison of simulation results and experimental data.
Ref. [
21] studied available approaches to reduce the head loss in flumes by introducing three curve-designed flumes. The new flumes were formed as the result of alteration in the contraction ratio of the flume using the concept of critical flow to minimize the head losses. According to Ref. [
21], contraction ratio was defined as the ratio of the throat’s cross-sectional area to the area of the channel’s cross-section. A comparison was carried out for various hydraulic parameters such as water level, Froude number, velocity distribution, and head loss over the physical model and numerical simulation for curved flumes. The analysis revealed an overall error of 4.7% in the water level, which was considered acceptable. The results also showed a sudden decrease in discharge due to the submerged condition at the beginning of the divergence section. This happened shortly after the flow gained speed along the contraction section. A gradual increase in the contraction ratio resulted in a decrease in the depth of water and an increase in the Froude number upstream. The best result of maximum head loss was 38.4% while 26.41 L/s flowrate was passing through the curved flume’s throat with a contraction ratio of 0.4. It was emphasized by the authors that compared to other flumes, the results from curved flumes were superior. In addition, a new formula to provide the rating curve of the proposed flumes was constructed based on dimensional analysis method, and this led to accurate results.
Fluent software was used as CFD with implementation of VOF method to illustrate the free surface of the flow. Due to the presence of the curved surface within the flume, an unstructured mesh was chosen to define its geometry within CFD. The standard turbulence model was selected to solve the flow equations for 12 different flow rates, i.e., 5 L/s to 27.19 L/s over three different curved flumes having various contraction ratios, i.e., 0.4, 0.5, and 0.6. The authors concluded that due to smaller head loss in curved flumes, higher flow capacity was expected to pass compared to the airfoil-shaped flume under the same conditions.
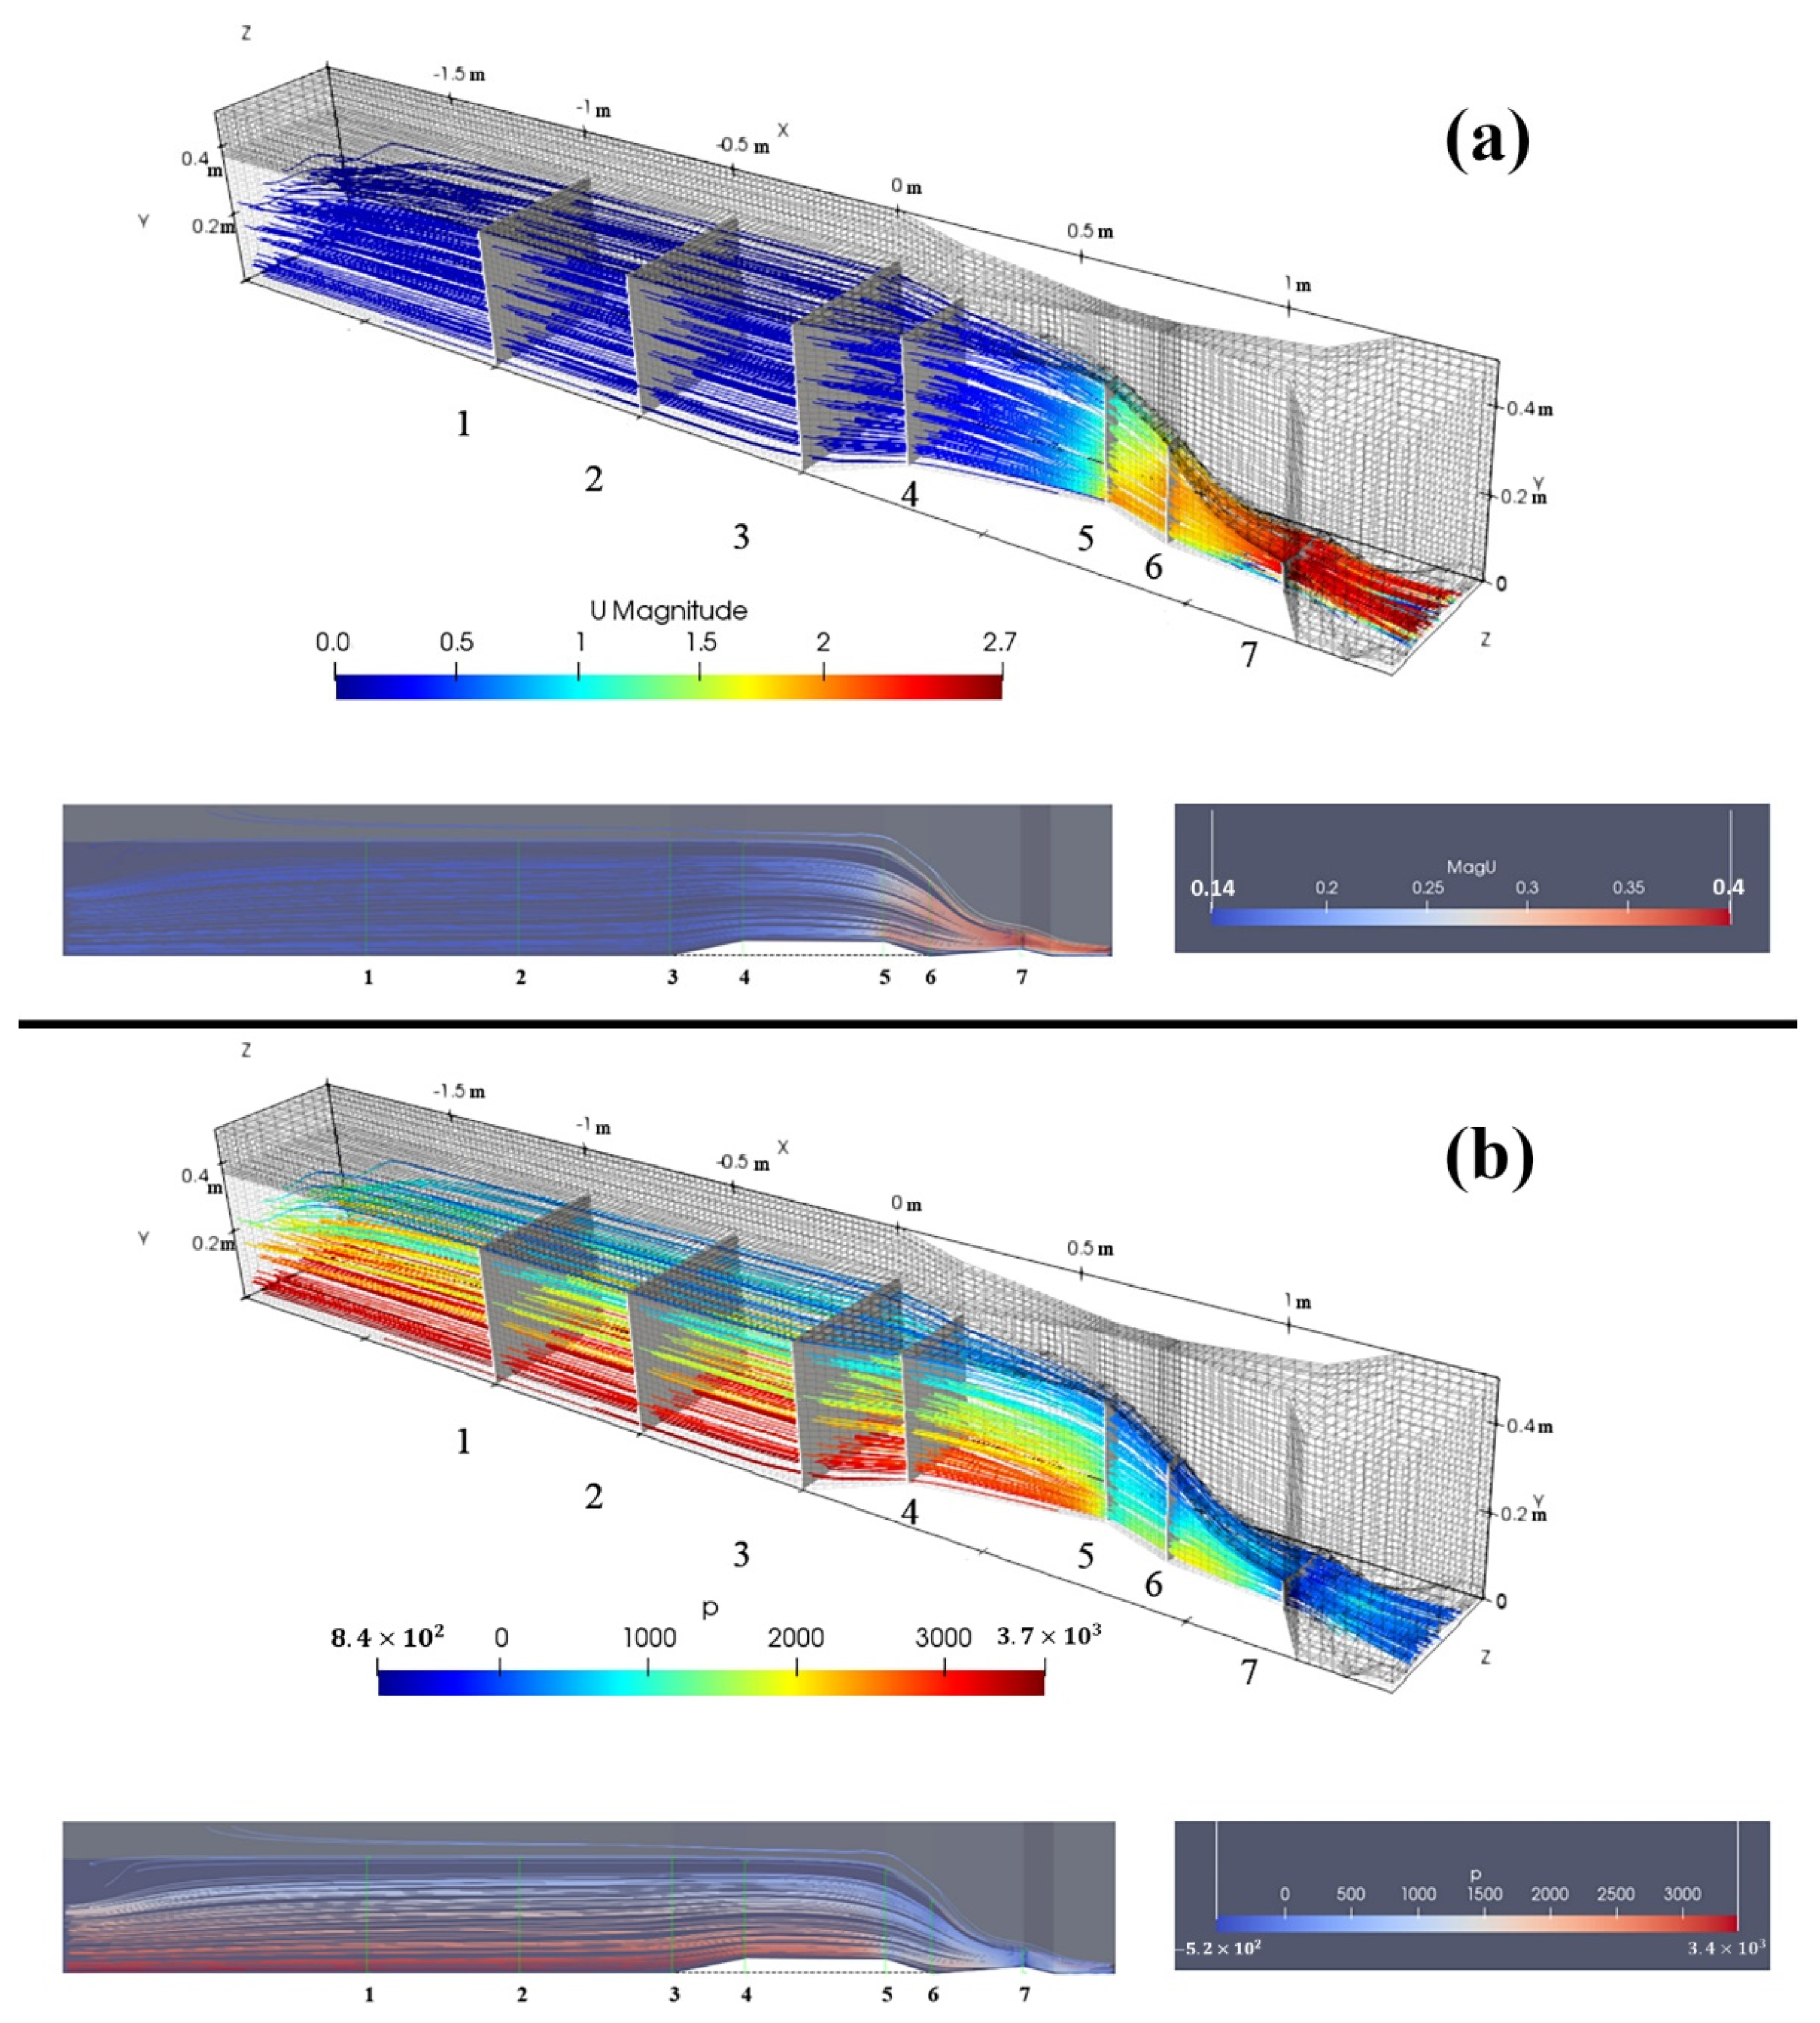
Ref. [
22] used numerical modeling to simulate the three-dimensional (3-D) flow field in a Parshall flume and two other flumes using the VOF method. The data from physical experiments were used to evaluate the accuracy of simulated results in order to determine the efficiency of the CFD approach. FLOW-3D software was chosen as the CFD tool, while the standard
turbulence model was selected to simulate the flow. The implementation of FLOW-3D was due to its reliability, as verified by various researchers. A U-shaped channel with a radius of 0.2 and 0.45 m in depth was used to accommodate the Parshall flume with a throat size of 0.152 m and a contraction ratio of 0.763. The velocity of the flow and the turbulent kinetic energy were assessed at 4 different cross sections, with the flowrate set to 40 L/s. The largest error in the comparison was found to be 2.3 mm or 1.07%. The overall head loss of the Parshall flume was observed in the throat section and especially in the divergence section where the hydraulic jump was formed.
It was concluded that the head loss of the Parshall flume in a U-shaped channel was far greater than the other two flumes, i.e., 3.3 times bigger than the parabolic flume and 1.16 times greater than the long-throated flume. Therefore, the parabolic flume was found to be the most accurate measuring tool in the study. The rating curve relationship for different channel gradients was also proposed.
In a study by Ref. [
23], several parameters in four different flumes were numerically and experimentally investigated. ANSYS Fluent software such as the CFD tool and standard
turbulence model, along with the VOF method, were used to provide the results for 144 simulations across various flume configurations with different contraction ratios. The correlation between the contraction ratio, i.e., 0.4, 0.5, and 0.6, the discharge, i.e., 4.83 to 27.15 L/s, and depth upstream, were analyzed.
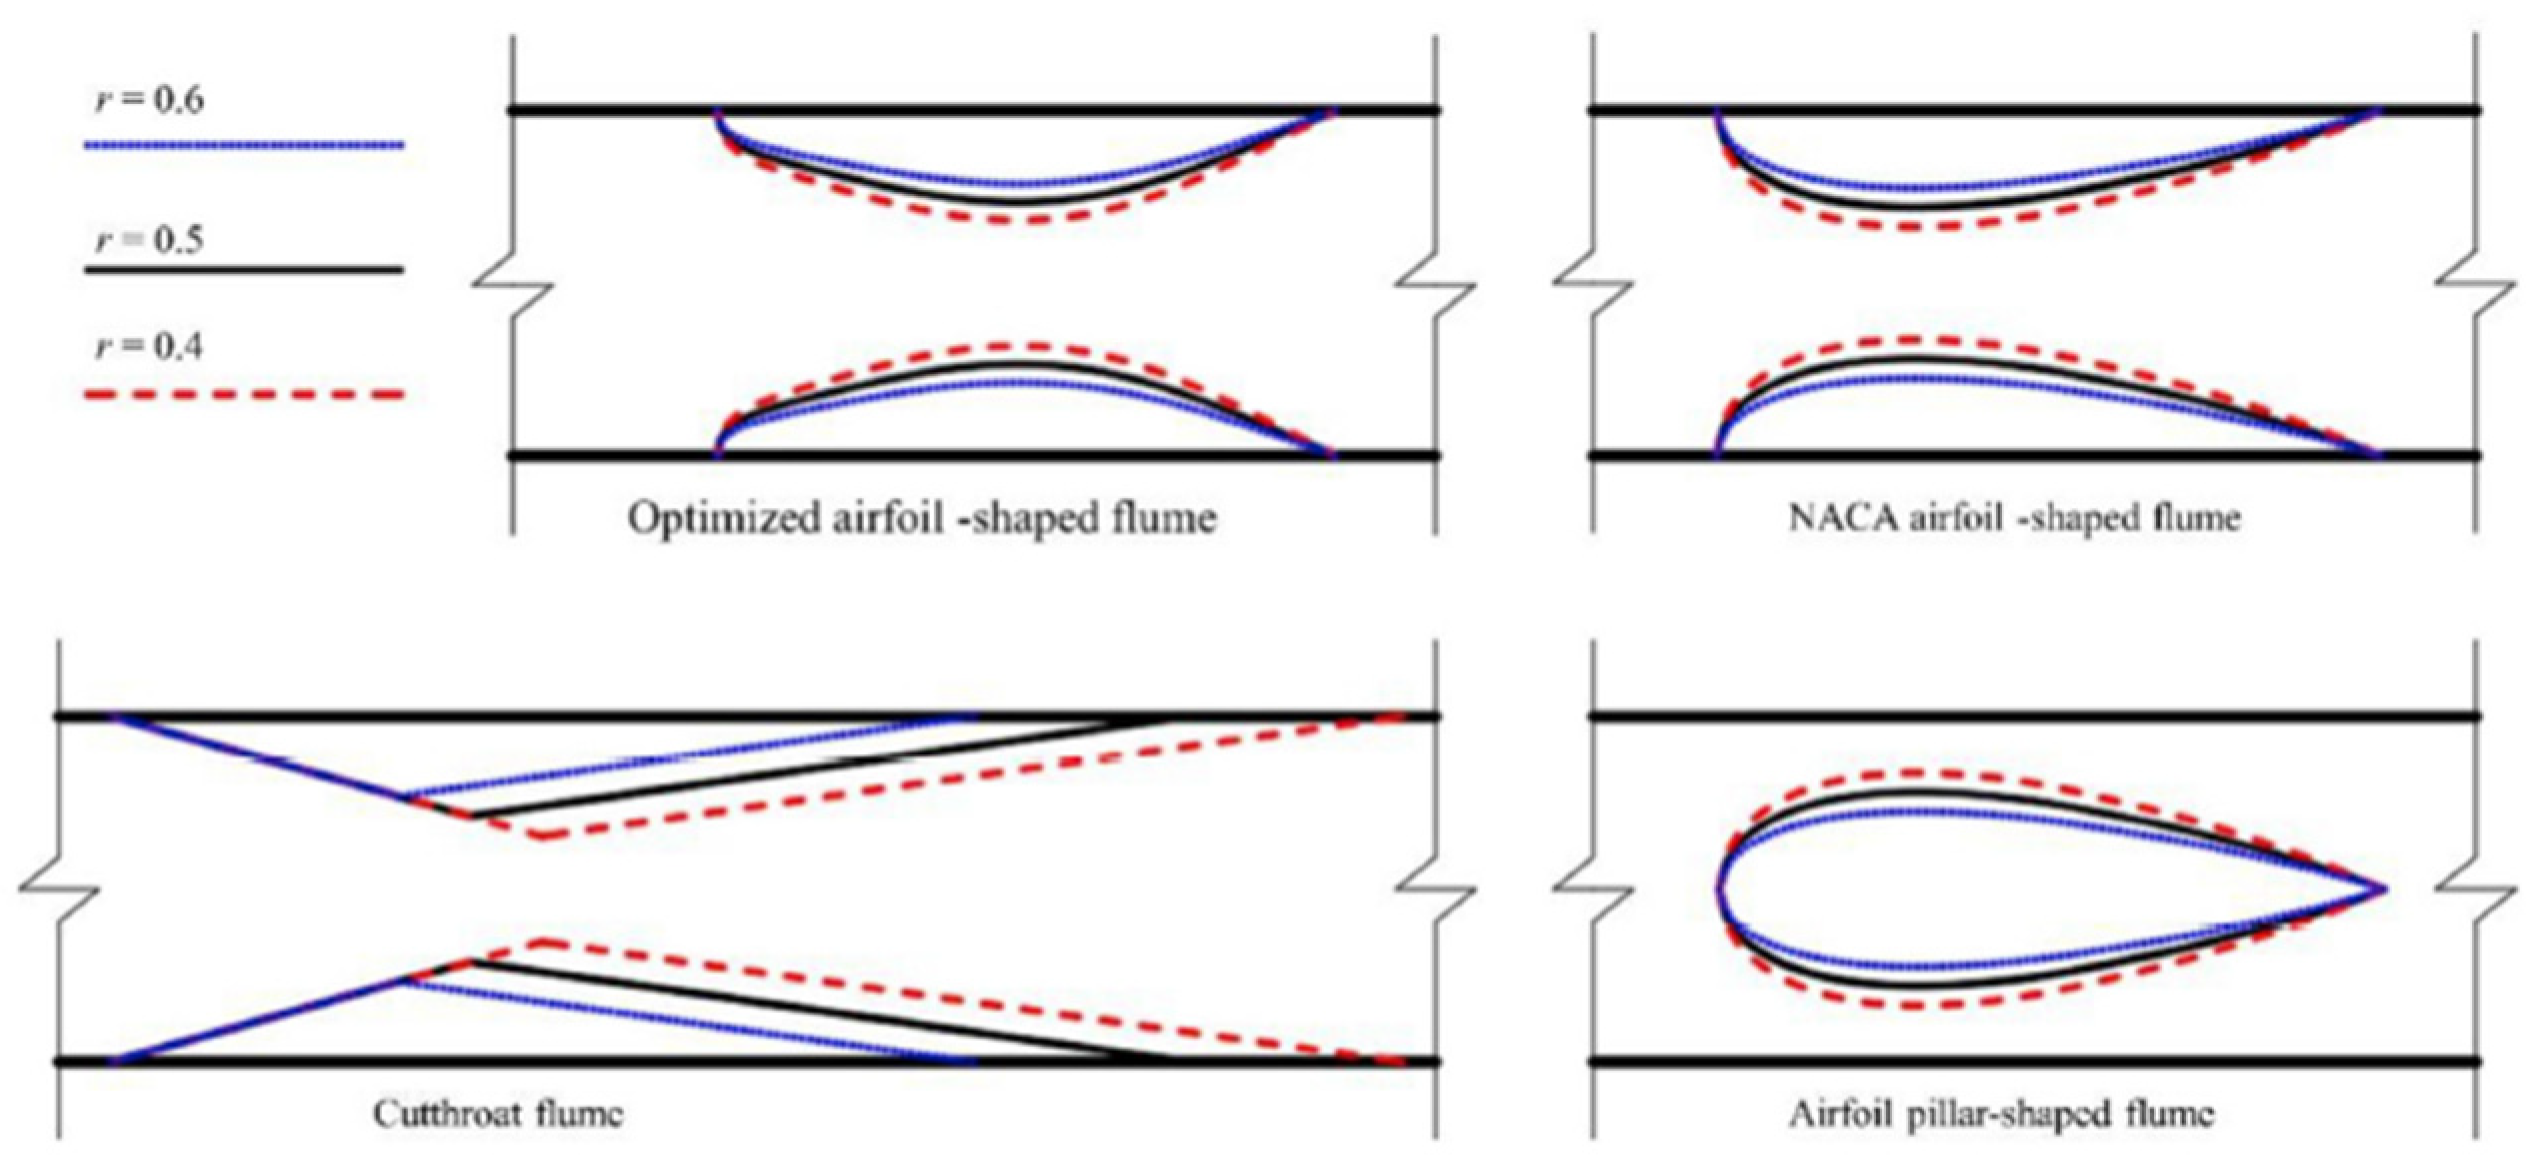
Figure 10 illustrates different setups on different types of flumes. The formula to evaluate the discharge was obtained through this correlation. To avoid the effect of flow fluctuations on the water level readings, the flumes were placed 3 m downstream in the 12 m long rectangular channel in the laboratory. The comparison was carried out across the flume’s centerline for the discharge, and a few different constrains were used, such as: Froude number and water depth upstream, critical submergence degree, and velocity gradient, along with the head loss. In the critical state, the ratio of the water depth from downstream to upstream was considered as the critical submergence degree. The authors stated that in sewer monitoring systems and irrigation systems in agriculture, the lowest head loss and backwater were expected, while an acceptable large value of critical submergence degree is required.
Satisfactory results of the comparison of all four flume designs were reported.
Figure 11 illustrates the basic schematic of the flumes used in this study. The head loss in the cutthroat flume was found to be the smallest while an error of 3.17% was recorded in the flume’s discharge comparison. Overall, the variance in the simulation and experimental discharge values in all four flumes did not exceed 5%, which satisfied the discharge measurement requirements. It was concluded that with the simulation setup mentioned earlier, the comparison of experimental results and the numerical data showed that a 10% error was unavoidable. It was mentioned that more numerical studies can lead to the achievement of better flume shape designs.
A study on the numerical modeling of a Montana flume, a Parshall flume with no divergent section, under submerged flow condition, was undertaken by Ref. [
24] to calibrate and evaluate the accuracy of the flume. The motivation behind this research was the fact that numerous Montana flumes during several field visits were observed to have submerged flow condition while no adjustment is available for them. Based on the experiments carried out, the Montana flume under free flow condition provided very similar results to the Parshall flume in the same size class. However, when submerged condition is introduced, a discharge underestimation of up to 15% in the submerged-flow equation of Parshall flume was observed. Moreover, a discharge overestimation of 56% occurred when the free-flow equation of the Parshall flume was implemented. Therefore, an independent process to adjust the biased flow rate during submerged flow condition was illustrated by comparison between physical and numerical data on a 6-in Montana flume. Next, the method of calibration of the numerical model based on the physical data was extended to nine other Montana flumes with sizes of up to 8 ft under the same submerged flow condition.
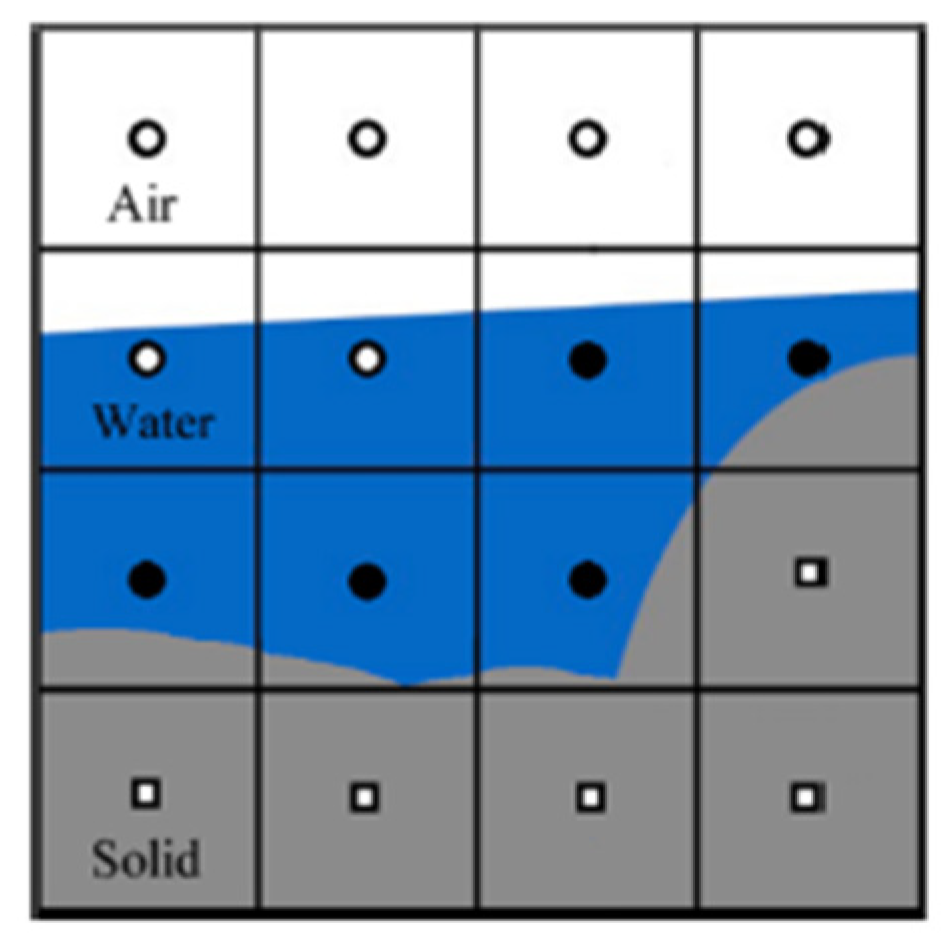
The CFD model used in this study was FLOW-3D, while the turbulence model used was RNG due to its reputation for for accuracy when defining the flows that have strong shear regions and low-intensity turbulent flow. For submerged flow condition of the Montana flume, the model reached steady state after 27 s, while it was mentioned that most simulations required only 15 s. To indicate different areas, i.e., water, air, or solid in the model, the VOF (Volume of Fluid) and Fractional Area Volume Obstacle Representation (FAVOR) methods were used. Additionally, a no-slip condition was used for the wall shear boundaries.
Since Parshall flumes cause a drop in water head, Ref. [
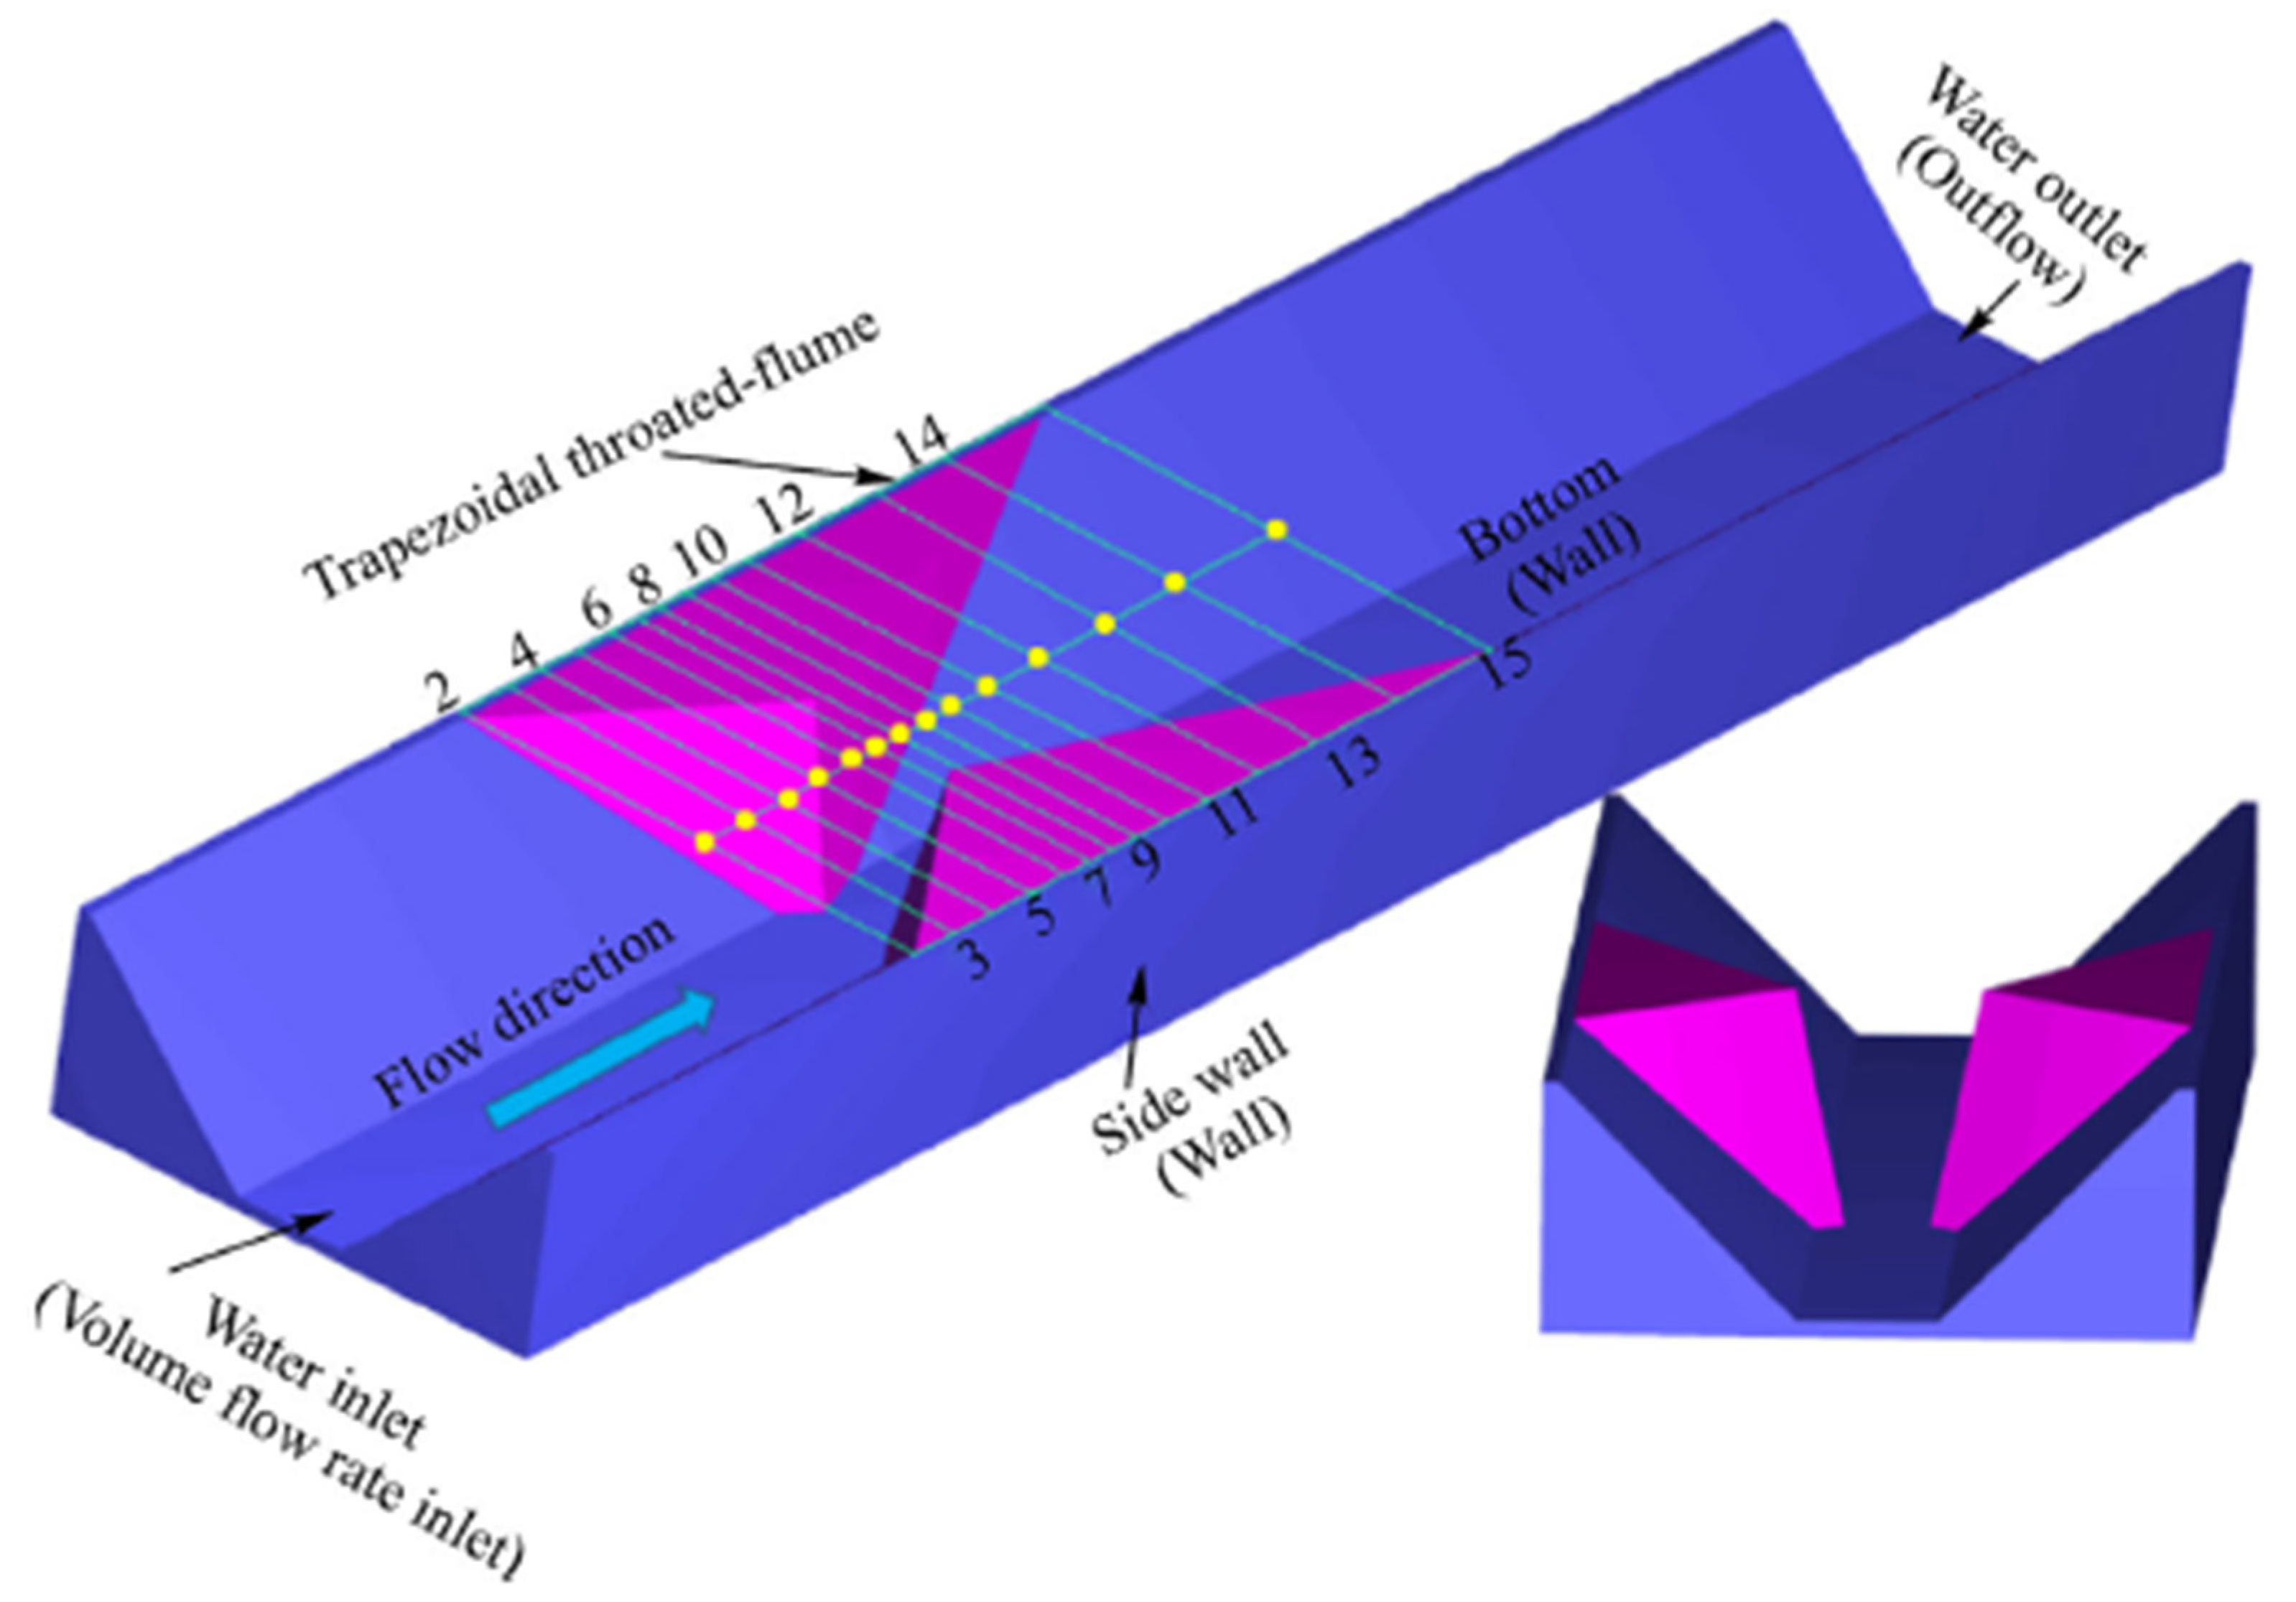
25] proposed a new flume design. The flume, with no throat section, was to be installed in trapezoidal channels that were widely used in China for irrigation channels for agricultural purposes.
Figure 12 provides the schematic of the proposed flume. To determine the efficiency of the new cutthroat flume, FLOW-3D software was implemented as the CFD simulation tool using the RNG
turbulence model. The method used to distinguish water from air at the surface of the flow was the TruVOF technique, while the mesh was generated using the Fractional Area Volume Obstacle Representation (FAVOR) method to define the rigid boundaries. Different flowrates of up to 75 L/s were applied in the simulation model in order to evaluate the hydraulic performance of the newly designed flume. To compare the simulated CFD result, physical experiments were carried out on the same size and condition of the cutthroat flumes defined in CFD. Acceptable errors of less than 10% were reported when the observed time-averaged flow rate and simulated flow velocity gradient were compared. It was also noted that the velocity near the walls was lower than the flow velocity at the center of the flume.
Increase and decrease were indicated in the results of averaged longitudinal flow velocity and Froud number, respectively, over convergence and divergence sections. As an example, a Froud number of less than 0.5 was calculated just before the throat congestion section. The objective of the study was achieved when the results indicated that only 9% of the total head was recorded as being lost. The cutthroat flume worked significantly better when the cross-section of the channel was trapezoidal compared to rectangular. In accordance with the relationship between discharge and upstream depth, a regression model was developed. Under various working situations, the regression model showed satisfactory results with up to 2.06% error, which was considered to be an acceptable relative value.
In conclusion, the authors strongly recommended the use of a trapezoidal cutthroat flume in order to improve the accuracy of the discharge measurement, while no significant flow head loss was expected to occur.
A study by Ref. [
26] explored the application of numerical modeling in a Parshall flume to determine the appropriate size of the flume for different applications. The aim of this study was to use numerical simulation (FLOW-3D) to determine the efficiency of the empirical equation provided by the International Standard Organization (ISO) (ISO9826) for the Parshall flumes with low standard grades. The water level at the upstream and downstream ends were measured during the experimental phase.
The width of the water channel used for the experiment was 0.8 m while Parshall flumes with the throat section sizes of 0.3 and 0.152 m were placed into it. The entrance values of the convergence section were reported as 0.64 and 0.4 m, respectively, while 0.5 and 0.39 m were the widths of the downstream side of the divergence section, respectively. Unique boundary conditions at upstream and downstream ends of the flume with respect to the experimental setup were defined as well for the numerical simulation. The measurement of the flowrate was carried out using a triangular weir that was installed upstream.
The comparison between experimental and numerical simulation results revealed that the error was less than 4%. A new empirical model for flow was proposed using numerical simulation results. The calibration of the new model using the measured flowrate exhibited an error of up to 2.3%. It was concluded that the low error value proved that the proposed model can be used to determine the proper size of a Parshall flume.
Ref. [
27] investigated the use of a cutthroat flume to measure the discharge of the supercritical flow. In order to construct a suitable relationship, various physical experiments were done on the cutthroat flume to provide adequate amounts of data for regression analysis. Compared to the Venturi flume and Parshall flume, the application of a cutthroat flume was mentioned as being more popular in measuring the flow in open channels. This is due to the simplicity of its geometry; hence it is cost effective to construct this specific type of flume for supercritical flow. The proposed relationship between water head (
) and flow (
) was developed based on regression analysis and it was demonstrated to perform well. It could be implemented in any cutthroat flume with the same specifications and still provide high quality results. In the experimental laboratory, a flume with square cross-section having dimensions of 0.6 m depth, 0.6 m width, and 21 m length was used to house a cutthroat flume with throat size of 0.34 m. The width of the converging and diverging sections was 0.58 and 0.36 m, respectively. To achieve supercritical flow and avoid any effect of the water turbulence on the cutthroat flume, the flume was placed 13.65 m downstream of the 21 m channel with the same slope of 1.05% for all the experiments.
It was concluded by the authors that if the supercritical flow formed at the throat section, the application of the cutthroat flume as a tool to measure the supercritical flow discharge was satisfactory. Therefore, it was deemed unnecessary to convert the flow type from supercritical to subcritical while measuring the discharge. With respect to the location where the supercritical flow formed within the flume, i.e., at the throat section or downstream of that section, two different relationships were proposed.
Ref. [
28] performed extensive research on long-throated flume designs to increase flow measurement efficiency by implementing a software program. The application of a long-throated flume, due to its significant reduction of head-loss and low cost of fabrication, was proposed as an alternative solution for implementing various kinds of flumes with contraction sections. This revealed potential capabilities in measuring different flow types more economically and flexibly.
The calibration was done using computer software in order to eliminate the need for laboratory experiments. The possibility of creating non-modular flow in the flume where the ratio of the width to length of crest is relatively great introduced discrepancies between the numerical and experimental data. Additionally, the generated suction effect at the end of the throat section that was observed during experiments affected the reading of that section, and this could easily influence the accuracy of the results provided by the rating equation for numerical and experimental results.
The proposed designs were calibrated to achieve the maximum accuracy. To achieve full potential of the flume, two essential parameters in each design were required, i.e., (1) providing enough freeboard, and (2) maintaining the Froude number in the approach channel as low as possible to guarantee a turbulent flow in the throat section.
In order to produce a successful long-throated design with width-contraction, FLOW3D was used by the US Bureau of Reclamation to simulate 4- and 2-ft modified Parshall flumes. Various flowrates were used in simulations to provide the rating curve that well described the relation between head and discharge in the long-throated flume. The comparison of the results from CFD and WinFlume software on an 8-ft Parshall flume revealed an acceptable error variation of less than 2%.
The authors also eliminated two common issues in the implementation of long-throated flumes. They recommended that adding a ramp at the control section could rectify the suction effect challenges, and that keeping the length to width ratio of the crest to 2:1 or higher can minimize the other obstacles to using the long-throated flume as an accurate measuring device.
Ref. [
29] used the CFD approach to find a suitable contraction design on the flume to accurately calibrate the Acoustic Doppler velocity meters (ADVMs). The purpose of this research was to find the linear relationship between average velocity of the contraction’s cross section and the sample velocity measured by the upward-facing ADVM. Accuracy improvement of the ADVM with elimination of the in-situ calibration was part of the objective as well. While the contraction section was removed from the flume, the flow was measured to calibrate the CFD software. The contraction section was responsible for creating the Rapidly Varied Flow (RVF), known as a non-uniform type of flow in the open channel that forces a rapid depth change over a small section of the flume.
The flume was 1.215 m in width and depth while having 86 m length with a 0.2% bed slope. The section occupied for this experiment as the testing region was 54 m in total length. It was capable of handling a maximum flowrate of 0.86 . FLOW-3D was implemented as CFD software to provide the appropriate design for channel contraction. Three different contraction setups were proposed and tested, using CFD to find the most appropriate design.
The surface roughness of the whole length of the channel was calibrated by comparing the velocity from the experimental test on 36 cross-sections against the numerical results corresponding to the same locations of the cross-sections. The roughness value () was iteratively set to achieve the minimum error in the comparison. This value was the exact value for the roughness of the steel’s painted surface of the current flume used in this experiment. The results revealed that the Coefficient of Variation of the Root Mean Squared Error (CVRMSE) values for similar scenarios varied from 4 to 8%. It was concluded that the lack of CFD’s ability due to the limitations of computer resources was one of the reasons for inadequate performance. The other reason was the existence of measurement errors known as the measuring device error.
Ref. [
30] conducted a study to estimate the applicability of Parshall flumes (PF) and modified Parshall flumes (MPF) in determining the oxygenation rate of surface water. In this study, the usefulness of three different modeling techniques—artificial neural network (ANN), fuzzy logic (FL), and adaptive neurofuzzy inference system (ANFIS)—were examined.
The researchers used a dataset of 50 experiments. According to the results they obtained, the ANN model was found as suitable to predict the oxygen transfer efficiency E20 in PF and MPF. The ANN model also provided better predictive performance than the FL and ANFIS models. They also reported that the Gaussian membership function-based (MF) models had better results than the gbell MF-based models. According to the results of the sensitivity analysis, they suggested that q and K play important roles in estimating the oxygenation rate.
Table 1 provides a summary of the papers using numerical method.
4.2. Experimental Studies
The application of a small Parshall flume to measure supercritical flow was investigated by Ref. [
31]. Experiments with multiple configurations, i.e., 15 different setups, were performed for 82 test conditions to study the accuracy of the results of two different sizes of Parshall flumes, i.e., 6- and 9-in. In order to modify the flume’s relationship, alterations in various parameters such as approach channel slope, roughness, and flume convergence were considered. To provide conditions for 82 experiments, various slopes ranging from 4 to 7% were incorporated, with different flowrates from 0.028 to 0.112
for two different flume sizes along with changes in other parameters of the flow.
While the flow was maintained in unsubmerged condition, the accuracy of the flumes to measure the supercritical and subcritical flows was determined to be ±5%. The relationship used to measure the flow in the flume was enhanced to incorporate various parameters such as channel slope, roughness, and the condition of the convergence section. To determine supercritical flow, an equation was proposed. Additionally, in order to distinguish properly between different regimes of flow, a Froude ratio indicator was established.
The developed relationship was applicable only to Parshall flumes with throat width sizes of 12-in or smaller while flume slopes of up to 7% were considered in the process of collecting experimental data; hence, it is not recommended to use the equation for larger gradients. The Parshall flume was located 12.2 m downstream in a 0.61 m wide, 18.3 m long channel with adjustable bed slope. The condition of the approach flow was determined by various parameters within the upstream section of the flume such as roughness. Overall, 13 cross-sections were chosen to record the water surface elevation.
The authors concluded that it was not possible at that time to come up with one single relationship for both flow regimes, i.e., supercritical and subcritical; instead, for each flow type, different equations were developed. In addition, it was important to carefully observe the condition of the hydraulic flow at the beginning and/or the end of the converging section. As an example, based on the observations during the experiments, the hydraulic flow condition could affect the creation of the hydraulic jump further downstream of the Parshall flume while the same configuration was followed.
In a study by Ref. [
12], the performance of a modified 3-inch Parshall flume was investigated in relation to the process of flow aeration. The lack of highly turbulent flow in rivers and man-made channels causes a reduction in Dissolved Oxygen (DO) ratios. The introduction of hydraulic structures such as throated flumes, cascades, and weirs has been proposed as a solution to this problem in channels and rivers. In the experimental setup used by Ref. [
12], deoxygenation took place chemically in a storage tank at the beginning of the system. The DO was measured upon entrance and exit of the flume in order to record the increase in DO after the flow passed through the flume.
Flumes were installed in a rectangular channel with dimensions of 0.4 m in width and 0.6 m in height with the length of 5 m. Fluid with various flow rates, i.e., 10, 20, 30, and 40 L/s, were set to pass through 27 modified Parshall flumes. With respect to flow in critical regions of the flume, eight locations were selected to collect the water level data using a mobile digital point gauge. The shape variation of the Venturi flumes was specified based on the size of their throat width, throat length and the sill height. The results of water surface level and DO were recorded in the study for a total number of 108 physical experiments.
It was concluded that in channels having low or zero gradient, the implementation of Parshall flumes or any type of throated flume capable of introducing turbulence to the flow was recommended by the author. The presence of hydraulic jump that was caused by the flume geometry design was one of the key elements in the DO increment process.
Ref. [
32] used a 5-ft full-scale Parshall flume to determine an accurate relationship to estimate discharge of supercritical flow. The objective of the study was to evaluate if Parshall flumes with various sizes greater than 12-in could be sufficiently calibrated to determine the flowrate of supercritical flows. Across 11 different experiments, i.e., 3 subcritical and 8 supercritical, the discharge range was set between 3.07 and 30.15 cfs, and the variation in Froud number was recorded as between 0.67 and 1.31. A comparison of the experimental data with the results of the current equation used for subcritical and supercritical flows led to the development of a new rating relationship that was applied for only supercritical flows in large Parshall flumes.
In the experimental setup, the Parshall flume was placed downstream of a 17.1 m length channel with the width of 4.88 m and a slope of 4.38%. The water level and velocity were measured at three points on the center line of the flume, in addition to 16 different cross-sections that were located in the upstream channel.
The rating equation provided acceptable results when used for Parshall flumes with sizes similar to the one chosen in this study. It was mentioned that unsubmerged free-flow condition was considered during all experiments. It was concluded that accurate flow measurement with various sizes of Parshall flumes, i.e., up to 5-ft, for different types of flow, especially supercritical flow, was possible with only 4.52% error. It was also recommended to perform physical tests on different sizes of Parshall flumes, i.e., 9-in and greater up to 5-ft, to validate the derived relationship for supercritical flow.
Ref. [
33] worked on the determination of uncertainty in flow rate measurement with Parshall channels. They used the Monte Carlo Method (MCM). The researchers presented the main uncertainties and explained the mathematical models and parameters. They reported the measurement uncertainty components with the help of MCM simulations.
In their study, the input sizes and the uncertainties of the measured flow rate were evaluated separately. Regarding the measurement uncertainty, they considered the following parameters: reference equipment calibration; repeatability; resolution of both the reference equipment and the equipment installed in the calibrated system; zero setting; linearity of scale; aging deviations and bias; vertical angular deviations (longitudinal and transverse); air temperature compensation (correction applied to the speed of sound); pressure and vapor pressure in the air; echo interference (noise interference); surface irregularity (due to unstable flow conditions); fluid properties (viscosity, density, non-Newtonian behavior; etc.); sub-surface thin layers of sediment; and stability of the installation (influence of wind and other sources of vibration).
The researchers showed that the common use of fixed model parameters underestimates the uncertainty of measurement, ranging from 8 to 12%, depending on the correlation effect.
Ref. [
34] produced different sizes of Parshall flumes with different throat widths and tested them in the laboratory under free flow conditions. They determined the discharge coefficient and exponent and developed a single equation for different channel sizes.
The researchers tested four different sizes of Parshall flumes with throat widths of 0.052, 0.076, 0.152, and 0.229 cm in an open channel measuring 9.45 × 0.60 × 0.55 m. They measured upstream heads and velocities in the experiments.
According to the results of their experiments for flow rates ranging from 0.004 to 0.138 m3/s, they proposed a new empirical formula that provides the depth–discharge relationship. They reported that this equation is suitable for simple and small Parshall Flumes under free flow conditions. In their paper, four different sizes of Parshall flumes, having different throat widths were fabricated and tested in the laboratory under free-flow condition. The coefficient of discharge and exponent were determined and a single equation for the different flume sizes was developed. The relationship is simple and suitable to use for small Parshall Flumes.
Ref. [
35] performed a study to accurately estimate the flow rate of a low flow season in Korea. They used a Parshall Flume and reviewed its applicability. In their study, they installed a Parshall Flume in an actual river and measured the flow rate obtained from the flow rate formula and velocity measurements, which were stated to be very accurate when compared to the flow rate computation results. They estimated the flow rate and compared it with the actual flow rate of the Parshall Flume.
They mentioned that in comparison with the directly measured flow rate as measured by flow velocity, the flow rate measured by the Parshall Flume possessed higher accuracy. The researchers reported that the flow rate formula based on the state discharge rating curve equation results showed an error of approximately 14%. They also stated that the usage of calculation by the state discharge rating curve equation at low flow rates leads to a greater error than the Parshall Flume, and in order to calculate the accurate low flow rate, the flow rate measured by the Parshall Flume should be preferred.
As a result, the authors concluded that the flow rate measured by the Parshall Flume had a very high accuracy and reliability.
Ref. [
36] studied the Parshall flume and the Montana flume, which have the same calibration procedures under normal free-flow conditions, and tested their calibrations under submerged flows.
They conducted the tests at the Utah Water Research Laboratory on an acrylic 15.2 cm (6-in) flume. The researchers stated that the standard Parshall flume rating curve overpredicted flow rates in the submerged Montana flume by up to 48%. They also stated that Parshall submergence corrections were applied to the submerged Montana flume, and flow rates were under predicted by up to 19%. The study developed submerged flow rate correction factors specifically for a Montana flume, and the paper also demonstrated how to apply the corrections.
Ref. [
37] aimed to determine the limits of application of traditional critical flow theory in the study of Venturi flumes. The researchers conducted this study to account for the influence of the slope and curvature of streamlines on the head–discharge relationship in Venturi weirs with short throats, and to evaluate the discharge coefficient as a function of the radius of curvature of the upstream energy, throat length, throat width, and inlet arc constriction. They proposed an empirical equation. As a result of the study, they reported that this empirical equation is valid up to a deviation of 8% compared to the traditional approach and can be used in engineering applications.
Table 2 provides a basic summary of the experimental studies.


