Article

Wetland Vulnerability Metrics as a Rapid Indicator in Identifying Nature-Based Solutions to Mitigate Coastal Flooding

by
Narcisa Gabriela Pricope
1,* and
Greer Shivers
1,2
1
Department of Earth and Ocean Sciences, University of North Carolina Wilmington, 601 S College Rd., Wilmington, NC 28403, USA
2
Wilmington Urban Area Metropolitan Planning Organization (WMPO), City of Wilmington, 305 Chestnut Street, Wilmington, NC 28401, USA
*
Author to whom correspondence should be addressed.
Hydrology 2022, 9(12), 218; https://doi.org/10.3390/hydrology9120218
Submission received: 27 October 2022 / Revised: 29 November 2022 / Accepted: 29 November 2022 / Published: 2 December 2022
(This article belongs to the Special Issue Modern Developments in Flood Modelling)

Abstract

:
Flood mitigation in low-gradient, tidally-influenced, and rapidly urbanizing coastal locations remains a priority across a range of stakeholders and communities. Wetland ecosystems act as a natural flood buffer for coastal storms and sea level rise (SLR) while simultaneously providing invaluable benefits to urban dwellers. Assessing the vulnerability of wetlands to flood exposure under different SLR scenarios and vegetation responses to climatic variability over time allows for management actions, such as nature-based solutions, to be implemented to preserve wetland ecosystems and the services they provide. Nature-based solutions (NBSs) are a type of green infrastructure that can contribute to flood mitigation through the management and restoration of the ecosystems that provide socio-environmental benefits. However, identifying the flood mitigation potential provided by wetlands and the suitability for NBS implementation depends on the ecological condition and environmental exposure. We propose that wetland vulnerability assessments can be used as a rapid method to quantify changes in ecosystem dynamics and flood exposure and to prioritize potential locations of NBSs implementation. We quantified exposure risk using 100- and 500-year special flood hazard areas, 1–10 ft of sea level rise scenarios, and high-tide flooding and sensitivity using timeseries analyses of Landsat 8-derived multispectral indices as proxies for wetland conditions at subwatershed scales. We posit that wetland areas that are both highly vulnerable to recurrent flooding and degrading over time would make good candidate locations for NBS prioritization, especially when they co-occur on or adjacently to government-owned parcels. In collaboration with local governmental agencies responsible for flood mitigation in the coastal sub-watersheds of the City of New Bern and New Hanover County, North Carolina, we conducted field verification campaigns and leveraged local expert knowledge to identify optimal NBS priority areas. Our results identified several government-owned parcels containing highly vulnerable wetland areas that can be ranked and prioritized for potential NBS implementation. Depending on the biophysical characteristics of the area, NBS candidate wetland types include brackish and freshwater marshes and riverine swamp forests, even though the predominant wetland types by area are managed loblolly pinelands. This study underscores the critical importance of conserving or restoring marshes and swamp forests and provides a transferable framework for conducting scale-invariant assessments of coastal wetland condition and flood exposure as a rapid method of identifying potential priority areas for nature-based solutions to mitigate coastal flooding.

1. Introduction

Wetlands are essential ecosystems that provide value and services to society such as flood mitigation, pollutant sequestration, and valuable natural habitat areas [1,2,3]. Wetland ecosystems are widely responsible for the purification and infiltration of excess stormwater in rapidly urbanizing communities, resulting in decreases in permeable surface cover. A wetland that is 1 acre in size can store approximately one million gallons of water when in functional condition [4]. Wetland water storage capacity along with the slowed velocity of floodwaters moving through wetlands can lower flood amplitudes and reduce the potential for destruction caused by a flooding event [4]. Watersheds located in the temperate climate zone require at least 3–7% wetland land cover to provide adequate flood mitigation and suitable water quality to surrounding built and natural communities [2]. In 2011, the global monetary value of coastal wetland ecosystem services was estimated to be worth $20.4 trillion per year or 43.1% of global ecosystem service value per year despite accounting for roughly 15% of all natural wetlands [5]. While coastal wetlands may make up a small portion of globally distributed wetland types, the value and services that they provide society are far too great to be lost.
Natural ecosystems such as wetlands are subject to natural and anthropogenic pressures, including climate change, that increase vulnerability to natural hazards and result in decreased ecosystem resilience [6,7]. Vulnerability refers to the degree that a system is at risk to or unable to cope with impacts brought forth by climate change or other environmental stressors and is composed of exposure, sensitivity and adaptive capacity [7,8]. Resilience refers to a system’s ability to rebound following a disturbance, such as a natural hazard, or cope with changes fueled by an altering global climate [9]. When occurring in tandem, natural and anthropogenic pressures on wetlands can lead to poor management practices, conversion to other land uses, or wholesale ecosystem destruction [10,11,12]. The marginal value of wetlands and the services they provide increase as populations increase, to a point, and then degrades to the point that ecosystem services including flood and pollution mitigation abilities are diminished or lost [2]. Decreases in wetland areas and their ecosystem service capacities increase risk to surrounding areas due to a decreased ability for wetlands to capture, store, and slow down inundation following a flood event. Identifying wetland areas that are experiencing decreases in vegetative health metrics and increases in flood risk is beneficial in determining possible management interventions to sustain ecosystem services in rapidly urbanizing coastal communities [10,11,13]. Geospatial technologies allow for the collection, inventory, and analysis of wetland vulnerability related to natural hazard and ecosystem-based data by entities seeking to assess a wetland’s ability to perform ecosystem services [1,10,13]. Coastal communities frequently affected by natural hazards, such as hurricanes or storms, are at risk from extensive flooding and related infrastructure damage with long-term detrimental effects on the natural and built environments, as well as human livelihoods and life losses. The USA Atlantic coastal region experiences multiple types of flooding due to the presence of the Atlantic Ocean, rivers, and natural hazards that can frequently lead to compound flood risks and, as such, compound flooding needs that must be considered when devising management solutions to mitigate flood risk to coastal communities.
Typically, flood mitigation is managed by gray infrastructure solutions and more recently green infrastructure solutions. Gray infrastructure practices refer to traditional approaches to water management and natural hazards mitigation through human-engineered solutions, such as digging drainage ditches, creating concrete stormwater systems, and utilizing hardened structures like seawalls to protect coastlines [14,15]. Green infrastructure practices refer to hybridized infrastructure systems that improve societal and ecosystem resiliency to natural hazards concurrently by relying on natural ecosystems to address flooding. Stormwater wetlands, rain gardens, and permeable pavement are examples of the types of green infrastructure solutions being increasingly implemented in urban areas [14]. A subset of green infrastructure, nature-based solutions (NBSs), are management actions that require the use of ecosystems and their services to address societal issues, such as climate change impacts or flood mitigation and abatement [16]. Wetlands as a nature-based solution are highly effective at providing areas for water regulation while also providing recreation opportunities and thus present an optimal solution to flood mitigation in urban areas [17]. Prioritizing wetland ecosystems for restoration to aid in natural hazard reduction requires knowledge of what locations reduce exposure to flooding from natural hazards and future sea levels and protect vulnerable communities and infrastructure [18,19]. Necessary restoration steps can be taken to decrease the severity of flood damage by preserving landscapes proven to mitigate flood waters and implementing NBSs that promote healthy wetlands by identifying degraded wetlands based on site-specific metrics. Yet, for the introduction of NBSs to be a successful approach at mitigating flood inundation in at-risk wetland ecosystems, the process must also be cost effective in order to garner support from the implementing parties [20,21]. We posit that by assessing the vulnerability level of wetlands to increased flooding and as a function of long-term vegetative health metrics, rapid assessments of potential NBS suitability can be undertaken.
Loss of wetland cover and vegetation can be accelerated by increased frequencies of inundation events fueled by natural hazards, sea level rises, or saltwater intrusion into freshwater systems [22]. Even small fractions of wetland loss caused by sea level rise require management interventions to reestablish and prevent further degradation and, in this context, NBSs have proven to be a cost-effective way to leverage degrading wetland areas to enhance coastal resilience [22]. However, conducting wetland vulnerability assessments in highly populated coastal communities with fragmented wetland cover remains a challenge, particularly when high-resolution site-specific data may not be available and the complexity of a localized geospatial assessment may go beyond the skill sets of local jurisdictions. To determine the applicability of NBSs on a localized scale, the ability to perform a vulnerability assessment with localized data must be addressed first so that determining suitability for NBSs is not overwhelming to accomplish. While the IPCC has laid the groundwork for definitions and an approach to undertake ecosystem vulnerability assessments [8], it would be shortsighted to imply that a single approach is the only available method to conduct a vulnerability assessment [23].
Coastal wetlands can be difficult to monitor with traditional methods that are largely comprised of collecting in situ data due to resource needs and the reduced accessibility of wetland landscapes [24]. Utilizing remote sensing and geospatial technologies to monitor wetlands can help overcome some burdens of access and resource needs due to the presence of publicly available data and the ability to collect data in areas that are not easily accessible with the use of uncrewed aerial vehicles (UAVs), crewed aerial vehicles, and satellite technology [24]. While remote sensing and GIS can help alleviate some of the hardships of collecting wetland data, oftentimes the spatial and temporal resolution of the imagery are inappropriate for the scales necessary to assess localized, fragmented wetland status. Yet, existing satellite and aerial vehicle-collected data can provide medium to high resolution geospatial data at temporal resolutions high enough to use for accurate analysis [24].
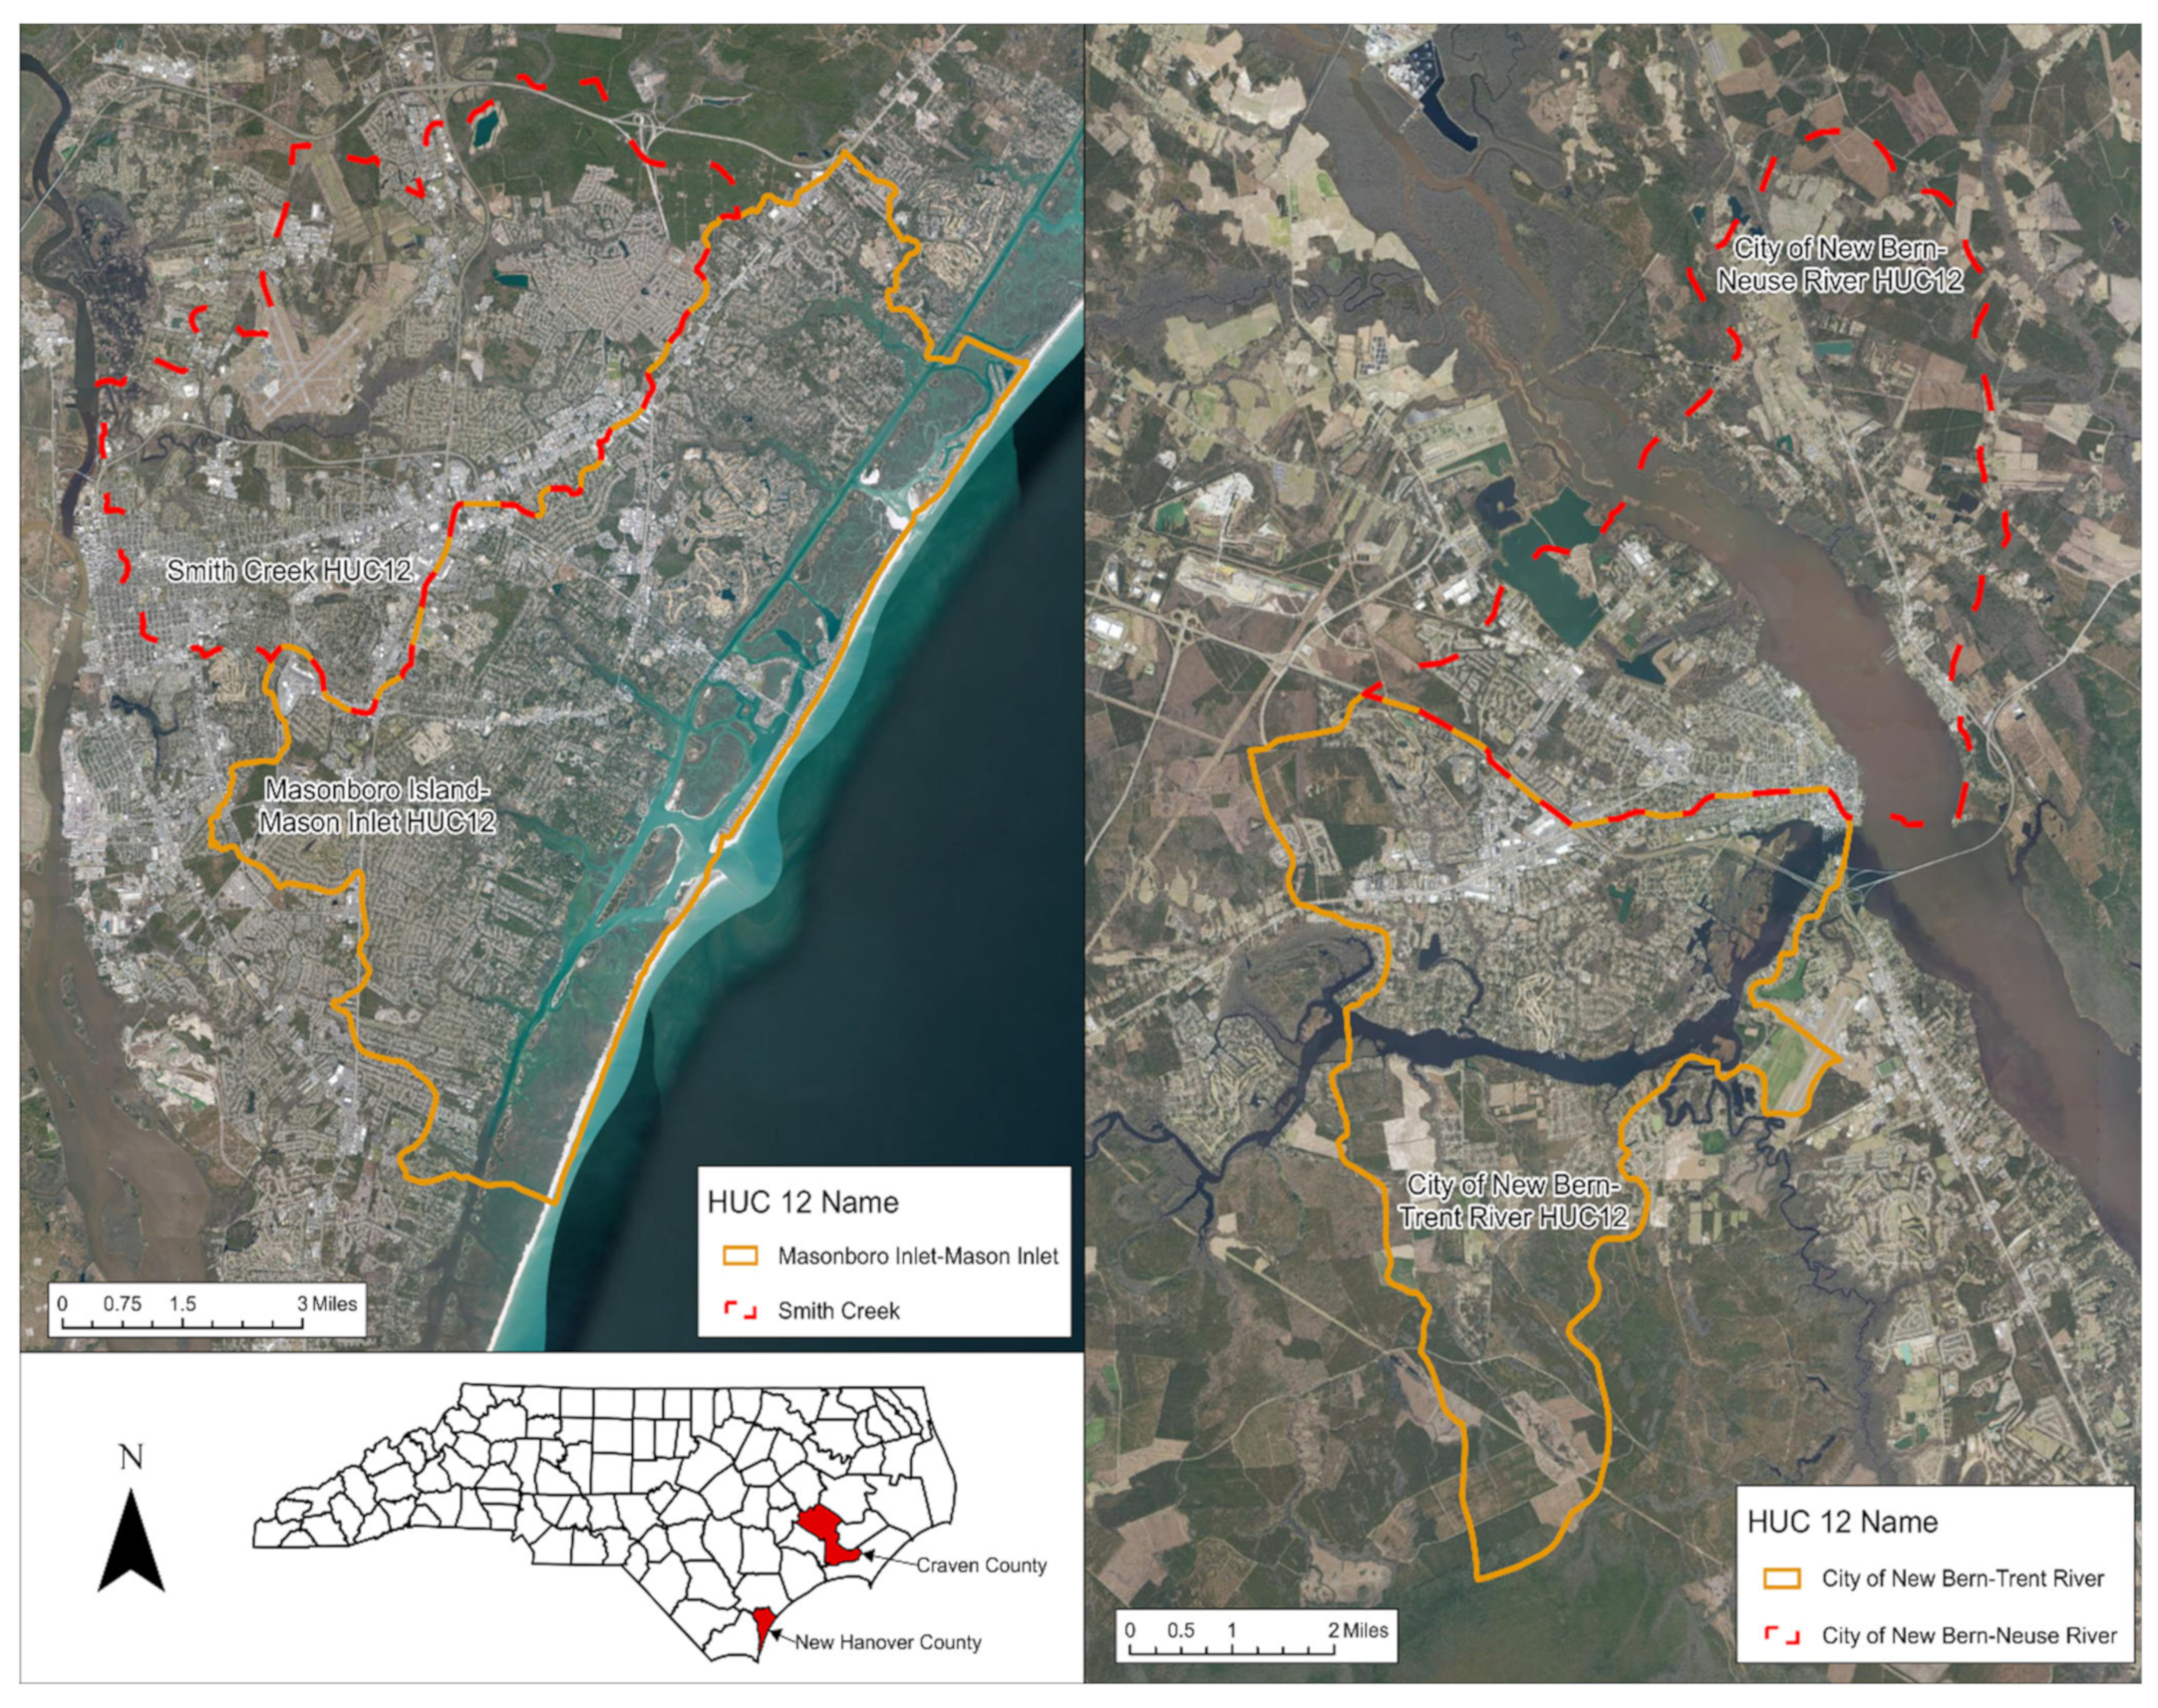
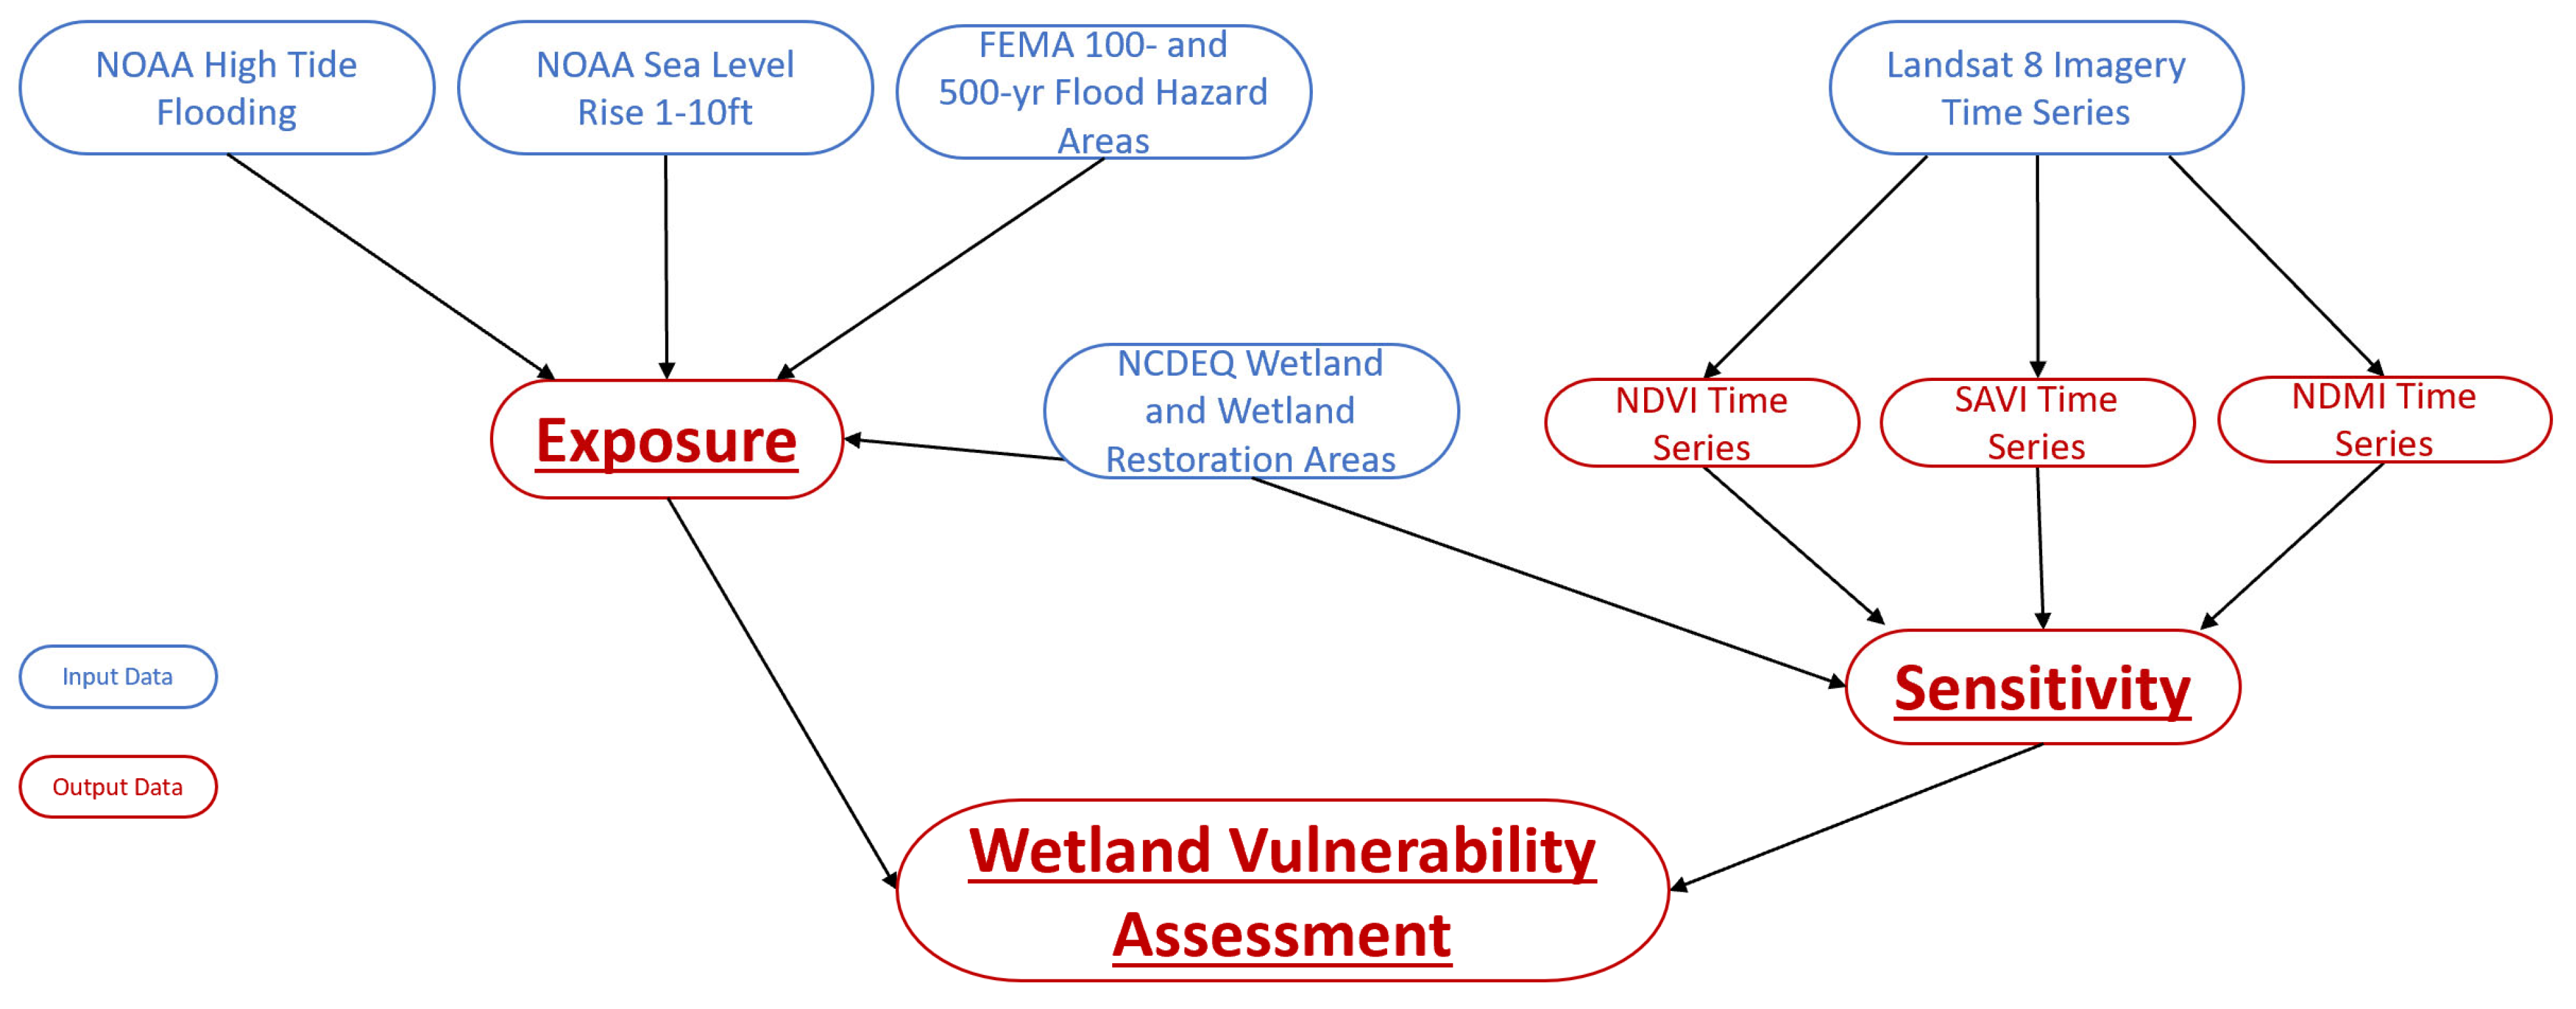
We rely solely on freely and publicly available geospatial data to demonstrate a rapid approach to identifying vulnerable wetland sites and determine wetland locations where NBS implementation can be used to support flood mitigation efforts across a gradient of watershed development in a coastal area. We analyzed wetland condition and wetland restoration areas in New Hanover and the City of New Bern, NC by: (1) computing flood exposure levels to coastal flood inundation, (2) undertaking a time series analysis of Landsat 8 multispectral data to determine trends in vegetation health metrics from 2014–2021 (wetland sensitivity), (3) creating a combined wetland vulnerability assessment composed of both exposure and sensitivity results, and (4) analyzing and prioritizing suitable parcels for NBS implementation centered around highly vulnerable wetland areas.

2. Materials and Methods

2.1. Study Areas

The climate of North Carolina (NC) is humid and subtropical, marked by cold winters and warm summers that bring forth large amounts of precipitation, with total annual precipitation amounts varying from 34.8 inches (2007) to 68.4 inches (2018), and moderate to high vulnerability to tropical storms. Coastal NC experiences a hurricane level storm roughly once every 3 years because of its location along the coast of the Atlantic Ocean in addition to smaller storms with damaging impacts stemming from winds, storm surge flooding, and heavy rainfall; rising sea levels have also contributed to increases in tidal flooding events that damage infrastructure by overwhelming the transportation and stormwater networks [25]. The low-lying topography of the coastal part of the state not only compounds flood vulnerability but also means that the region is characterized by expansive wetlands, such as managed loblolly pineland/upland forested wetlands (24.7% of all wetlands) or bottomland hardwood/riverine swamp forest (22.3%), composed primarily by flood-resistant species such as cypress, black gum, and red maple trees [26].
This research was designed in consultation with local government representatives in two NC municipalities at different stages of resilience and flood mitigation planning: the City of New Bern Development Services, where resilience measures to reduce flood impacts are well underway, and the New Hanover County (NHC) Office of Recovery and Resilience, where coordinated resilience planning is still in the early stages. We selected two HUC-12 subwatersheds in each of the two respective communities to conduct a wetland vulnerability analysis, engage repeatedly with relevant stakeholders, and create an NBS prioritization scheme. In New Hanover County, with input from NHC representatives, we selected the Smith Creek and Masonboro Island–Mason Inlet subwatersheds (Figure 1), which are both heavily populated, tidally-influenced urban watersheds characterized primarily by freshwater and salt/brackish marshes respectively that lacked any vulnerability assessment on exposure and sensitivity to natural hazards (Figures S1 and S2). For New Bern, we selected the City of New Bern–Trent River and City of New Bern–Neuse River (Figure 1), both urban, semi-tidally influenced watersheds characterized by the presence of primarily freshwater marsh and bottomland hardwood/riverine swamp forest mixed with managed pinelands located in Craven County (Figures S3 and S4). Both watersheds historically contain problematic areas for stormwater inundation and, hence, the City of New Bern, the NC Ecosystems Enhancement Program, and the NC Clean Water Management Trust Fund are currently working to create functional wetlands that can sequester floodwater inundation through NBSs in the Neuse River.

2.2. Data Sources

This research integrates existing publicly available geospatial data to create a wetland vulnerability assessment and determine exposure and sensitivity based on flood inundation scenarios and spectral indices that are used as proxies for vegetative health metrics. All data used in this study is summarized in Table 1 by source, data format, and location. The data is made available and described sequentially below in Section 2.3.
All data were projected to the North American Datum (NAD) 1983 StatePlane North Carolina Federal Information Processing Standards (FIPS) 3200 Feet and we used the most current North Carolina Department of Environmental Quality (NCDEQ) Wetlands GIS dataset as a location mask for this study since we focused on wetland areas specifically. Exposure and sensitivity results are shown only for locations deemed to be a wetland by this dataset. The sea level rise and Federal Emergency Management Agency (FEMA) special flood hazard areas in vector format were resampled to a common 30 m spatial resolution upon rasterization and inclusion into the final model.

2.3. Wetland Vulnerability Analysis

2.3.1. Flood Exposure

The data utilized to determine the exposure risk included 100- and 500-year FEMA flood zones, high-tide flooding, and sea level rise datasets provided by the National Oceanic and Atmospheric Administration (NOAA) (Table 1). The various exposure datasets provide potential flood inundation data that will present the overall flood risk of an area by examining multiple types and projections of flood hazards, not a single inundation circumstance. Utilizing FEMA flood zones to determine flood risk has the main drawback of not always accurately predicting every area that may experience flooding, but it is a nationally recognized dataset that influences government responses to flood events. While flooding can certainly occur outside of the typical 100- and 500-yr special flood hazard areas, locations in flood zones face a higher likelihood of recurrent flooding at the parcel levels. The NOAA high-tide flooding is the only feature already in raster format with a spatial resolution of 8.94 ft (2.72 m) for New Hanover County and 8.88 ft (2.70 m) for the City of New Bern. The 2 special flood hazard areas and 10 sea level rise scenarios, 1 through 10 ft, were rasterized to the same spatial resolution and coordinate system as the high-tide flooding layer for optimal overlay of raster cells and accuracy. Lastly, the ArcGIS Pro Cell Statistic tool was used to create a sum overlay between the 13 exposure datasets (Figure 2). The final summed dataset was then categorized into three grouped categories using a quantile classification scheme, with values 1 through 4 grouped and reclassified into a new low exposure class (1), where (1) indicates low flood exposure, values 5–8 were reclassified as (2) and indicated medium exposure to flood inundation, and values 9–12 grouped and reclassified into a high flood exposure class (3) [23]. The final exposure results were extracted to only the areas of wetlands determined by the NCDEQ wetland and wetland restoration areas datasets.

2.3.2. Wetland Vegetation Sensitivity

Wetland sensitivity was determined by identifying trends in vegetation indices derived from moderate-resolution Landsat 8 multispectral data for every year with data available since 2014, with less than 10% cloud cover at peak vegetative productivity (June to September). Based on drought data published by the US Drought Monitor produced by the National Oceanic and Atmospheric Association, the United States Department of Agriculture, and the University of Nebraska–Lincoln, no conditions above abnormally dry were reported for the dates when the Landsat 8 data was collected aside from one instance of slight moderate drought around the 07/27/2019 collection date [27]. No hurricanes occurred directly before or on the date that any of the LS imagery was collected. We computed yearly spectral indices to identify the chlorophyll concentrations present in the vegetation and vegetation moisture content for wetland areas within our study sites. By including the results of commonly utilized spectral indices for each study site over multiple years into a change detection analysis, changes in vegetative productivity and the directionality changes in productivity are identifiable and can be integrated into future management practices aiming to protect wetland ecosystems and their services. We posit that wetlands that are experiencing a decrease in productivity or condition can be readily identified and possible management can be introduced to restore the vegetation in a given area if there is a significant trend over time. We used three indices: the Normalized Difference Vegetation Index (NDVI), a widely used index to determine vegetation chlorophyll concentrations as a measure of productivity and a plant’s ability to photosynthesize [28]. Secondly, we computed the Soil-Adjusted Vegetation Index (SAVI) because of its ability to measure chlorophyll present in live biomass while also mitigating the impacts of soil reflectivity [29]. Integration of SAVI in this coastal area is important because of the common presence of bare soil found in fluctuating tidal environments. Thirdly, we computed the Normalized Difference Moisture Index (NDMI) as a proxy for moisture in soils and vegetation and when monitoring vegetation disturbances [30,31]. Finally, we combined the three vegetation indices in the LandTrendr tool in ArcGIS Pro to compute changes over the time steps of Landsat data with a snapping date of 6/30 for the 12 time steps of imagery collected between 2014 and 2021 (Table S1). The LandTrendr output was a change analysis dataset that contains model coefficients that were then input into the Run Generate Trend Raster tool used to perform a Mann–Kendall significance test (Figure S5). We then utilized the z-score band to break the data into confidence intervals, creating three categorized values with 1 being increasing trends in vegetation index metrics, 2 being no trend, and 3 being decreasing trends.

2.3.3. Combined Wetland Vulnerability Assessment

Exposure and sensitivity results were combined and evaluated to determine where areas of high flood exposure and decreasing trends in vegetative condition overlap using the Weighted Sum tool whereby exposure was given a 55% weight while the sensitivity rasters will have a combined weight of 45% between the three indices (Figure 2). By having the exposure data at a slightly higher weight, areas of physical vulnerability to flooding will hold a slight dominance over decreases in vegetation health, which was deemed helpful when attempting to locate areas to implement flood-mitigating nature-based solutions [32,33]. Sekovski et al. (2020) determined the weights for their study by calling on experts in the environmental science field who were familiar with the localized processes of their study area to determine what extent each of their variables were contributing to coastal vulnerability. We then classified the results of the weighted sum analysis into low, medium, and high wetland vulnerability to inundation. Lastly, the highest risk areas were extracted to determine potential NBSs suitability relative to existing government-owned parcels under the assumption that areas characterized by a statistically significant decrease in vegetative health metrics between 2014–2021 and high exposure to flood risks are more susceptible to wetland loss.

2.3.4. Site Suitability for Nature-Based Solutions

To determine suitable sites for nature-based solutions based on the combined wetland vulnerability analysis, we used state parcel data created by NC One Map to find parcels that are already in government ownership, preferably unused, and located close to areas deemed highly vulnerable following analysis. The types of nature-based solutions being recommended for implementation following this study would be those that improve wetland ecosystem services and extent, such as bioretention, wetland restoration or the creation of new stormwater wetlands. The type of wetland nature-based solution able to be implemented is dependent on the size of a parcel deemed suitable. We conducted several site visits to locations in both New Hanover and Craven Counties during the month of July 2021 that consisted of geotagged photos and field inspections with relevant managing stakeholders to identify areas of the highest recurrent flood risk as well as expert-proposed candidates for NBS implementation following the presentation of our modeling results. The site visits not only provided critical on-the-ground information on existing risk and vulnerability to the built infrastructure but helped further solidify our working relationships with the managing stakeholders and potential decision makers in adopting and implementing NBSs at the selected sites.

3. Results

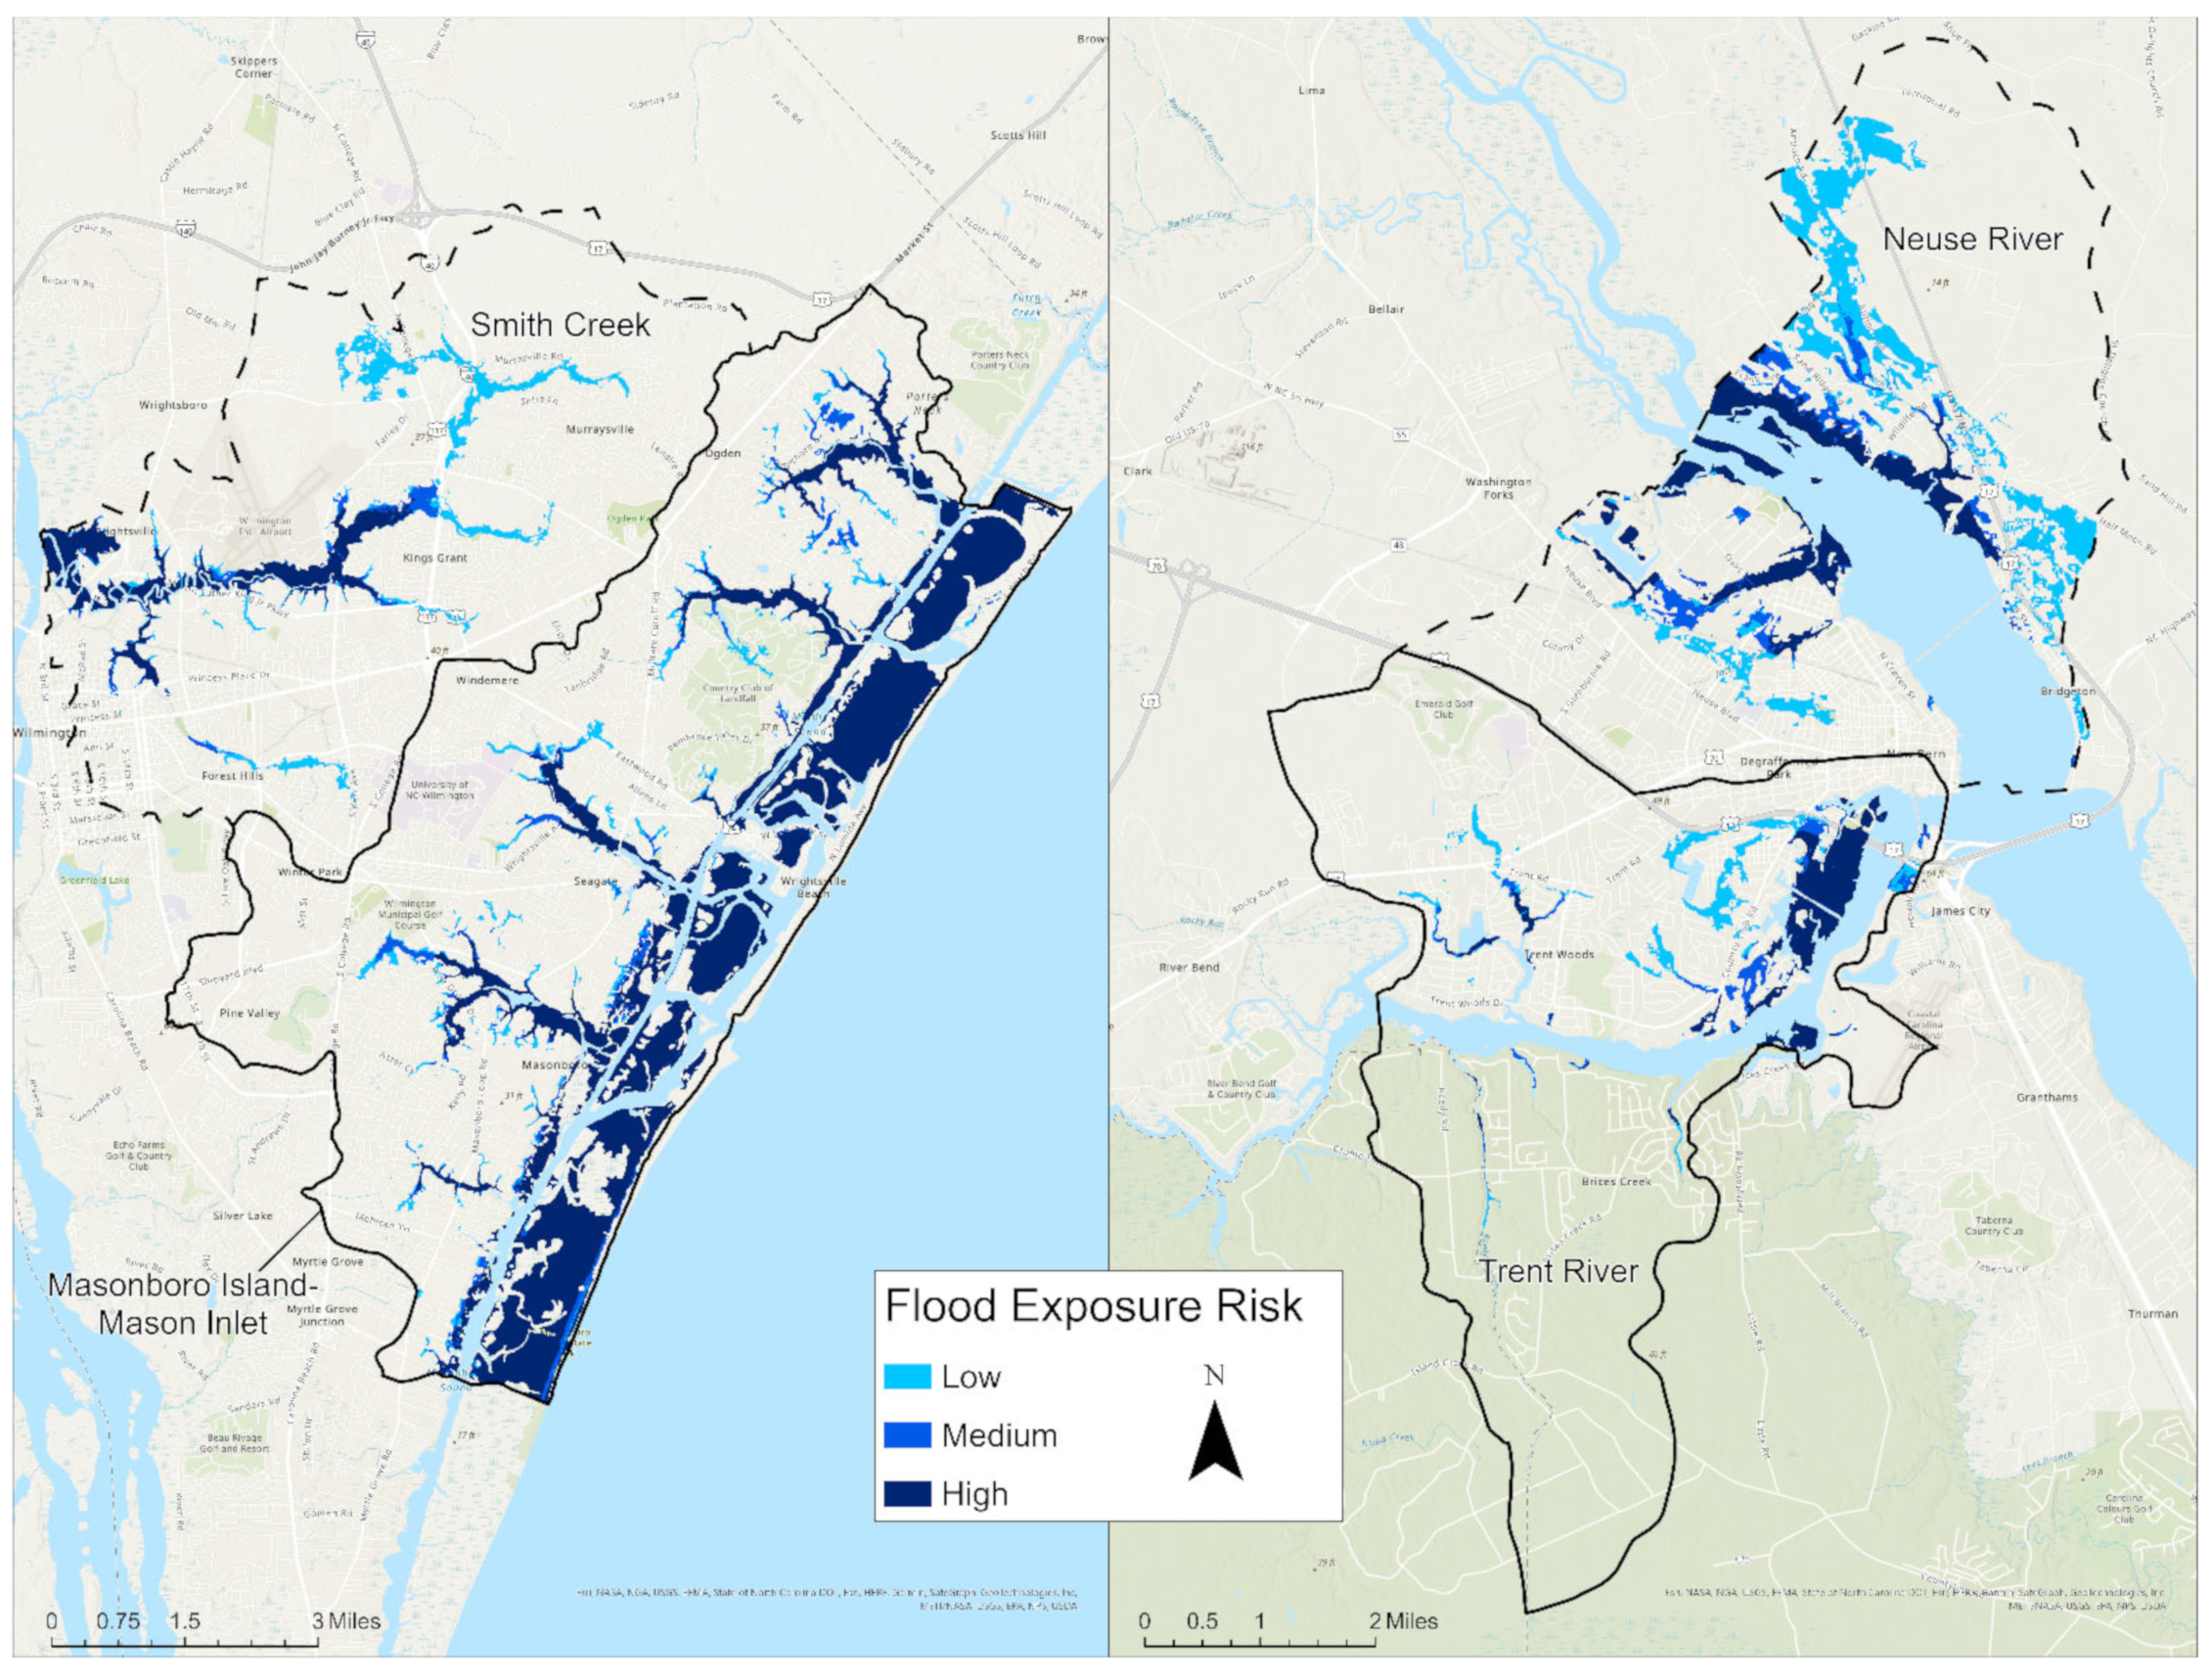
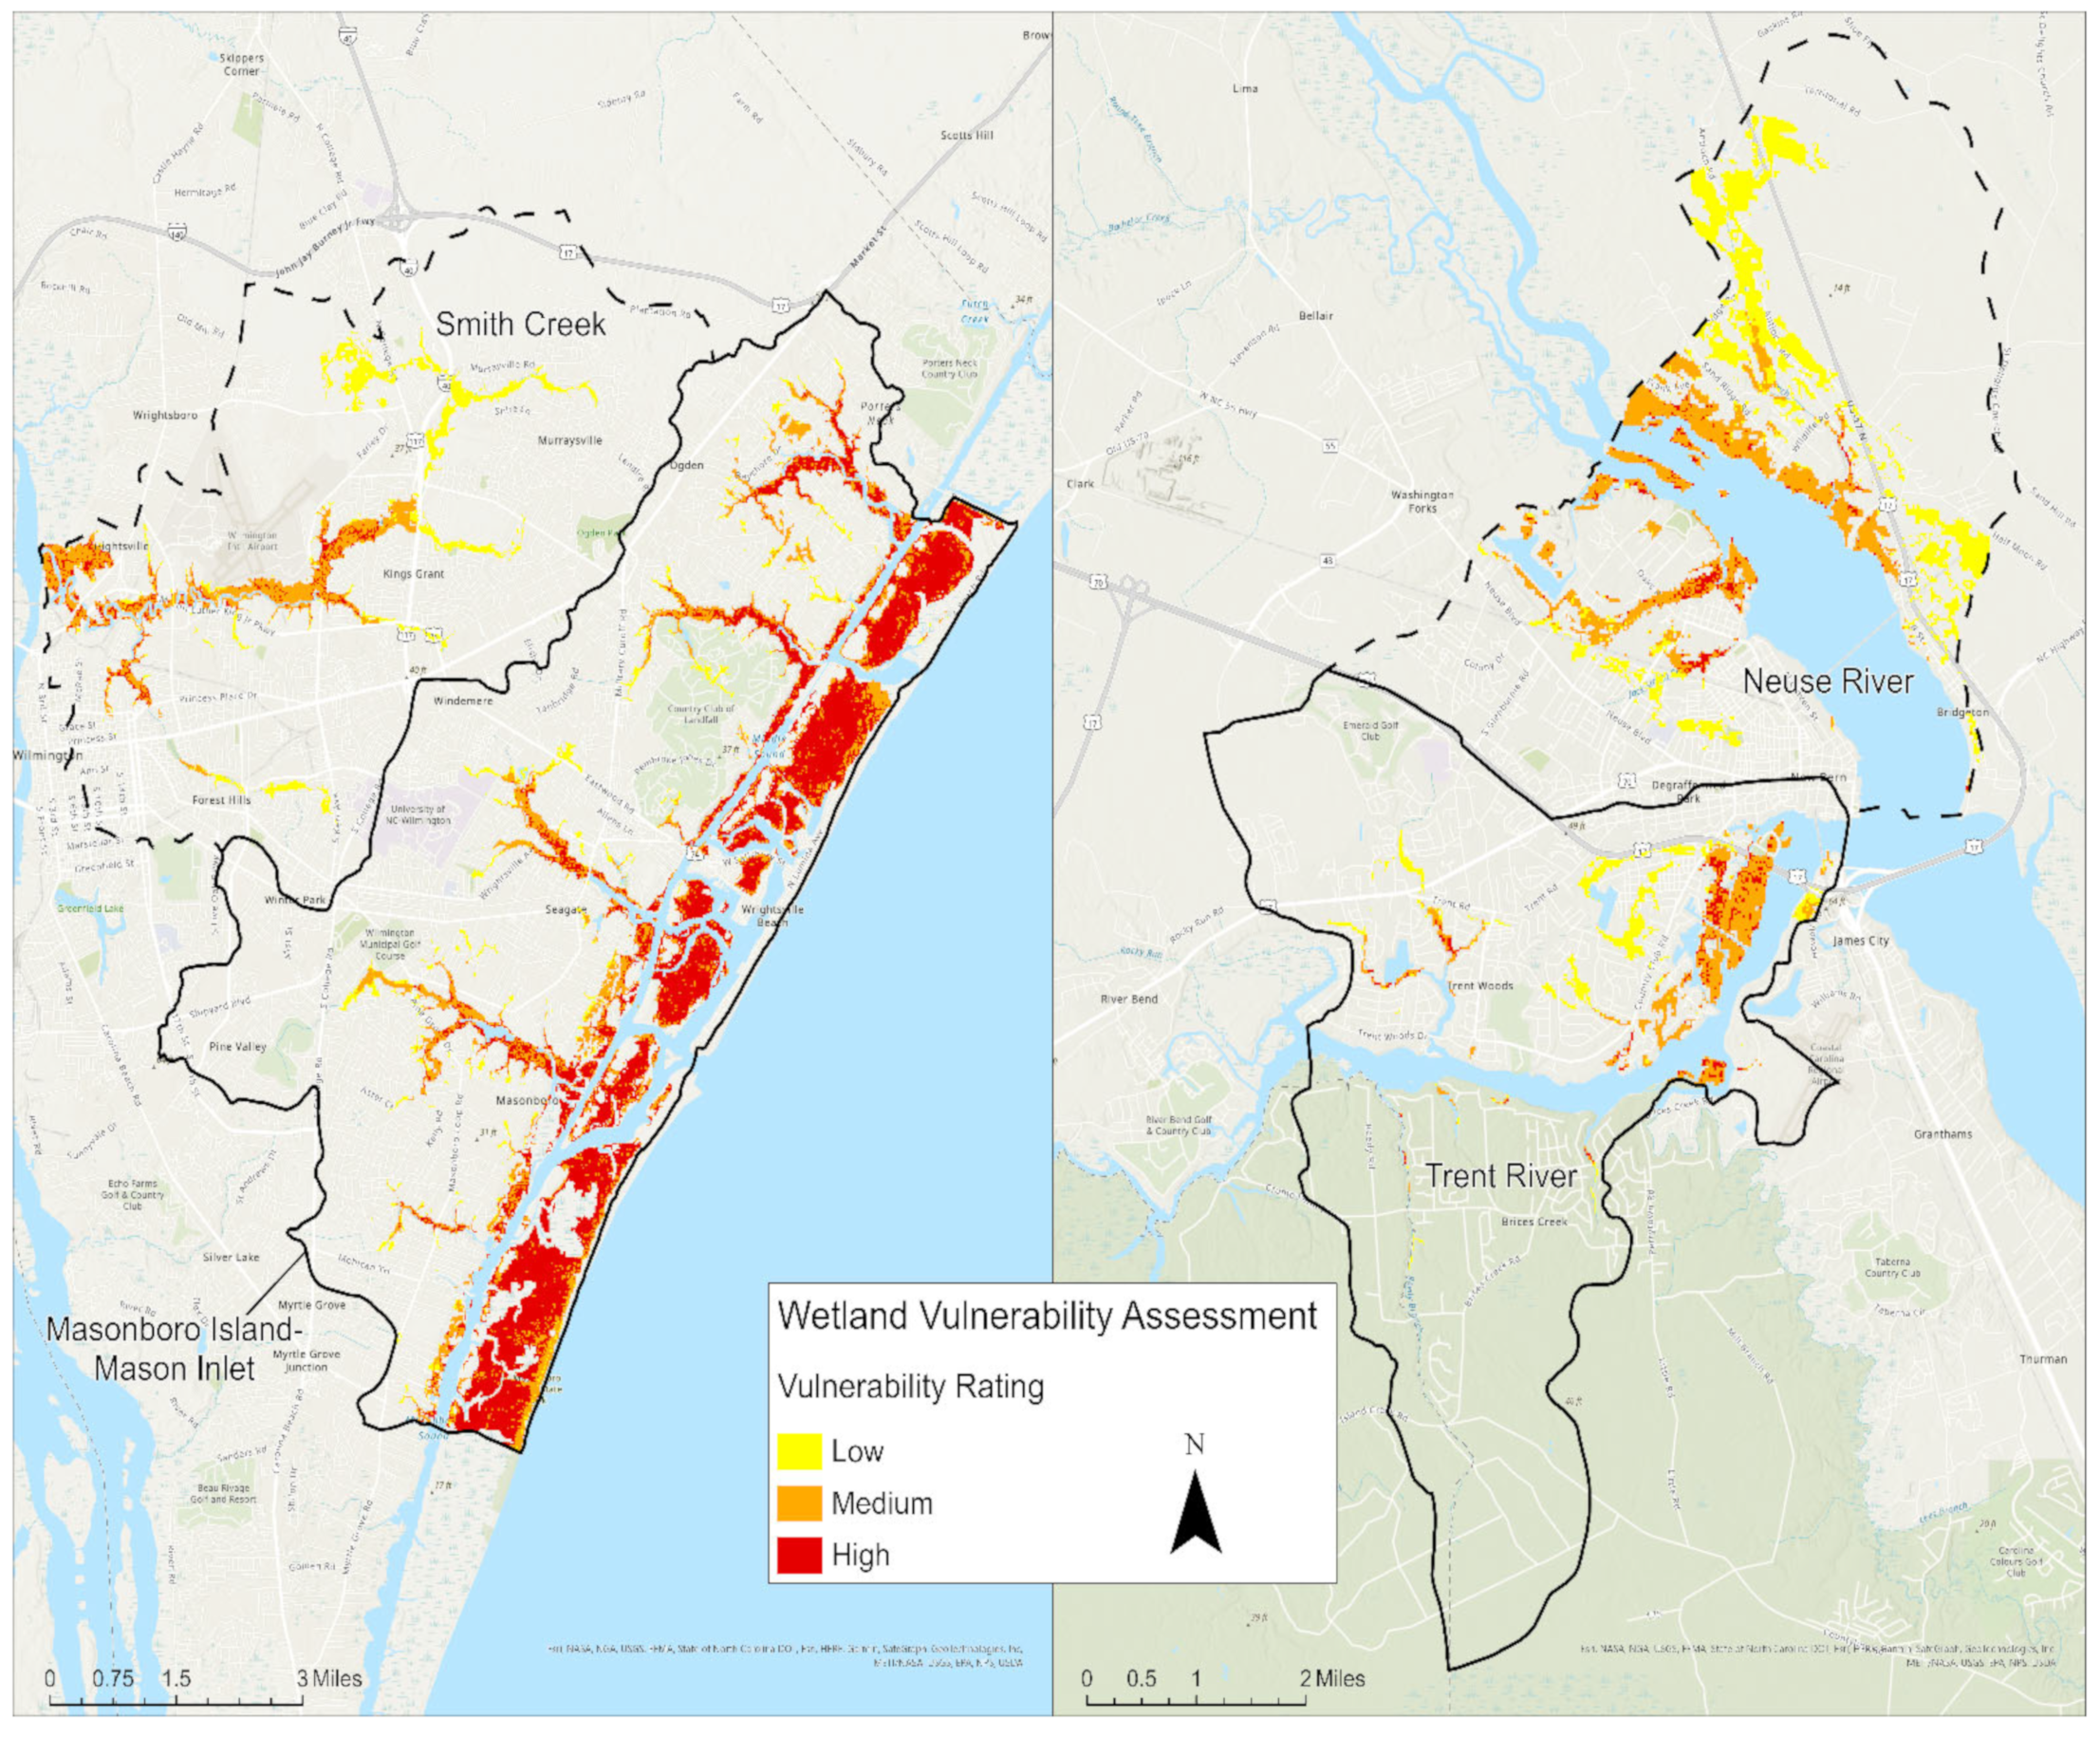
As anticipated, in both New Hanover County and the City of New Bern, all four subwatersheds examined show the highest flood exposure risk for wetlands located on the coast and near the major hydrologic features in the region. In the Masonboro Island–Mason Inlet subwatershed, the majority of the wetlands on the barrier islands and directly surrounding the tidal creek hydrologic features are exposed to flood inundation (Figure 3). The main portions of the tidal creeks and barrier islands marking the coastline show high flood exposure risk with 20.3% of the entire subwatershed at some risk to flood inundation (Table 2). All the tidal creeks located within the Masonboro Island–Mason Inlet subwatershed are also highly populated areas that are historically at risk from repeated flooding during relatively small storm events or even sunny day or high-tide flooding. The Smith Creek subwatershed experiences the highest flood risk along wetlands located close to the Cape Fear River (Figure 3) and experiences compounding flood risks, such as a combination of tropical storms, riverine flooding, and sea level rise exacerbated by high-tide flooding. While the inland portion of Smith Creek shows a lower flood exposure overall, the presence of cleared, drained, and cutover wetland types in the area could contribute to decreased flood sequestration due to lack of functional wetlands able to perform ecosystem services (see Figure S2). In total, 7.4% of the Smith Creek subwatershed experiences some level of flood exposure (Table 2) as does the downtown area of the city of Wilmington, and the communities of Kings Grant, Forest Hills, and Murrayville.
In the City of New Bern–Neuse River and the City of New Bern–Trent River subwatersheds, the highest flood exposure characterizes wetland areas along the Neuse River and mouth of the Trent River (Figure 3). In the City of New Bern–Neuse River subwatershed, 14.7% is exposed to recurrent flooding, with 5.1% of the entire subwatershed falling into the high exposure level (Table 2). The wetland areas with highest vulnerability to flooding are those found directly at the mouth of the Trent River where it branches off from the larger Neuse River. This subwatershed contains the historic downtown New Bern along with a vast majority of the city’s incorporated areas and citizens. Overall, 5.7% of the City of New Bern–Trent River subwatershed is exposed to tidal and SLR-induced floods, with 2.9% of the entire subwatershed falling into the high exposure category (Table 2). High flood exposure makes up the largest area of flood exposure in the City of New Bern–Trent River subwatershed followed by low flood exposure composing 1.9% of the entire subwatershed. The Neuse River Bridge dissects through wetlands that show to have a high flood exposure on the western side of the structure and a mixture of low to medium flood exposure on the eastern side. Having a major transportation structure located within areas with high exposure to flooding can lead to infrastructure damage or failure over time as sea level rising scenarios and natural hazards causing flood inundation to continue to amplify [34]. These analyses do provide a cursory and standardized approach to visualizing areas of the highest risk and exposure to compound inundation and thus represent useful planning tools in the process of NBS suitability assessment.
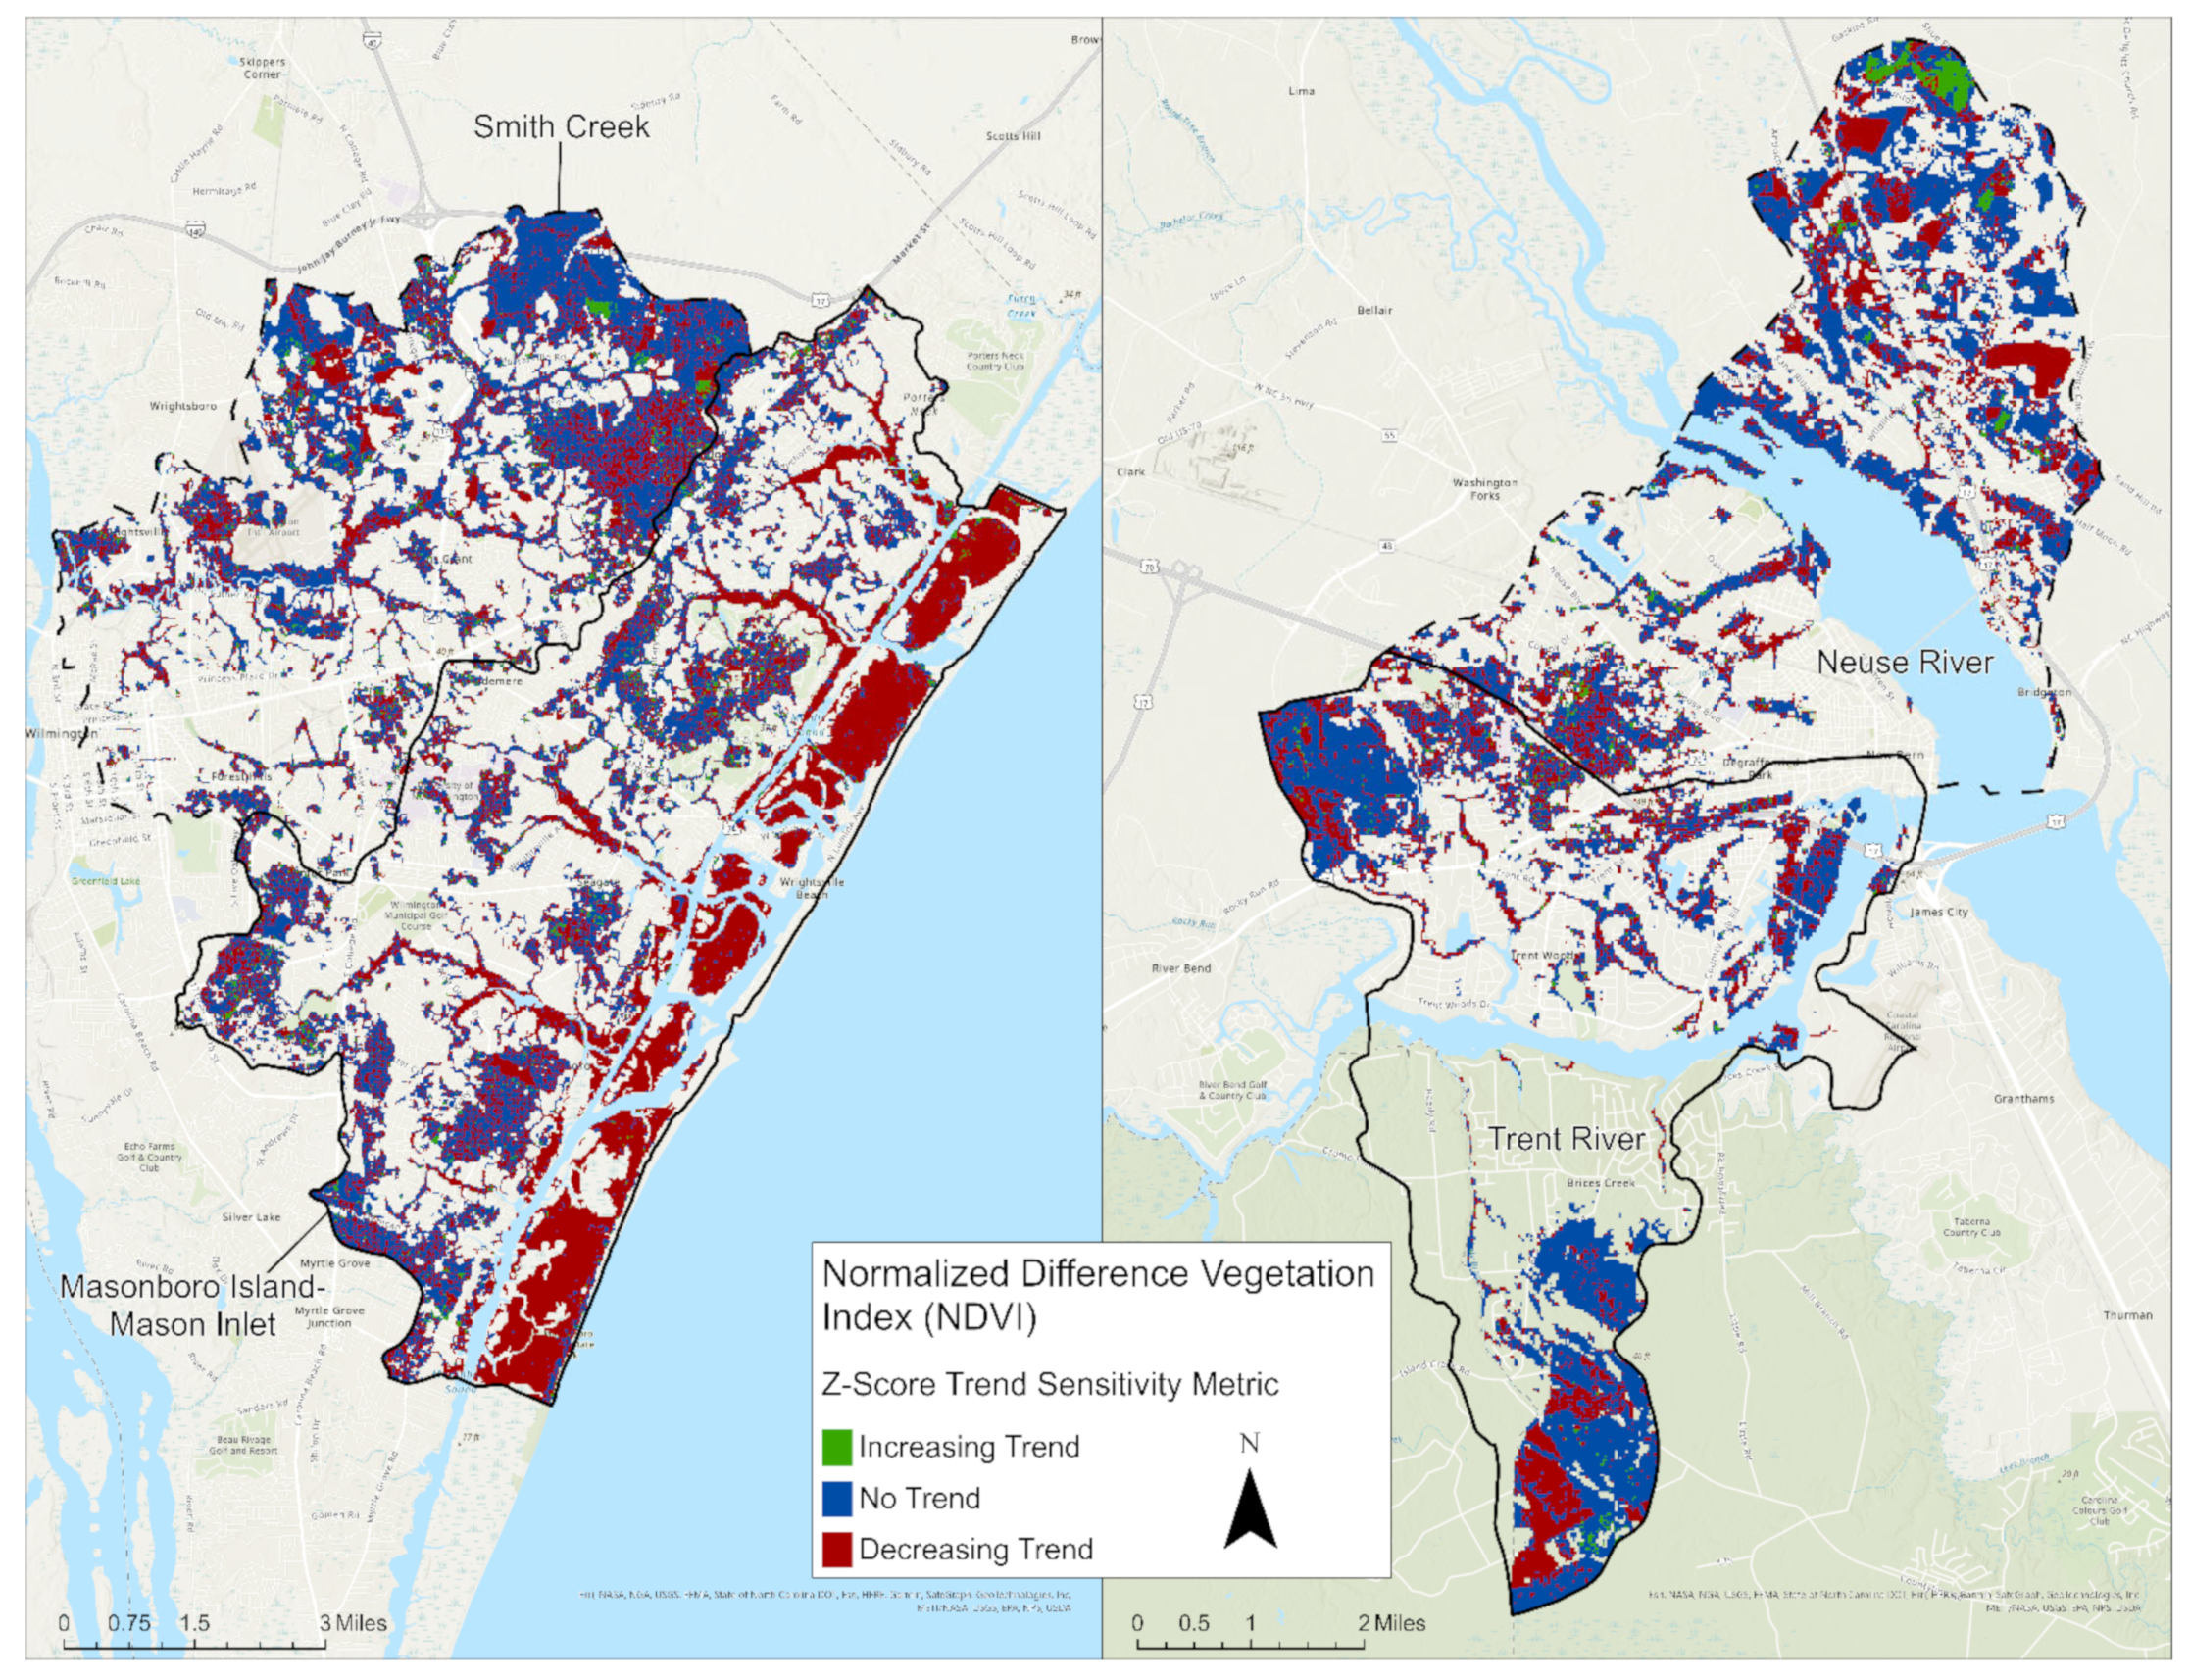
Our next step involved conducting a 12-year vegetation change analysis aimed at quantifying areas of vegetation condition decline, stability, or improvements for our four subwatersheds focusing solely on wetlands as defined by the NCDEQ. Even though we calculated trends (and their relative statistical significance) based on SAVI (Figure S6) and NDMI (Figure S7) indices and all three vegetation indices directionality are included in our final combined vulnerability metric, below we only show and discuss in detail the results of the NDVI trend analysis. In the Masonboro Island/Inlet area, more than 24% of the wetlands included in our analysis show a decreasing vegetation trend based on the time series of NDVI extracted from Landsat imagery (Table 3 and Figure 4). This area was highlighted as having a decreased vegetation condition that is contiguous along the barrier island and the main stems of the major tidal creek inlets, and characterizes a much larger proportion of the study area compared to all of the other three study locations. For the other locations, the majority of wetlands analyzed exhibit no significant trend in vegetation response, while only marginal increases in vegetation response are recorded, with the highest proportion occurring in the Smith Creek watershed region. For our Craven County study locations, we see a similar pattern of highest vegetation response declines in the tidally influenced zones, although the Neuse River is located a distance away from the coast (Figure 4).
Finally, we combined the flood exposure and vegetation sensitivity metrics into a single metric called wetland vulnerability, reclassified from its numeric values into three categories: low, medium, and high vulnerability to inundation as a function of wetland condition (Table 4). In New Hanover County, the majority of wetland areas in the Masonboro Island–Mason Inlet subwatershed located on the Atlantic Coast are ranked as highly vulnerable areas (Figure 5). The portions of the five smaller hydrologic features within the Masonboro Island–Mason Inlet subwatershed located directly on the coast are also ranked as highly vulnerable when combining exposure to inundation and the high rate of vegetation decline resulting from the sensitivity analysis. The Smith Creek subwatershed shows high vulnerability immediately adjacent to the Cape Fear River but the ranking declines towards the medium ranking as the hydrologic feature moves inland. Overall, as was the case with the vegetation analysis, the Masonboro Island–Mason Inlet shows many highly vulnerable areas with roughly 11.7% of the subwatershed’s total area deemed highly vulnerable to the combined effects of inundation and declining vegetation conditions (Table 4).
In Craven County, a relatively smaller proportion of the study areas were ranked as highly vulnerable to the combined effects of inundation and vegetation declines, with the highest concentration of highly vulnerable areas in the northeastern portion of the City of New Bern–Trent River subwatershed, where there is existing transportation infrastructure and two hydrologic features, the Neuse and Trent rivers, along with smaller hydrologic features that branch off from the Trent River (Figure 5). The wetland areas in the City of New Bern–Neuse River subwatershed that were determined to be at high vulnerability are those directly bordering the Neuse River and the smaller hydrologic systems along the river’s coastline, primarily classified as medium or low overall vulnerability (Table 4).
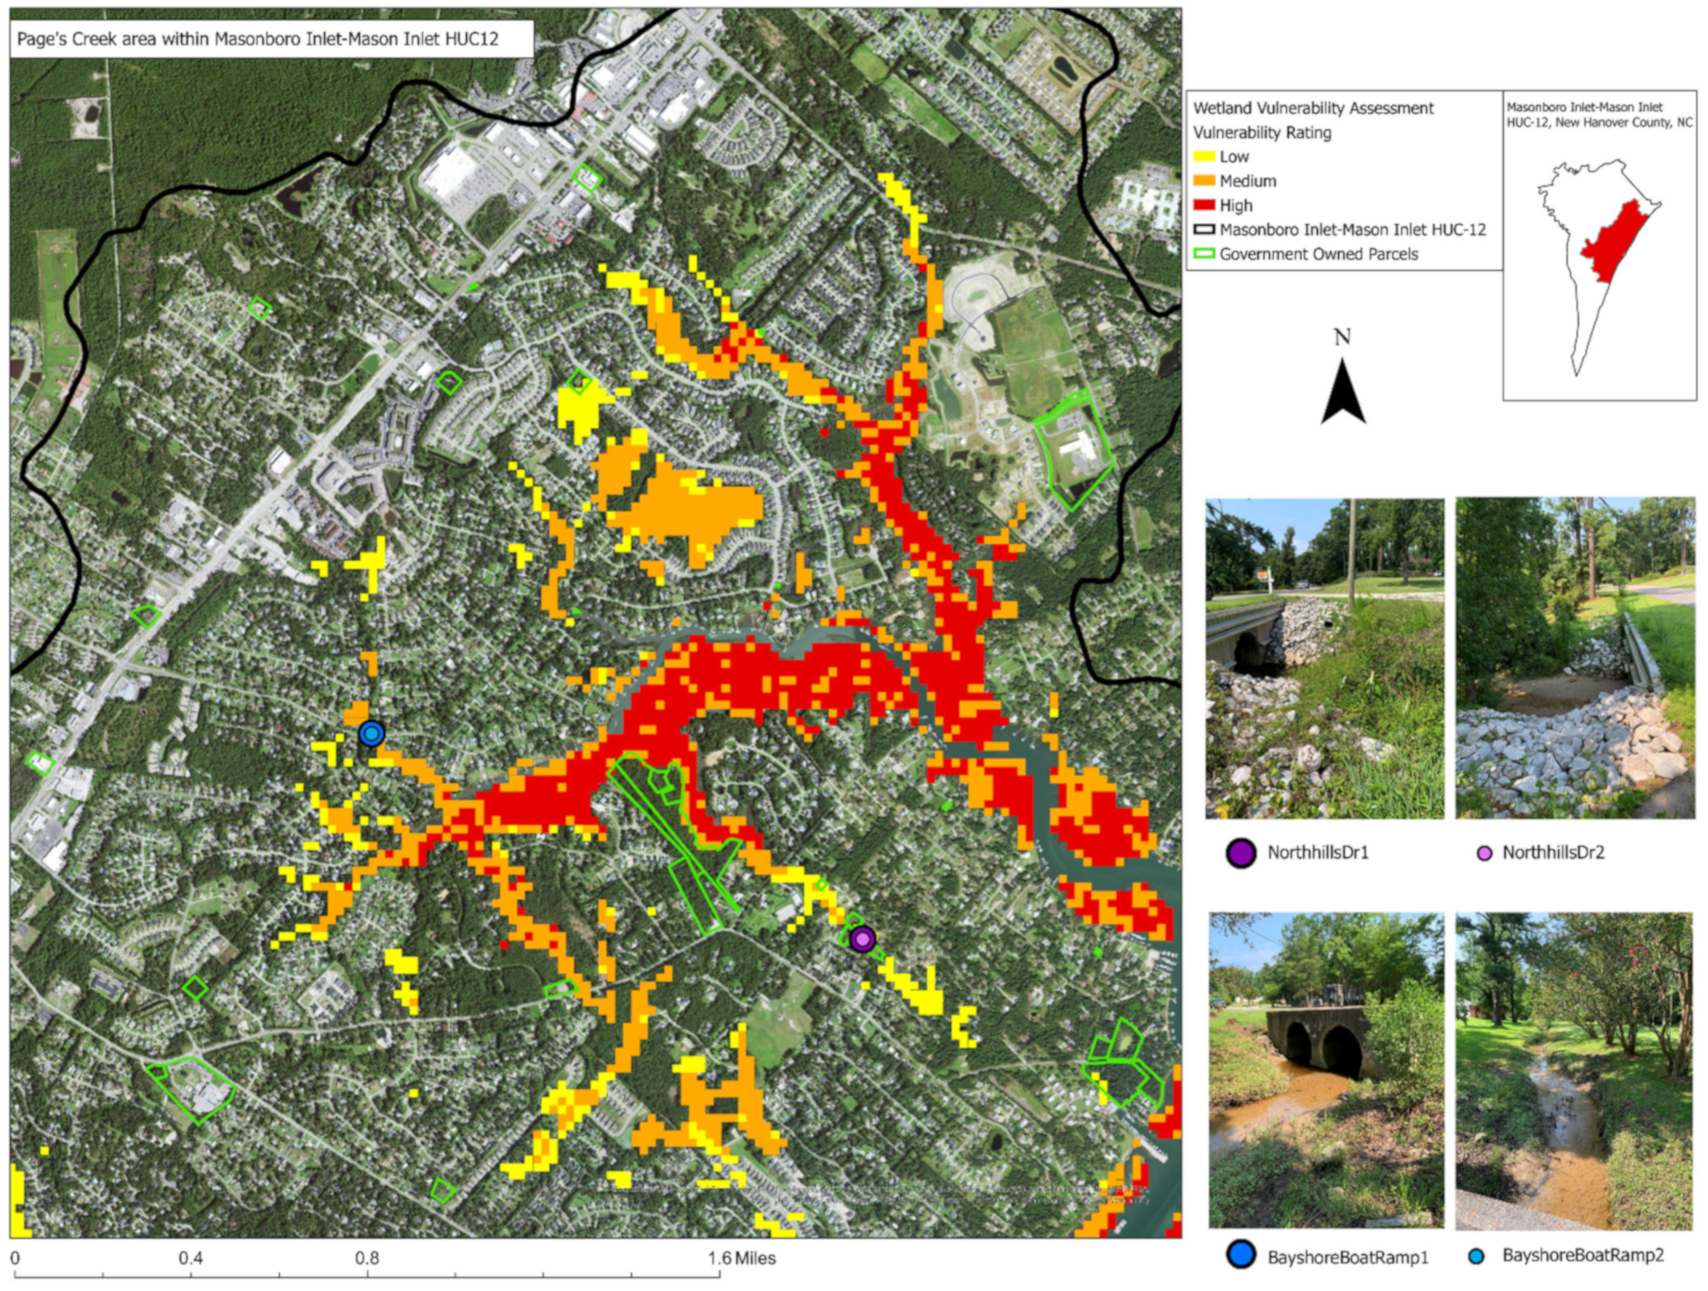
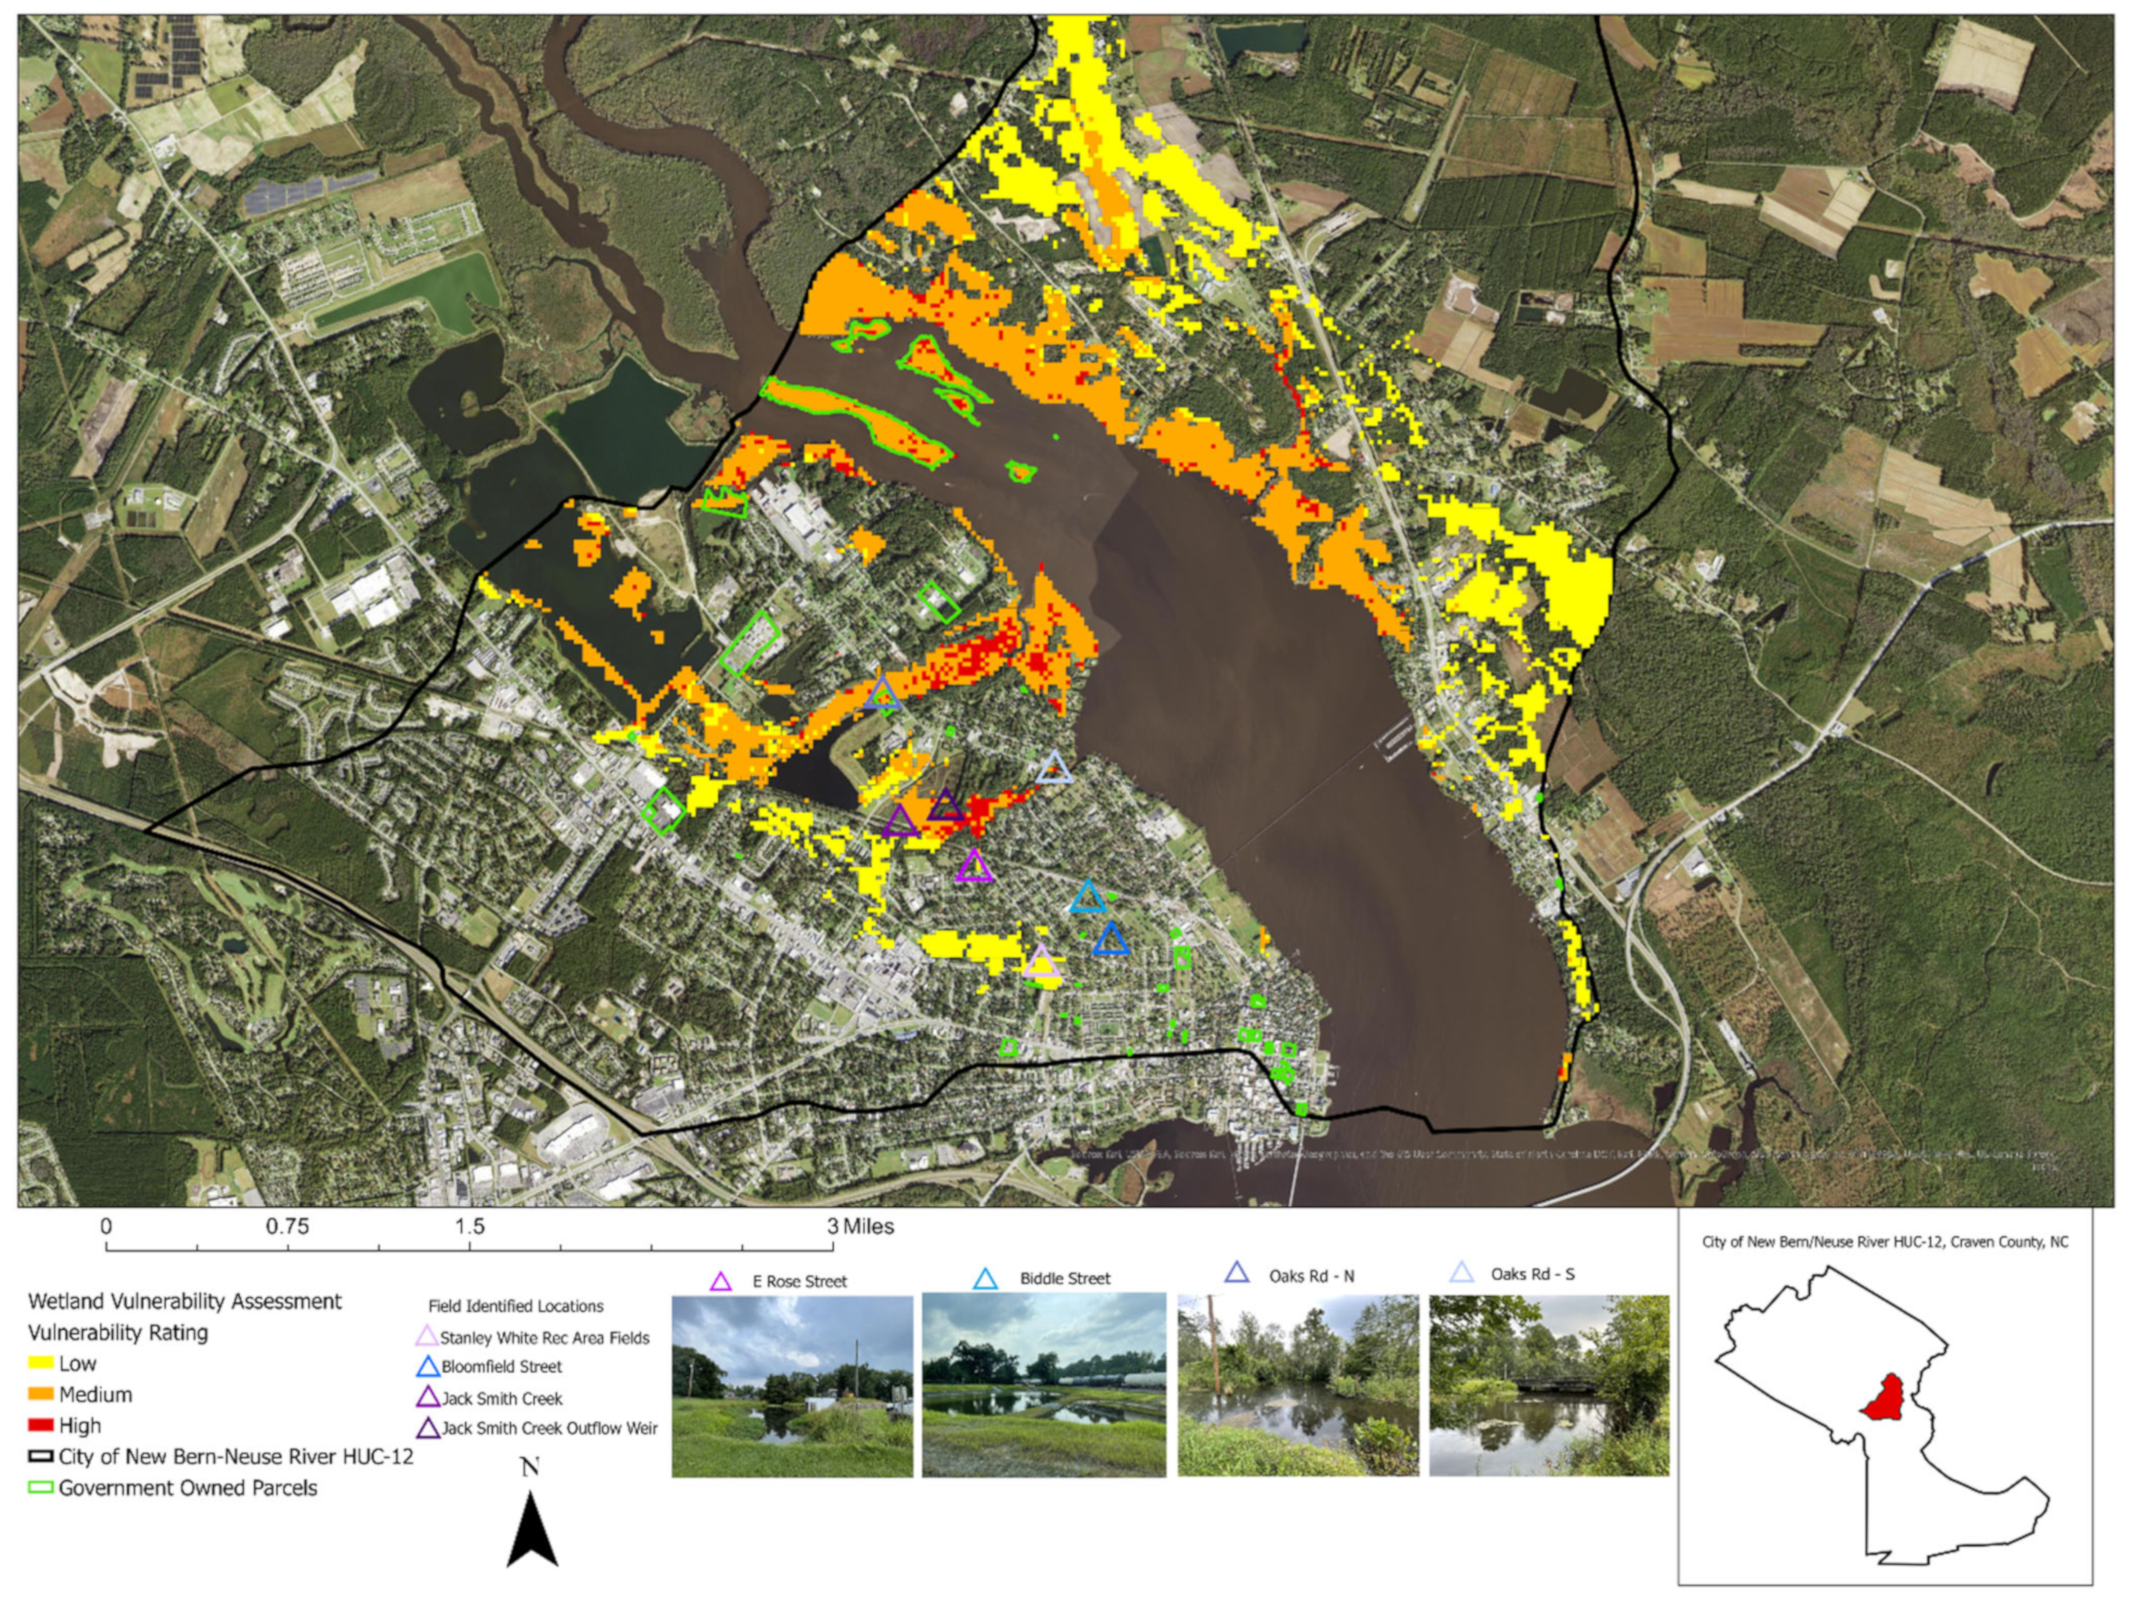
The final step consisted of stratifying our results based on parcel ownership in order to identify potential sites for nature-based solution implementation, relative to data collected in the field during our site visits (Figure 6 and Figure 7). The optimal type of parcel for potential NBS implementation is already in government ownership located close to wetland areas identified as high vulnerability or containing high vulnerability areas, even if not spatially contiguous. Interestingly, the locations considered by county managers to be highly problematic in the New Hanover Pages Creek watershed, for instance, show medium overall vulnerability in our model ranking and are not co-located with government-owned parcels, which partially explains the relative lack of success mitigating for repeated flooding occurring in those locations (Figure 6).
In Craven County on the other hand, where resilience planning efforts are currently well underway, our vulnerability ranking overlapped closely with areas considered highly at risk by City of New Bern Development Services officials who are implementing NBSs in the Stanley White Recreation Area and the Jack Smith Creek locations (Figure 7).
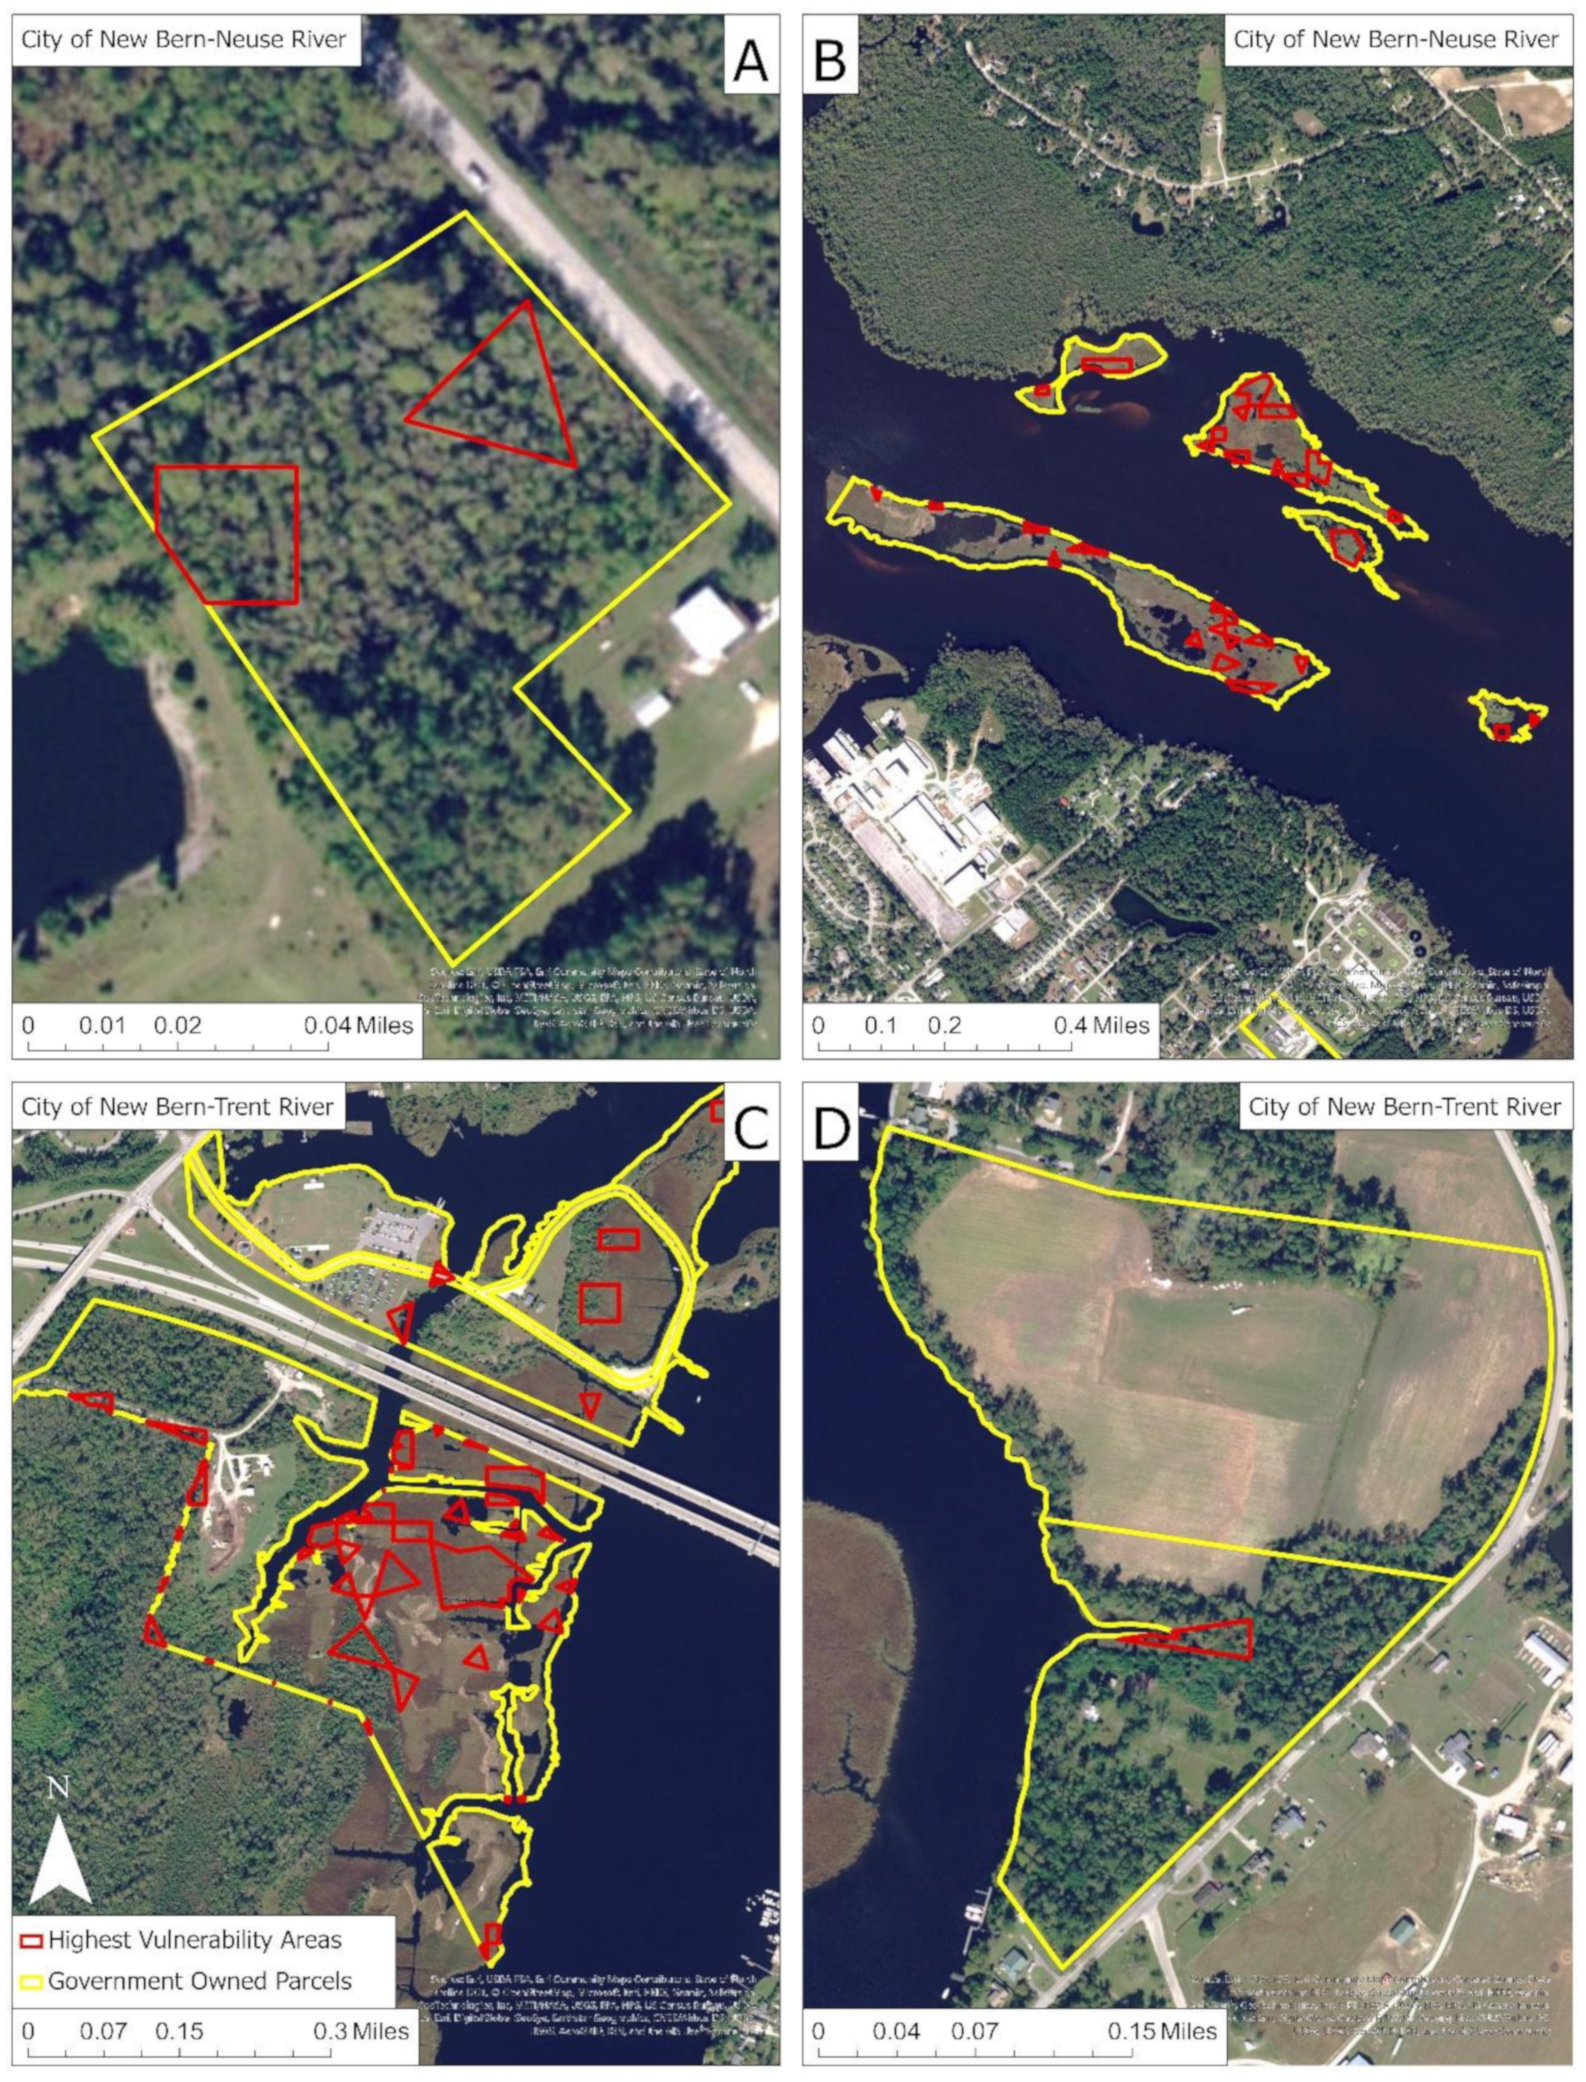
Spatially, it is important to identify specific locations and parcels that contain high proportions of wetlands ranked as highly vulnerable to inundation and present potential opportunities for NBS implementation (Table 5). In some instances, parcels larger than 65 hectares are deemed almost 70% vulnerable and, when those parcels are also contiguous and cover large spatial extents that protect significant residentials areas (Figure 8B), they present huge opportunities for brackish or saltwater marsh restoration that can benefit both ecosystems and humans. In New Hanover County, the Smith Creek subwatershed contains 25 government-owned parcels in total, while the Masonboro Island–Mason Inlet subwatershed contains 83 government-owned parcels identified as highly vulnerable, which are all nearly exclusively freshwater marsh ecosystems. Introducing a wetland-centered, nature-based solution project within any of these parcels has the potential to help mitigate flood inundation from the downtown Wilmington and Hightsville areas that contain historic structures and densely populated areas (Table 5 and Figure 3).
In New Bern, the City of New Bern–Neuse River subwatershed contains six government-owned parcels and the City of New Bern–Trent River subwatershed contains two government-owned parcels exhibiting high vulnerability to inundation and vegetation declining in condition, primarily located in the Neuse River, making them difficult to access and not the best area for implementation to protect societal infrastructure from flood inundation. The two government-owned parcels in the City of New Bern–Trent River subwatershed are considered highly vulnerable areas that are exclusively freshwater marshes (Table 5). In the City of New Bern–Trent River, 10.2% of the Lawson Creek Park parcel showed the presence of highly vulnerable areas while only 2.53% of the Clermont parcel showed high vulnerability (both characterized by freshwater marshes and riverine swamp forests in about equal proportion), making Lawson Creek Park the most optimal government-owned location for NBS implementation subwatershed (Figure 9C). Utilizing a park as a location to implement a NBS is a fantastic opportunity because not only is the parcel already government owned, but it is also in a location that is visited frequently by the public that could be utilized as an environmental educational tool. While not exhaustive, these results show opportunities afforded when using freely available and public data for the quick identification of potential NBSs locations as a function of exposure to risk and ecosystem sensitivity that can be used to both enhance ecosystem functions and benefit the built and infrastructural system.

4. Discussion

The Masonboro Island–Mason Inlet subwatershed contains the highest area of wetlands and wetland restoration areas (20.3% of the entire subwatershed), which are vulnerable to flood inundation based on the sea level rise, high-tide flooding, and FEMA 100-yr and 500-yr flood zone data collected for the flood exposure analysis. It also contains the largest area experiencing a decreasing trend in wetland vegetation conditions (22.5% of the area showing a decreasing trend in NDMI values and a 23.4% decreasing trends in both NDVI and SAVI over the last 12 years was considered). While all four subwatershed examined here are coastal, the Masonboro Island–Mason Inlet area is the only one that directly borders the Atlantic Ocean, resulting in a higher inundation exposure due to the lack of a buffer region between the ocean and the wetland landscapes located closely to urbanized areas. The City of New Bern–Trent River subwatershed has the lowest area vulnerable to high flood exposure (2.9% of the total area) and decreases in wetland vegetation health metrics of the study areas were examined (10.7% for NDVI and SAVI and 11.8% for NDMI metrics per total area). Wetlands directly along the coast may experience much more rapid deterioration of vegetation with increasing sea levels, tidal inundation, and more frequent instances of flood events. We advance the notion that NBS implementation would be beneficial in wetland areas located near major hydrologic features that have a high exposure level to flood inundation scenarios and are experiencing decreasing health metrics indicative of healthy and productive vegetation, such as chlorophyll and moisture concentrations. Leveraging existing wetland areas as a nature-based solution is a natural tool to mitigate climate change impacts in coastal urban areas where flood inundation is common due to sea level rise, tidal flooding, and natural hazards bringing forth heavy precipitation and storm surges [17]. The introduction of NBSs to conserve and restore wetlands, such as brackish and freshwater marshes and riverine swamp forests, in urban areas simultaneously preserves biodiversity and the ecological balance of existing waterbodies by providing water sequestration and purification services [14]. Finally, the introduction of NBSs further provides vegetated areas with aesthetic and recreational values that allow citizens to connect with nature and enhance their mental wellbeing [14]. Overall, while NBSs in the coastal environment (either on the land part of a coast or in nearshore waters) are very efficient at mitigating the effects of extreme fast-evolving processes that lead to episodic coastal flooding (waves and surges), they are less efficient in decreasing the inundation effects of very slow long-term processes, such as mean SLR induced by climate change [17,18]. A notable exception is provided by marsh ecosystems that have the ability to collect sand and sediments and raise their surface elevation over time as SLR progresses [18].
As global climate change and sea level rises along the world’s developed coastlines intensify, coastal zones will continue to experience higher vulnerability to flood inundation and ecosystem degradation [22]. While localized scale actions cannot mitigate these effects, implementing NBSs to protect and restore wetland ecosystems and associated ecosystem services can contribute to mitigating flood inundation and the impacts of climate extremes in urbanized coastal communities [16,17]. Especially in low-lying coastal areas, increasing compounding flood risks associated with storm surge and heavy precipitation are likely to continue to co-occur [34]. Areas that are typically only submerged during high tides will likely experience increases in time spent submerged with the sea level rise, which can lead to complete submergence over time and declines in vegetation conditions as species are unable to cope with changing environmental conditions or migrate quickly enough [34]. The impacts of rising water levels from sea level rise and natural hazard events will lead to structures located along the bodies of water to experience submergence and inundation, which will in turn impact societal infrastructure such as stormwater systems, buildings, and roadways [34]. Yet many municipalities or small urban centers do not have the capacity to run complex models to simulate their exposure to flood risks and prioritize potential interventions in areas that experience recurrent inundation and that may even be bought out (New Hanover County Office of Recovery and Resilience, personal communication, 2021).
Although proposed as a rapid assessment method with high transferability and replicability, this work has several important limitations and areas of improvement, primarily in computing the wetland sensitivity metric as presented here. Currently, North Carolina does not have any wetland-species-specific classification data available for geospatial analyses. While it would be difficult to create a statewide or subwatershed-level dataset identifying individual wetland vegetation species, it would certainly increase the accuracy of geospatial assessments of wetland vegetation conditions without relying on the collection of field observations. The NCDEQ wetland data utilized for this study does identify wetland types but does not go into depth regarding a full species breakdown for every location given the statewide scope of the dataset. The NCDEQ data does provide an idea of what types of species are commonly present within each wetland type to give those utilizing the data an idea of what species are more than likely present in each wetland community. Determining specific wetland vegetation species can be necessary for a remote sensing-based wetland assessment due to variations in spectral properties between species, along with precipitation variations that control species spectral responses [35,36]. Certain species of wetland vegetation—such as Juncus roemerianus, commonly known as black needlebrush—can have levels of chlorophyll and moisture slightly lower than the typical healthy vegetation that can result in false declining condition trends when utilizing remotely sensed data and spectral indices alone [35]. Species like cordgrass and juncus have a much sparser canopy composition relative to other wetland vegetation like phragmites, which leads to higher reflectance values in the red wavelength range and lower values in the near infrared than other wetland species [35]. Higher values in the red wavelength region infer a lower chlorophyll concentration which could impact the results of spectral indices if not accurately accounted for when undertaking a geospatial assessment of wetlands using remotely sensed data [35]. Ground truthing and taking site observations of vegetation communities are helpful steps to confirm species present in a study area so the ecosystem dynamics and structure of wetland areas are accurately described. Although some species of wetland vegetation may present lower spectral profiles than typical healthy vegetation due to structure and composition, the goal of this analysis was to determine the overall trends in vegetation conditions based on spectral signatures present in moderate-resolution satellite data and not to observe the values of the indices alone. For a wetland vegetation patch to be determined as increasing or decreasing in terms of its spectrally based indices (whether NDVI, SAVI or NDMI), there would have to be a shift in values over time that is atypical and maintains temporal consistency. If a species has consistently lower values in the metrics calculated here, the lower values alone would not cause an area to present either decreasing or increasing trends when considered over time. Secondly, to increase the accuracy of future vulnerability assessments, higher resolution multispectral data can be utilized, such as Sentinel-2 or in situ collected unoccupied aerial systems (UAS) imagery. We chose to utilize Landsat 8 data because it is widely accepted and available in the geospatial community along with the Analyze Changes using LandTrendr specifically created by Esri for the ArcGIS Pro software to be used with Landsat data. Drawbacks of utilizing a method that requires obtaining in situ UAS data is the difficulty of collecting data on a large scale, such as at the HUC-12 level, in developed areas and the resource intensity in the way of equipment, time, and workforce [24]. Increasing publicly available wetland inventory data that elaborates on types of species found in an area would be beneficial for geospatial analysis when retrieval of small scale, field-based data is not possible. With advancements in technology leading to high spatial and temporal resolution imagery data becoming widely available, remote sensing and GIS could be employed more frequently to monitor wetland areas, especially in areas that are difficult to traverse on the ground.
To further strengthen the results of this study, more in-depth evaluations of various wetland types along the Atlantic coast would be a great indicator to determine if subwatersheds on the coast are overall experiencing greater impacts from increased flood intensity and wetland vegetation degradation than their riverine counterparts. Locations for potential NBSs do not have to be implemented on government-owned parcels alone. Utilizing locations such as parks and public schools located in or near wetland areas provides good alternatives given educational opportunities for schoolchildren and the public. The state of North Carolina has a buyout system for property due to past inundation or high flood risks that were bought out from private citizens largely funded by the Federal Emergency Management Agency (FEMA) [37]. These lots would be another type of location that could be utilized for the introduction of NBSs. FEMA buyout lots present many advantages for NBS implementation for flood mitigation because they are already owned by a governmental entity, are in a known area of high risk to flood inundation, and are excluded from future re-developments [37]. Community outreach is also an avenue that could be explored to determine if any local landowners are willing and able to implement some form of nature-based solutions on private land to help combat future flood inundation.
Finally, while parcels optimal for NBSs can be identified through the results of a wetland vulnerability assessment, there are multiple factors to consider prior to implementation. Local conditions should be considered as failing to do so can cause negative impacts because mismatches between a solution and the socio-spatial context may lead to the nature-based solution envisioned being no longer fit to address both environmental and social needs [38]. The salvageability of the wetland vegetation, the connectivity of a potential implementation location to hydrologic features, and the size of a parcel identified for implementation can influence the effectiveness of an NBS. Wetland restoration efforts, such as nature-based solutions, are likely to fail if the sources of degradation continue to influence the area [39]. Due to the possibility of restoration failing because of upstream stressors that cause degradation, it is necessary to identify the causes of degradation to an area prior to implementation and eliminate or decrease said stressors [39]. Non-wetland areas near wetland areas experiencing flood risks and decreases in vegetation health metrics should also be considered for nature-based solution implementation, especially in developed and developing urban areas, to reduce flood exposure and devastating socio-economic effects [40,41,42].

5. Conclusions

This study presents a simple and replicable workflow for identifying potential sites for NBS implementation predicated on the utilization of freely and publicly available geospatial datasets so that interested decision-making parties can easily implement it in natural areas such as brackish and freshwater marshes and riverine swamp forests. In identifying potentially suitable NBS implementation sites that leverage existing wetland locations, irrespective of location near the coast or relatively inland, we rely on the assumption that wetland areas at high flood risk and that exhibit decreasing vegetation condition trends present an ideal opportunity to address both wetland conservation or restoration as well as the impacts of flood inundation in urban areas. Especially when co-occurring with large and underutilized or unutilized land parcels under government ownership, the double advantage of preserving or restoring wetland ecosystem functions (depending on the vegetation condition status highlighted by the multi-year trend analyses) and providing inundation mitigation for the built environment makes nature-based solutions an important consideration. Looking beyond wetland areas and government-owned parcels may present other implementation areas that could assist in further restoring wetlands in close proximity to those areas and helping mitigate flood risk in developed and urbanized coastal communities at risk from recurrent inundation. Finally, this study underscores the critical importance of conserving or restoring brackish and freshwater marshes and swamp forests even though, proportionally and depending on location, they represent a minority of wetland types present in the highly populated Atlantic Coastal Plain region.

Supplementary Materials

The following are available online at https://www.mdpi.com/article/10.3390/hydrology9120218/s1. Figure S1. Wetland types of the Masonboro Island-Mason Inlet subwatershed (32,814.41 acres) per NCDEQ wetland data. Figure S2. Wetland types of the Smith Creek subwatershed (21,136.41 acres) per NCDEQ wetland data. Figure S3. Wetland types of the City of New Bern-Neuse River subwatershed (14,458.74 acres) per NCDEQ wetland data. Figure S4. Wetland types of the City of New Bern-Trent River subwatershed (14,210.71 acres) per NCDEQ wetland data. Table S1 Dates of Landsat 8 data utilized for the sensitivity time series analysis. Figure S5. Detailed wetland vulnerability assessment workflow showing intermediary computational steps for ArcGIS Pro implementation. Figure S6. SAVI time series wetland sensitivity results of the Masonboro Island-Mason Inlet and Smith Creek subwatersheds in New Hanover County, NC. Figure S7. NDMI time series wetland sensitivity results of the Masonboro Island-Mason Inlet and Smith Creek subwatersheds in New Hanover County, NC.

Author Contributions

Funding was acquired by N.G.P.; conceptualization by N.G.P. Formal data analysis by G.S. and N.G.P. Original draft, edits, and final manuscript N.G.P. and G.S. All authors have read and agreed to the published version of the manuscript.

Funding

This research was funded by the North Carolina Sea Grant Karl Havens Regional Resilience Initiative (2020–2022) awarded to PI Narcisa Pricope at the University of North Carolina Wilmington.

Data Availability Statement

All publicly available datasets used in this research are available at the locations indicated in Table 1 or upon request in their processed version from the corresponding author.

Acknowledgments

We would like to thank the North Carolina Sea Grant first and foremostly for providing us with funding and support over the last two years to begin exploring this area of research. Secondly, we would like to thank our collaborators on the North Carolina Sea Grant Karl Havens Regional Resilience Initiative for being incredible colleagues. Finally, we are truly thankful to Alice Wilson from the City of New Bern and her colleagues, as well as the New Hanover County Office of Recovery and Resilience for their support during the project and various field visits.

Conflicts of Interest

The authors declare no conflict of interest. The funders had no role in the design of the study; in the collection, analyses, or interpretation of data; in the writing of the manuscript; or in the decision to publish the results.

References

  1. Garg, J.K. Wetland Assessment, Monitoring and Management in India Using Geospatial Techniques. J. Environ. Manag. 2015, 148, 112–123. [Google Scholar] [CrossRef]
  2. Mitsch, W.J.; Gosselink, J.G. The Value of Wetlands: Importance of Scale and Landscape Setting. Ecol. Econ. 2000, 35, 25–33. [Google Scholar] [CrossRef]
  3. Sivakumar, R.; Ghosh, S. Wetland Spatial Dynamics and Mitigation Study: An Integrated Remote Sensing and GIS Approach. Nat. Hazards 2015, 80, 975–995. [Google Scholar] [CrossRef]
  4. Environmental Protection Agency. Wetlands: Protecting Life and Property from Flooding; EPA: Washington, DC, USA, 2006. [Google Scholar]
  5. Davidson, N.C.; van Dam, A.A.; Finlayson, C.M.; McInnes, R.J. Worth of Wetlands: Revised Global Monetary Values of Coastal and Inland Wetland Ecosystem Services. Mar. Freshw. Res. 2019, 70, 1189–1194. [Google Scholar] [CrossRef]
  6. Anjos, L.J.S.; de Toledo, P.M. Measuring Resilience and Assessing Vulnerability of Terrestrial Ecosystems to Climate Change in South America. PLoS ONE 2018, 13, e0194654. [Google Scholar] [CrossRef] [Green Version]
  7. Xu, K.; Wang, X.; Jiang, C.; Sun, O.J. Assessing the Vulnerability of Ecosystems to Climate Change Based on Climate Exposure, Vegetation Stability and Productivity. For. Ecosyst. 2020, 7, 23. [Google Scholar] [CrossRef] [Green Version]
  8. Sharma, J.; Ravindranath, N.H. Applying IPCC 2014 Framework for Hazard-Specific Vulnerability Assessment under Climate Change. Environ. Res. Commun. 2019, 1, 051004. [Google Scholar] [CrossRef]
  9. Turner, B.L.; Kasperson, R.E.; Matson, P.A.; McCarthy, J.J.; Corell, R.W.; Christensen, L.; Eckley, N.; Kasperson, J.X.; Luers, A.; Martello, M.L.; et al. A Framework for Vulnerability Analysis in Sustainability Science. Proc. Natl. Acad. Sci. USA 2003, 100, 8074–8079. [Google Scholar] [CrossRef] [Green Version]
  10. Halls, J.N.; Magolan, J.L. A Methodology to Assess Land Use Development, Flooding, and Wetland Change as Indicators of Coastal Vulnerability. Remote Sens. 2019, 11, 2260. [Google Scholar] [CrossRef] [Green Version]
  11. McCauley, L.A.; Jenkins, D.G.; Quintana-Ascencio, P.F. Isolated Wetland Loss and Degradation over Two Decades in an Increasingly Urbanized Landscape. Wetlands 2012, 33, 117–127. [Google Scholar] [CrossRef]
  12. Rodríguez, J.F.; Saco, P.M.; Sandi, S.; Saintilan, N.; Riccardi, G. Potential Increase in Coastal Wetland Vulnerability to Sea-Level Rise Suggested by Considering Hydrodynamic Attenuation Effects. Nat. Commun. 2017, 8, 16094. [Google Scholar] [CrossRef] [PubMed] [Green Version]
  13. Orimoloye, I.R.; Mazinyo, S.P.; Kalumba, A.M.; Nel, W.; Adigun, A.I.; Ololade, O.O. Wetland Shift Monitoring Using Remote Sensing and GIS Techniques: Landscape Dynamics and Its Implications on Isimangaliso Wetland Park, South Africa. Earth Sci. Inform. 2019, 12, 553–563. [Google Scholar] [CrossRef]
  14. Stefanakis, A.I. The Role of Constructed Wetlands as Green Infrastructure for Sustainable Urban Water Management. Sustainability 2019, 11, 6981. [Google Scholar] [CrossRef] [Green Version]
  15. O’Donnell, E.C.; Thorne, C.R.; Yeakley, J.A.; Chan, F.K.S. Sustainable Flood Risk and Stormwater Management in Blue-Green Cities; an Interdisciplinary Case Study in Portland, Oregon. JAWRA J. Am. Water Resour. Assoc. 2020, 56, 757–775. [Google Scholar] [CrossRef]
  16. Cohen-Shacham, E.; Walters, G.; Janzen, C.; Maginnis, S. (Eds.) Nature-Based Solutions to Address Global Societal Challenges; International Union for Conservation of Nature (IUCN): Gland, Switzerland, 2016; ISBN 9782831718125. [Google Scholar]
  17. Haase, D. Urban Wetlands and Riparian Forests as a Nature-Based Solution for Climate Change Adaptation in Cities and Their Surroundings. In Nature-Based Solutions to Climate Change Adaptation in Urban Areas; Theory and Practice of Urban Sustainability Transitions; Springer: Cham, Switzerland, 2017; pp. 111–121. [Google Scholar] [CrossRef] [Green Version]
  18. Arkema, K.K.; Guannel, G.; Verutes, G.; Wood, S.A.; Guerry, A.; Ruckelshaus, M.; Kareiva, P.; Lacayo, M.; Silver, J.M. Coastal Habitats Shield People and Property from Sea-Level Rise and Storms. Nat. Clim. Chang. 2013, 3, 913–918. [Google Scholar] [CrossRef]
  19. Gearey, M. Re-Naturing Cities: Reducing Flood Risk through Nature-Based Solutions. Geography 2018, 103, 105–109. [Google Scholar] [CrossRef]
  20. Taillardat, P.; Thompson, B.S.; Garneau, M.; Trottier, K.; Friess, D.A. Climate Change Mitigation Potential of Wetlands and the Cost-Effectiveness of Their Restoration. Interface Focus 2020, 10, 20190129. [Google Scholar] [CrossRef]
  21. Seddon, N.; Chausson, A.; Berry, P.; Girardin, C.A.J.; Smith, A.; Turner, B. Understanding the Value and Limits of Nature-Based Solutions to Climate Change and Other Global Challenges. Philos. Trans. R. Soc. B Biol. Sci. 2020, 375, 20190120. [Google Scholar] [CrossRef] [Green Version]
  22. Liu, Z.; Fagherazzi, S.; Cui, B. Success of Coastal Wetlands Restoration Is Driven by Sediment Availability. Commun. Earth Environ. 2021, 2, 44. [Google Scholar] [CrossRef]
  23. Szlafsztein, C.; Sterr, H. Coastal Zone Management Tool: A GIS-Based Vulnerability Assessment to Natural Hazards. In Mangrove Dynamics and Management in North Brazil; Ecological Studies; Springer: Berlin/Heidelberg, Germany, 2010; Volume 211, pp. 365–385. [Google Scholar] [CrossRef]
  24. Morgan, G.R.; Hodgson, M.E.; Wang, C.; Schill, S.R. Unmanned Aerial Remote Sensing of Coastal Vegetation: A Review. Ann. GIS 2022, 28, 385–399. [Google Scholar] [CrossRef]
  25. Kunkel, K.E. State Climate Summaries for the United States 2022. NOAA Technical Report NESDIS 150. Available online: https://statesummaries.ncics.org/chapter/nc/ (accessed on 20 November 2021).
  26. Download Coastal Wetlands Spatial Data | NC DEQ. Available online: https://deq.nc.gov/about/divisions/coastal-management/coastal-management-gis-data/download-coastal-wetlands-spatial (accessed on 1 June 2021).
  27. United States Department of Agriculture; University of Nebraska-Lincoln. National Oceanic and Atmospheric Association Time Series U.S. Drought Monitor. Available online: https://droughtmonitor.unl.edu/DmData/TimeSeries.aspx (accessed on 20 October 2021).
  28. Schultz, M.; Clevers, J.G.P.W.; Carter, S.; Verbesselt, J.; Avitabile, V.; Quang, H.V.; Herold, M. Performance of Vegetation Indices from Landsat Time Series in Deforestation Monitoring. Int. J. Appl. Earth Obs. Geoinf. 2016, 52, 318–327. [Google Scholar] [CrossRef]
  29. Candiago, S.; Remondino, F.; De Giglio, M.; Dubbini, M.; Gattelli, M. Evaluating Multispectral Images and Vegetation Indices for Precision Farming Applications from UAV Images. Remote Sens. 2015, 7, 4026–4047. [Google Scholar] [CrossRef] [Green Version]
  30. Harmse, C.J.; Gerber, H.; van Niekerk, A. Evaluating Several Vegetation Indices Derived from Sentinel-2 Imagery for Quantifying Localized Overgrazing in a Semi-Arid Region of South Africa. Remote Sens. 2022, 14, 1720. [Google Scholar] [CrossRef]
  31. Ochtyra, A.; Marcinkowska-Ochtyra, A.; Raczko, E. Threshold- and Trend-Based Vegetation Change Monitoring Algorithm Based on the Inter-Annual Multi-Temporal Normalized Difference Moisture Index Series: A Case Study of the Tatra Mountains. Remote Sens. Environ. 2020, 249, 112026. [Google Scholar] [CrossRef]
  32. Sekovski, I.; Del Río, L.; Armaroli, C. Development of a Coastal Vulnerability Index Using Analytical Hierarchy Process and Application to Ravenna Province (Italy). Ocean Coast. Manag. 2020, 183, 104982. [Google Scholar] [CrossRef]
  33. Singh, G.; Pandey, A. Flash Flood Vulnerability Assessment and Zonation through an Integrated Approach in the Upper Ganga Basin of the Northwest Himalayan Region in Uttarakhand. Int. J. Disaster Risk Reduct. 2021, 66, 102573. [Google Scholar] [CrossRef]
  34. Azevedo de Almeida, B.; Mostafavi, A. Resilience of Infrastructure Systems to Sea-Level Rise in Coastal Areas: Impacts, Adaptation Measures, and Implementation Challenges. Sustainability 2016, 8, 1115. [Google Scholar] [CrossRef] [Green Version]
  35. Zomer, R.J.; Trabucco, A.; Ustin, S.L. Building Spectral Libraries for Wetlands Land Cover Classification and Hyperspectral Remote Sensing. J. Environ. Manag. 2009, 90, 2170–2177. [Google Scholar] [CrossRef]
  36. PRISM Climate Group. PRISM Climate Data; Oregon State University. Available online: https://prism.oregonstate.edu/ (accessed on 15 September 2021).
  37. ReBuild NC Strategic Buyout Program Frequently Asked Questions|ReBuild NC. Available online: https://www.rebuild.nc.gov/strategic-buyout-program-frequently-asked-questions (accessed on 23 January 2022).
  38. Albert, C.; Brillinger, M.; Guerrero, P.; Gottwald, S.; Henze, J.; Schmidt, S.; Ott, E.; Schröter, B. Planning Nature-Based Solutions: Principles, Steps, and Insights. Ambio 2021, 50, 1446–1461. [Google Scholar] [CrossRef]
  39. US EPA. OW Principles of Wetland Restoration|US EPA. Available online: https://www.epa.gov/wetlands/principles-wetland-restoration (accessed on 29 September 2021).
  40. Stefanidis, S.; Alexandridis, V.; Theodoridou, T. Flood Exposure of Residential Areas and Infrastructure in Greece. Hydrology 2022, 9, 145. [Google Scholar] [CrossRef]
  41. Yi, Q. Flood exposure of critical infrastructures in the United States. Int. J. Disaster Risk Reduct. 2019, 39, 101240. [Google Scholar] [CrossRef]
  42. Pricope, N.G.; Hidalgo, C.; Pippin, J.S.; Evans, S. Shifting landscapes of risk: Quantifying pluvial flood vulnerability beyond the regulated floodplain. J. Environ. Manag. 2022, 304, 114221. [Google Scholar] [CrossRef] [PubMed]
Figure 1. New Hanover County, NC study areas consisting of the Masonboro Island–Mason Inlet and Smith Creek subwatersheds.
Hydrology 09 00218 g001
Figure 2. Summary of workflow steps to compute a wetland vulnerability assessment.
Hydrology 09 00218 g002
Figure 3. Flood exposure results of the Masonboro Island–Mason Inlet and Smith Creek subwatersheds in New Hanover County, NC (left map) and City of New Bern–Neuse River and the City of New Bern–Trent River subwatersheds in New Hanover County, NC (right map).
Hydrology 09 00218 g003
Figure 4. NDVI time series wetland sensitivity results for the Masonboro Island–Mason Inlet and Smith Creek subwatersheds in New Hanover County, NC.
Hydrology 09 00218 g004
Figure 5. Wetland vulnerability assessment of the Masonboro Island–Mason Inlet and Smith Creek subwatersheds, NC showing categorical vulnerability rankings.
Hydrology 09 00218 g005
Figure 6. Wetland vulnerability assessment results, government-owned parcels, and locations identified in the field during site visits in the Page’s Creek area within the Masonboro Island–Mason Inlet subwatershed, NC overlaid on NAIP imagery.
Hydrology 09 00218 g006
Figure 7. Wetland vulnerability assessment results, government-owned parcels, and locations identified in the field as potential NBS sites in the Trent River subwatershed in New Bern, NC overlaid on NAIP imagery.
Hydrology 09 00218 g007
Figure 8. Overlap between the highest vulnerability areas and government-owned parcels of the Masonboro Island–Mason Inlet superimposed on NAIP imagery; (A) shows the Page’s Creek area, (B) shows the Howe’s Creek area, (C) shows the areas around Wrightsville Beach before the main island, and (D) shows Masonboro Island.
Hydrology 09 00218 g008
Figure 9. Overlap between the highest vulnerability areas and government-owned parcels in both New Bern study areas superimposed on NAIP imagery; (A) shows the Oaks Rd parcel, (B) shows the vulnerable islands in the Neuse River, (C) shows the Lawson Creek Park parcel, and (D) shows the Clermont parcel.
Hydrology 09 00218 g009
Table 1. Wetland vulnerability assessment datasets and sources.
DatasetData SourceData Format (Spatial Resolution)Link to Dataset and Dataset Technical Documentation
High-tide floodingNOAARaster (~2.7 m)https://coast.noaa.gov/slrdata/ (accessed on 1 January 2022)
Sea level rise (1–10 ft)NOAAVectorhttps://coast.noaa.gov/slrdata/ (accessed on 1 January 2022)
FEMA special flood hazard areas (100- and 500-yr)NC FRISVectorhttps://fris.nc.gov/fris/Home.aspx?ST=NC (accessed on 1 January 2022)
Landsat 8 multispectral imagery derived indices (NDVI, NDMI, and SAVI); 12 time steps 2014–2021USGSRaster (30 m)https://earthexplorer.usgs.gov/ (accessed on 1 January 2022)
Wetlands and wetland restoration areasNCDEQVectorhttps://deq.nc.gov/about/divisions/coastal- management/coastal-management-gis- data/download-coastal-wetlands-spatial (accessed on 1 January 2022)
ParcelsNC One MapVectorhttps://www.nconemap.gov/pages/parcels (accessed on 1 January 2022)
Table 2. Flood exposure risk for the four study areas as total area (acres) and a percentage of the HUC affected.
Masonboro Island–Mason InletSmith Creek
Flood exposure levelArea impacted% of HUC-12
impacted
Areas impacted% of HUC-12
impacted
Low214.01.6%262.53.1%
Medium209.31.6%68.20.8%
High2265.517.1%300.63.5%
City of New Bern–Neuse RiverCity of New Bern–Trent River
Flood exposure levelAreaimpacted% of HUC-12
impacted
Areaimpacted% of HUC-12
impacted
Low428.57.5%108.61.9%
Medium118.02.1%55.00.9%
High293.75.1%170.62.9%
Table 3. Summary of the NDVI-based time series analysis z-score results for our four study areas in acres and as a percentage of the HUC-12 impacted.
Masonboro Island–Mason InletSmith Creek
Time series z-score trendArea impacted% of HUC-12
impacted
Area impacted% of HUC-12
impacted
Increasing192.31.4%156.41.8%
No Trend2225.416.8%2323.927.2%
Decreasing3226.124.3%1254.514.7%
City of New Bern–Neuse RiverCity of New Bern–Trent River
Time series z-score trendArea impacted% of HUC-12
impacted
Area impacted% of HUC-12
impacted
Increasing94.81.6%39.70.7%
No Trend1268.022.0%1224.120.9%
Decreasing732.412.7%628.210.7%
Table 4. Combined wetland vulnerability assessment metrics for the four study areas in acres and as a percentage of the HUC-12 impacted.
Masonboro Island–Mason InletSmith Creek
Wetland
Vulnerability Rating
Areaimpacted% of HUC-12
impacted
Area impacted% of HUC-
12 impacted
Low196.81.5%245.92.9%
Medium743.85.6%273.93.2%
High1555.511.7%70.20.8%
City of New Bern–Neuse RiverCity of New Bern–Trent River
Wetland Vulnerability RatingArea impacted% of HUC-12
impacted
Area impacted% of HUC-12
impacted
Low381.06.6%94.01.6%
Medium325.95.7%158.42.7%
High40.90.7%38.60.7%
Table 5. Highest vulnerability parcels in the Smith Creek subwatershed, Masonboro Island–Mason Inlet, Neuse subwatershed, and the Trent River watershed.
Parcel Name Total Parcel Area (ha)Total Area
Vulnerable (ha)
% of Parcel Vulnerable
Smith Creek
Marne Dr Tract20.115.3626.68
Lot 19A Princess Place Park 0.260.0833.84
PT Love5.512.0637.46
Masonboro Island–Mason Inlet
Landfall Natural & Scenic Preservation Area 167.2345.0166.94
Channel Acres1.921.1359.03
Landfall Natural & Scenic Preservation Area 217.948.8649.39
Neuse River
Goose Island1.760.5028.7
Bluff island7.041.6924.1
Trim Cypress Island2.430.4418.4
Oaks Rd1.110.1413.4
Trent River
Lawson Creek Park56.515.7810.2
Clermont5.910.142.53
Publisher’s Note: MDPI stays neutral with regard to jurisdictional claims in published maps and institutional affiliations.

