Article

Assessing Climate Change Impact on Water Resources in Water Demand Scenarios Using SWAT-MODFLOW-WEAP

1
Department of Civil and Environmental Engineering, Colorado State University, Fort Collins, CO 80521, USA
2
Zienkiewicz Centre for Computational Engineering ZC2E, College of Engineering, Swansea University Bay Campus, Swansea SA1 8EN, UK
*
Authors to whom correspondence should be addressed.
Hydrology 2022, 9(10), 164; https://doi.org/10.3390/hydrology9100164
Submission received: 22 August 2022 / Revised: 7 September 2022 / Accepted: 19 September 2022 / Published: 22 September 2022

Abstract

:
In this article, we present the use of the coupled land surface model and groundwater flow model SWAT-MODFLOW with the decision support tool WEAP (Water Evaluation and Planning software) to predict future surface-water abstraction scenarios in a complex river basin under conditions of climate change. The modelling framework is applied to the Dee River catchment in Wales, United Kingdom. Regarding hydrology, the coupled model improves overall water balance and low-streamflow conditions compared with a stand-alone SWAT model. The calibrated SWAT-MODFLOW is employed with high-resolution climate model data from the UKCP18 project with the future scenario of RCP85 from 2020 to 2040. Then, water supply results from SWAT-MODFLOW are fed into WEAP as input for the river reach in the downstream region of the river basin. This system is utilized to create various future scenarios of the surface-water abstraction of public water supply in the downstream region—maximum licensed withdraw, 50% authorized abstractions, monthly time series with 1% increases in water use, and maximum water withdraw per year based on historical records repeated every year with 1% increases in water use—to estimate the unmet demands and streamflow requirement. This modelling approach can be used in other river basins to manage scenarios of supply and demand.

1. Introduction

In the last few decades, there has been growing stress on surface-water and groundwater resources around the world (e.g., [1,2]) due to climate change, population growth, and the degradation of historical water sources. There is a need to balance available future water supply with future increasing demand to provide reliable water supplies to various stakeholders and uses (domestic, agricultural, industrial, energy).
This can be performed using Integrated Water Resources Management (IWRM) at the catchment and watershed levels, which heavily depend on the use of computer model simulations that capture the underlying hydrological processes and surface-water/groundwater allocations. Examples of simulation models include HydroGeoSphere—Integrated Hydrologic Models [3]; Integrated Water Flow Model IWFM [4]; MIKE-SHE [5]; and Penn State Integrated Hydrological Modelling System PIHM [6].
Often-used hydrologic models for IWRM include: Soil and Water Assessment Tool (SWAT) [7], a watershed modelling code that simulates the principal hydrologic fluxes at a daily time step; MODFLOW [8], a groundwater modelling code that simulates groundwater head and associated flow rates in a heterogeneous aquifer system; and, to overcome the subsurface and surface process limitations in SWAT and MODFLOW, respectively, the coupled modelling code SWAT-MODFLOW [9], which has been used in numerous studies for water supply estimation and water management (e.g., [10,11,12,13]). However, these models represent the physical world (i.e., model spatial discretization and process simulation) differently, and each is limited to its simulation domain, with each having advantages and disadvantages when simulating biophysical processes and using computational resources [14].
A key part of IWRM is the estimation of future climate (precipitation, climate) and its impact on water supply and water demand. The impact of climate change on water resources needs to be quantified from regional to basin scales with the purpose of facilitating water resources planning and management to cope with future challenges. Global climate models (GCMs) are frequently utilized to simulate future climate dynamics and project future temperatures and rates of precipitation for hydrologic assessment (e.g., [15,16]). Additionally, many studies show that future climate may be more extreme, not only in the sense of more storms and flooding, but also with more severe droughts and water scarcity problems [17,18,19].
Typically, computer models are utilized to access reservoir operation, water allocation, flood risk assessment, drought conditions, groundwater development, water quality, irrigation operation, and the forecasting and control of high water. There are large numbers of software available to simulate problems in water resources management, and they can be mainly divided into two groups: simulation models [20,21] and allocation models (optimization or decision-making system models).
Simulation models address certain limitations of allocation models by solving physically based flow equations to offer spatially distributed water resources outputs for several parameters (runoff, water table elevation, etc.) [21]. Allocation (optimization) models are frequently used in the applied problem of water resources management. These models optimize water allocation from various resources to meet a range of demands and to find which design and operating policy would best meet the identified objectives under a set of priorities and constraints [20]. Allocation models are used in several applications of water resources, such as the development of a planning framework for short-term scenarios (land-use change) and long-term scenarios (climate change) [22]; simulation crop evapotranspiration demand for agricultural land [23]; and modelling current and future water demands [24,25]. The main advantage of allocation models is their lower demand for computing resources and data. However, these models have a lack of ability to simulate feedbacks to the physical system and have limited ability to simulate connections within complex, heterogeneous, conjunctive management water systems.
In IWRM, ideally, a combined simulation–allocation approach can be used, with the simulation model accounting for all major hydrological processes, fluxes, and state variables within a river basin or watershed system. For example, a fully integrated surface–groundwater model would be able to assess spatially distributed hydrological variables such as river flow, groundwater table, and soil moisture content. More significantly, it would also be able to simulate the surface water and groundwater interaction in a heterogeneous and complex domain, as well as the land-use change impact on these variables.
The accuracy of these kinds of models is the central part of an IWRM system where water allocation models are driven by the outputs from the integrated surface–groundwater model to further simulate water management operations for defined operating policies and priorities under different scenarios of climate change. This integration framework is beneficial to grasp how the hydrological cycle is affected by management decisions, and vice versa.
The applications of coupled simulation–allocation models in water resources are abundant, for instance, the evaluation of the reliability between water supply and demand in climate change scenarios using coupled SWAT- RIBASIM [26]. Within the study, the SWAT model was utilized to simulate the basin hydrology for the baseline and future climate periods, while the RIBASIM model was used for water allocation based on the current supply–demand chain and predefined governmental water allocation rules for different water uses. In addition, Dehghanipour et al. [27] used a linked MODFLOW-WEAP model to investigate management alternatives that maintain agricultural production. Another application included exploring the future climate change impact on the agricultural water supply capacity of irrigation facilities using an integrated modelling framework that included a water balance network model (MODSIM) and SWAT model [28]. Ashraf Vaghefi et al. [29] examined the water productivity of irrigated wheat and maize yields in semi-arid regions with coupled SWAT-MODSIM considering dynamic irrigation requirements instead of constant-demand time series. A linked SWAT-WEAP model was used to study the climate change impact on the abstraction capability of key water sectors [30]. The SWAT model was used to simulate future streamflow; then, streamflow outputs were used to estimate total unmet demands. The WEAP model was utilized for the evaluation of the unmet demands system under static, increasing, and decreasing surface-water demand scenarios. No study, however, included integrated hydrologic modelling using coupled surface–subsurface modelling, such as SWAT-MODFLOW [9], into an allocation modelling scheme, which may have important implications for the overall movement of water within a watershed system.
The objective of this article is to evaluate the impacts of likely future water use for the public water supply on the water resources in a heavily managed watershed system, under the stress of future climate change. This objective is achieved by linking the surface/subsurface hydrologic model SWAT-MODFLOW to the Water Evaluation and Planning (WEAP) software program to simulate hydrologic fluxes and different scenarios of water use for urban water supply in future climate scenarios. The linked simulation/allocation modelling system is demonstrated for the highly managed River Dee watershed in Wales, United Kingdom, wherein surface water is abstracted for public water supply in the city of Chester, in the downstream area of the watershed. The SWAT-MODFLOW model is constructed and then tested against streamflow and groundwater head; then, it is used with climate projections from the UKCP18 project (NCAR-CCSM4 model) for a future scenario of RCP85 from 2020 to 2040. The simulated streamflow of the SWAT-MODFLOW model with UKCP18 model data is used as the input to the WEAP model to create different scenarios of water use in Chester. We consider four scenarios of water use rate: maximum licensed water abstraction (constant value), 50% of maximum licensed abstraction (constant value), time series of maximum water withdraw per year based on historical records repeated every year with 1% increases in water use, and time series with 1% annual increases in water use. We expect that the methodology proposed herein can be utilized for other managed watersheds to aid with future water management.

2. Materials and Methods

2.1. Study Area

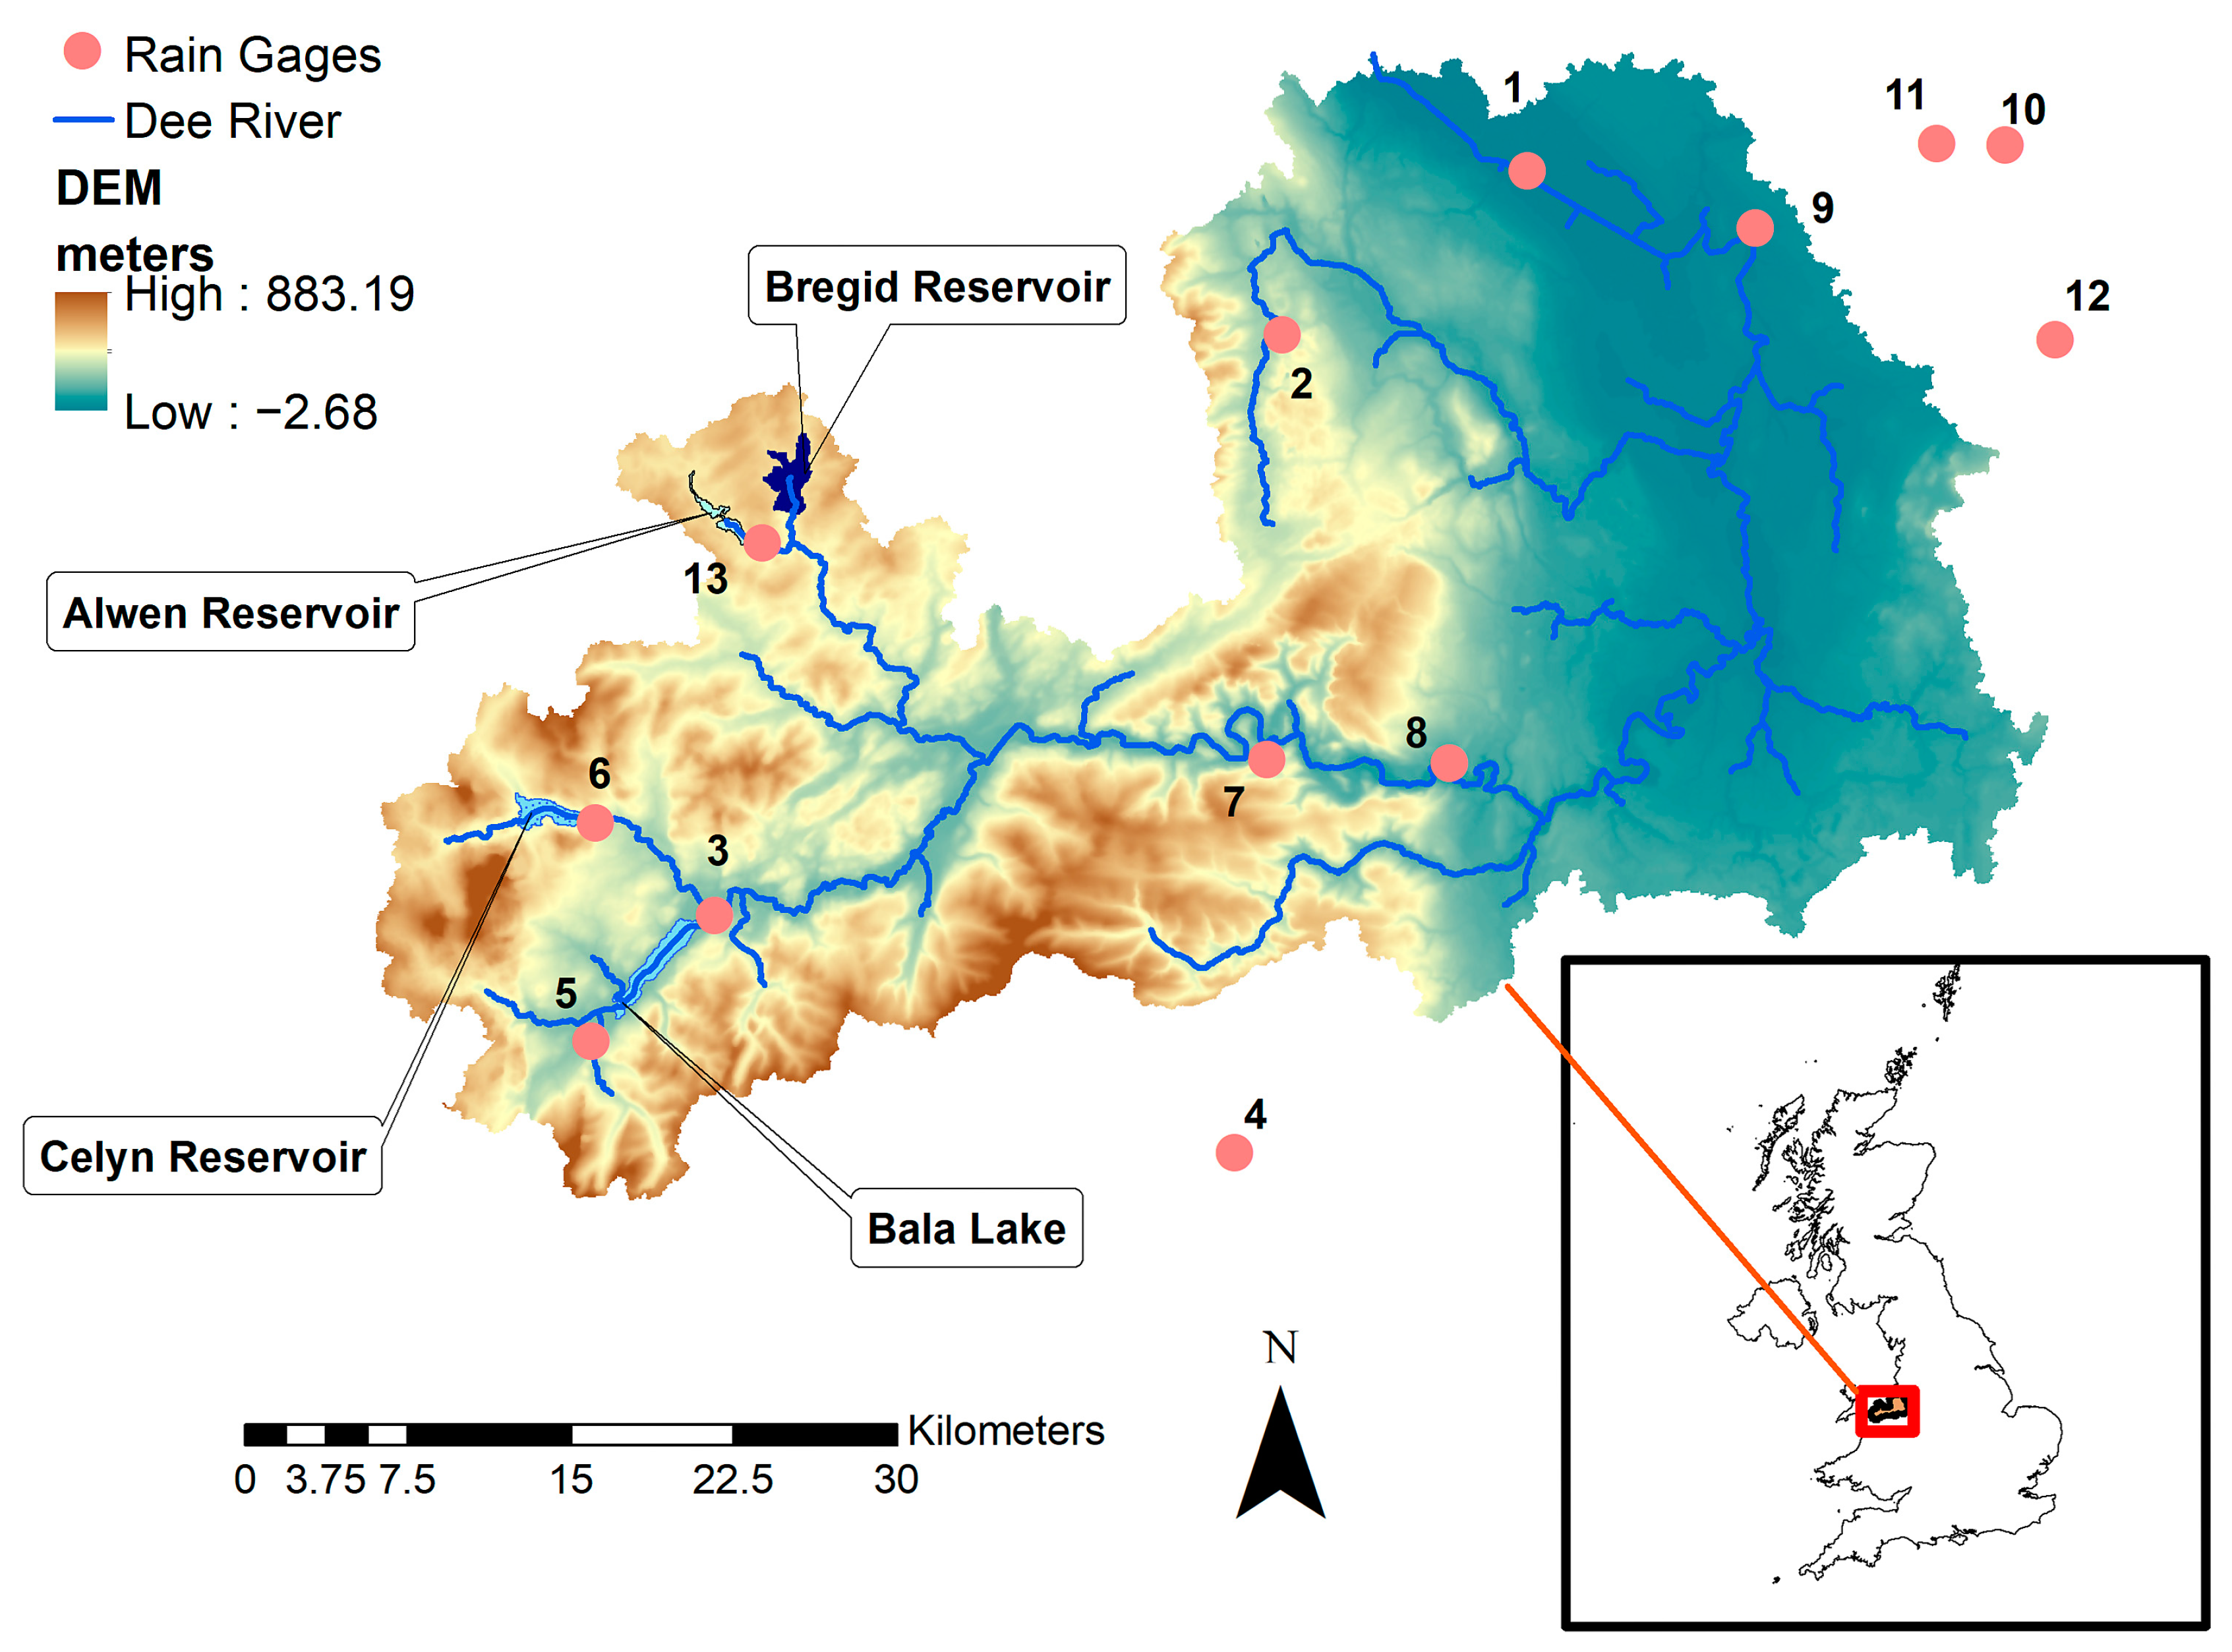
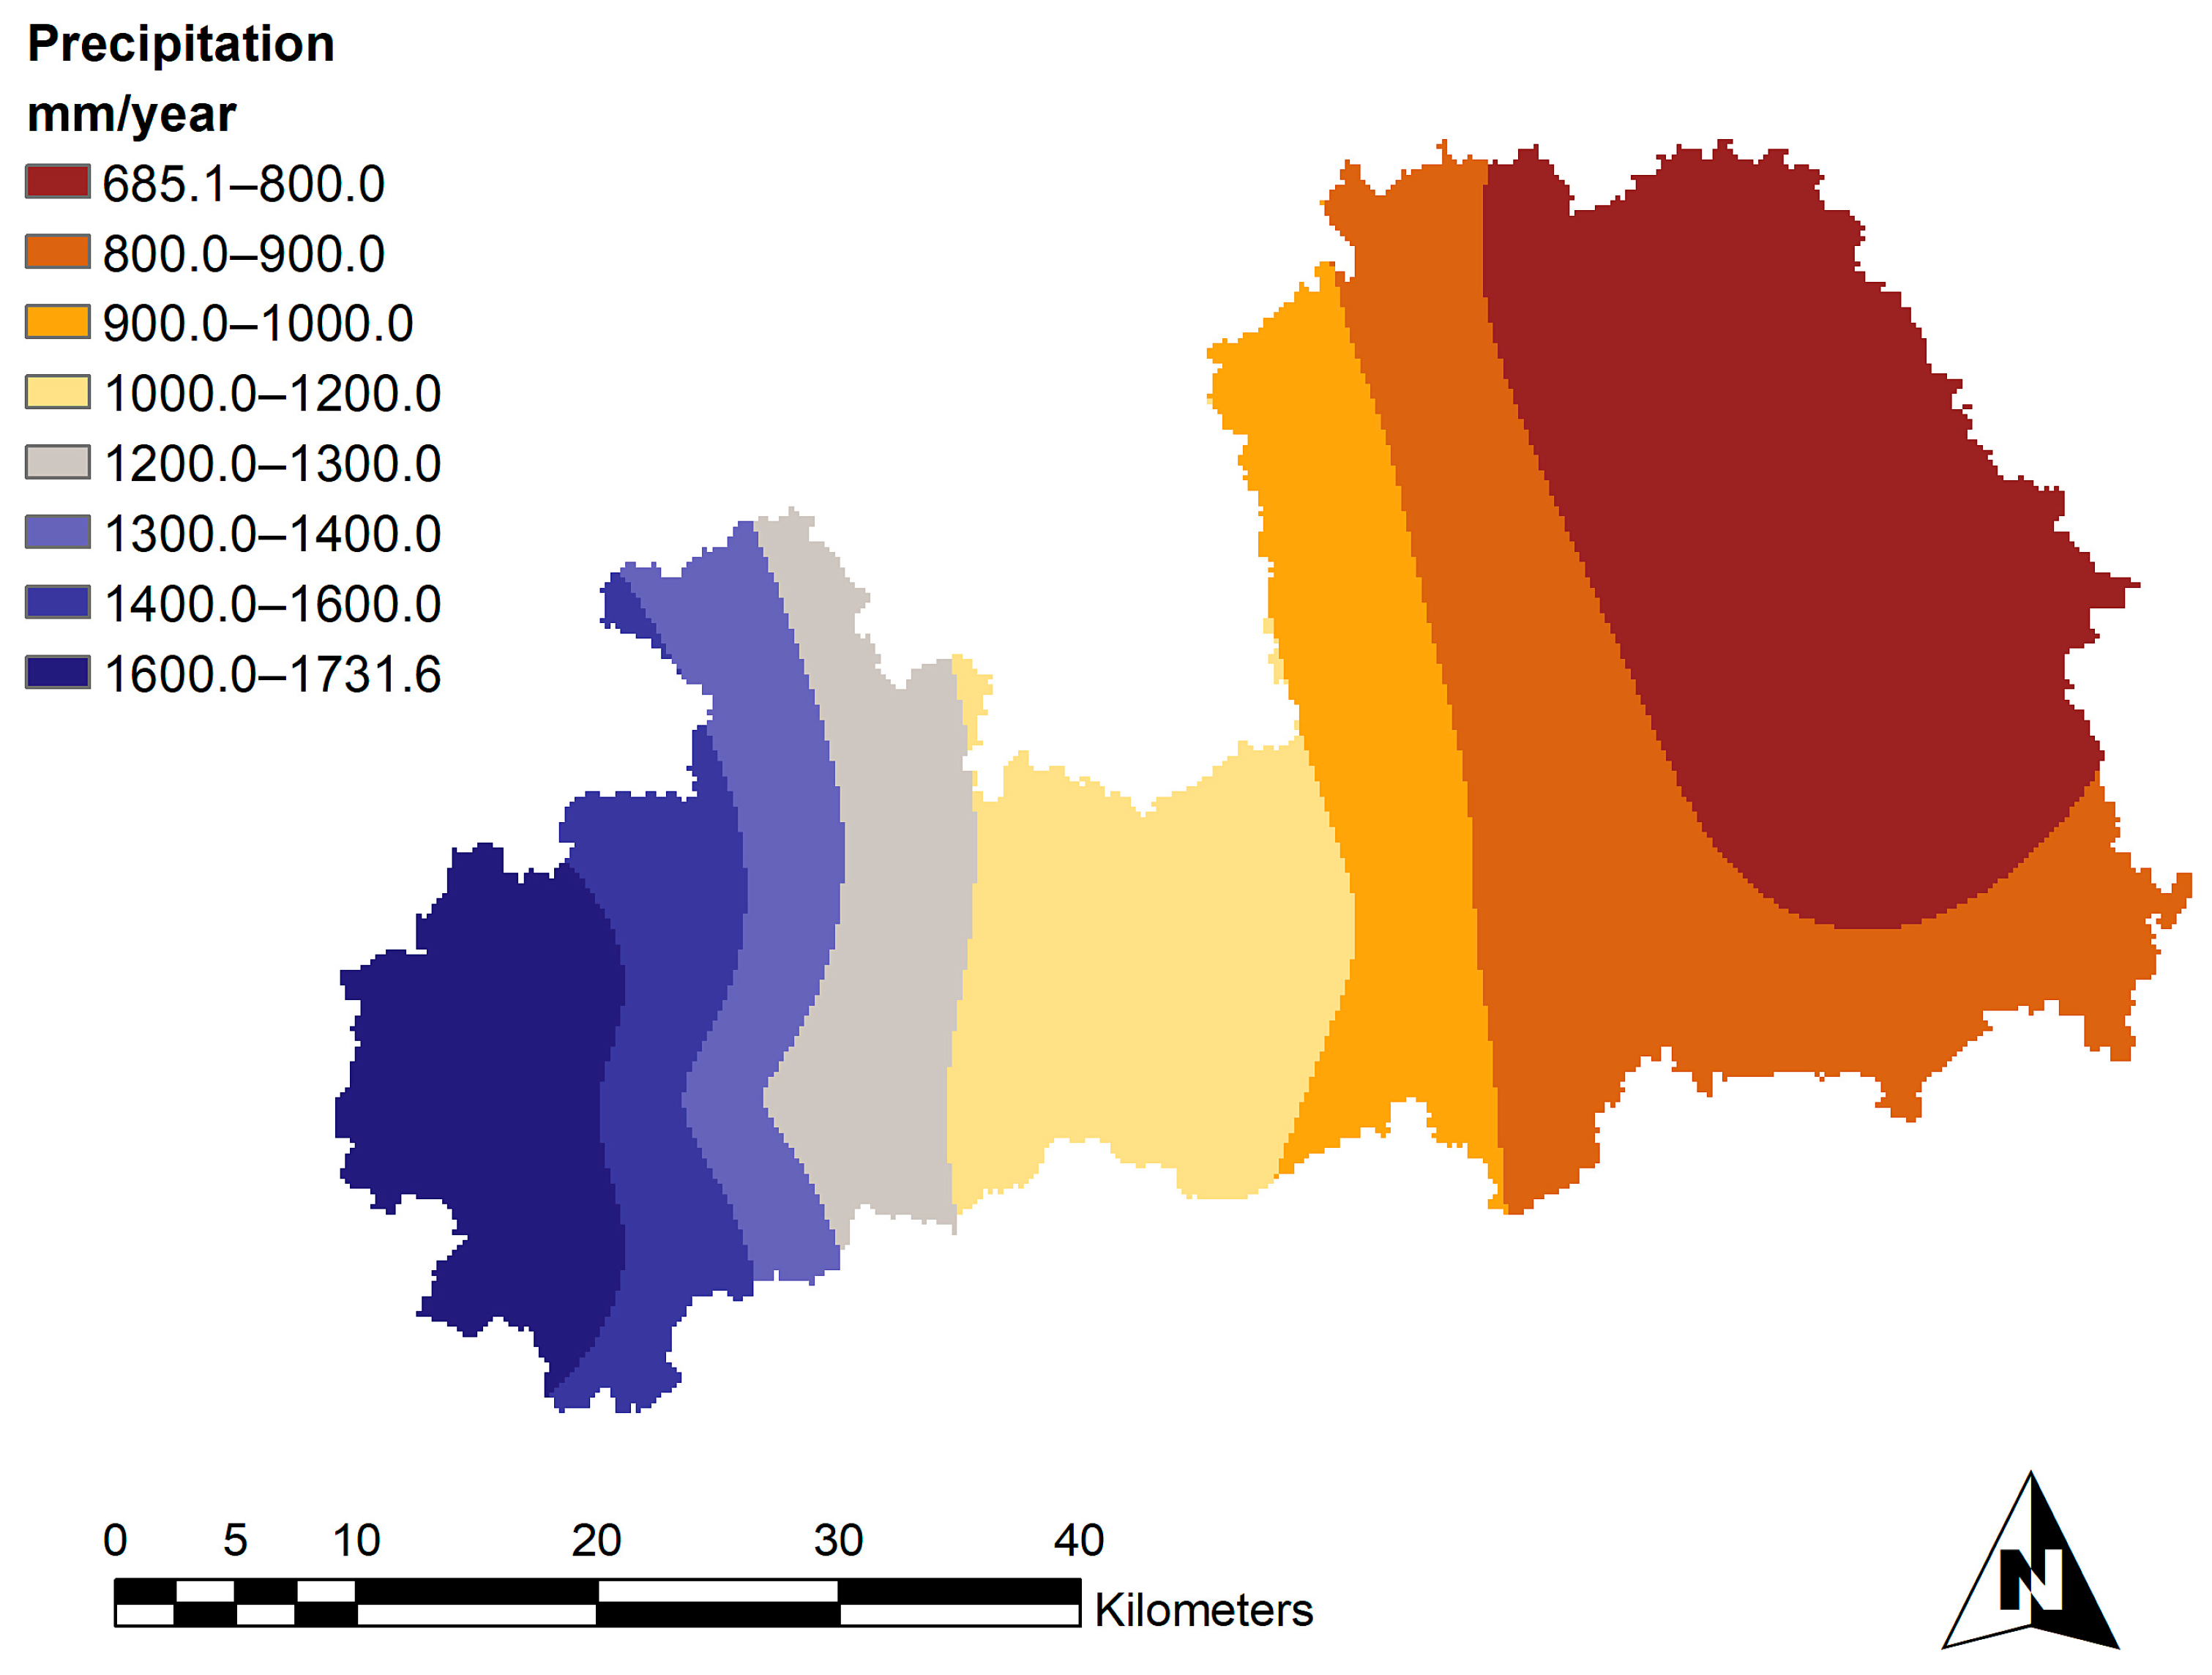
The Dee River flows from the mountains of the Snowdonia National Park in North of Wales in the United Kingdom. The length of the main reach of the river is measured to be 113 km with a watershed area of 2215 km2, as illustrated in Figure 1. The river flows eastward to the border between England and Wales to the City of Chester before discharging into the Irish Sea in the Liverpool Bay. The average annual precipitation over the basin shows a clear west–east declining trend with 1700 mm in the western part quickly reducing to 650 mm in the east, where flat, lowland dominates, as shown in Figure 2.
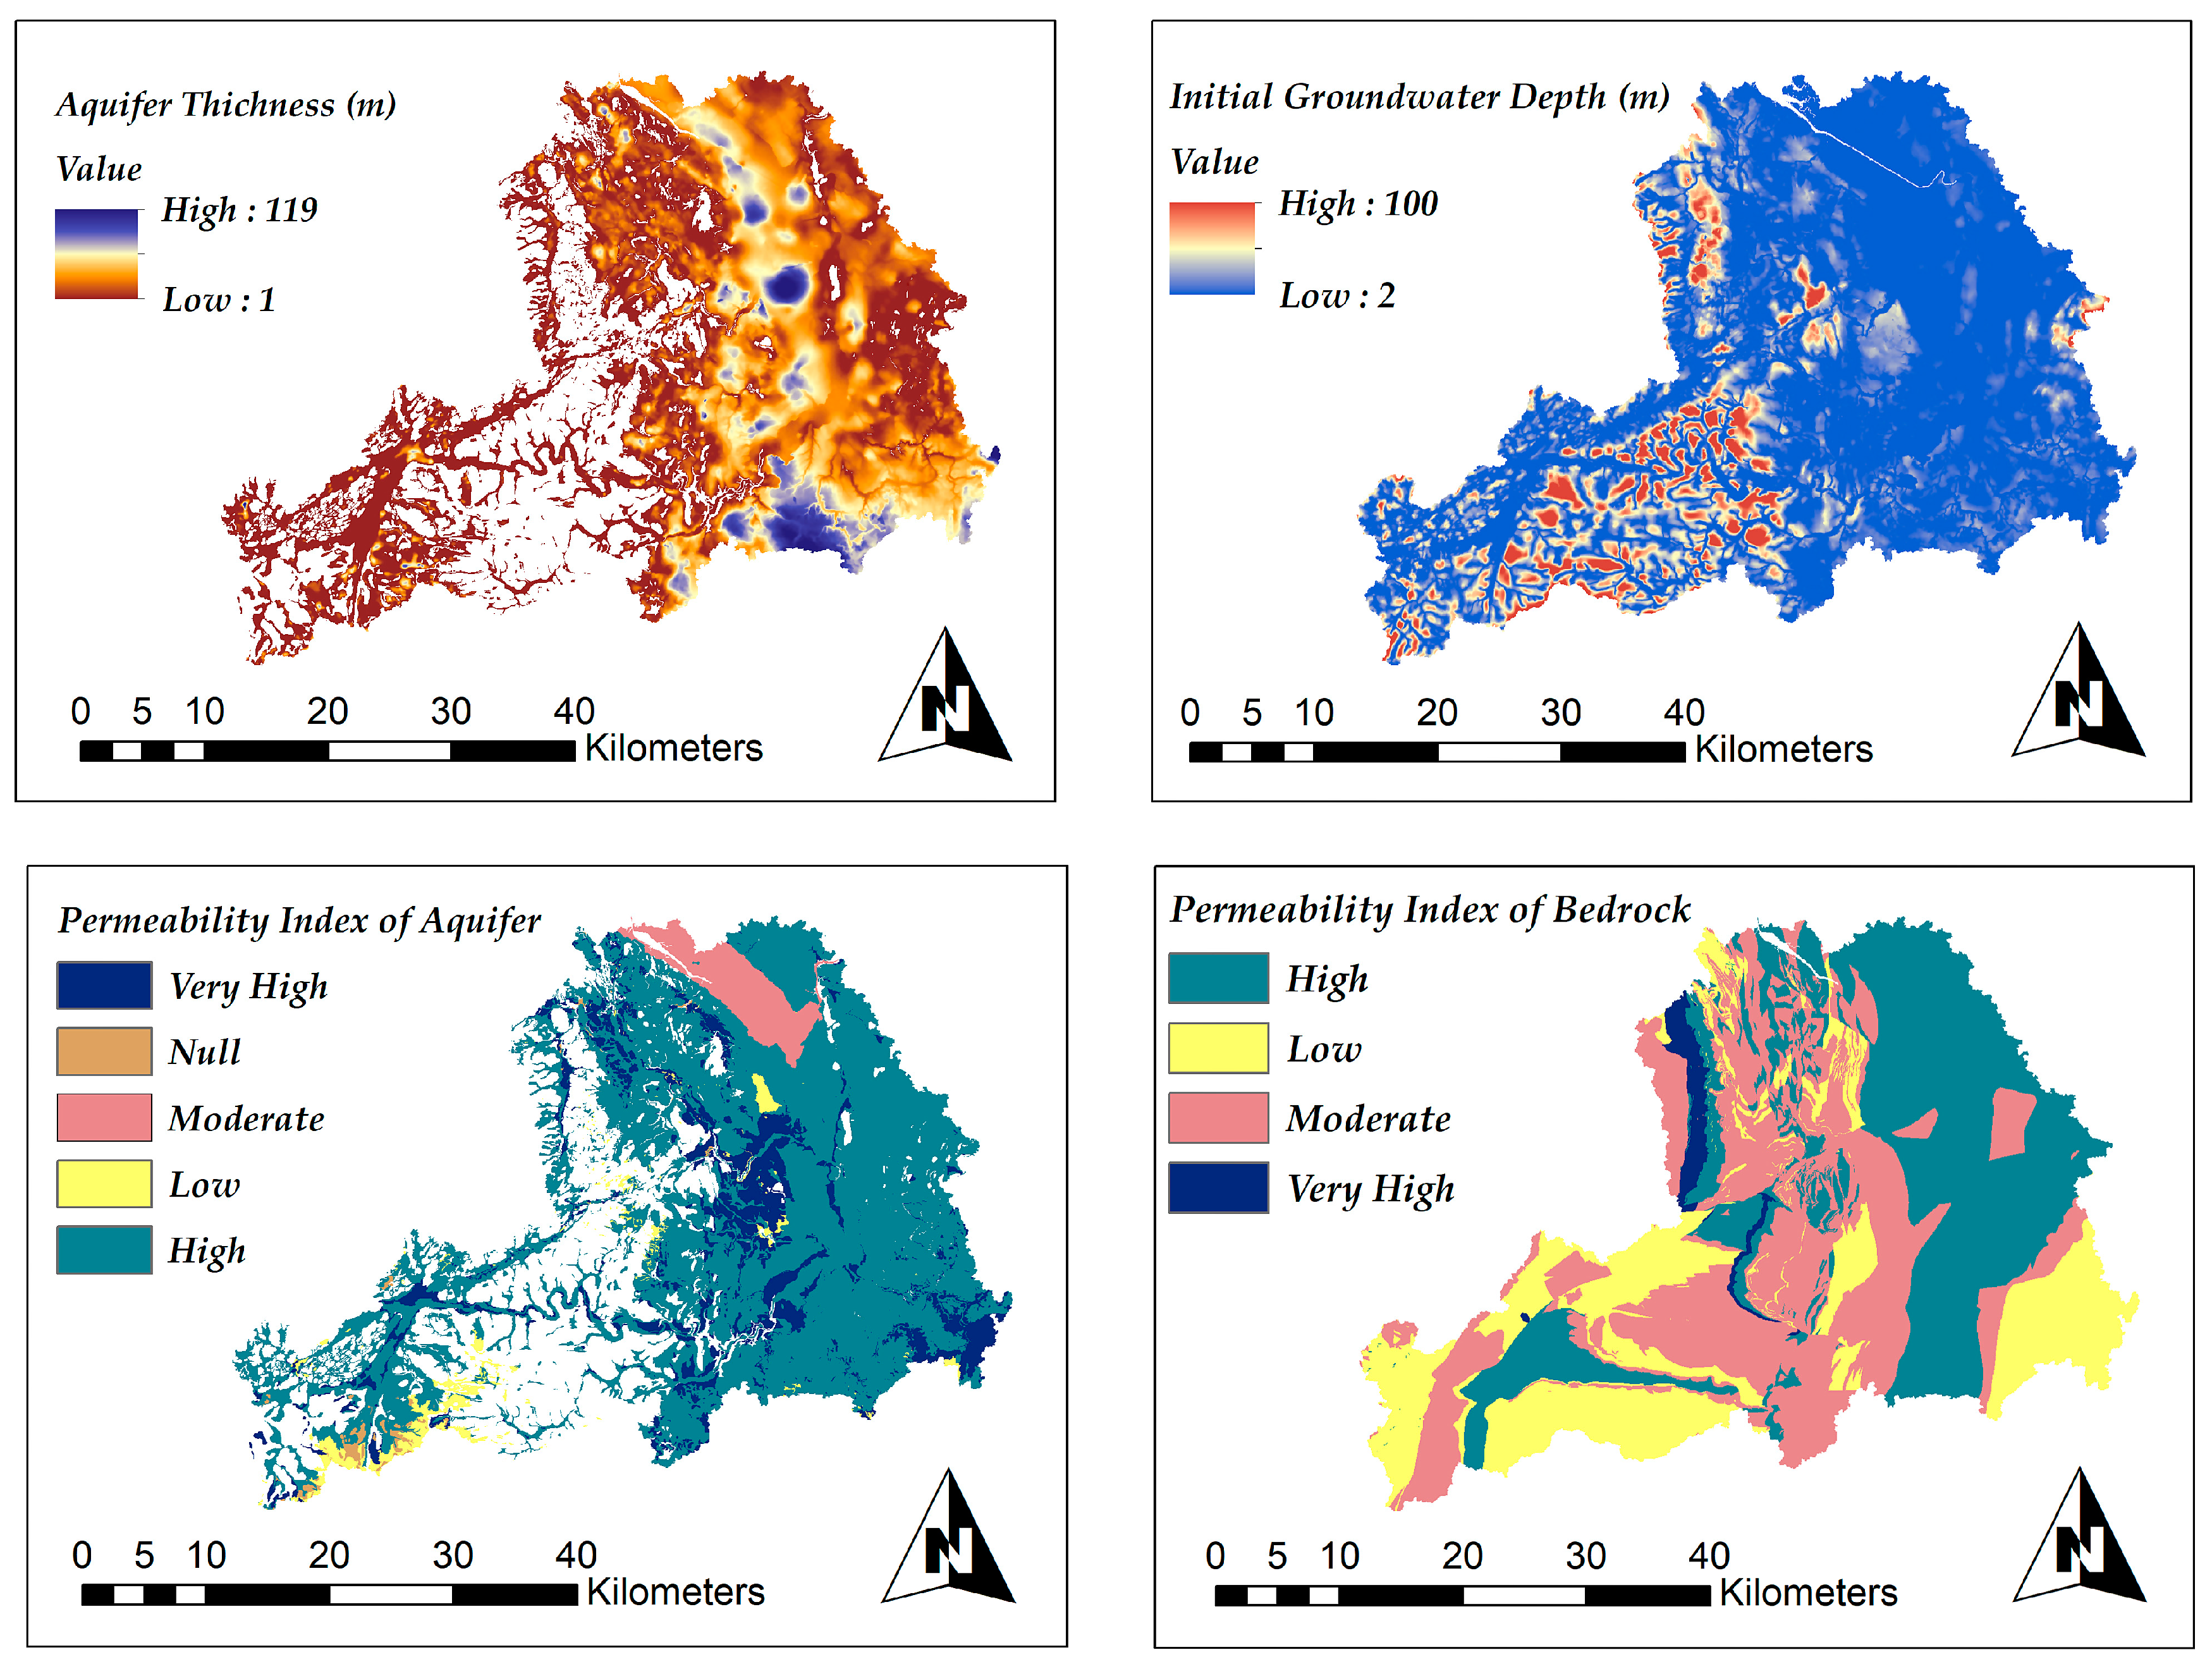
The temporal distribution of annual precipitation also demonstrates a definite seasonal pattern with wet winters (178–578) mm in (December, January, and February) and ordinarily dry summers (165–278 mm) in (June, July, and August). Therefore, the River Dee basin experiences both flooding and droughts in different seasons. Figure 3 presents the hydrogeologic details of the river basin, as obtained based on academic license from the British Geological Survey. Specifically, we report superficial deposit thickness (aquifer thickness), initial depth to water table (50 m resolution), and the permeability indices of the unconsolidated materials and the bedrock material (limestone and chalk).

2.2. Collected Data

Three types of data are collected in this study (Table 1), namely, (1) static datasets, such as DEM, soil-type data, and land use, which are assumed to be static over the study period; (2) the historical observations of river flow, precipitation, and temperature; and (3) the operational data of water abstraction and flow regulation data that represent management practice. The collected data used in this study are summarized in Table 1.
Data screening is conducted on precipitation from rain gauges and the streamflow data from river gauge stations. The screening involves checking raw data, recognizing outliers, and dealing with missing data. The streamflow and precipitation data are subjected to rigorous quality control by the Centre for Ecology and Hydrology (CEH), the British Atmospheric Data Centre (BADC), and the Met Office, respectively.

3. Methodology

3.1. Simulation–Allocation Modelling Using SWAT-MODFLOW-WEAP

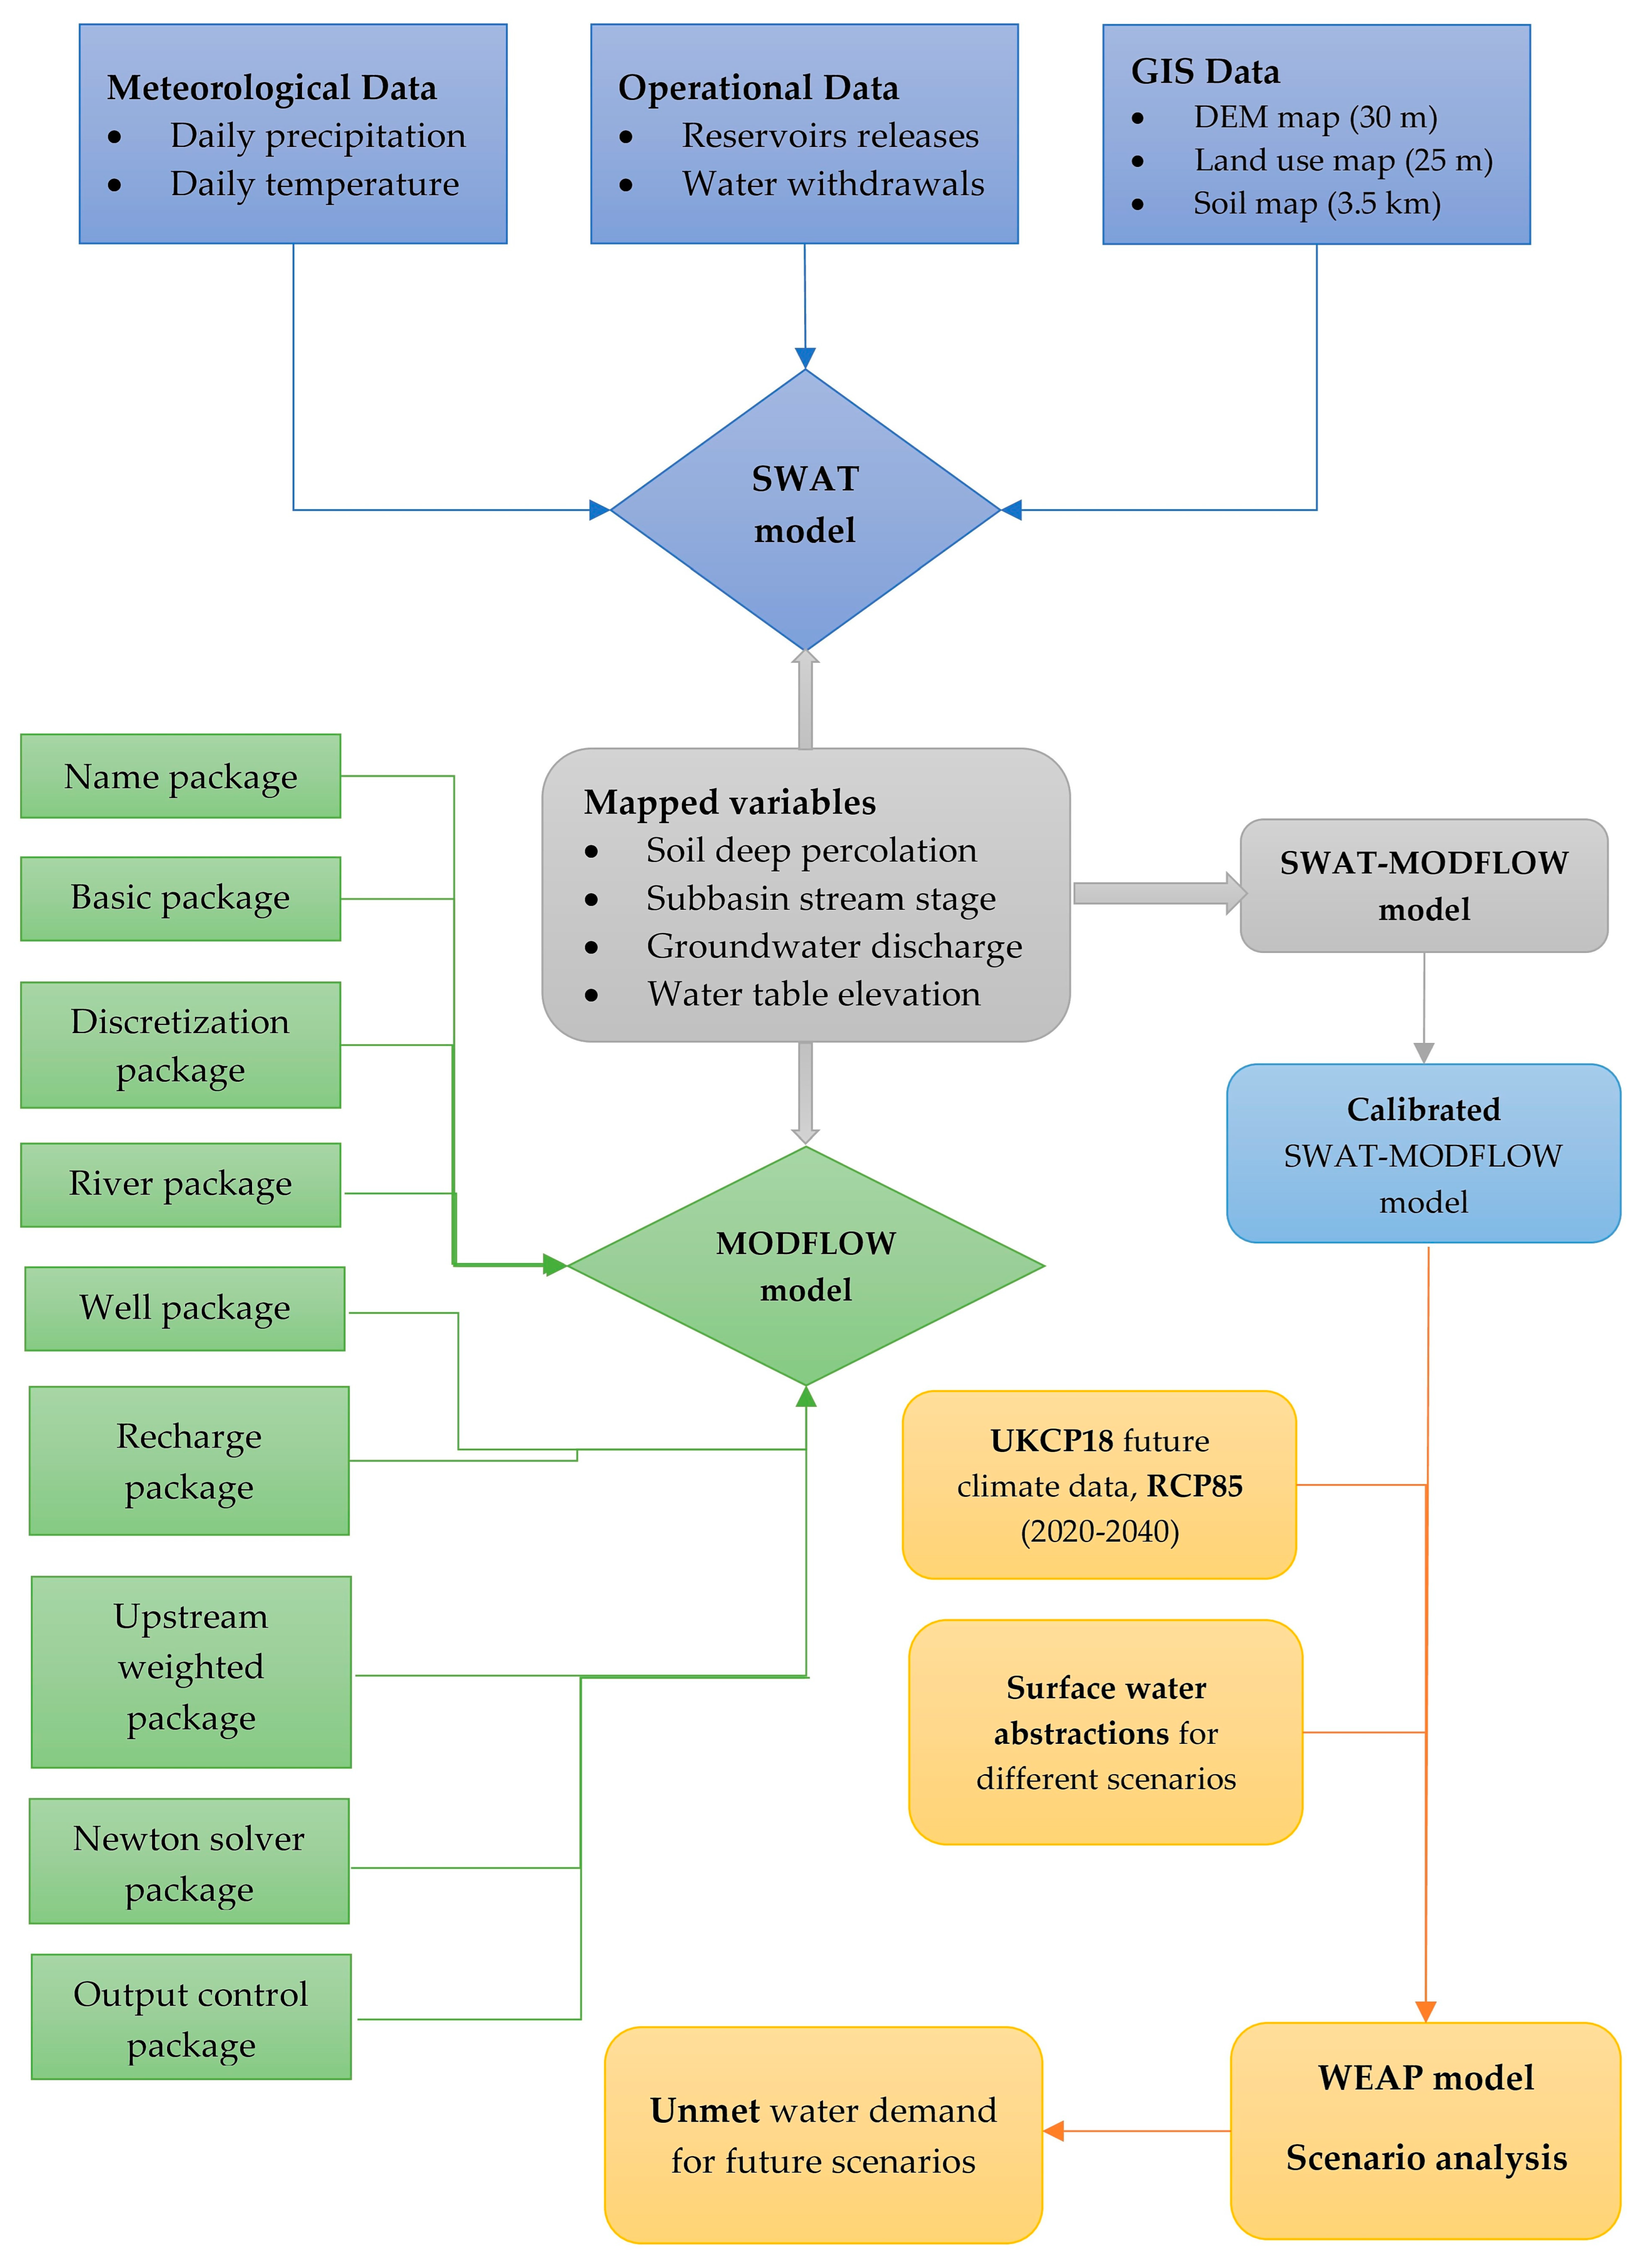
In this study, we use a linked SWAT-MODFLOW-WEAP modelling system together with a high-resolution climate model of UKCP18 for different future scenarios of surface-water uses for public water supply (PWS) in the city of Chester, located in the downstream region of the Dee River basin. The components of this system are presented in Figure 4 and described in the following sections.

3.2. Hydrological Modelling Using SWAT-MODFLOW

3.2.1. Overview of SWAT-MODFLOW Theory

In this study, we use the coupled surface/subsurface modelling code SWAT-MODFLOW to simulate the hydrologic process in the Dee River watershed for both historical and future climate conditions.
The SWAT model [7] is a free, open-source hydrological model that has been used in thousands of applications in different regions of the world. It is a physically based continuous river basin scale, designed to simulate the rainfall–runoff process on various spatial and temporal scales. SWAT is semi-distributed model that uses hydrological response units (HRUs), based on the spatial distribution of topography, land use, and soil characteristics within a watershed, to compute hydrologic fluxes at the land surface and within the subsurface (soil, aquifer). The computations in SWAT are conducted for each HRU and then scaled up to the sub-basin outlets according to the area of the HRU as a fraction of the sub-basin [9]. This results in the HRUs lacking spatial relations typically seen in a fully distributed model but yields a computationally efficient calculation scheme for rapid watershed simulation over long time periods [9].
The division of the watershed facilitates the model to simulate differences in evapotranspiration for different crops and soil. Runoff is separately computed for each HRU and routed to the sub-basin channel to estimate the total runoff for the catchment. The simulation of the hydrology of a watershed can be divided into two main divisions [34]:
  • The land phase of the hydrological cycle, which controls the amount of water, sediment, and nutrient and pesticide loadings to the main channel in each sub-basin;
  • The routing phase, which can be defined as the movement of variables mentioned above through the stream networks of the watershed to the outlet.
Readers can refer to Neitsch et al. [31] for details.
MODFLOW [35] is a three-dimensional, physically based, distributed finite difference groundwater flow model for the variably saturated sub-surface system. A recent addition to MODFLOW is the Newton-based solver algorithm that better satisfies the complex non-linear drying and re-wetting of grid cells in unconfined groundwater systems [8], a problem with previous versions. Available processes to be simulated in MODFLOW include groundwater recharge, vadose zone percolation, evapotranspiration, pumping, discharge to sub-surface drains, and river–aquifer interactions [9]. Most applications are limited to investigating management and climate effects on groundwater and surface–groundwater interactions.
The SWAT model is principally limited in terms of dealing with groundwater flow because of its lumped nature. On the other hand, MODFLOW has difficulty in calculating the distributed groundwater recharge, which is the primary input for the groundwater model, due to the lack of a land surface hydrology model. Therefore, spatiotemporal features in the catchment can be adequately represented [36] if the simplified features of each model are replaced with physically based features from the other model, i.e., recharge from SWAT HRUs is provided to MODFLOW cells, and groundwater discharge to streams from MODFLOW is provided to SWAT channels. More recently, progress was made by Bailey et al. [37] to develop a series of tools that can conveniently couple SWAT with MODFLOW at a daily time step.
The basic process of linking the SWAT and MODFLOW models is to pass HRU-calculated deep percolation (i.e., water that exits the bottom of the soil profile) as recharge to the grid cells of MODFLOW and then pass MODFLOW-calculated groundwater–surface-water fluxes to the stream channels of SWAT [9]. With this method, SWAT computes the volume of overland flow and soil lateral flow to streams; MODFLOW calculates the volume of groundwater discharge to streams; then, SWAT routes the water through the channel networks of the watershed. The surface–groundwater interaction is simulated using the River package of MODFLOW, with Darcy’s law being applied to calculate the volumetric flow of water through the cross-sectional flow area between the aquifer and the stream channel [9]:
Q l e a k = k b e d ( L s t r P s t r ) ( h s t r h g w z b e d )
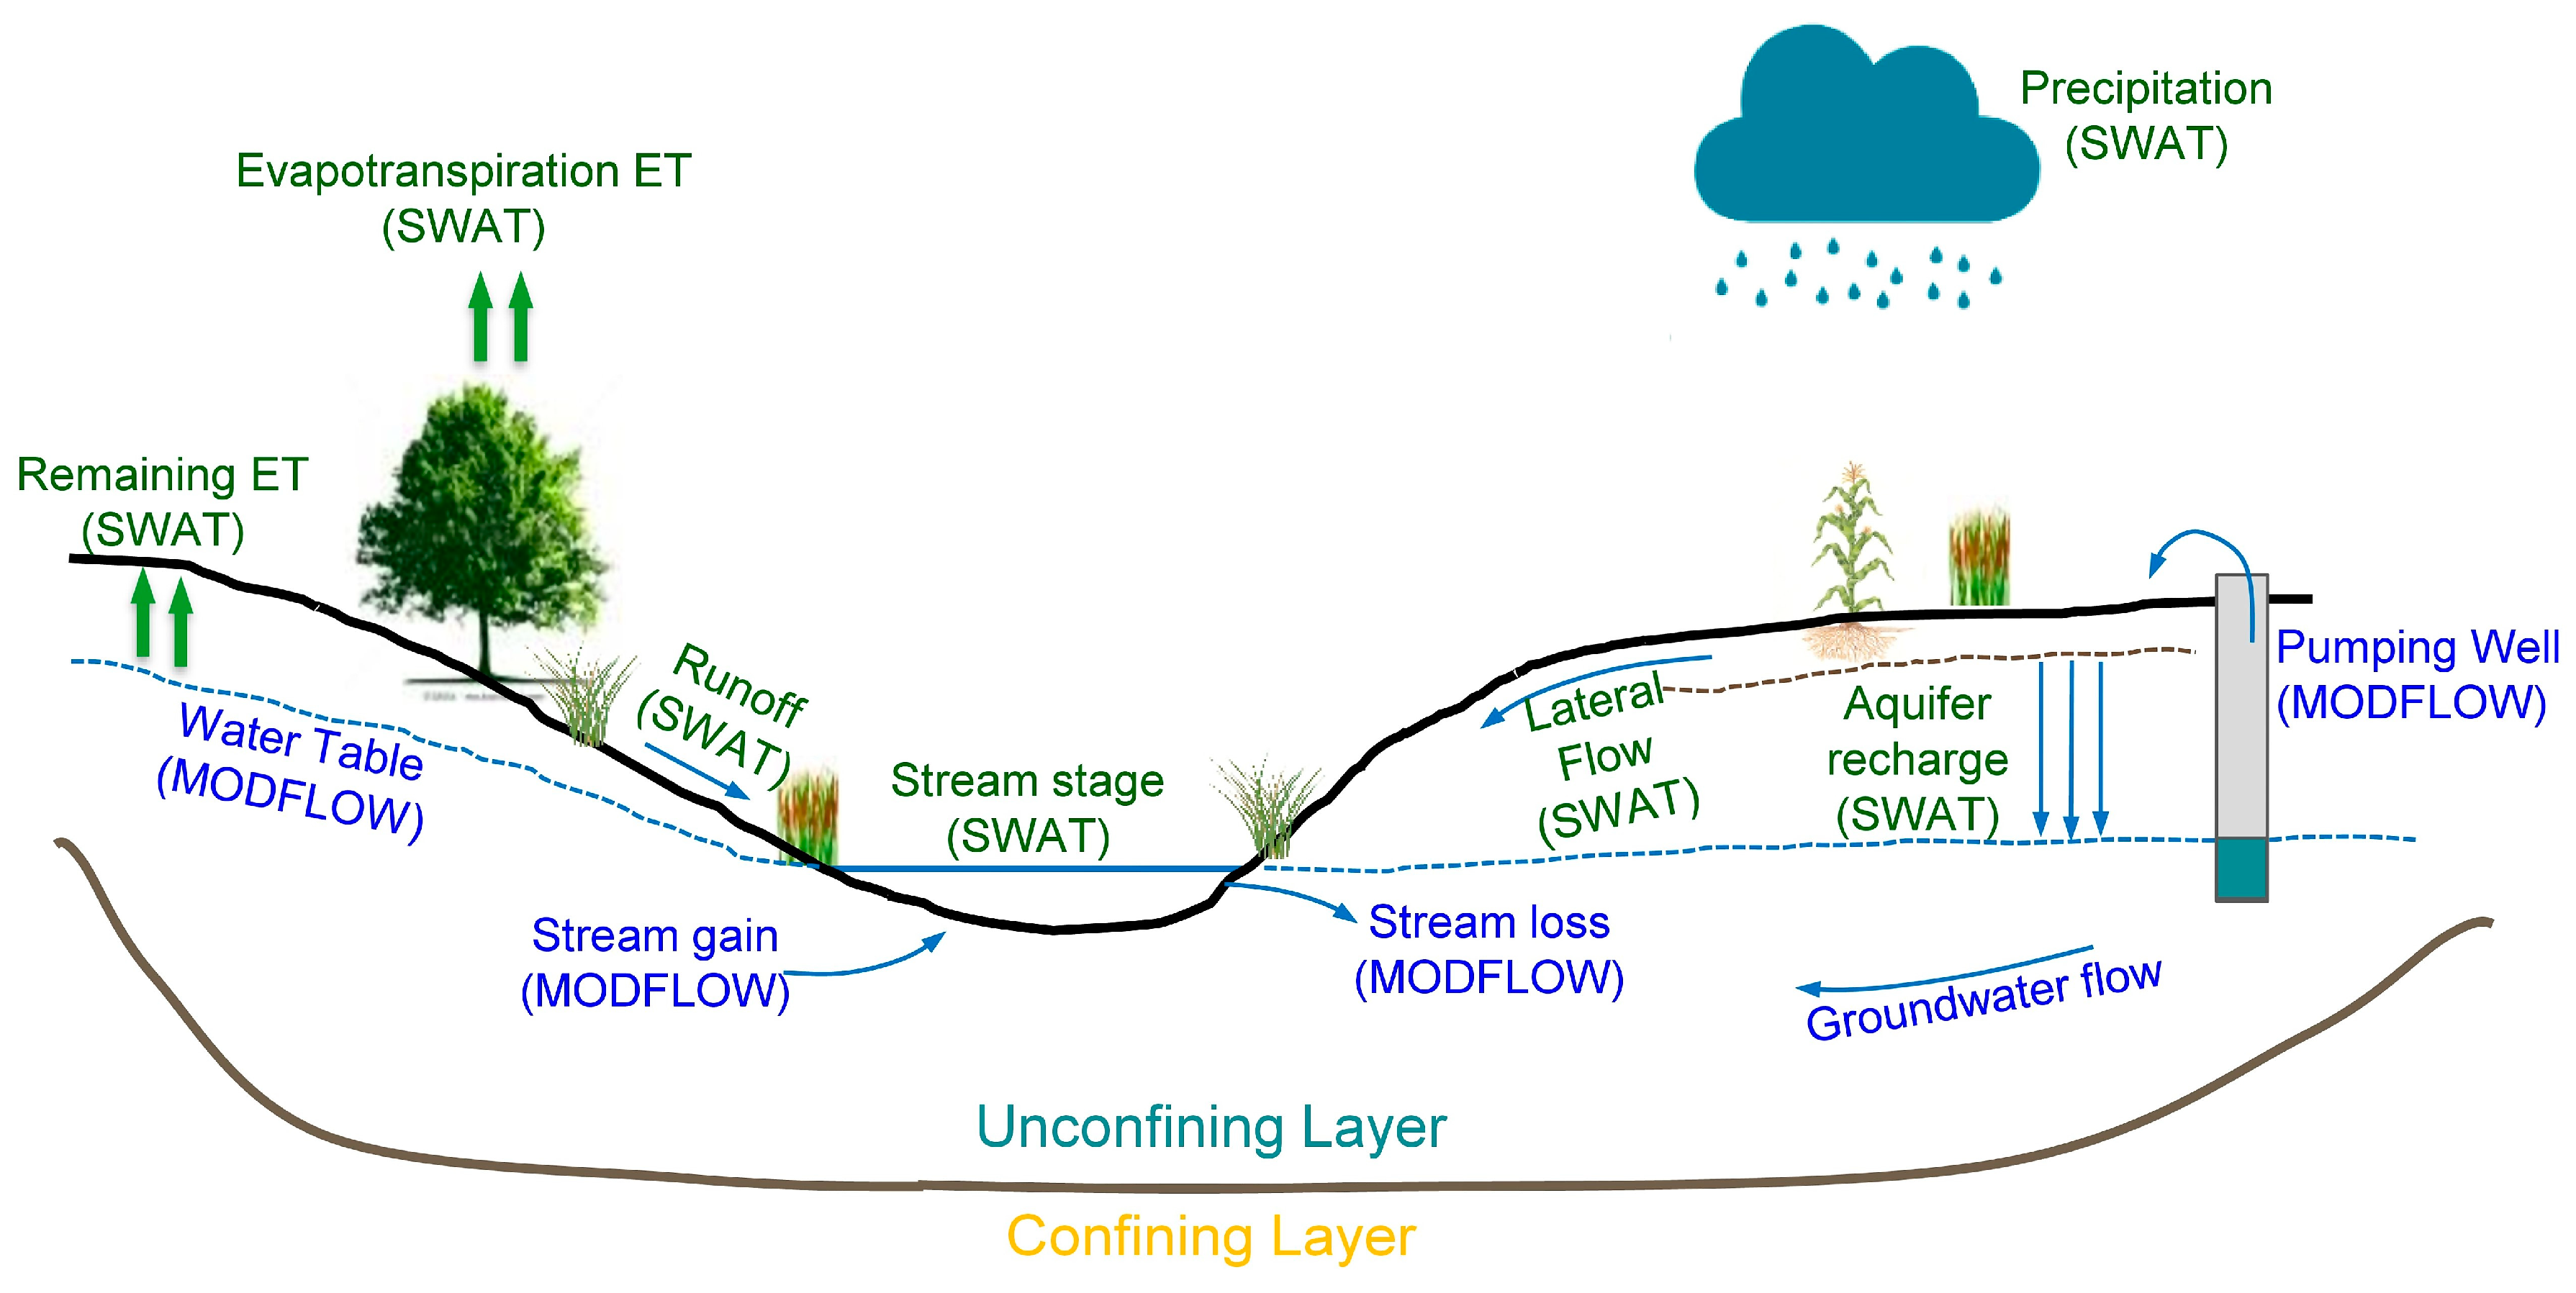
where k b e d is the riverbed hydraulic conductivity (L/T), L s t r is the length of the stream (L), P s t r is the wetted perimeter of the stream (L), h s t r is the river stage (L), h g w is the hydraulic head of groundwater (L), z b e d is the thickness of the riverbed (L), and Q l e a k is negative if groundwater flows to the river (i.e., groundwater hydraulic head h g w is above river stage h s t r ), and positive if river water seeps into the aquifer. Figure 5 shows the schematic representation of the water balance of the SWAT-MODFLOW model, indicating the processes simulated, respectively, by SWAT and MODFLOW [9].
Data are passed between the models using ’mapping’ subroutines that relate HRUs to MODFLOW grid cells and MODFLOW river cells to SWAT stream channels [9]. The main elements of this mapping scheme are: HRUs; Disaggregated HRUs (DHRUs), which divide each original HRU into individual, contiguous areas within a sub-basin, allowing HRU calculations to be geo-located; MODFLOW grid cells; MODFLOW river cells; and SWAT stream channels [9]. The geographical connections among these objects are determined using GIS shapefiles, with connection data placed in text files for input into the SWAT-MODFLOW modelling code.
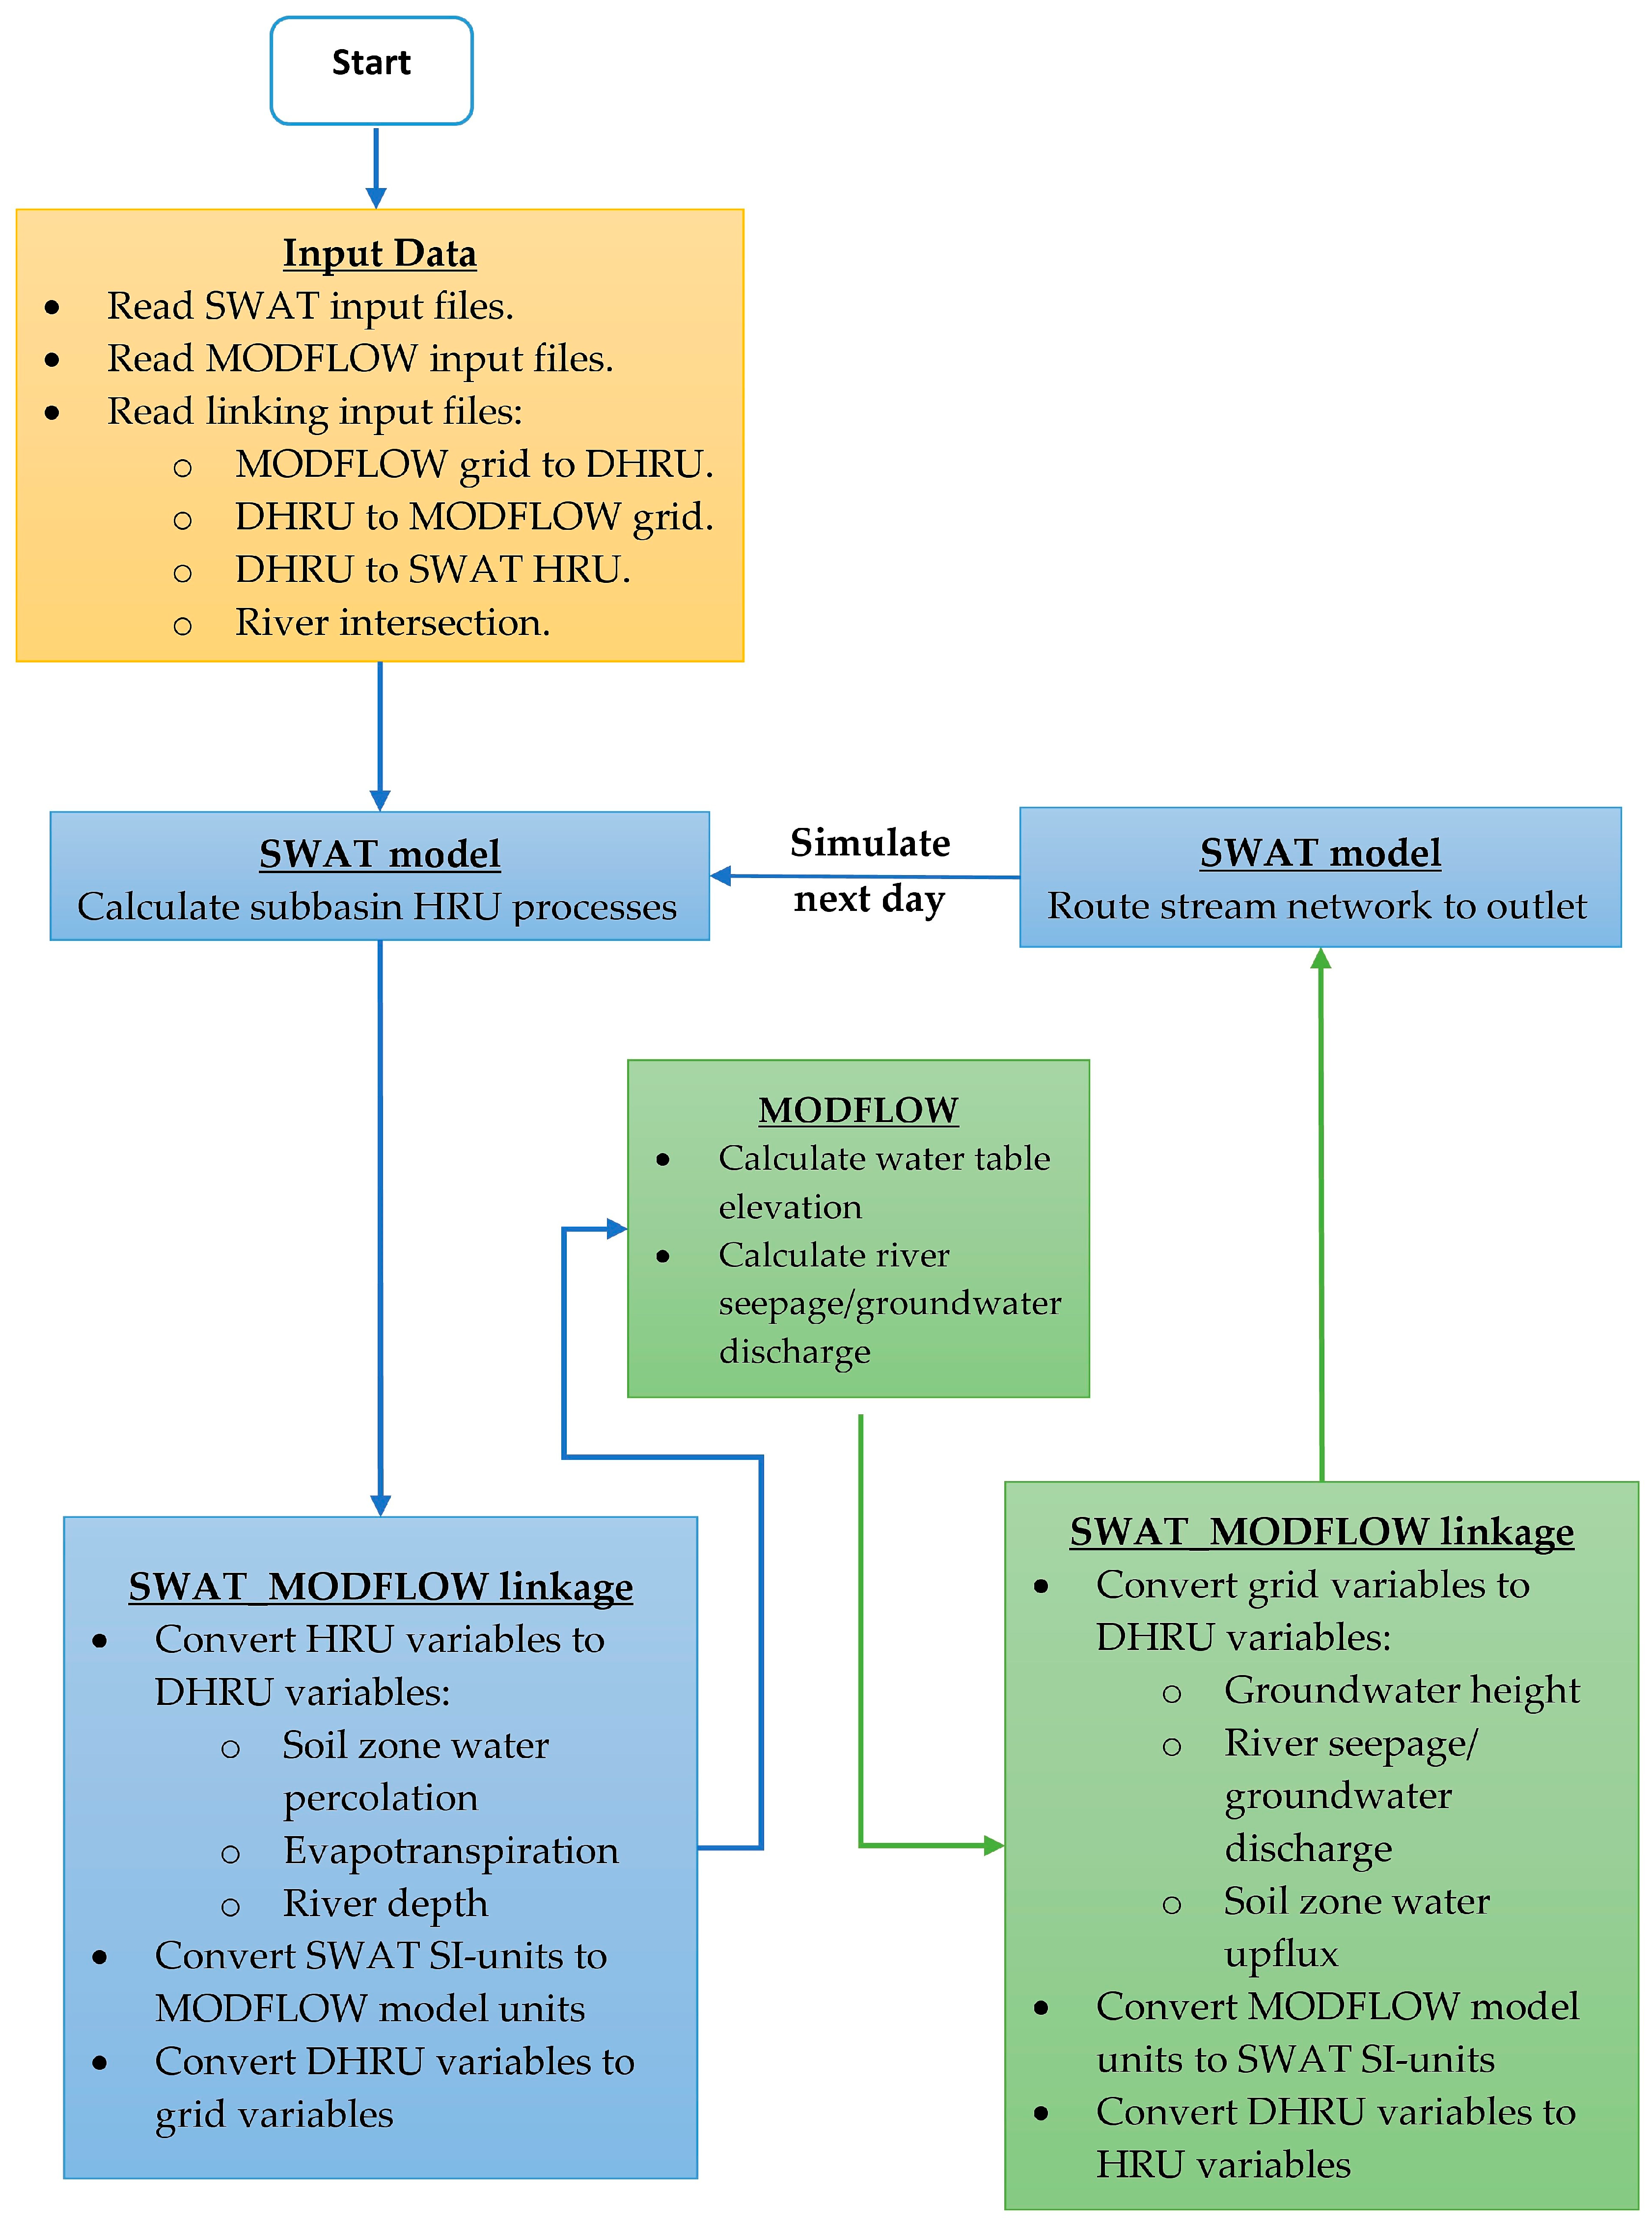
The linking process is illustrated in Figure 6. Following the reading of linkage inputs, the simulation begins. The calculated deep percolation (i.e., recharge) for HRUs is first mapped to each individual DHRU and then mapped to each MODFLOW grid cell according to the percentage of an area of the DHRU contained within the grid cell for use by the Recharge package [9]. The SWAT-calculated channel depth from each sub-basin is mapped to the group of river cells within the sub-basin for use by the River package [9]. MODFLOW then computes groundwater hydraulic head and groundwater–surface-water interactions, with the latter volumetric flow rates being passed to SWAT sub-basin channels based on spatial connections. Groundwater discharge volumes, calculated on a cell-by-cell basis within MODFLOW, are summed and added to in-stream flow for each SWAT sub-basin. SWAT then completes the stream routing calculations for the day, with the daily loop continuing until the end of the simulation. For the possible scenario of a river cell intersecting more than one stream, the length of each stream within the cell is used to calculate the composite weighted value of channel depth for use by MODFLOW and to distribute the cell groundwater discharge volume to the associated sub-basin main channels. Within this scheme, MODFLOW is called as a subroutine within the SWAT framework, providing a single compiled FORTRAN code [9].

3.2.2. SWAT Model Construction and Initial Testing

In this study, the standard approach of the SWAT model setup is mostly followed. The Dee River watershed is subdivided into 57 sub-basins and 1074 HRUs. The watershed parameterization and the model input are derived using the ArcSWAT interface (SWAT 2012, revision 627). The underlying data sets required to develop the model input are topographical, land-use, soil, and climatic data (Figure 7; see Table 1). The SWAT model is constructed for the study area based on a daily time step with a 3-year warm-up period (1992–1994), a calibration period of 1995–2000, and a validation period of 2001–2003.
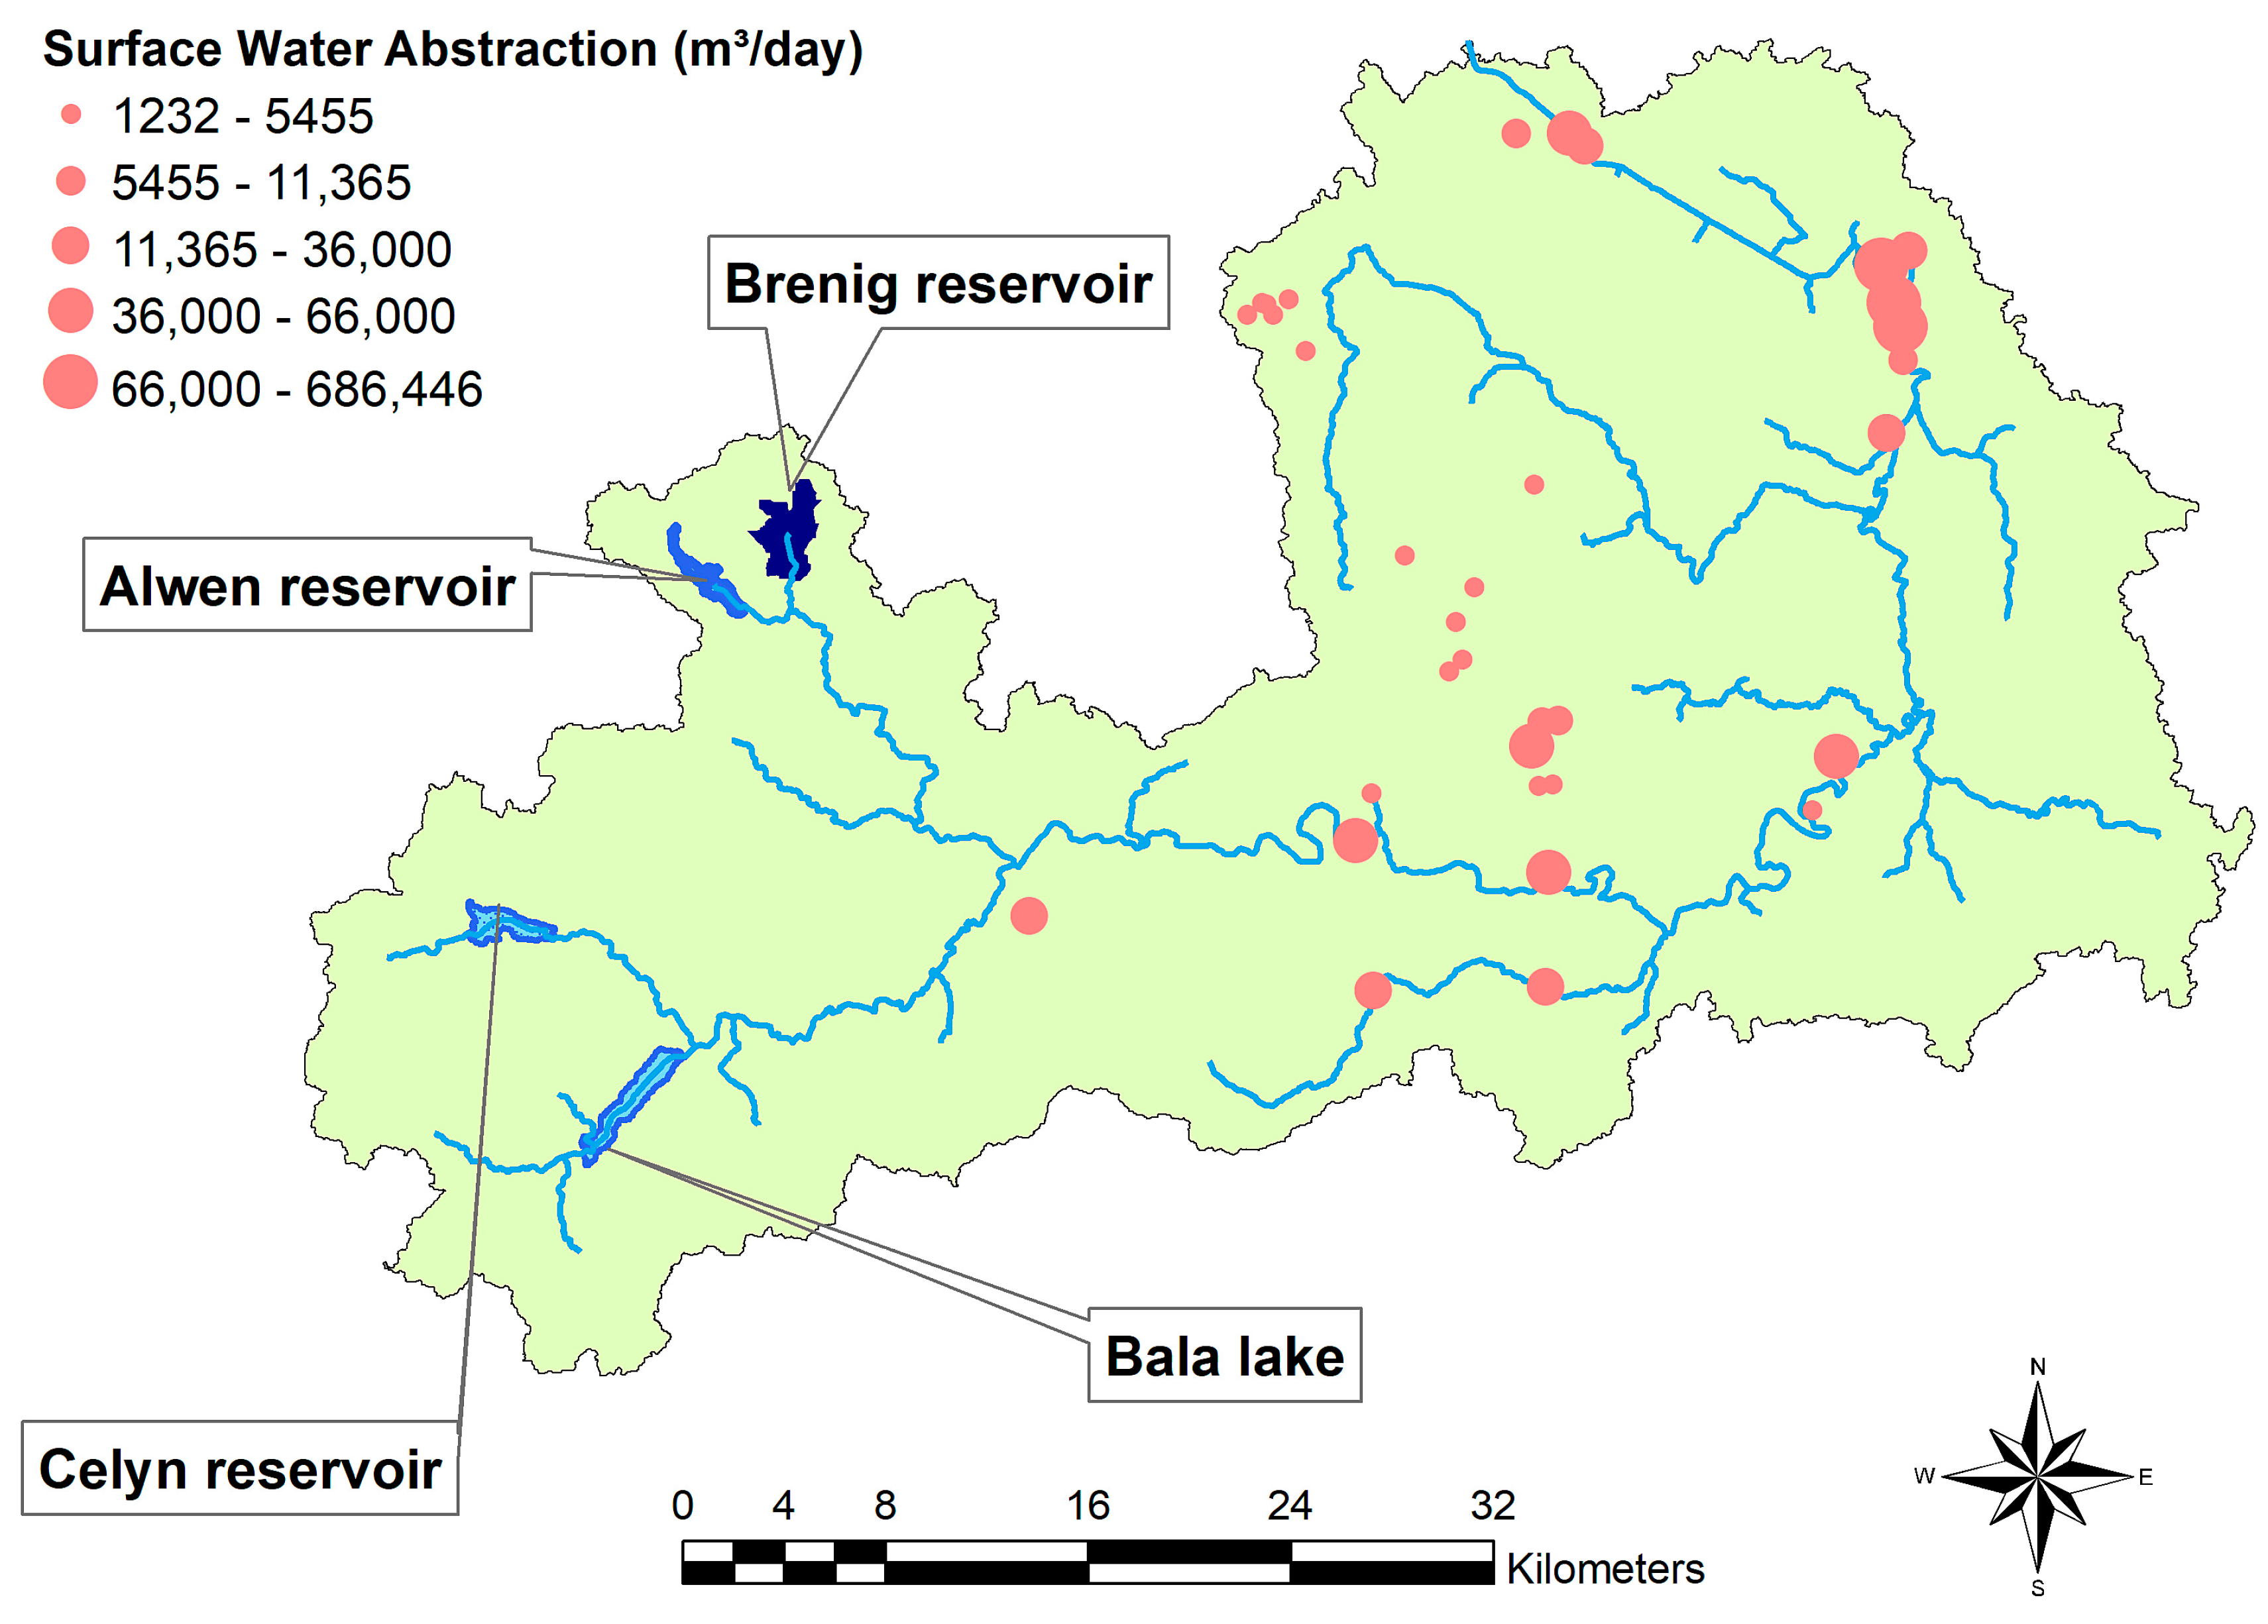
There are circa 30 Public Water Supply (PWS) licenses with substantial abstractions in the area. In 2009, the PWS abstracted a total of 197,042 million litres, which accounted for approximately 93% of all the water abstracted in the Dee Catchment Abstraction Management Strategy (CAM) area. Of the water abstracted by PWS companies in 2009, only around 1% was taken from groundwater sources [40]. The locations of these PWS licenses are shown in Figure 8. Although the metric capacity data of the water abstraction points along with their positions are known, the real-time water abstraction data are not available.
To conserve water supplies and the ensure efficiency of operation, the PWS companies provide a weekly abstraction forecast to Natural Resources Wales to assist in calculating the required releases from the reservoirs [40]. An inversion of this procedure is used to estimate the daily water withdrawal amount at the water abstraction points, as this amount is not available from the data collected. Abbas and Xuan [41] estimated the daily water uses of PWS based on the daily released data from 4 reservoirs in the upstream area of the Dee River watershed.
Before linking with MODFLOW, the model is calibrated and validated using the Sequential Uncertainty Fitting algorithm, SUFI2 [42,43]. The goodness-of-fit is quantified using the Nash–Sutcliffe Efficiency Index (NSE), determination coefficient R2, and percentage of bias (PBIAS) as defined by Equations (2)–(4):
N S E = 1 t = 1 T ( Q o , t Q s , t ) 2 t = 1 T ( Q o , t Q o ¯ ) 2
R 2 = [ t = 1 T ( Q o , t Q o ¯ ) ( Q s , t Q s ¯ ) t = 1 T [ ( Q o , t Q o ¯ ) 2 ] 0.5 t = 1 T [ ( Q s , t Q s ¯ ) 2 ] 0.5 ] 2
P B I A S = [ t = 1 T ( Q s , t Q o , t ) t = 1 T Q o , t ] × 100   %
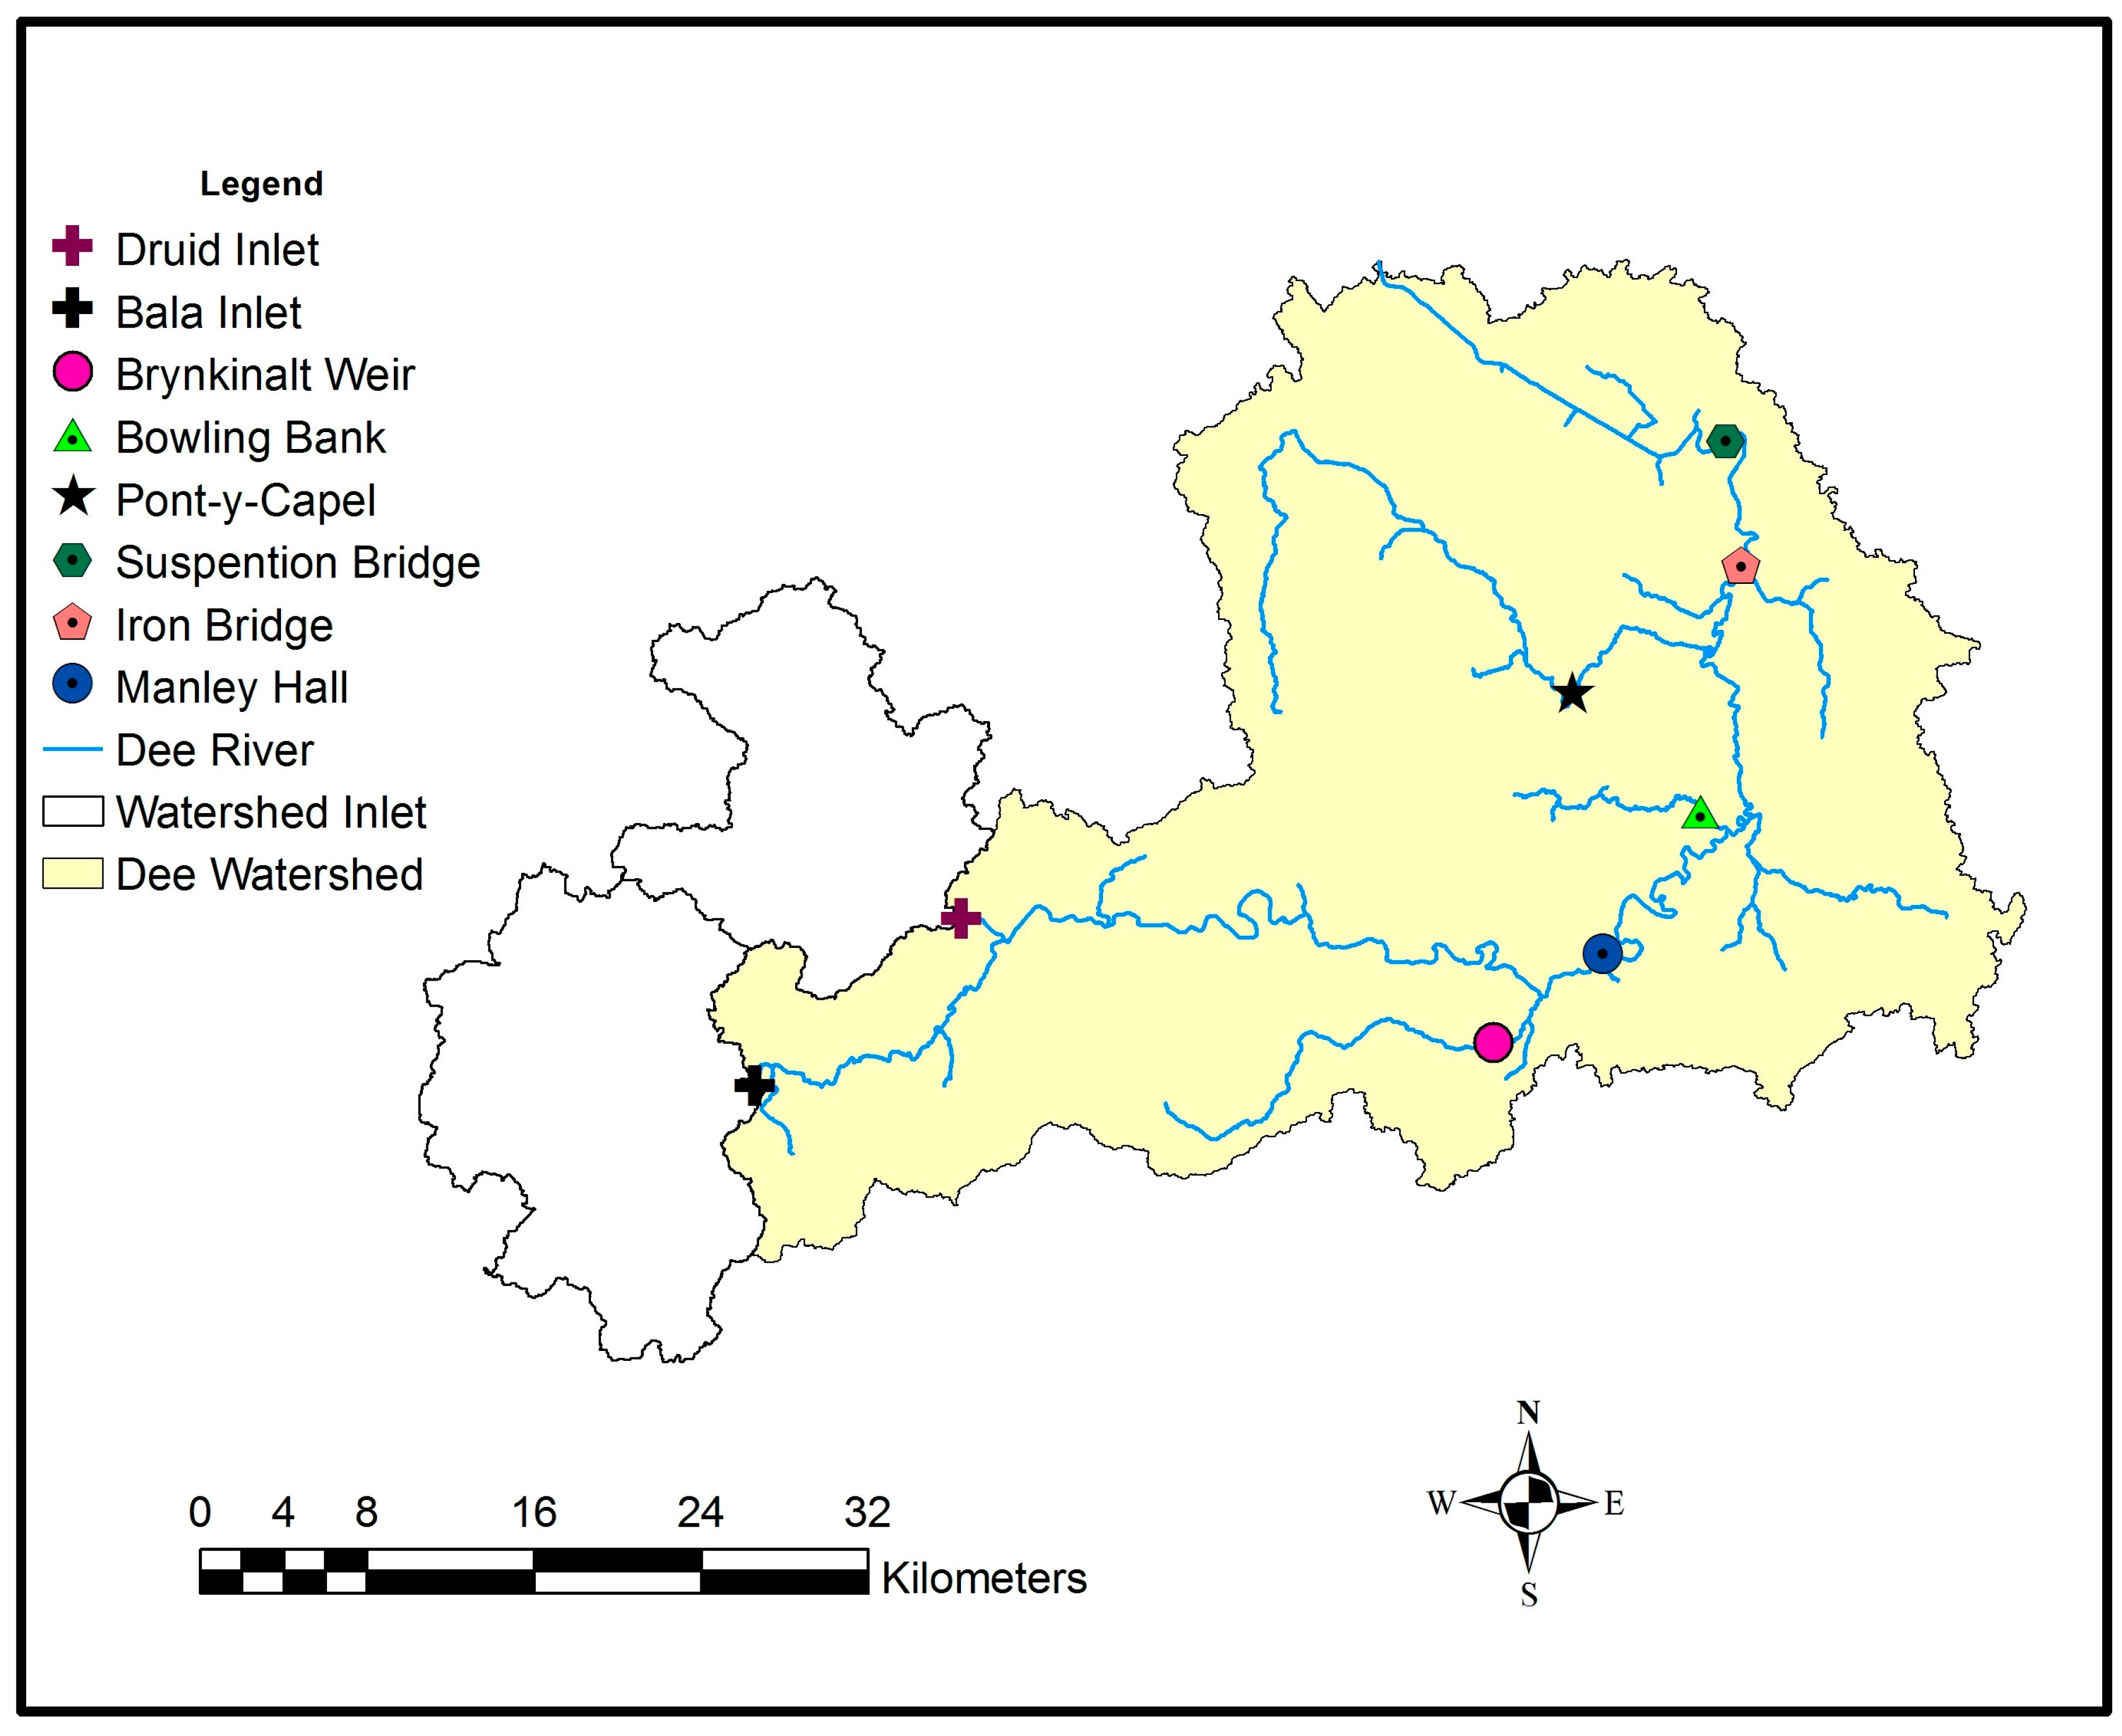
where Q o , t is the observed flow at time t and Q s , t is the simulated flow at time t. It was found that the natural process plays a secondary role and surface-water abstractions have a considerable impact on the river flow regime [39]. Historical flow records at six river gauge stations (Figure 9) are used to measure the performance.

3.2.3. MODFLOW Model Construction and Initial Testing

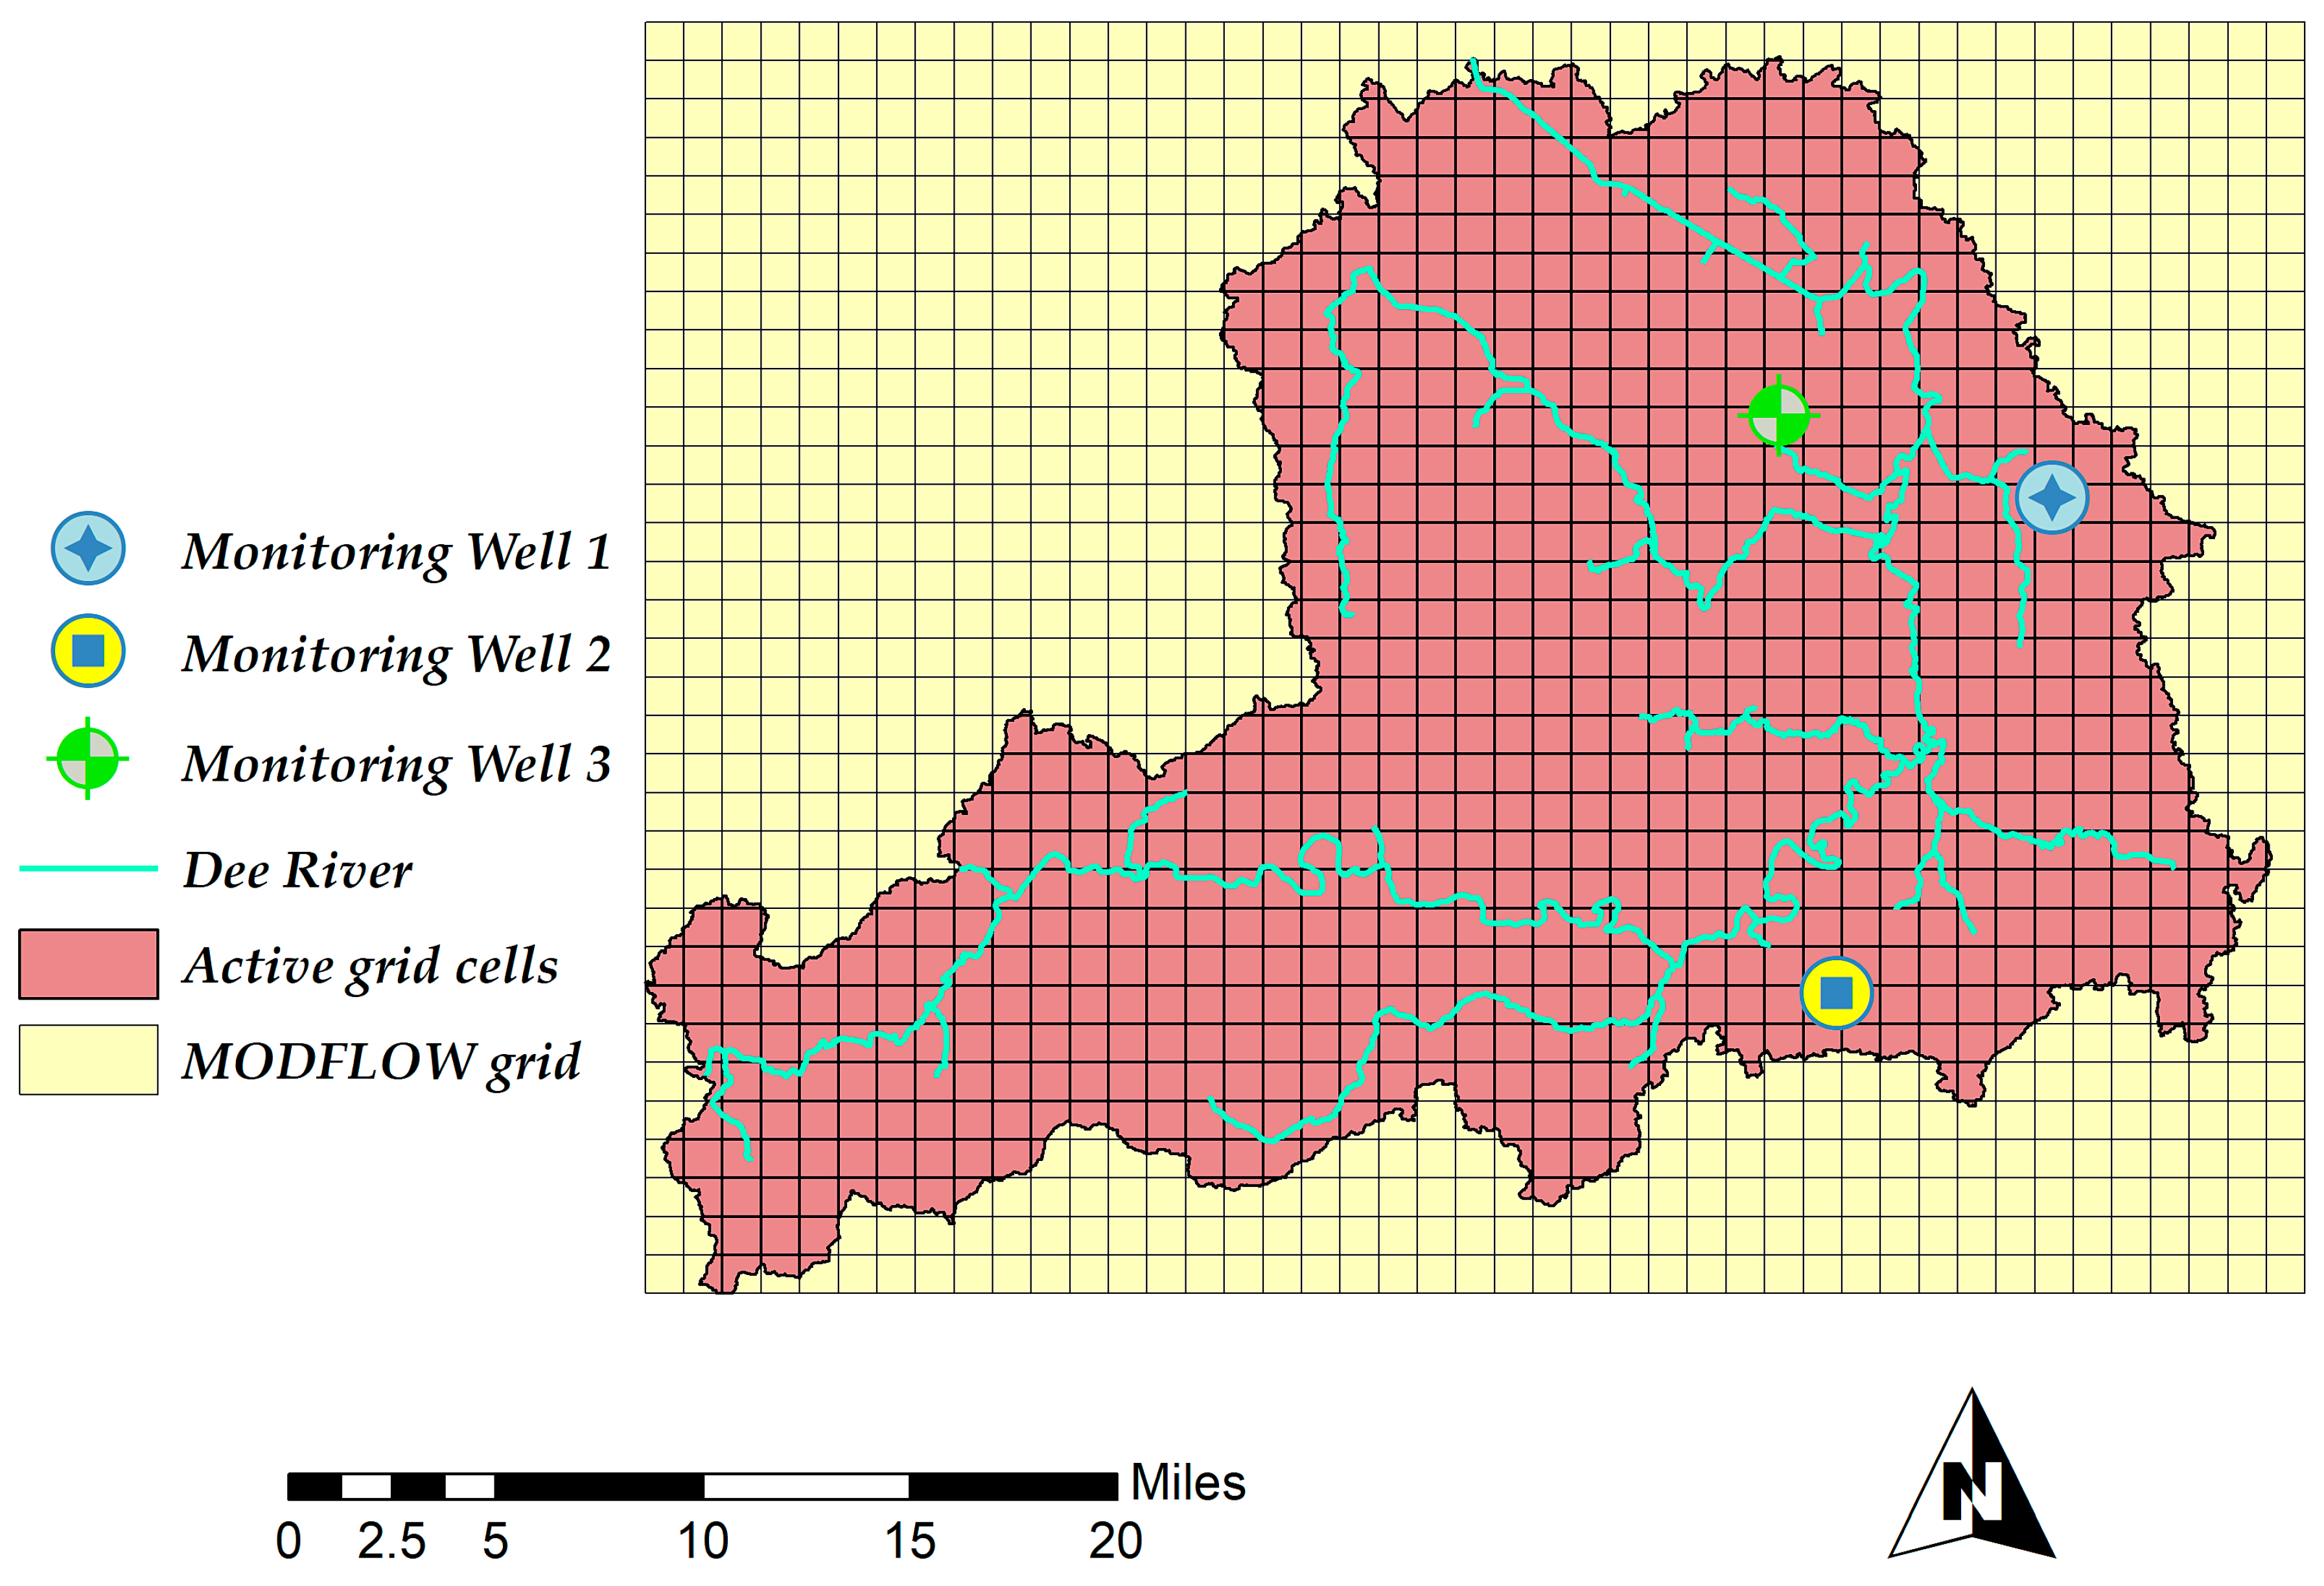
The MODFLOW model is constructed using a one-layer, unconfined aquifer, with 200 m grid cells, resulting in 241 rows and 317 columns (Figure 10). The topographical surface assigned as the top layer of the model is interpolated from the Digital Elevation Model (DEM).
The following MODFLOW packages are used:
  • Basic package (.bas);
  • Discretization package (.dis);
  • River package (.riv);
  • Well package (.wel);
  • Upstream weighted package (.upw);
  • Recharge package (.rch);
  • Newton Solver package (.nwt).
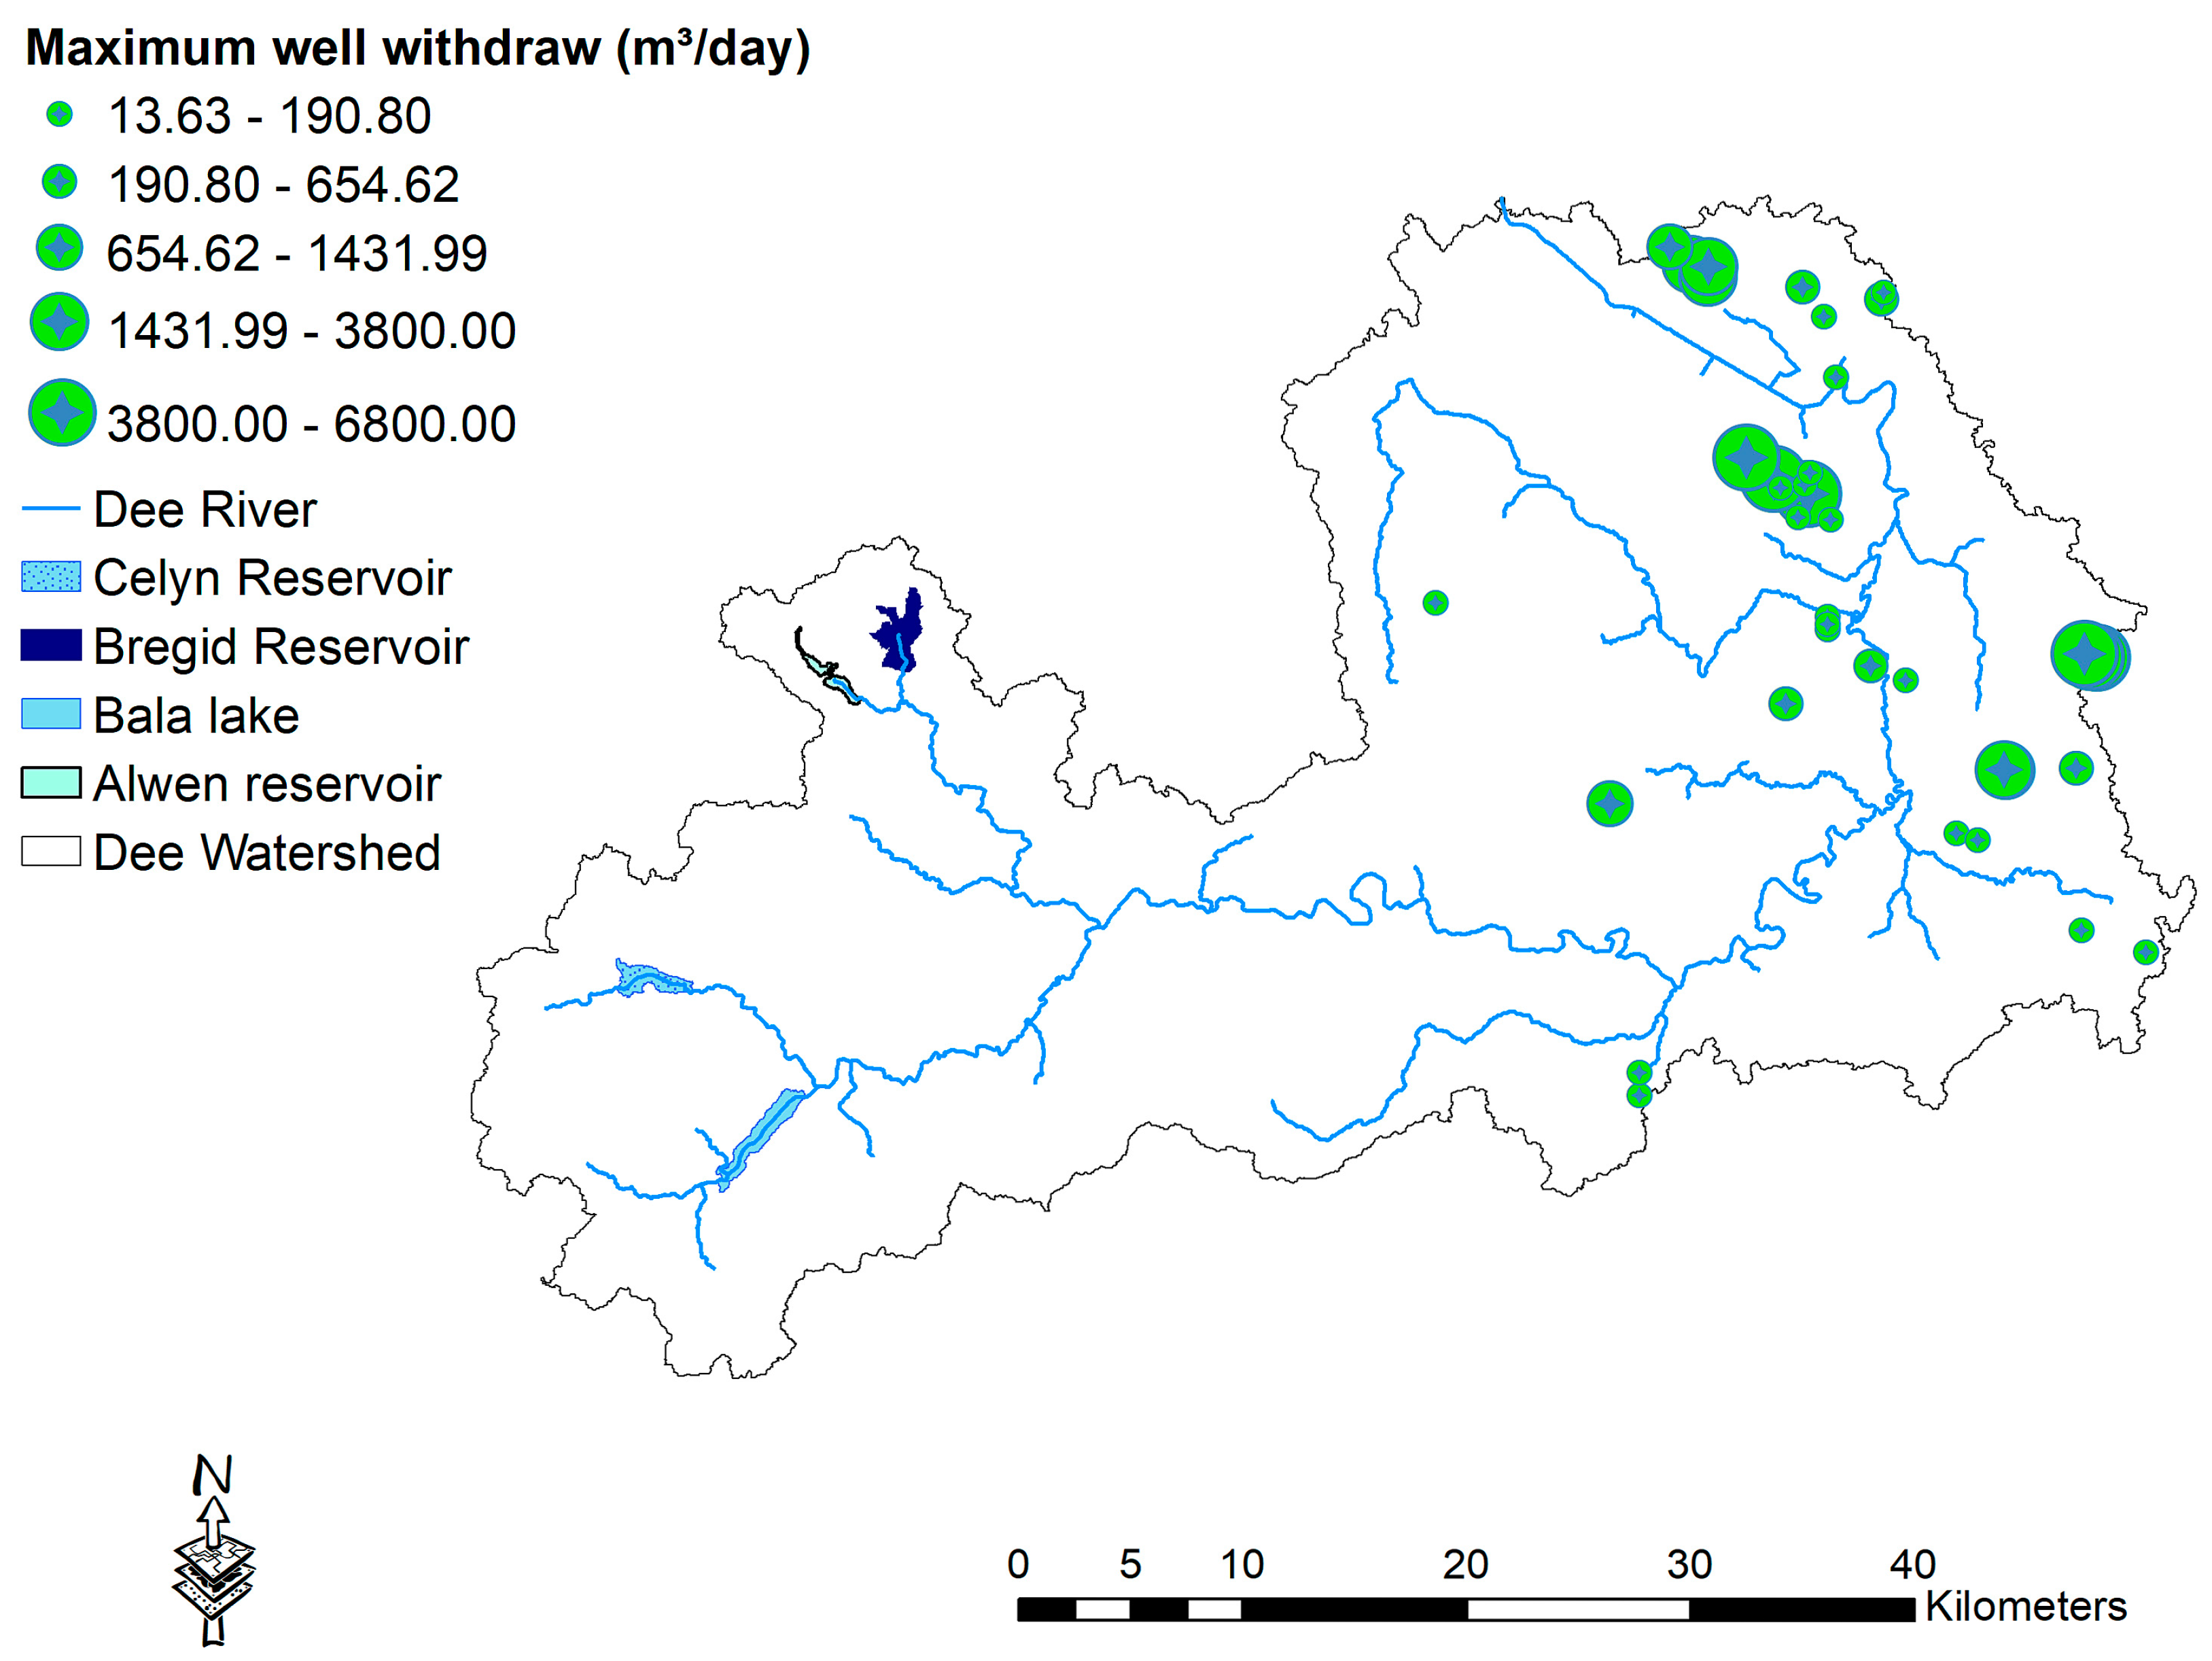
As describe above, recharge is provided by SWAT HRUs, and the cells in the River package (see Figure 10 for location) interact with SWAT sub-basin channels to provide groundwater–stream exchange rates. A total number of 37 licensed wells are represented in this study with a maximum water withdraw of 14–6800 m3/day (Figure 11). The pumping rates of these individual wells are simulated using the Well package.
The standalone MODFLOW is manually calibrated by adjusting:
  • The horizontal permeability coefficient from the Upstream weighted package (to control the recharge rate);
  • The river conductance from the River package (to control the surface–groundwater interaction between the river channel and shallow aquifer).

3.2.4. Linking SWAT and MODFLOW

The stand-along SWAT and MODFLOW models are linked according to the theory and process described in Section 3.2.1. The model results are tested against (1) streamflow at the gage sites (Figure 9 and Table 2), (2) groundwater head at the monitoring wells (Figure 10), and (3) baseflow. The latter is calculated using the recursive digital filter commonly used in signal analysis and processing [44]. It was used by Nathan and McMahon [45], among others, providing a subjective and repeatable estimate of baseflow that is easily automated. Baseflow separation is conducted using R statistical package ‘EcoHydRology’ [46] to separate baseflow from the daily streamflow records. Simulated baseflow is assessed using NSE and R2.

3.3. Future Climate: UKCP18 Convection-Permitting Model Projections for the UK at 2.2 km

In this study, high-resolution precipitation and temperature models from the UKCP18 project are used with the calibrated SWAT-MODFLOW model with a future scenario of RCP85 from 2020 to 2040 for the different scenarios of water uses. UKCP 18 is a climate projection model that runs on a convection-permitting scale for the UK for the historical period of (1981–2000) and future periods of (2021–2040) and (2061–2080), produced by the Met Office Hadley Centre for UK Climate Projections. The data are available on a 2.2 km grid on a rotated pole at different temporal resolutions, including hourly, daily, and monthly time steps [47].
The UKCP18 project offers a new set of climate tools and projections to obtain climate data. The main improvements in UKCP18 include the use of new observations of climate and weather, including a more recent generation of global and regional climate models. The major improvement in the design of UKCP18 over the previous UK climate projections (e.g., the UKCP09 model) is that it consists of updated probabilistic projections, giving estimates of different future climate outcomes. The regional and global model projections give users the capability to better investigate climate changes and variability, including the relationship between different climate metrics and retaining spatial coherence [47].

3.4. Water Evaluation and Planning (WEAP) Model

Water Evaluation and Planning software (WEAP) is integrated water resources management software developed by the Stockholm Environment Institute (SEI) in the USA. It is designed to assess user-developed scenarios that accommodate changes in the socio-economic and biophysical conditions of catchments over time [48]. WEAP allows the planner to obtain access to a more comprehensive view of the broad range of factors that should be considered in managing water resources for present and future use owing to its integrated approach to simulating both the natural (e.g., runoff, baseflow, evapotranspirative demands, etc.) and engineered structures (e.g., reservoirs) of water resources systems [49].
WEAP operates in many capacities, including:
  • Water balance database: WEAP provides a system for maintaining water demand and supply information;
  • Scenario generation tool: WEAP simulates water demand, supply, runoff, storage, pollution generation, treatment, and discharge and instream water quality;
  • Policy analysis tool: WEAP evaluates a full range of water development and management options and takes account of multiple and competing uses of water systems.
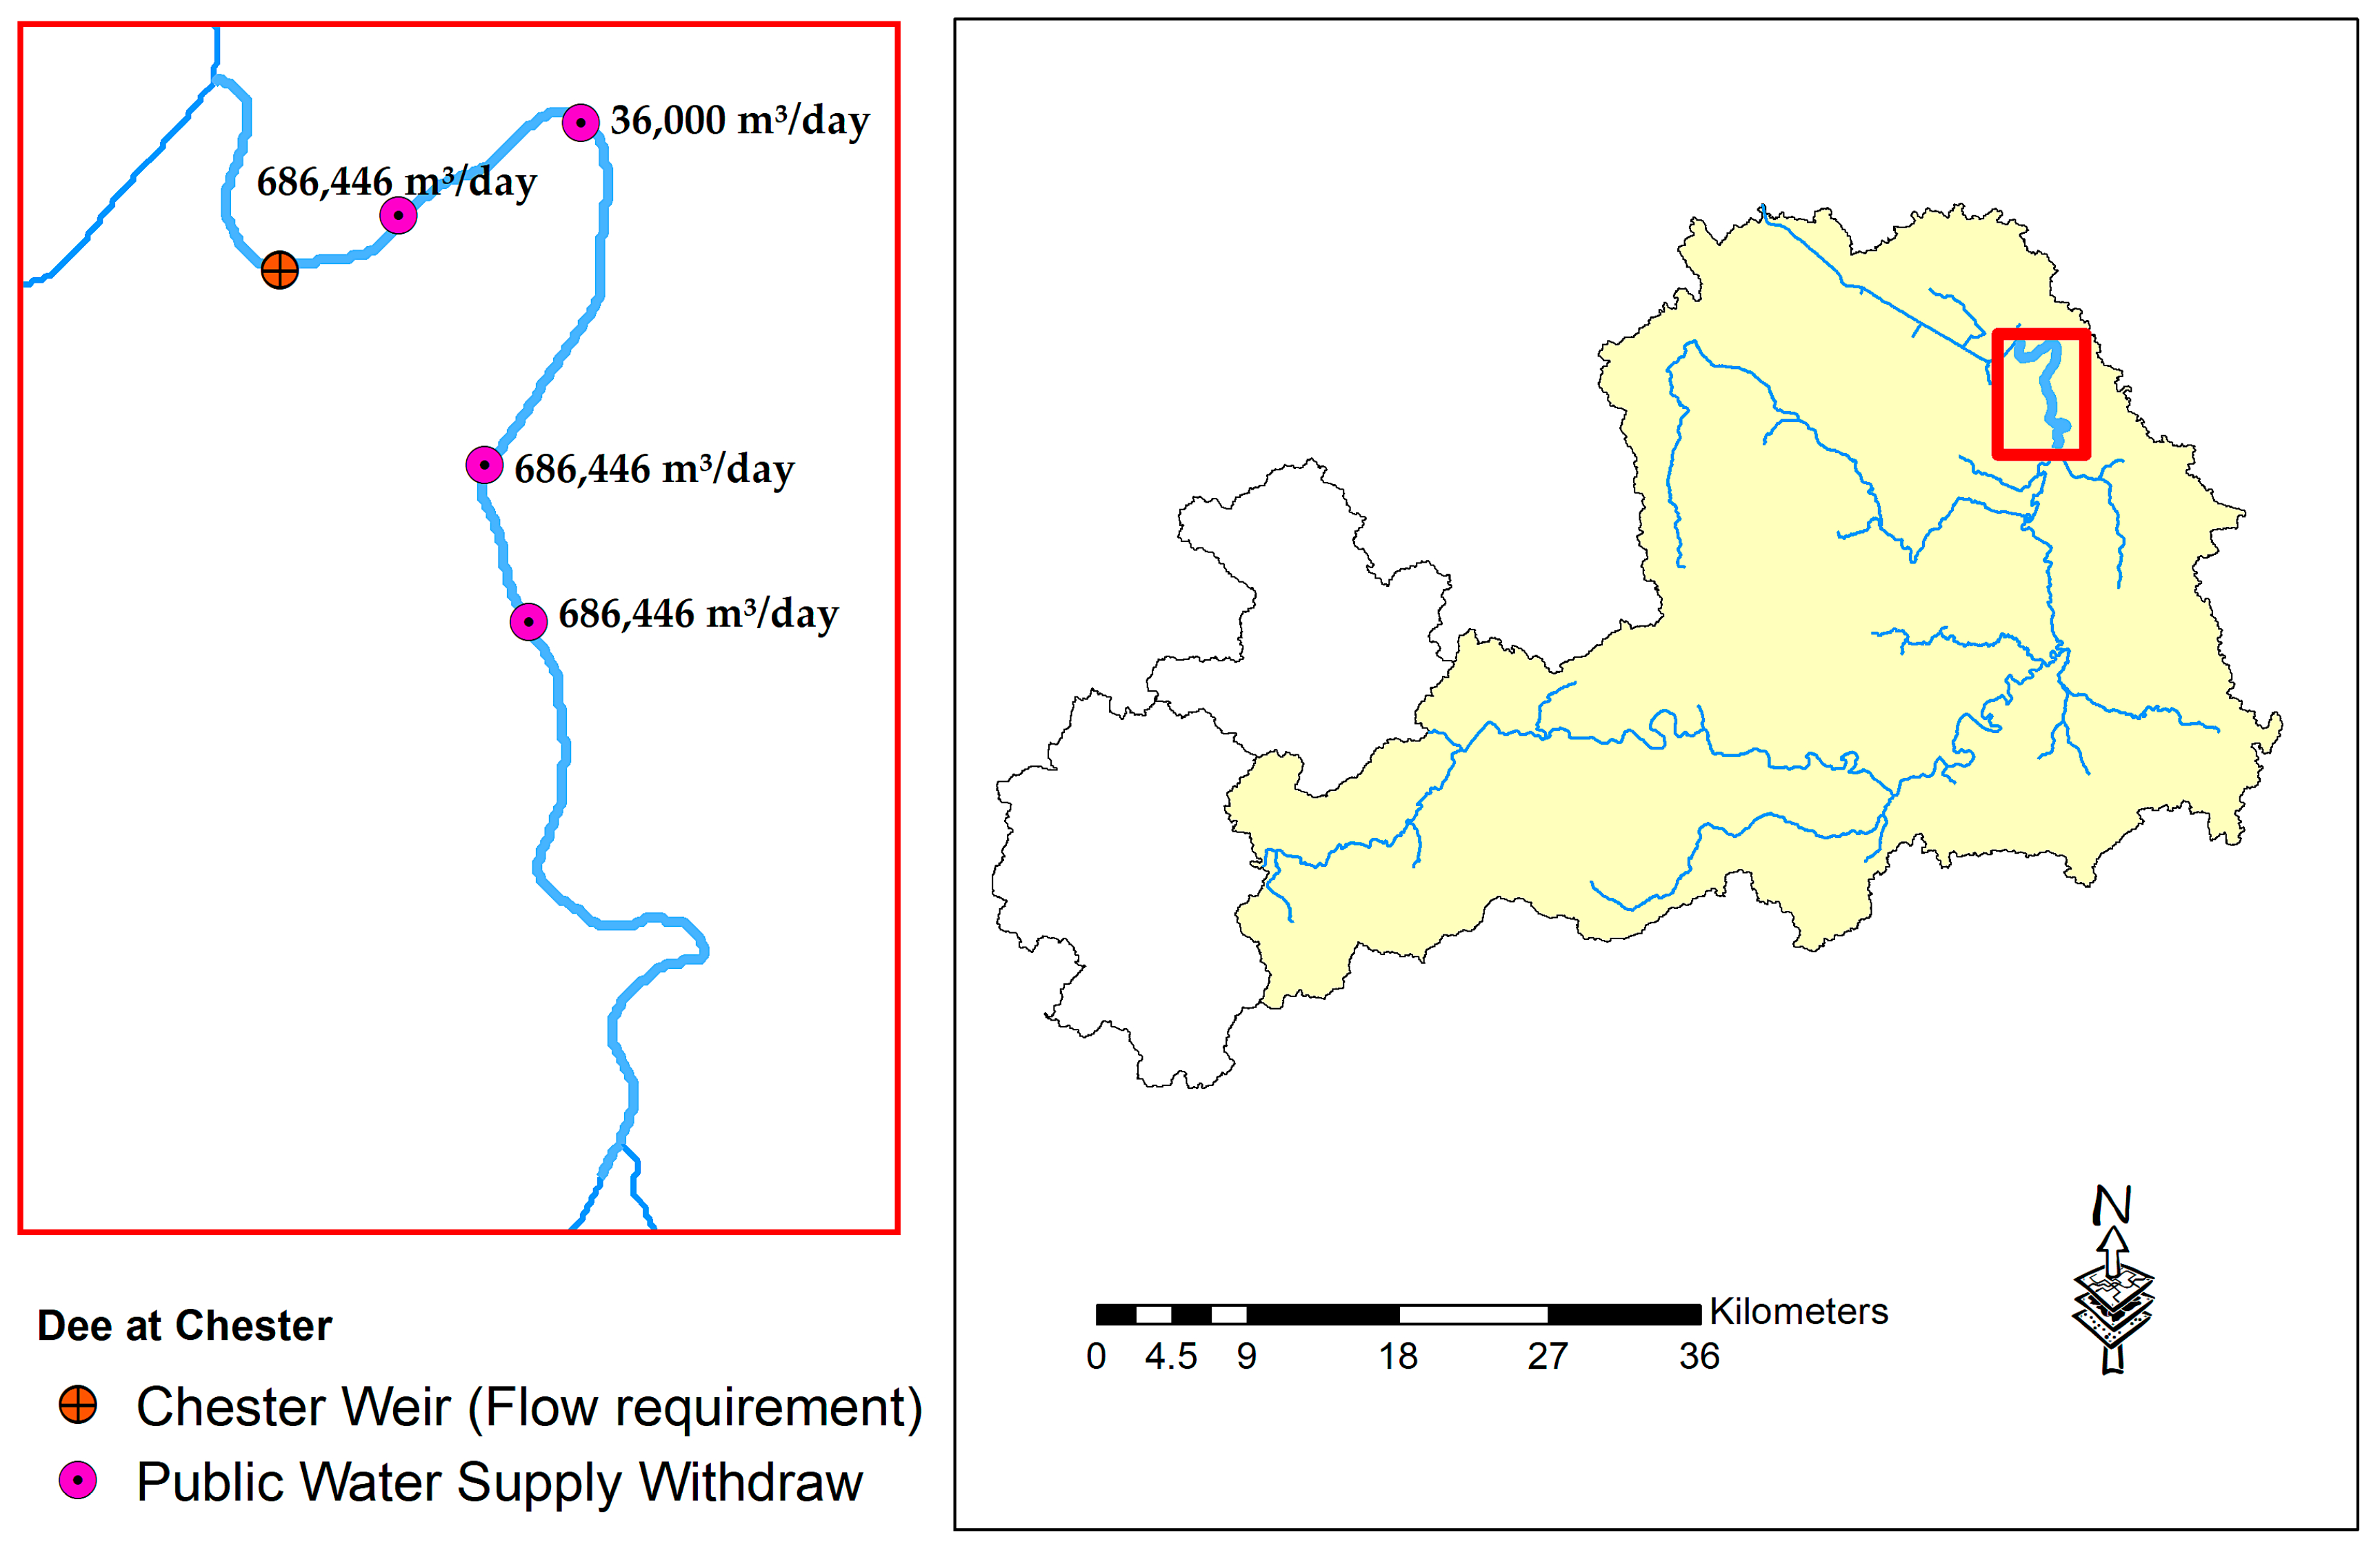
WEAP has been used for climate scenario analysis of water supply and demands in different regions of the world (e.g., [50,51]). The model optimizes water use in the basin using a linear optimization algorithm to allocate water to the various demand sites, as per the demand priorities that range from 1 to 99, with 1 being the highest priority. For more information on the WEAP model, readers are directed to [48,52]. In the present study, the simulated streamflow for future scenarios of the SWAT-MODFLOW model are used as the input to the head of the river reach in the downstream region for the WEAP model (Figure 12).
In the coupled SWAT-MODFLOW-WEAP modelling system, the Chester weir gauge station (which is located downstream of the Dee River basin) is utilized as a checkpoint for the minimum streamflow requirement for ecological purposes with a minimum river flow of 4.2 m3/s [40] and the evaluation of the unmet flow requirements.
The Dee River basin is an example of the complex river flow system and is highly regulated through a management scheme that provides water for both industrial and public water supply (PWS) in summers and prevents flooding between Bala Lake and the city of Chester in winters [41]. There are massive PWSs in the downstream area of the river basin (Chester city), as revealed in Figure 12, which are considered for the evaluation of the impact of water demand on the availability of water resources for scenarios of climate change. These demands are:
  • PWS1 that consumes a maximum of (686,446 m3/day);
  • PWS2 that consumes a maximum of (686,446 m3/day);
  • PWS3 that consumes a maximum of (36,000 m3/day);
  • PWS4 that consumes a maximum of (686,446 m3/day).
It is reported that the daily water use in the UK has gradually increased by 1% per year since 1930, and the average person now consumes 150 L a day [53]. The calibrated simulated discharge from the SWAT-MODFLOW model with climate model data of UKCP18 is aggregated into monthly time series and used as input for the WEAP model. In the coupled SWAT-MODFLOW-WEAP system, we analyse four scenarios of surface-water abstraction to check the unmet demands and streamflow requirements as follows:
  • Scenario I: 100% of the maximum licensed surface-water abstraction (RCP85 scenario, 2020–2040);
  • Scenario II: 50% of the maximum licensed surface-water abstraction (RCP85 scenario, 2020–2040);
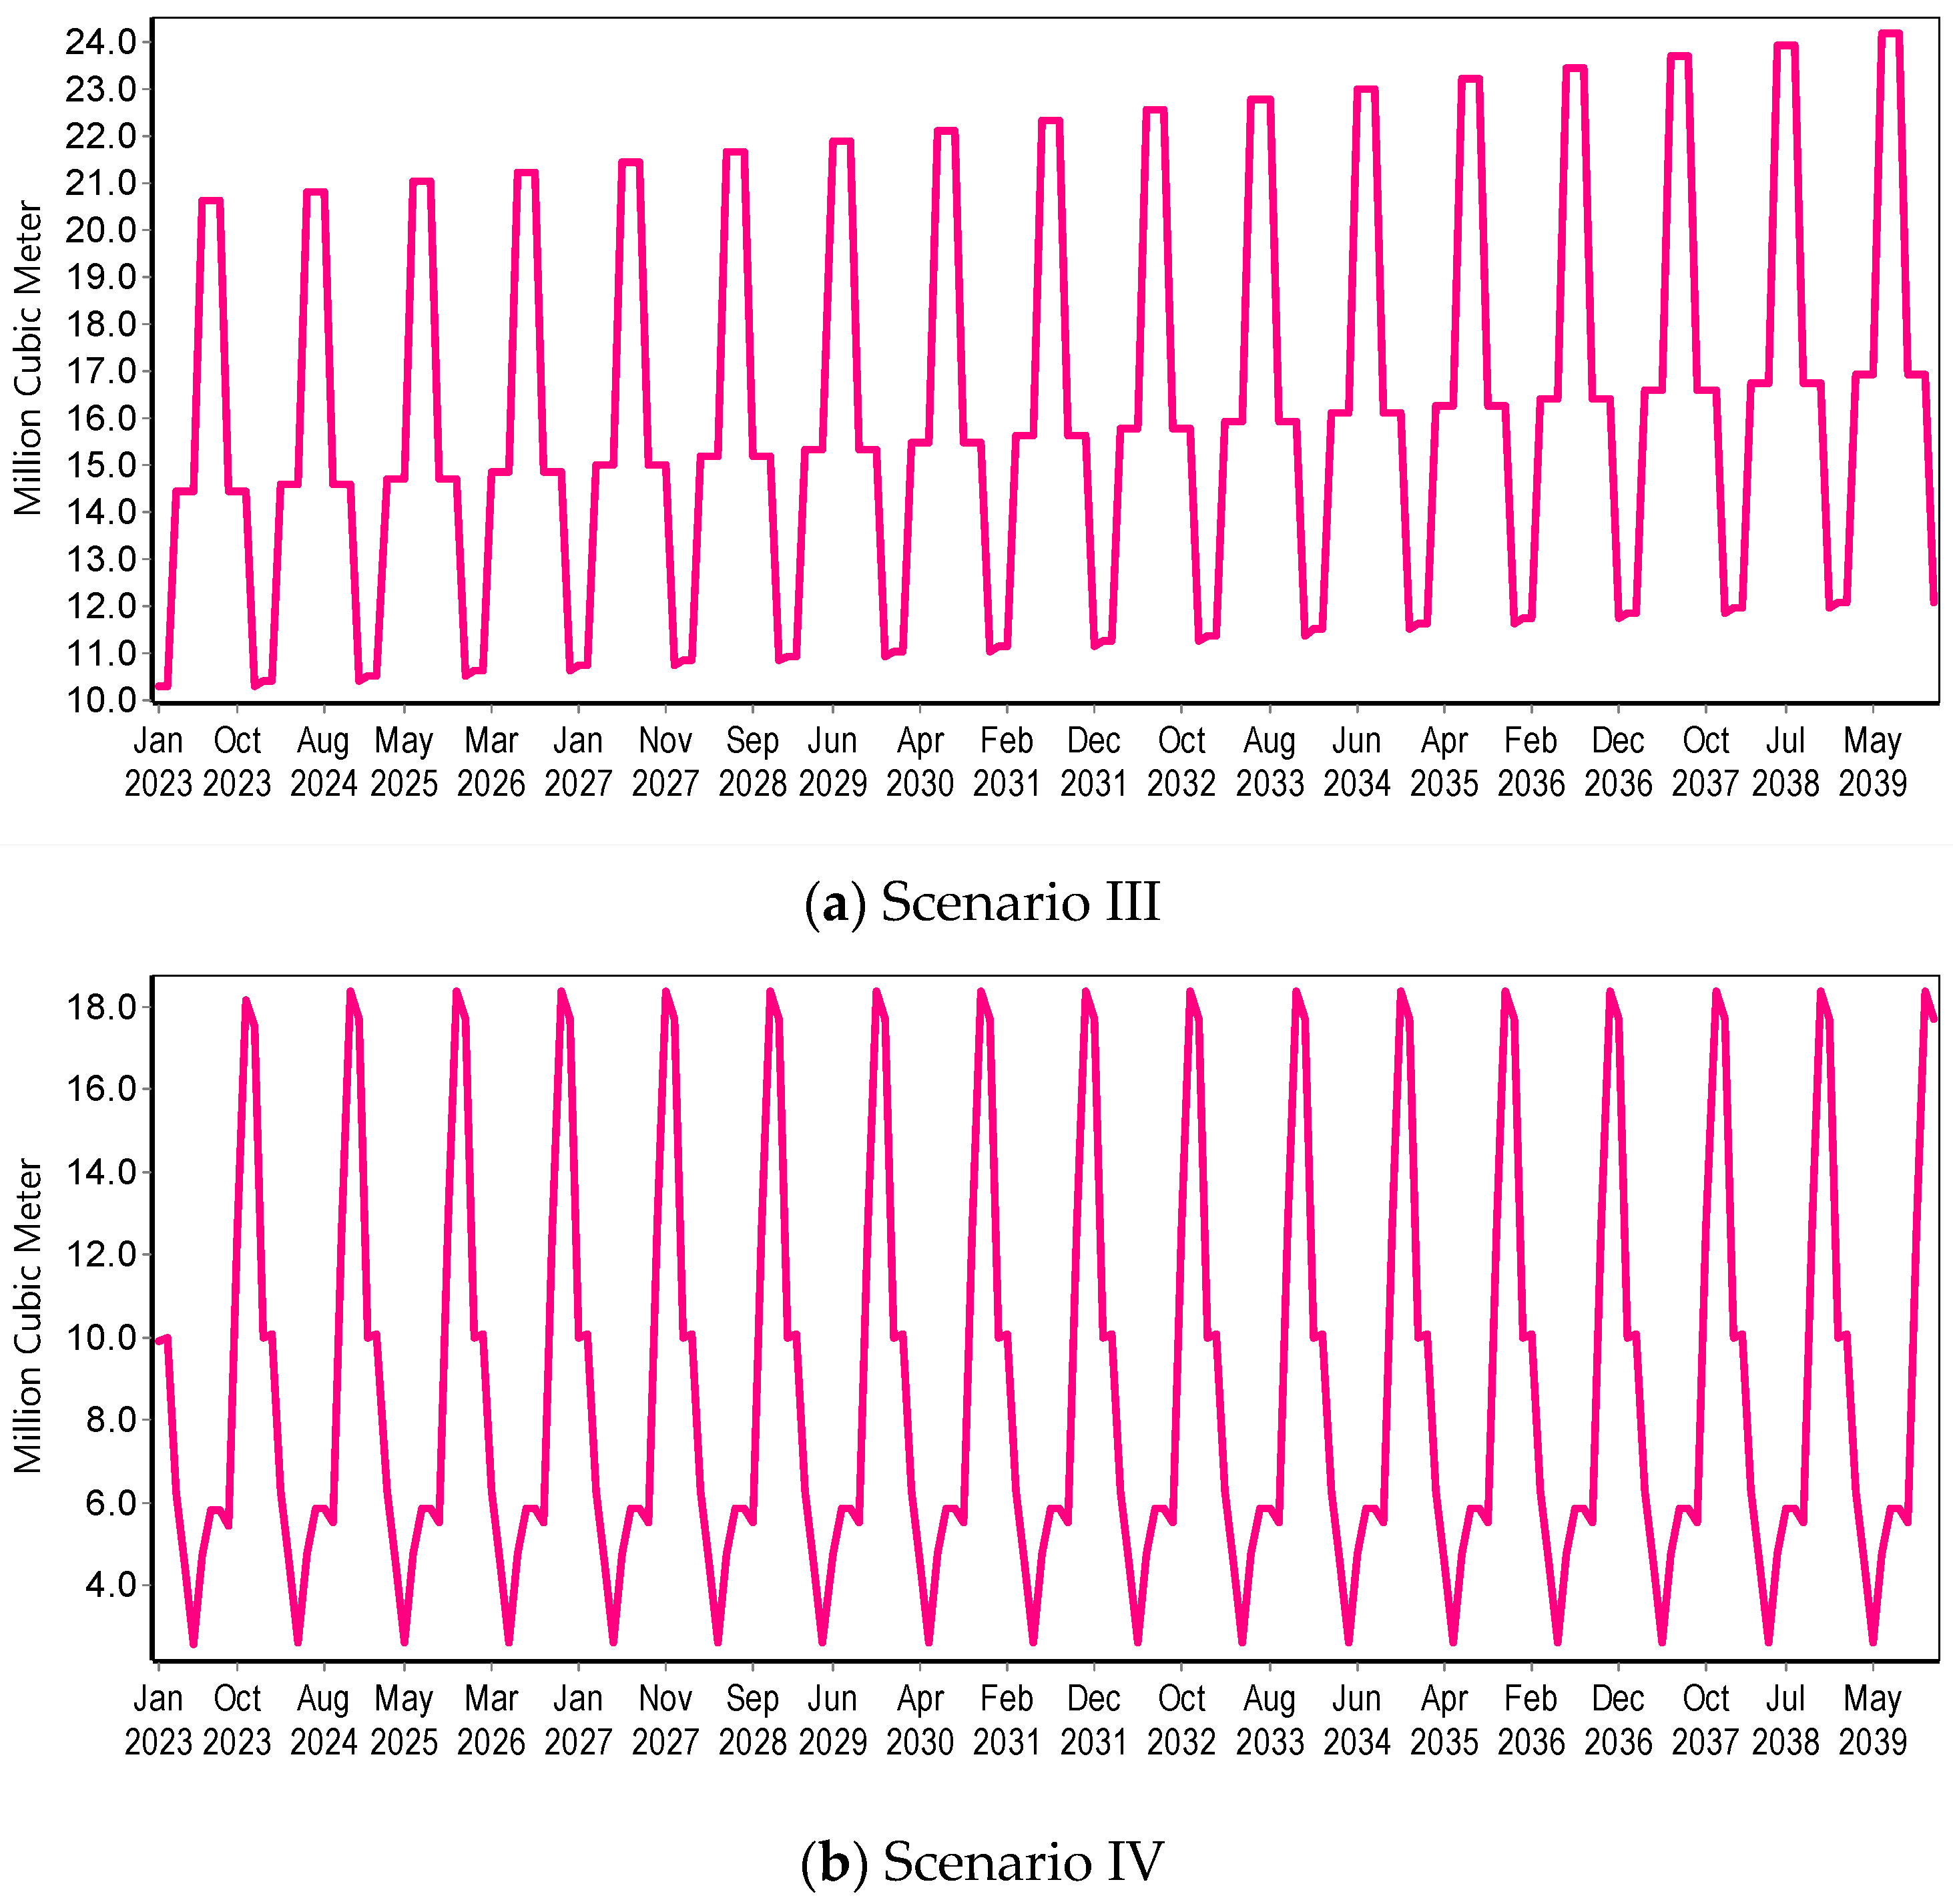
  • Scenario III: Monthly time series, that is, the percentage of maximum licensed surface-water abstraction with 1% increases in the water use rate (100% of maximum licensed abstractions for summer months (June, July, and August), 50% of maximum licensed abstractions for winter months (December, January, and February), and 70% for the rest of months) for RCP85 scenario (2020–2040), as it can be seen in Figure 13a for PWS1;
  • Scenario IV: Monthly time series, that is, the maximum yearly water withdraws is calculated based on historical data of surface-water abstraction for the period of 1970–2004 that was estimated by Abbas and Xuan [38] for the RCP85 scenario (2020–2040), as it can be seen in Figure 13b for PWS1.

4. Results and Discussion

4.1. Hydrologic Fluxes and States Using SWAT-MODFLOW

Table 3 shows the performance statistics of the model regarding streamflow for the calibration period, e.g., a standalone calibrated SWAT model and the coupled SWAT-MODFLOW model. Several indices are used, including the Nash–Sutcliffe Coefficient (NSE), R2, and percentage of bias (PBAIS), to measure the deviation of simulations from the observations at the chosen gauge stations. Small decreases in R2 and NSE can be observed across all gauge stations, except for two stations where groundwater is dominant. Regarding PBIAS, the coupled model performs better or similarly, except for that of the gauge Brynkinalt Weir.
Meanwhile, for the validation period (Table 4), the overall water balances (PBIAS) are improved for the coupled SWAT-MODFLOW at three sites. The overall trends (R2) are also enhanced, as it is demonstrated in Table 4.
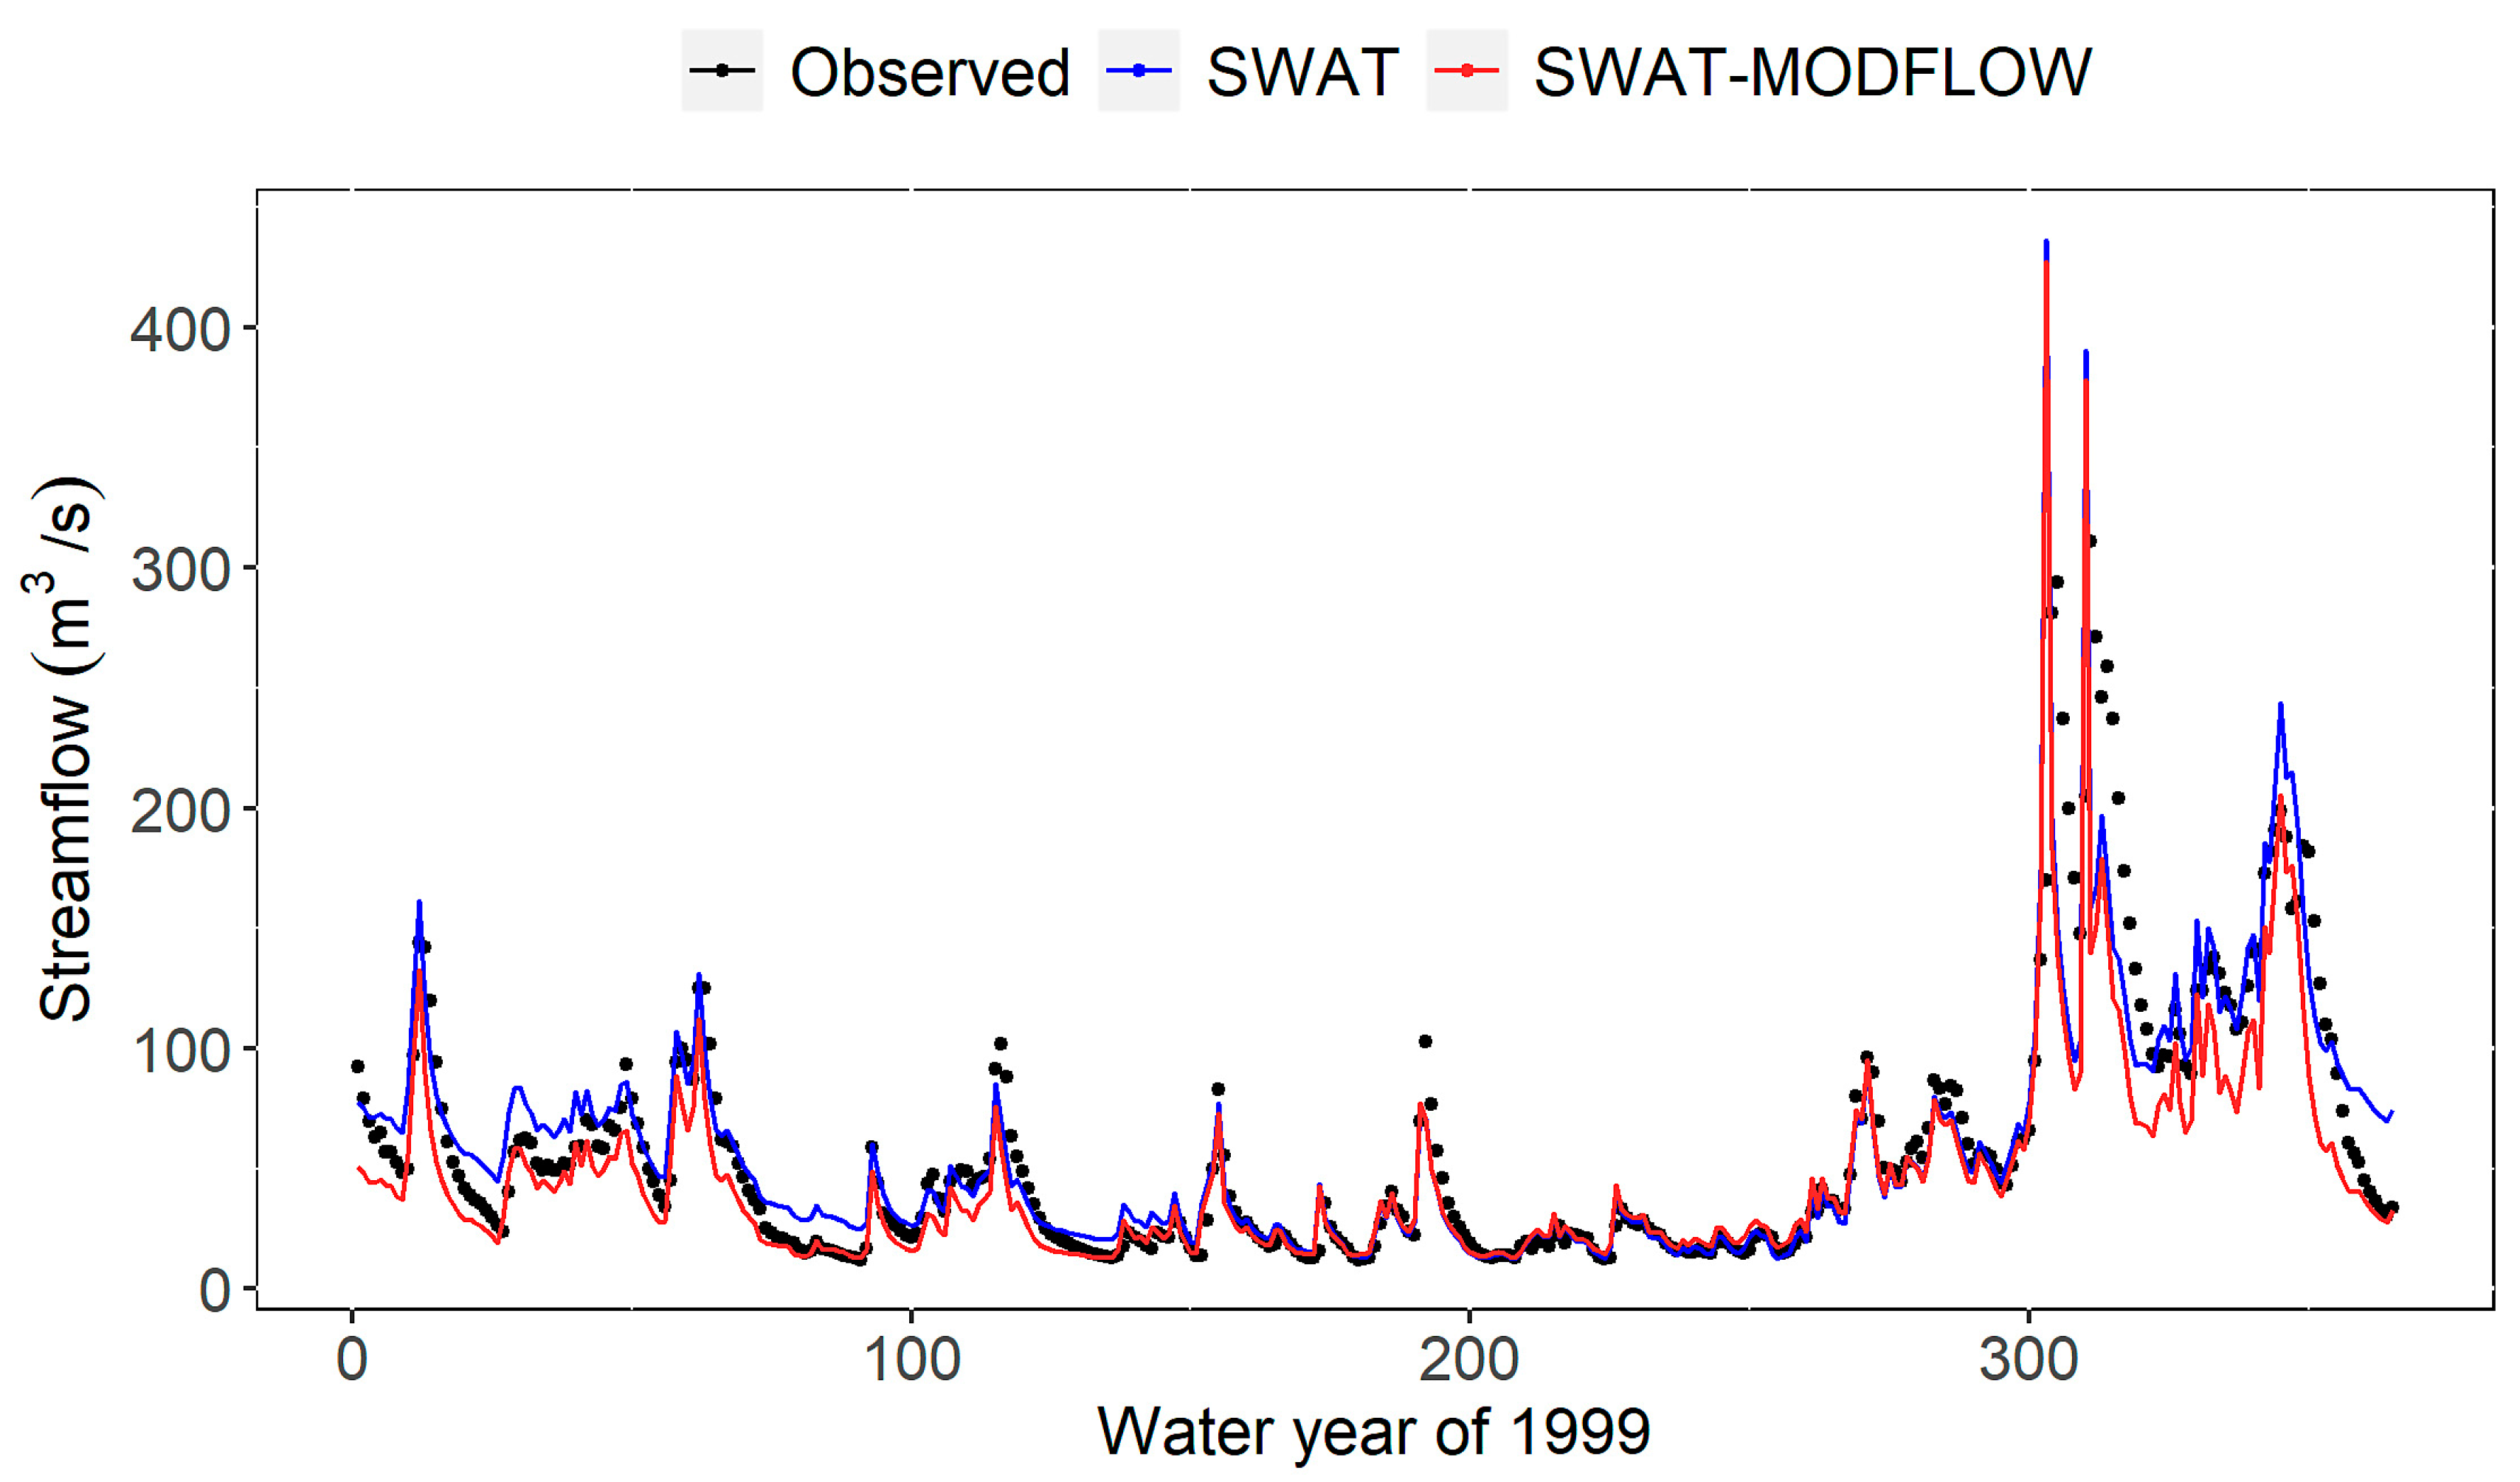
The simulations from the standalone SWAT model and the coupled model are compared with the observed flow data at the river gauges. Figure 14 shows such comparison for a selected station (Chester Ironbridge) over the water year of 1999. A remarkable feature revealed by Figure 14 is that the coupled model outperforms the standalone SWAT model for the low-flow conditions, particularly for the recession curves after each peak. While both models simulate peak flow well, the standalone SWAT model performs better for the 2nd peak. It is plausible that the MODFLOW component well compensates for the deficiency of SWAT in low-flow representation (such as baseflow) in terms of taking more water as recharge and lagging it to the streams via groundwater gradients. This is, in fact, an influential aspect of the coupled model, as it is more stressful in the flow period for the water supply and the coupled model might be preferred in this occasion for better simulations.
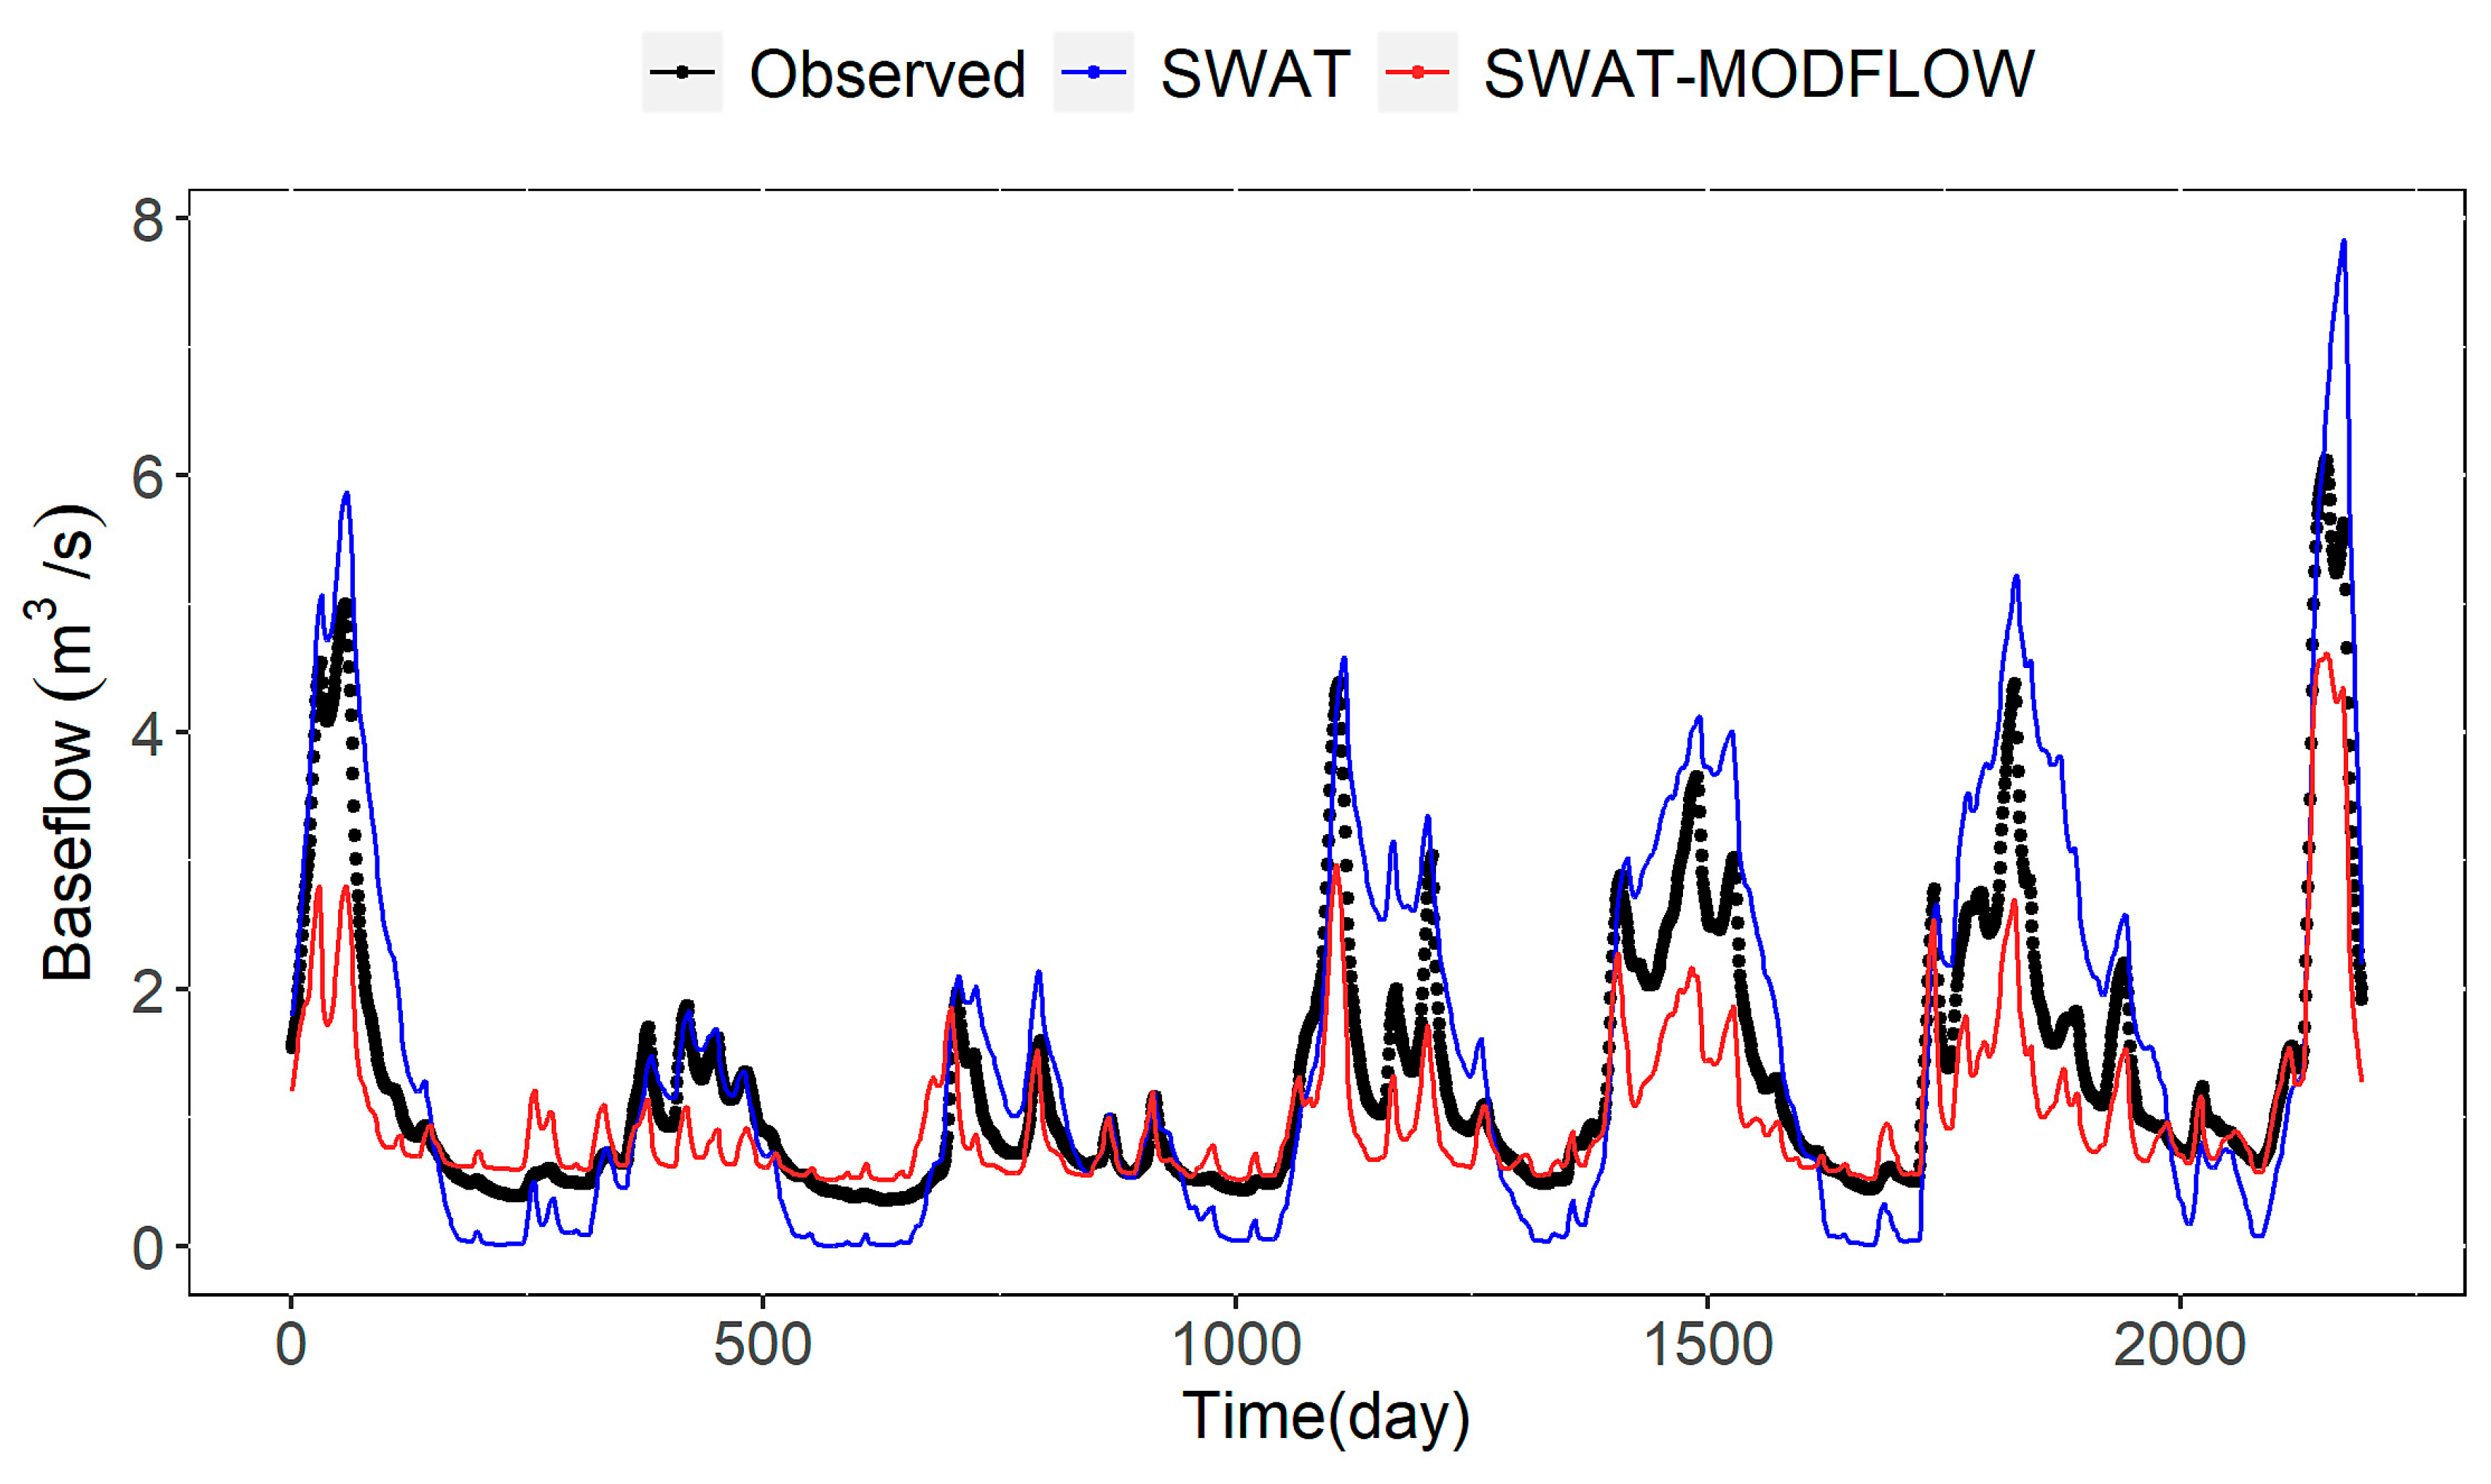
A baseflow separation of SWAT and coupled SWAT-MODFLOW is created and presented. NSE and R2 are employed to evaluate the baseflow simulation against the observed one. Table 5 and Table 6 show that the SWAT-MODFLOW simulation has a better baseflow simulation than the standalone SWAT model. Figure 15 reveals the baseflow from SWAT and SWAT-MODFLOW, and the one observed at the Pont-y-Capel station for the period of 1995–2000. Noticeably, SWAT-MODFLOW improves the origin of SWAT simulation regarding baseflow.
Figure 16 shows the comparison of the daily simulated groundwater level against the observed one at monitoring well 1 in the east of the Dee watershed, which shows that coupled SWAT-MODFLOW performs well with Mean Absolute Errors (MAEs) of 0.35 for the calibration period of 1995–2000 and 0.42 for the validation period of 2001–2003. The model is able to track the temporal patterns of groundwater head fluctuation, within 0.6 m of the true values. The other monitoring wells (i.e., monitoring wells 2 and 3) have missing data, but the overall statistics are presented in Table 7.

4.2. Decision Support Analysis

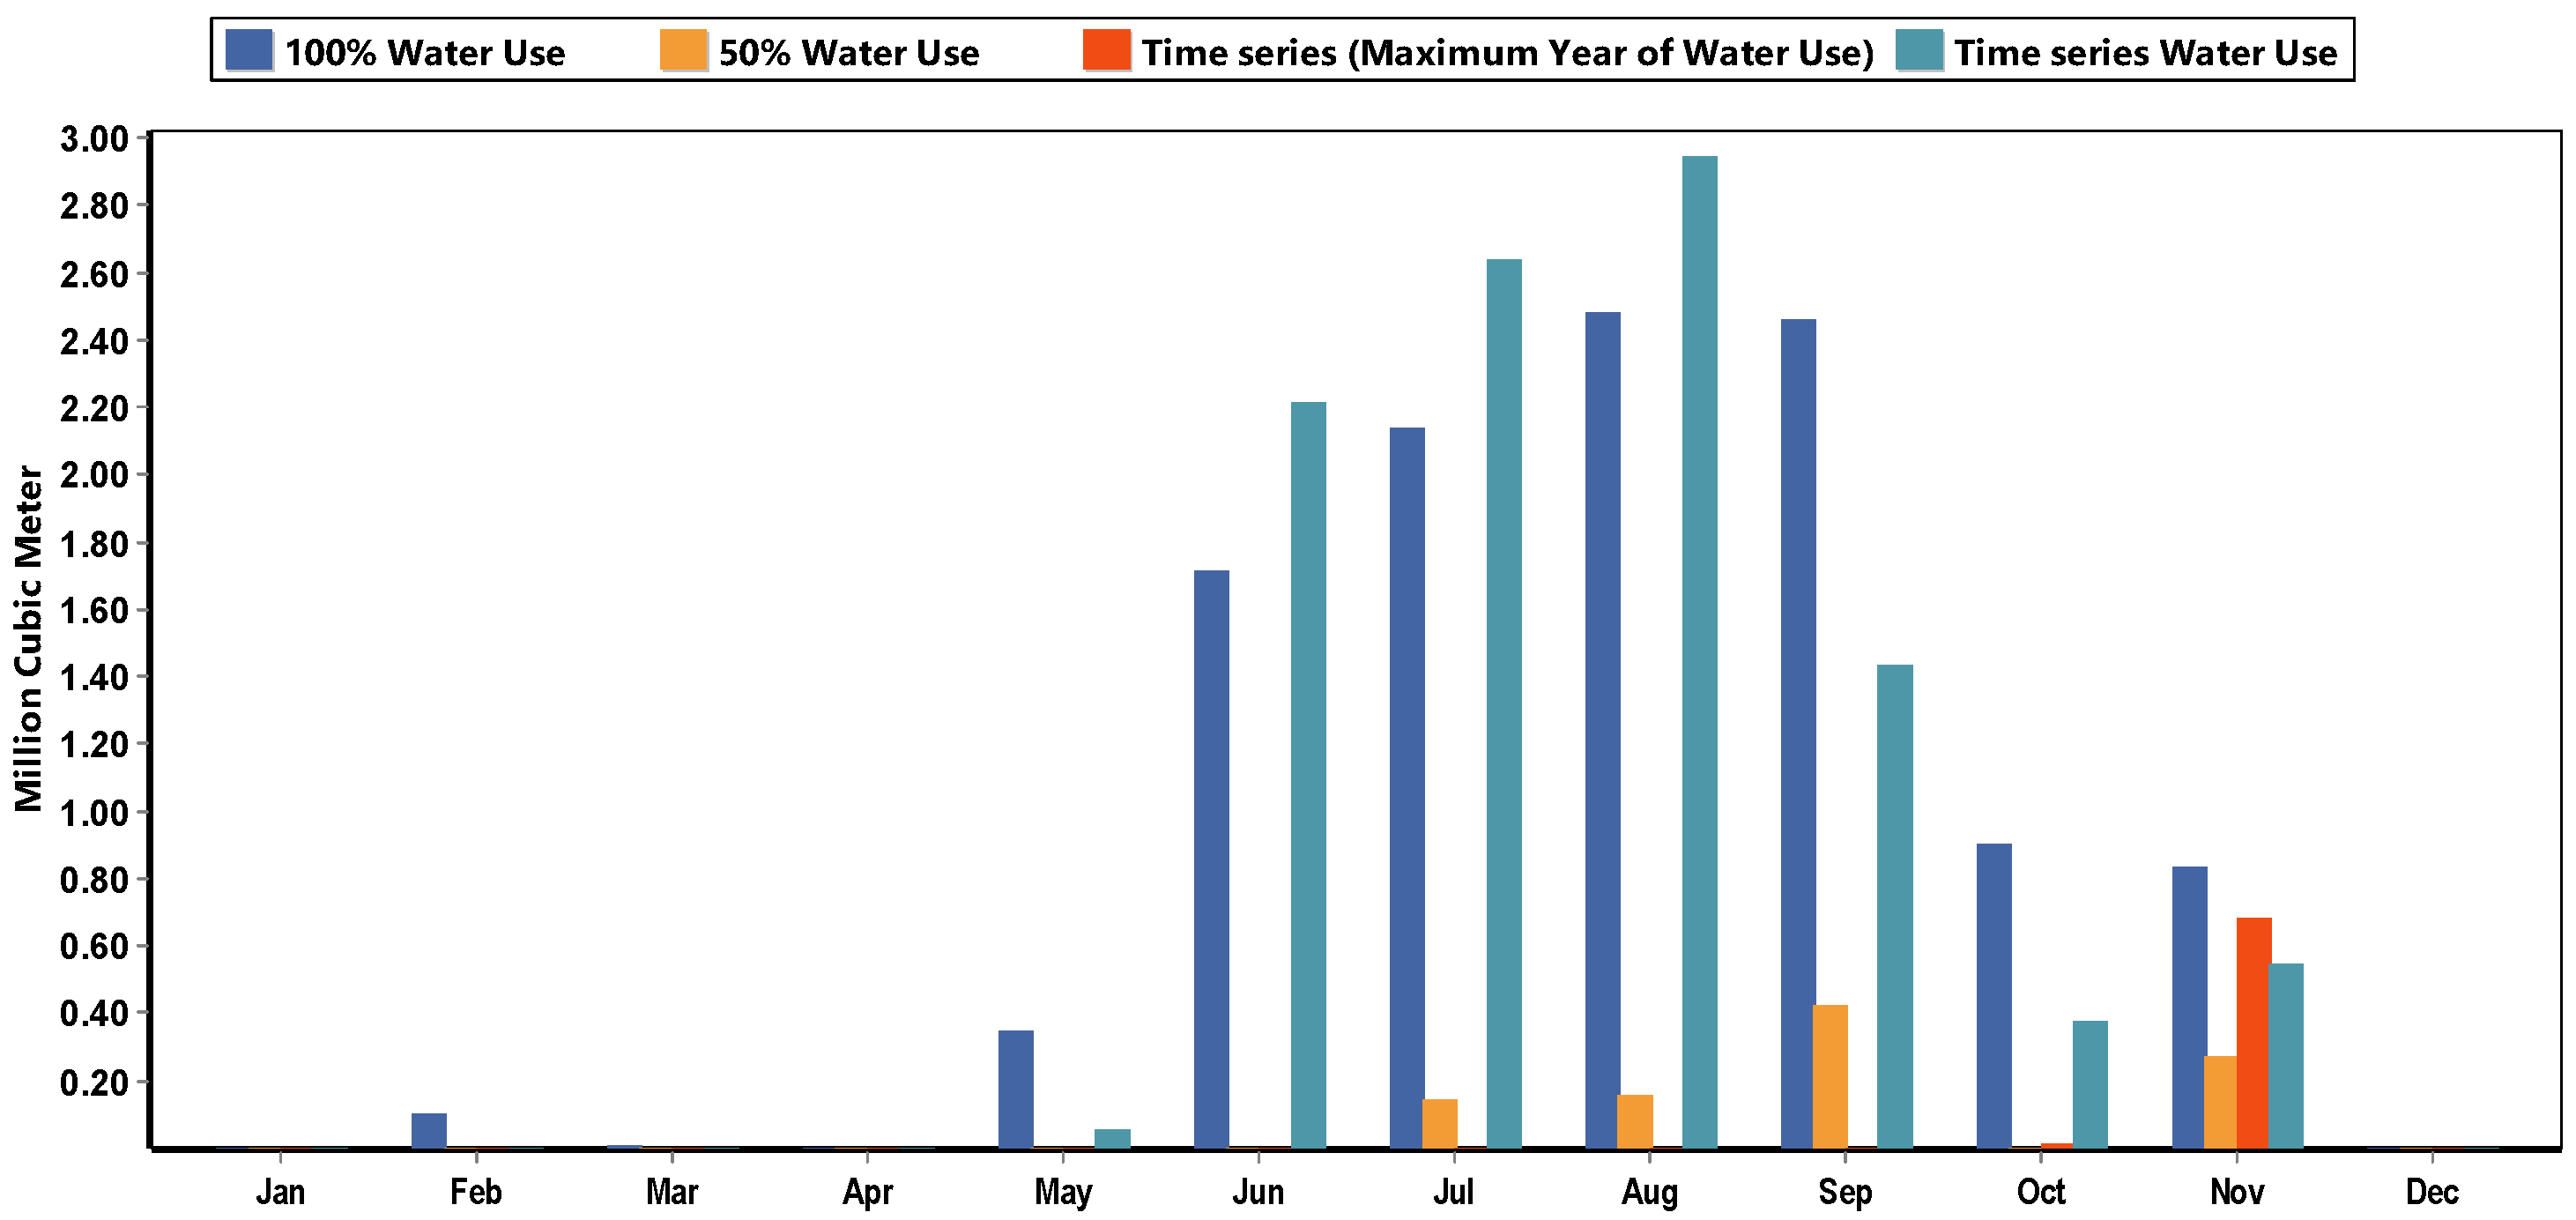
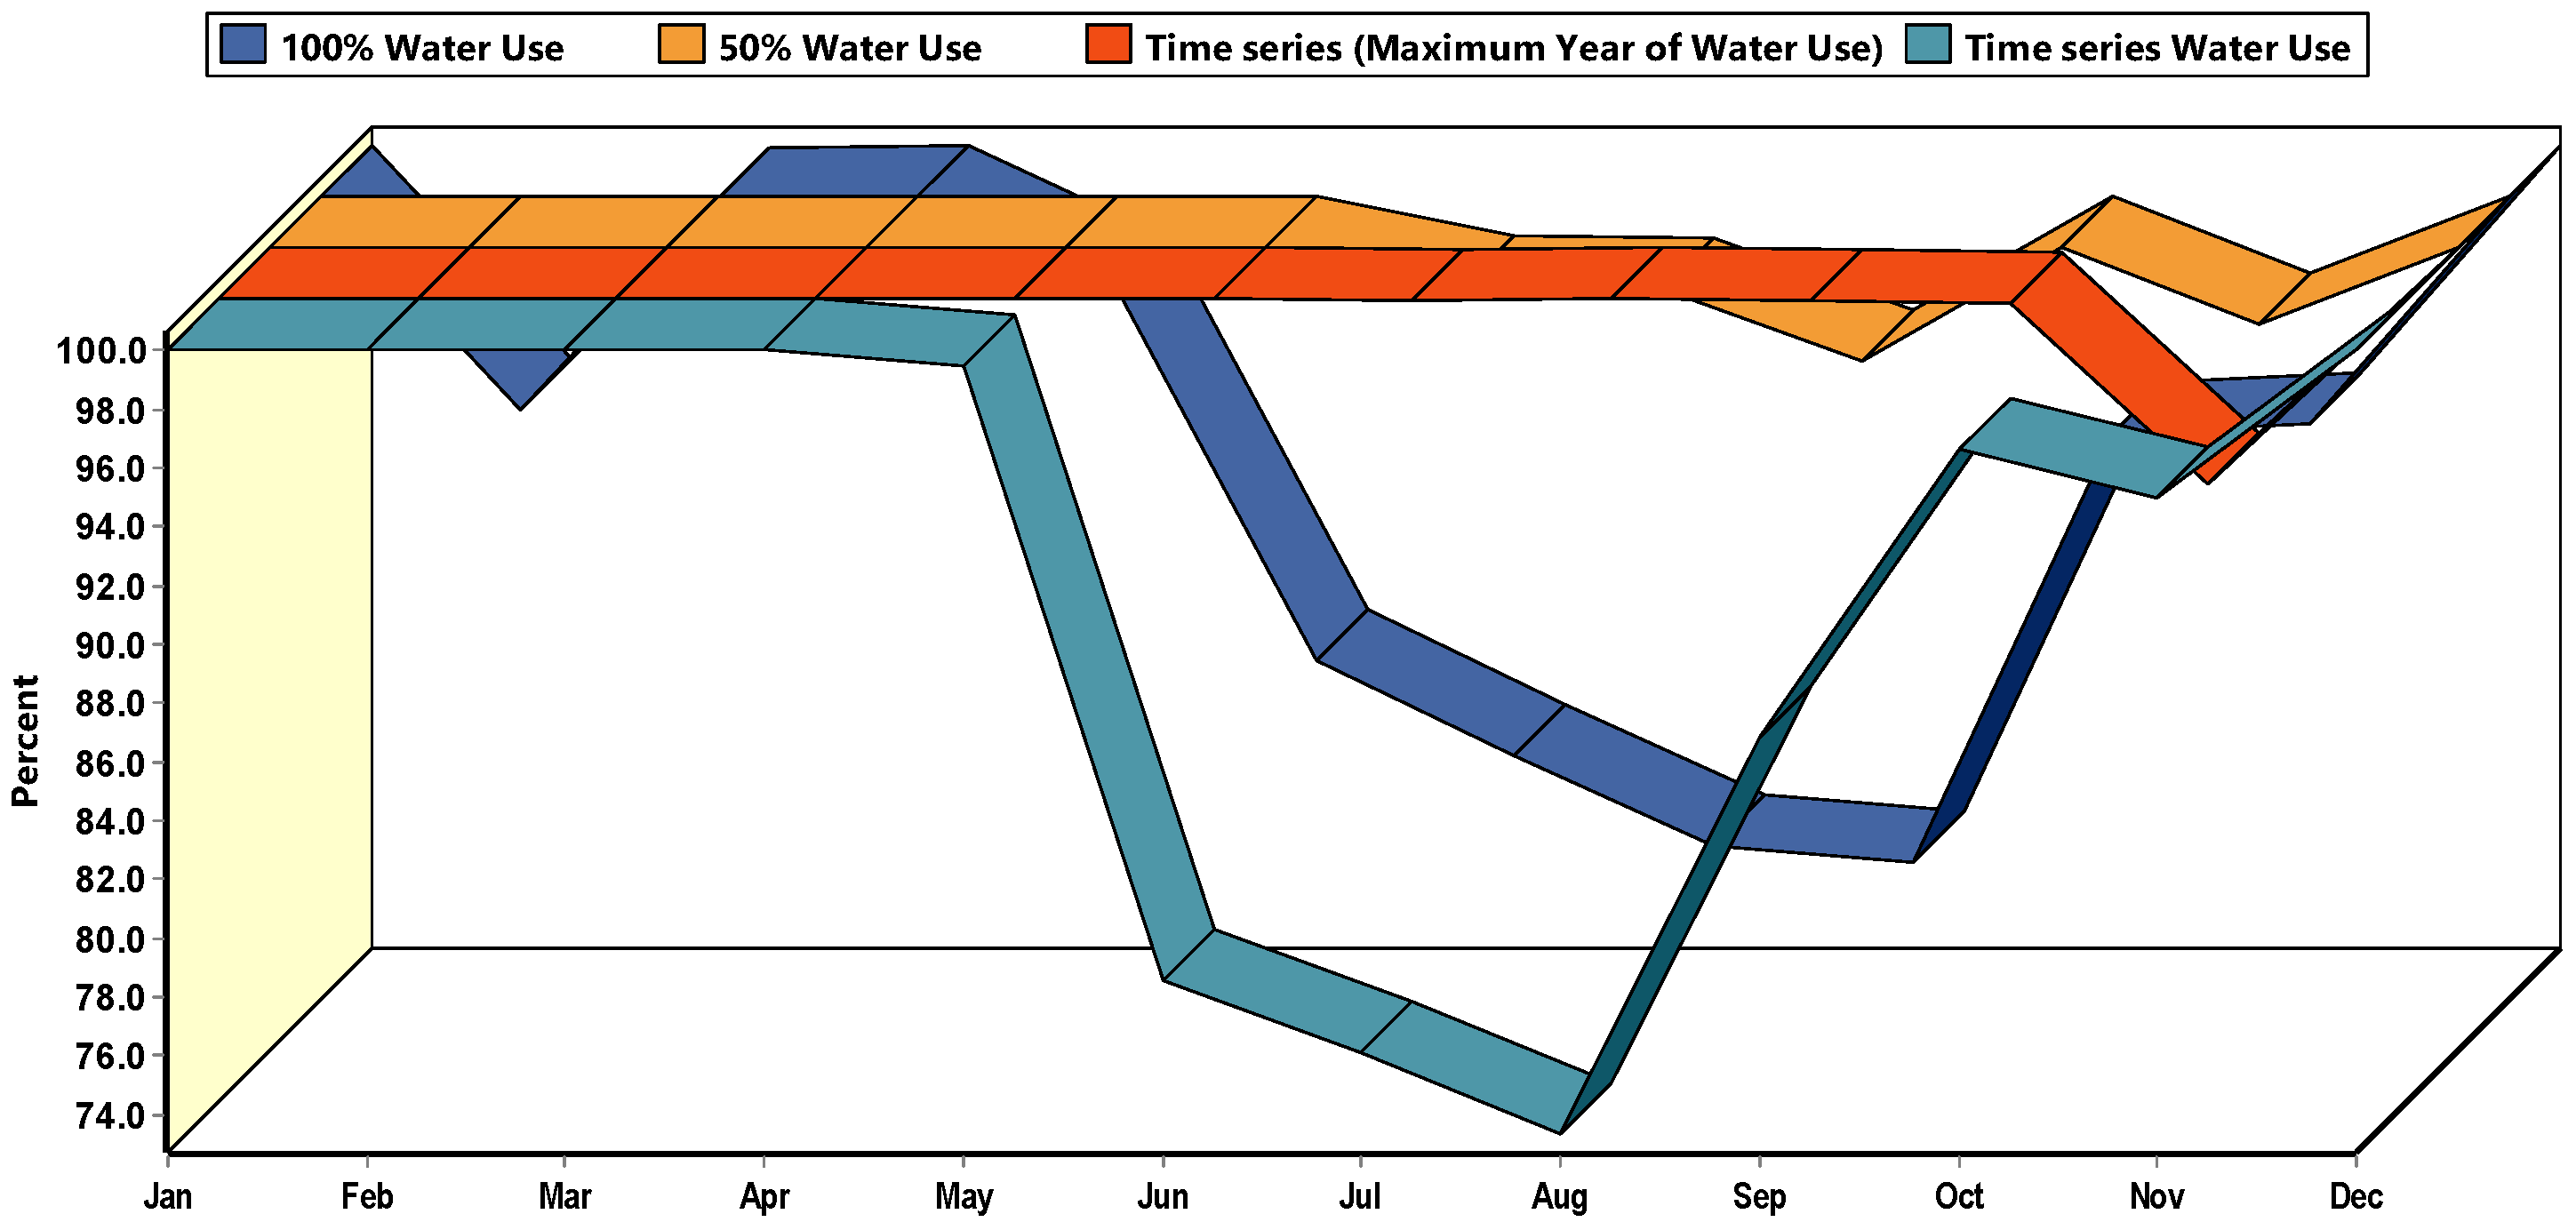
The coupled SWAT-MODFLOW-WEAP model (allocation–simulation model) is built for the future scenario to evaluate the likely unmet demands at the public water supply locations. Firstly, the unmet flow requirement and percentage of coverage at the Chester weir station are analysed (4.2 m3/s). Clearly, in RCP85 scenarios, there is an unmet flow demand from June until November, with a maximum monthly average unmet flow of 2.95 million cubic meter (74% of flow needed) in August, as illustrated in Figure 17 and Figure 18.
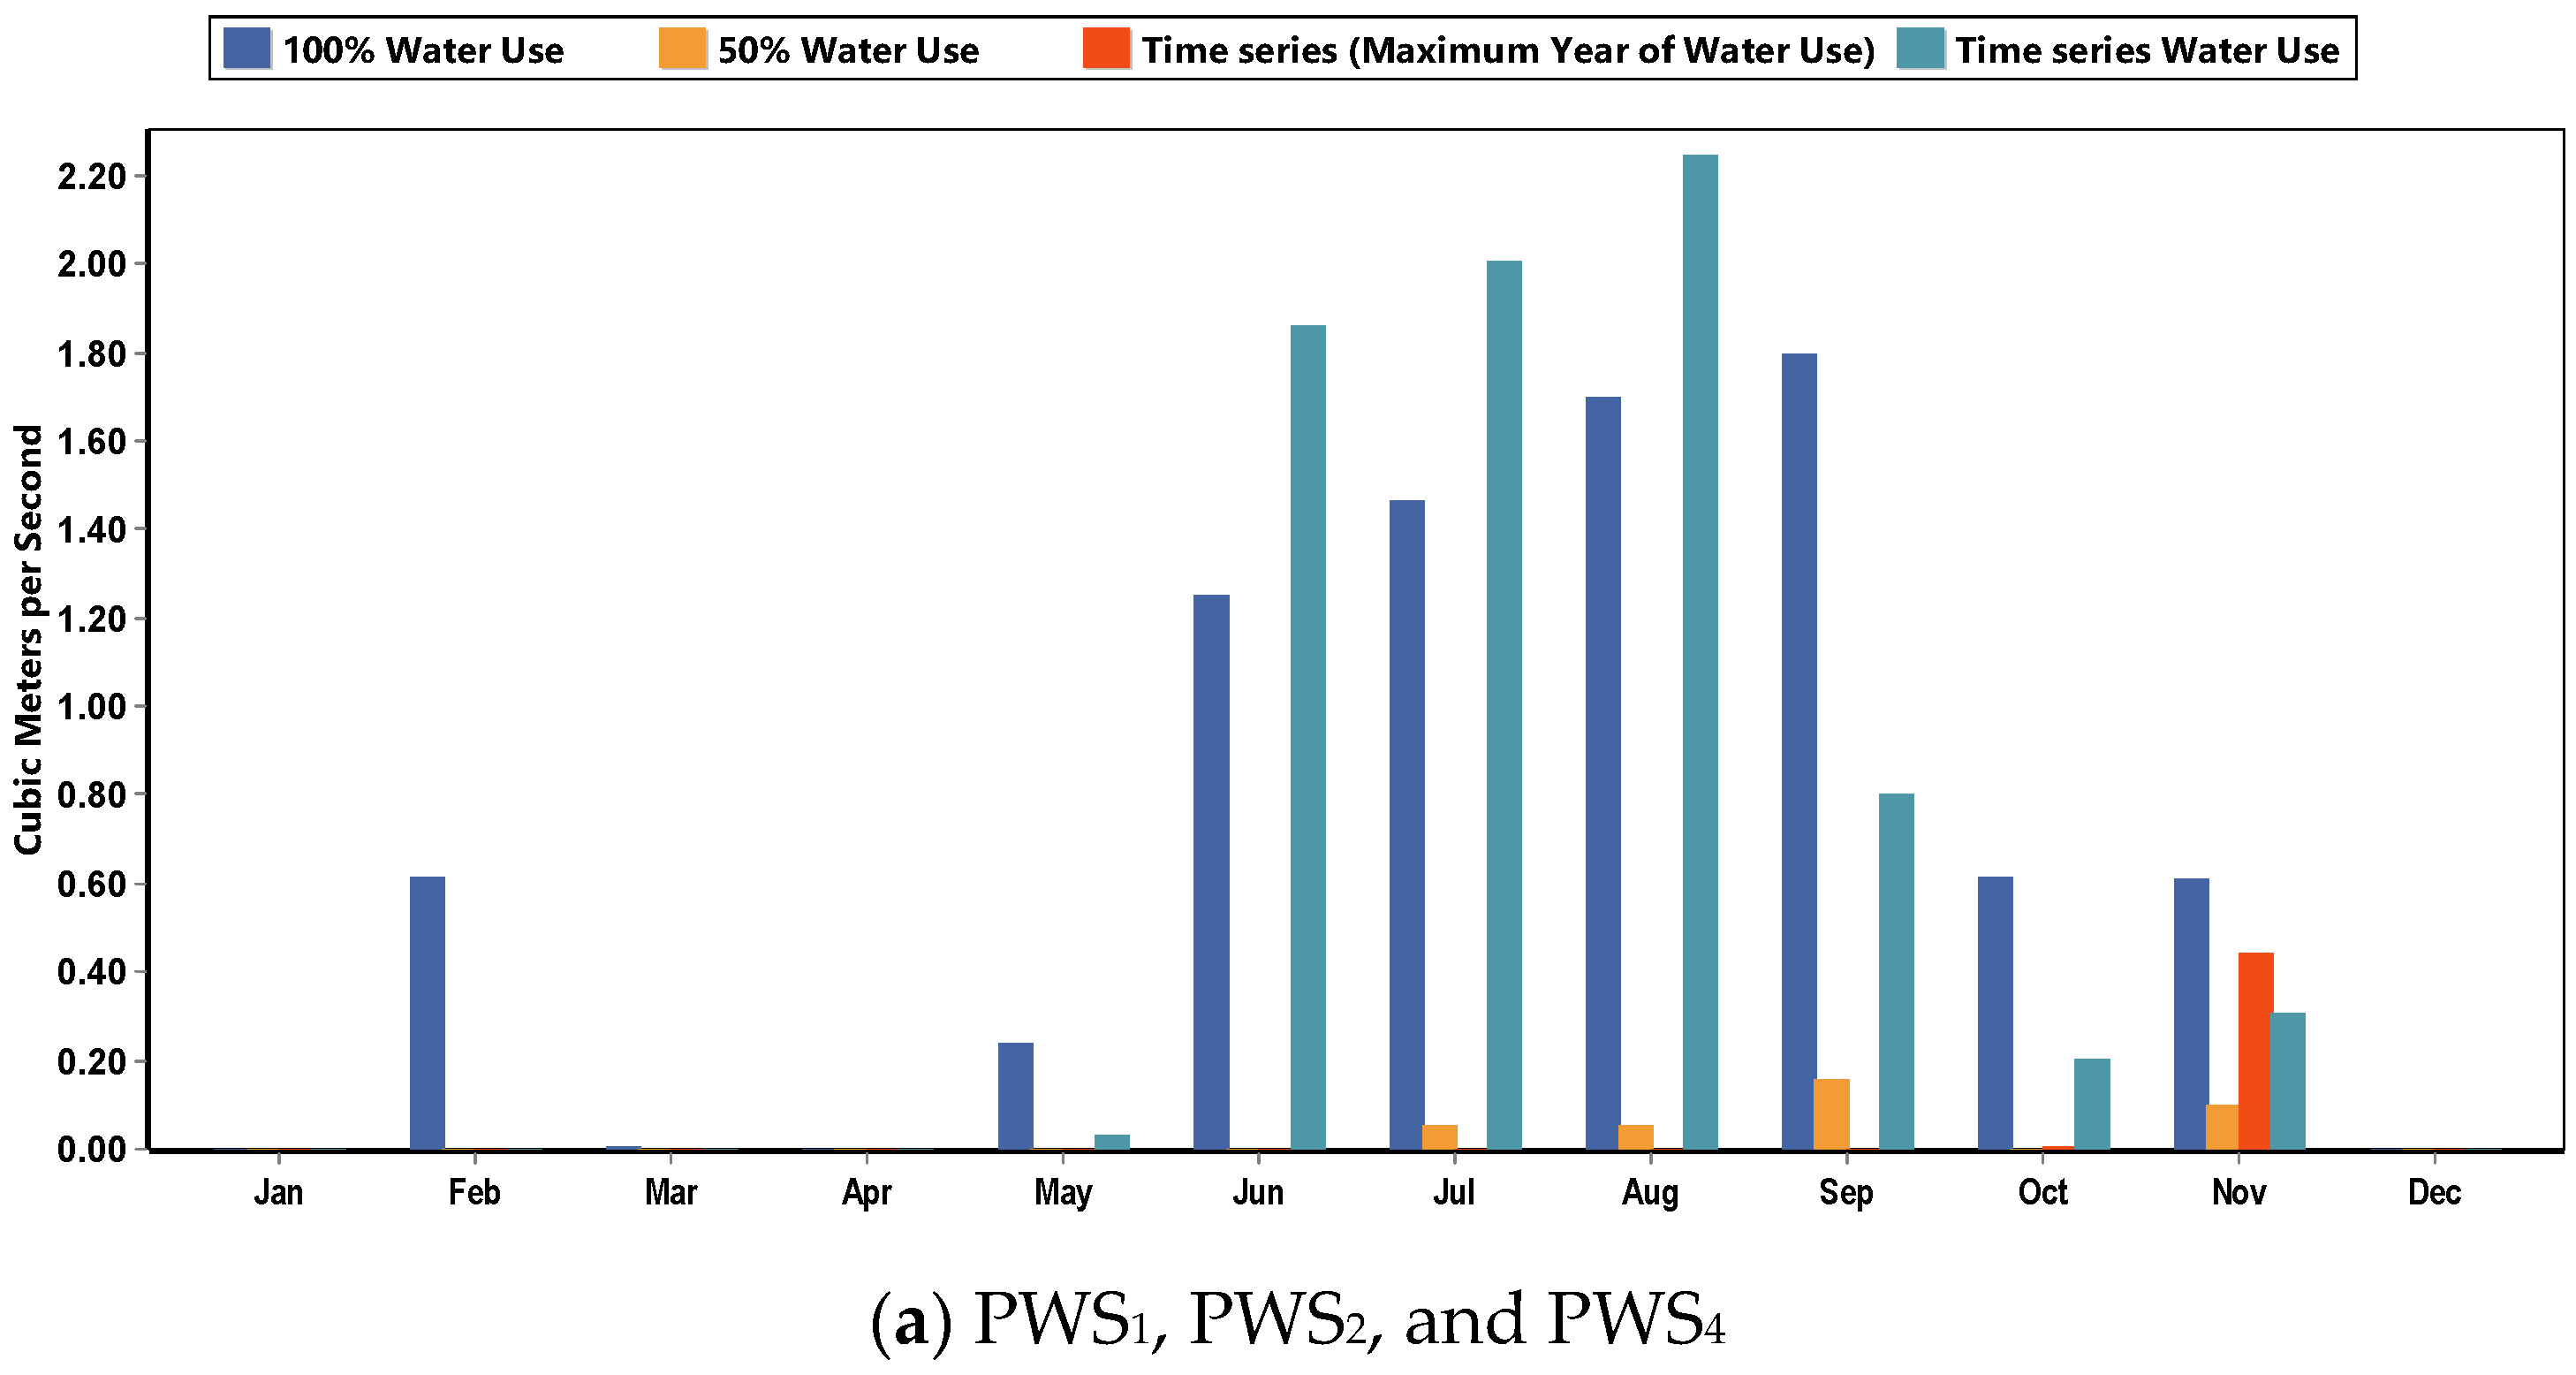
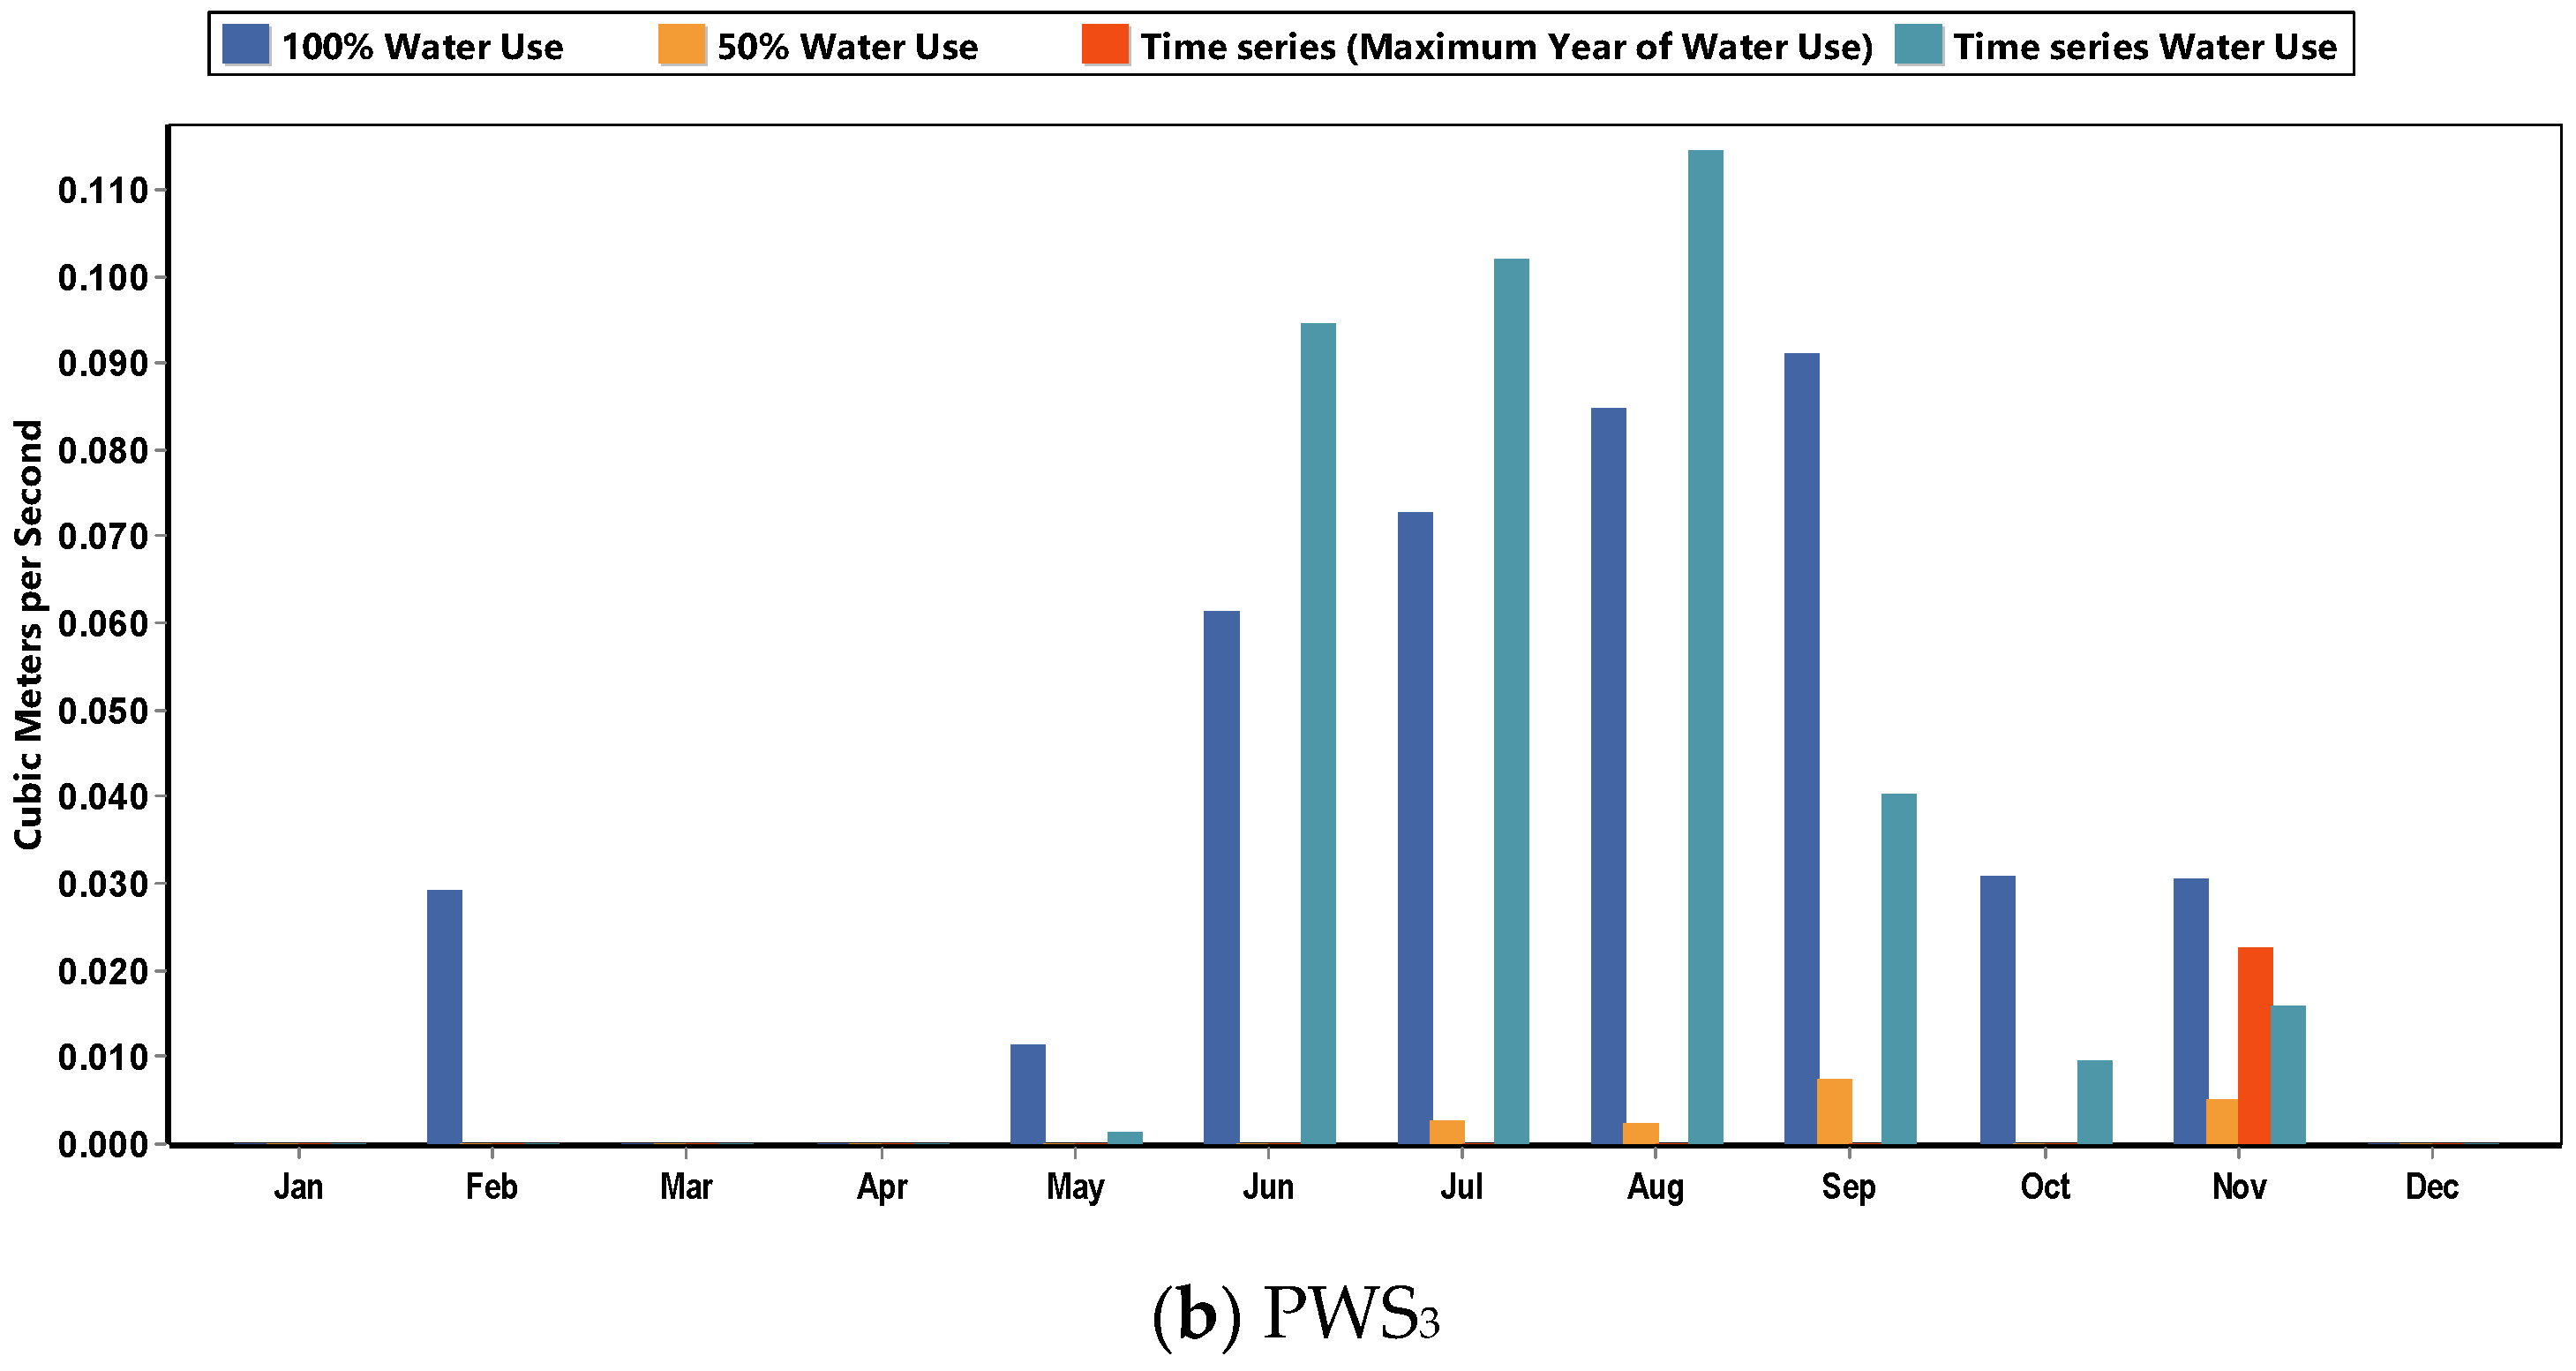
The average monthly unmet demand for all scenarios is revealed in Figure 19. It can be clearly seen that in summer, a significant unmet demand reaches more than 2.2 m3/s for PWS1, PWS2, and PWS4, as shown in Figure 19a, for all the future scenarios. On the other hand, PWS3 also has unmet demand, with a maximum projected value of 0.11 m3/s, as shown in Figure 19b. In two of the future demand scenarios, there is an intensified occurrence of inadequate streamflow to satisfy PWS demand, especially in the summer season. The major result is that declines in forecasted streamflow during the summer and autumn months result in continued shortages of water, even in the reduced demand scenario. However, during the spring months, streamflow is adequate. This indicates that there is no compensation for decreased streamflow and the increased demand observed in summer and autumn, leading to a growth in the volume of unmet demand in most scenarios. These findings are with agreement with reports [54,55] itemizing the required stages for the resilience of the water supply in Wales and affirming that more action is needed to adequately meet public water demands in the coming decades. The observed imbalances could pose an issue to the water supply, particularly during extended droughts, as increased flow in winter and spring will likely be ineffective at addressing summer and autumn water shortages, if reservoirs are already full.
The findings of this study are similar to research work performed by Dallison et al. [30], who investigated the influence of climate change on key surface-water withdrawals (public water supply and hydroelectric power) in two watersheds (Conwy and Tywi) in Wales. They used the SWAT model to simulate river flow under the RCP8.5 future scenario. WEAP was utilized to assess the unmet demands, and a Mann–Kendall analysis was conducted to characterize and detect the trends of the model outputs. The results highlighted that there was a clear trend in the future availability of water for major PWS abstraction and hydroelectric power locations within the two watersheds. Moreover, the results revealed that spring and autumn were the seasons most influenced by long-term water availability, while summer and winter were more affected in the medium-term. Owing to large declines seen in future streamflow, the increase is likely to be placed on the PWS. Hence, a sensible plan is needed to ensure sustained water supply.

5. Summary and Conclusions

In this article, we present a coupled SWAT-MODFLOW-WEAP system to estimate the impact of future climate conditions on water supply and demand in a complex watershed system, the Dee River watershed in Wales, United Kingdom. The SWAT model is created and coupled with the groundwater flow model MODFLOW to simulate streamflow and baseflow for the Dee River basin, with the latter being a key component of minimum flows and overall water resources management in the region.
The coupled SWAT-MODFLOW-WEAP model is constructed, calibrated, and tested against historical streamflow, baseflow, and groundwater head and then used with climate change data of the UKCP18 project to evaluate the unmet demand for water for public water supply in the downstream region (city of Chester) as well as to check the unmet streamflow requirement in Chester weir. The high-resolution future climate data of the UKCP18 model (precipitation, maximum and minimum air temperature) for the future scenario of RCP85 are used as inputs in the calibrated SWAT-MODFLOW model to simulate the catchment hydrology for the period of 2021–2039 with a 2-year warm-up period. The simulated discharge from the SWAT-MODFLOW model is used as the input to the modelled reach in the WEAP model at a monthly time step.
Four scenarios of the water use rates at four selected locations of public water supplies downstream of the Dee River basin with a considerable amount of water abstraction is utilized to evaluate the likely unmet demands. The results agree that there is expected unmet demand in large quantities, especially in the summer season (June, July, and August). Actions and measurements for mitigating the effects of unmet water demands and uncertainties about how the climate will change and how it will affect water resources are the challenges that planners and designers will have to cope with. How water resources management will have to adapt to climate changes is the pressing question to be answered. The possible mitigations for the unmet water demands are:
(1)
Augmenting streamflow from a deep well source;
(2)
Using reclaimed water;
(3)
Storing and recovering surface water or groundwater;
(4)
Transferring water into basins;
(5)
Adjusting reservoir regulation rules.
Overall, the study shows a promising direction for using coupled surface–groundwater models and allocation models (WEAP) in IWRM. We expect that this same system can be used in other regions of the world to estimate future water supplies and aid in water management decisions.
Author Contributions

Conceptualization, R.T.B. and Y.X.; methodology, R.T.B., Y.X. and S.A.A.; formal analysis, S.A.A., R.T.B. and Y.X.; writing—original draft preparation, S.A.A.; writing—review and editing, R.T.B. All authors have read and agreed to the published version of the manuscript.

Funding

This research study received no external funding.

Data Availability Statement

Most datasets used in this research were obtained from publicly accessible repositories. Interested users should check the references section and Table 1 for further information. Groundwater and geological data were obtained from British Geological Survey BGS under academic license. The water abstractions were obtained from Natural Resources Wales under academic license.

Acknowledgments

Co-author Salam A. Abbas was supported by the Ph.D. scholarship provided by the Higher Committee for Education Development in Iraq, for which we are grateful. We also thank Natural Resources Wales, the UK Centre for Ecology and Hydrology, and the British Atmospheric Data Centre for the provision of the required datasets to support this study. We would like to thank the anonymous reviewers and the editors for their valuable comments and advice, which have helped to improve the quality of this paper.

Conflicts of Interest

The authors declare no conflict of interest. This work is an extended paper based on a Ph.D. thesis and conference paper presented at Hydroinformatics conference HIC 2018.

Correction Statement

This article has been republished with a minor correction to the image quality of figure (1,2,3,4,5,6,7,8,10,11,12,14,15,16). This change does not affect the scientific content of the article.

References

  1. Aeschbach-Hertig, W.; Gleeson, T. Regional strategies for the accelerating global problem of groundwater depletion. Nat. Geosci. 2012, 5, 853–861. [Google Scholar] [CrossRef]
  2. Taylor, R.G.; Scanlon, B.; Döll, P.; Rodell, M.; Van Beek, R.; Wada, Y.; Longuevergne, L.; Leblanc, M.; Famiglietti, J.S.; Edmunds, M.; et al. Ground water and climate change. Nat. Clim. Chang. 2013, 3, 322–329. [Google Scholar] [CrossRef]
  3. Brunner, P.; Simmons, C. HydroGeoSphere: A Fully Integrated, Physically Based Hydrological Model. Ground Water 2012, 50, 170–176. [Google Scholar] [CrossRef]
  4. Miller, N.; Dale, L.; Brush, C.; Vicuna, S.; Kadir, T.; Dogrul, E.; Chung, F. Drought Resilience of the California Central Valley Surface-Ground-Water-Conveyance System. J. Am. Water Resour. Assoc. 2009, 45, 857–866. [Google Scholar] [CrossRef]
  5. Im, S.; Kim, H.; Kim, C.; Jang, C. Assessing the impacts of land use changes on watershed hydrology using MIKE SHE. Environ. Geol. 2008, 57, 231–239. [Google Scholar] [CrossRef]
  6. Qu, Y.; Duffy, C. A semidiscrete finite volume formulation for multiprocess watershed simulation. Water Resour. Res. 2007, 43, W08419. [Google Scholar] [CrossRef]
  7. Arnold, J.; Srinivasan, R.; Muttiah, R.; Williams, J. Large Area Hydrologic Modeling and Assessment Part I: Model Development. J. Am. Water Resour. Assoc. 1998, 34, 73–89. [Google Scholar] [CrossRef]
  8. Niswonger, R.G.; Panday, S.; Ibaraki, M. MODFLOW-NWT, a Newton Formulation for MODFLOW-2005; (No. 6-A37); U.S. Geological Survey: Reston, VA, USA, 2011.
  9. Bailey, R.T.; Wible, T.C.; Arabi, M.; Records, R.M.; Ditty, J. Assessing regional-scale spatio-temporal patterns of groundwater-surface water interactions using a coupled SWAT-MODFLOW model. Hydrol. Processes 2016, 30, 4420–4433. [Google Scholar] [CrossRef]
  10. Guevara Ochoa, C.; Medina Sierra, A.; Vives, L.; Zimmermann, E.; Bailey, R. Spatio-temporal patterns of the interaction between groundwater and surface water in plains. Hydrol. Processes 2019, 34, 1371–1392. [Google Scholar] [CrossRef]
  11. Taie Semiromi, M.; Koch, M. How Do Gaining and Losing Streams React to the Combined Effects of Climate Change and Pumping in the Gharehsoo River Basin, Iran? Water Resour. Res. 2020, 56, e2019WR025388. [Google Scholar] [CrossRef]
  12. Yifru, B.; Chung, I.; Kim, M.; Chang, S. Assessment of Groundwater Recharge in Agro-Urban Watersheds Using Integrated SWAT-MODFLOW Model. Sustainability 2020, 12, 6593. [Google Scholar] [CrossRef]
  13. Ehtiat, M.; Jamshid Mousavi, S.; Srinivasan, R. Groundwater Modeling Under Variable Operating Conditions Using SWAT, MODFLOW and MT3DMS: A Catchment Scale Approach to Water Resources Management. Water Resour. Manag. 2018, 32, 1631–1649. [Google Scholar] [CrossRef]
  14. Guzman, J.A.; Moriasi, D.N.; Gowda, P.H.; Steiner, J.L.; Starks, P.J.; Arnold, J.G.; Srinivasan, R. A model integration framework for linking SWAT and MODFLOW. Environ. Modell. Softw. 2015, 73, 103–116. [Google Scholar] [CrossRef]
  15. Chang, S.; Graham, W.; Geurink, J.; Wanakule, N.; Asefa, T. Evaluation of impacts of future climate change and water use scenarios on regional hydrology. Hydrol. Earth Syst. Sci. 2018, 22, 4793–4813. [Google Scholar] [CrossRef]
  16. Reshmidevi, T.; Nagesh Kumar, D.; Mehrotra, R.; Sharma, A. Estimation of the climate change impact on a catchment water balance using an ensemble of GCMs. J. Hydrol. 2018, 556, 1192–1204. [Google Scholar] [CrossRef]
  17. Solomon, S. (Ed.) Climate Change 2007—The Physical Science Basis: Working Group I Contribution to the Fourth Assessment Report of the IPCC; Cambridge University Press: Cambrige, UK, 2007; Volume 4. [Google Scholar]
  18. Abedin, M.; Collins, A.; Habiba, U.; Shaw, R. Climate Change, Water Scarcity, and Health Adaptation in Southwestern Coastal Bangladesh. Int. J. Disaster Risk Sci. 2018, 10, 28–42. [Google Scholar] [CrossRef]
  19. Huang, X.; Swain, D. Climate change is increasing the risk of a California megaflood. Sci. Adv. 2022, 8, eabq0995. [Google Scholar] [CrossRef]
  20. Loucks, D. Water Resource Management Models. Bridge 2008, 38, 24–30. [Google Scholar]
  21. Condon, L.; Maxwell, R. Implementation of a Linear Optimization Water Allocation Algorithm into a Fully Integrated Physical Hydrology Model. Adv. Water Resour. 2013, 60, 135–147. [Google Scholar] [CrossRef]
  22. Mehta, V.; Aslam, O.; Dale, L.; Miller, N.; Purkey, D. Scenario-based water resources planning for utilities in the Lake Victoria region. Phys. Chem. Earth 2013, 61, 22–31. [Google Scholar] [CrossRef]
  23. Joyce, B.; Mehta, V.; Purkey, D.; Dale, L.; Hanemann, M. Modifying agricultural water management to adapt to climate change in California’s central valley. Clim. Chang. 2011, 109, 299–316. [Google Scholar] [CrossRef]
  24. Mensah, J.; Ofosu, E.; Akpoti, K.; Kabo-Bah, A.; Okyereh, S.; Yidana, S. Modeling current and future groundwater demands in the White Volta River Basin of Ghana under climate change and socio-economic scenarios. J. Hydrol. Reg. Stud. 2022, 41, 101–117. [Google Scholar] [CrossRef]
  25. Mirdashtvan, M.; Najafinejad, A.; Malekian, A.; Sa’doddin, A. Sustainable Water Supply and Demand Management in Semi-arid Regions: Optimizing Water Resources Allocation Based on RCPs Scenarios. Water Resour. Manag. 2021, 35, 5307–5324. [Google Scholar] [CrossRef]
  26. Ahmadzadeh, H.; Mansouri, B.; Fathian, F.; Vaheddoost, B. Assessment of water demand reliability using SWAT and RIBASIM models with respect to climate change and operational water projects. Agric. Water Manag. 2022, 261, 107377. [Google Scholar] [CrossRef]
  27. Dehghanipour, A.; Zahabiyoun, B.; Schoups, G.; Babazadeh, H. A WEAP-MODFLOW surface water-groundwater model for the irrigated Miyandoab plain, Urmia lake basin, Iran: Multi-objective calibration and quantification of historical drought impacts. Agric. Water Manag. 2019, 223, 105704. [Google Scholar] [CrossRef]
  28. Ahn, S.; Jeong, J.; Kim, S. Assessing drought threats to agricultural water supplies under climate change by combining the SWAT and MODSIM models for the Geum River basin, South Korea. Hydrol. Sci. J. 2016, 61, 2740–2753. [Google Scholar] [CrossRef]
  29. Ashraf Vaghefi, S.; Abbaspour, K.; Faramarzi, M.; Srinivasan, R.; Arnold, J. Modeling Crop Water Productivity Using a Coupled SWAT–MODSIM Model. Water 2017, 9, 157. [Google Scholar] [CrossRef]
  30. Dallison, R.; Patil, S.; Williams, A. Impacts of climate change on future water availability for hydropower and public water supply in Wales, UK. J. Hydrol. Reg. Stud. 2021, 36, 100866. [Google Scholar] [CrossRef]
  31. NASA/METI/AIST/Japan Spacesystems and U.S./Japan ASTER Science Team. ASTER Global Digital Elevation Model [Data set]. NASA EOSDIS Land Processes DAAC: Sioux Falls, SD, USA, 2009. [Google Scholar] [CrossRef]
  32. Morton, R.D.; Rowland, C.S.; Wood, C.M.; Meek, L.; Marston, C.G.; Smith, G.M. Land Cover Map 2007 (25 m raster, GB) v1.2. NERC Environmental Information Data Centre: Lancaster, UK, 2014. [Google Scholar] [CrossRef]
  33. Batjes, N. A world dataset of derived soil properties by FAO–UNESCO soil unit for global modelling. Soil Use Manag. 1997, 13, 9–16. [Google Scholar] [CrossRef]
  34. Neitsch, S.L.; Arnold, J.G.; Kiniry, J.R.; Williams, J.R. Soil and Water Assessment Tool Theoretical Documentation Version 2009; Texas Water Resources Institute: College Station, TX, USA, 2011. [Google Scholar]
  35. McDonald, M.G.; Harbaugh, A.W. A Modular Three-Dimensional Finite-Difference Ground-Water Flow Model; U.S. Geological Survey: Reston, VA, USA, 1988; 6, p. A1.
  36. Kim, N.; Chung, I.; Won, Y.; Arnold, J. Development and Application of the Integrated SWAT–MODFLOW Model. J. Hydrol. 2008, 356, 1–16. [Google Scholar] [CrossRef]
  37. Bailey, R.; Rathjens, H.; Bieger, K.; Chaubey, I.; Arnold, J. SWATMOD-Prep: Graphical user interface for preparing coupled SWAT-MODFLOW simulations. J. Am. Water Resour. Assoc. 2017, 53, 400–410. [Google Scholar] [CrossRef]
  38. Abbas, S.; Xuan, Y.; Bailey, R. Improving River flow simulation using a coupled surface-groundwater model for integrated water resources management. In Proceedings of the 13th International Conference on Hydroinformatics, Palermo, Italy, 1–7 July 2018. [Google Scholar] [CrossRef]
  39. Abbas, S. Hydrological Modelling for Integrated Water Resources Management in a Changing Climate. Ph.D. Thesis, Swansea University, Swansea, UK, 2018. [Google Scholar] [CrossRef]
  40. DEFRA. The Impact of Water Abstraction Reform: Public Water Supply Operations; Department for Environment, Food and Rural Affairs/Flood Risk Management Division: Wallingford, UK, 2014.
  41. Abbas, S.; Xuan, Y. Development of a New Quantile-Based Method for the Assessment of Regional Water Resources in a Highly-Regulated River Basin. Water Resour. Manag. 2019, 33, 3187–3210. [Google Scholar] [CrossRef]
  42. Abbaspour, K.; Johnson, C.; Van Genuchten, M. Estimating Uncertain Flow and Transport Parameters Using a Sequential Uncertainty Fitting Procedure. Vadose Zone J. 2004, 3, 1340–1352. [Google Scholar] [CrossRef]
  43. Abbaspour, K.; Yang, J.; Maximov, I.; Siber, R.; Bogner, K.; Mieleitner, J.; Zobrist, J.; Srinivasan, R. Modelling Hydrology and Water Quality in the Pre-alpine/alpine Thur Watershed using SWAT. J. Hydrol. 2007, 333, 413–430. [Google Scholar] [CrossRef]
  44. Lyne, V.; Hollick, M. Stochastic time-variable rainfall-runoff modeling. In Institute of Engineers Australia National Conference; Institute of Engineers Australia: Barton, Australia, 1979; Volume 79, pp. 89–93. [Google Scholar]
  45. Nathan, R.; McMahon, T. Evaluation of automated techniques for base flow and recession analyses. Water Resour. Res. 1990, 26, 1465–1473. [Google Scholar] [CrossRef]
  46. Fuka, D.R.; Walter, M.T.; Archibald, J.A.; Steenhuis, T.S.; Easton, Z.M.; Fuka, M.D. Package ‘EcoHydRology’; R Project: Vienna, Austria, 2015. [Google Scholar]
  47. Met Office Hadley Center. UKCP18 Convection-Permitting Model Projections for the UK at 2.2km Resolution; NERC EDS Centre for Environmental Data Analysis: Didcot, UK, 2019. Available online: http://catalogue.ceda.ac.uk/uuid/ad2ac0ddd3f34210b0d6e19bfc335539. (accessed on 12 March 2022).
  48. Yates, D.; Sieber, J.; Purkey, D.; Huber-Lee, A. WEAP21—A Demand, Priority, and Preference-Driven Water Planning Model. Water Int. 2005, 30, 487–500. [Google Scholar] [CrossRef]
  49. Sieber, J. WEAP: Water Evaluation and Planning System. 2022. Available online: http://www.weap21.org/index.asp?action=201. (accessed on 26 January 2018).
  50. Bhave, A.; Conway, D.; Dessai, S.; Stainforth, D. Water Resource Planning Under Future Climate and Socioeconomic Uncertainty in the Cauvery River Basin in Karnataka, India. Water Resour. Res. 2018, 54, 708–728. [Google Scholar] [CrossRef]
  51. Katirtzidou, M.; Latinopoulos, P. Allocation of surface and subsurface water resources to competing uses under climate changing conditions: A case study in Halkidiki, Greece. Water Supply 2018, 18, 1151–1161. [Google Scholar] [CrossRef]
  52. Sieber, J.; Purkey, D. WEAP Water Evaluation and Planning System: User Guide; Stockholm Environment Institute, US Centre: Somerville, MA, USA, 2011. [Google Scholar]
  53. Waterwise. Water—The Facts Why Do We Need to Think About Water? Waterwise: London, UK, 2012. Available online: http://www.broads-authority.gov.uk/looking-after/managing-land-and-water/conservation-publications-and-reports/water-conservation-reports/28.-Water-Factsheet-2012.pdf. (accessed on 11 November 2017).
  54. ASC. UK Climate Change Risk Assessment 2017. Synthesis Report: Priorities for the Next Five Years; Adaptation Sub-Committee of the Committee on Climate Change: London, UK, 2016. Available online: https://www.theccc.org.uk/wp-content/uploads/2016/07/UK-CCRA-2017-Synthesis-Report-Committee-on-Climate-Change.pdf. (accessed on 7 September 2022).
  55. Welsh Government. Water Strategy for Wales. 2015. Available online: https://gov.wales/sites/default/files/publications/2019-06/water-strategy.pdf. (accessed on 7 September 2022).
Figure 1. River Dee catchment location.
Hydrology 09 00164 g001
Figure 2. Average annual precipitation in the Dee River basin.
Hydrology 09 00164 g002
Figure 3. Maps of aquifer thickness (m), initial groundwater depth, and permeability indices for the aquifer and bedrock in the Dee River basin.
Hydrology 09 00164 g003
Figure 4. Flowchart illustrating the coupled SWAT-MODFLOW-WEAP model with climate model of UKCP18 for different scenarios of water demands for River Dee watershed.
Hydrology 09 00164 g004
Figure 5. Schematic representation of conceptual water balance of coupled SWAT MODFLOW model [9,38,39].
Hydrology 09 00164 g005
Figure 6. Flowchart presenting the model code sequence of the coupled SWAT-MODFLOW model [9].
Hydrology 09 00164 g006
Figure 7. Land-use and soil maps in the Dee River basin.
Hydrology 09 00164 g007
Figure 8. Significant surface water abstraction in the Dee River basin.
Hydrology 09 00164 g008
Figure 9. Locations of the main inlets and the river gauge stations in the Dee River basin.
Hydrology 09 00164 g009
Figure 10. MODFLOW grid with the location of groundwater monitoring wells in the Dee River basin.
Hydrology 09 00164 g010
Figure 11. Location of the license withdraw wells used in the MODFLOW model.
Hydrology 09 00164 g011
Figure 12. Study region of coupled SWAT-MODFLOW-WEAP model (surface-water abstraction, in m3/day).
Hydrology 09 00164 g012
Figure 13. Public water supply abstractions for PWS1 in scenarios III and IV (million cubic meter per month).
Hydrology 09 00164 g013
Figure 14. Comparison of simulated river flow from the standalone SWAT model and the coupled SWAT-MODFLOW at Ironbridge for the water year of 1999.
Hydrology 09 00164 g014
Figure 15. Comparison of simulated baseflow from the standalone SWAT model and the coupled SWAT-MODFLOW at Pont-y-Capel for the period of 1995–2000.
Hydrology 09 00164 g015
Figure 16. Comparison of simulated groundwater level from coupled SWAT-MODFLOW at Monitoring Well 1 for the period of 1995–2000.
Hydrology 09 00164 g016
Figure 17. Average monthly unmet streamflow requirements (million cubic meter) in Chester weir for RCP85 future scenarios for the period of 2021–2039.
Hydrology 09 00164 g017
Figure 18. Average monthly flow requirement coverage (% of flow requirement) in Chester weir for the period of 2021–2039.
Hydrology 09 00164 g018
Figure 19. Average monthly unmet demand (m3/s) for public water supply (PWS) in future scenarios for the period of 2023–2039.
Hydrology 09 00164 g019aHydrology 09 00164 g019b
Table 1. Data collected for the hydrological model.
DataResolutionSource
Digital Elevation Model (DEM)25 mASTER Global Digital Elevation Model Version 2. NASA [31].
Land-use map25 mLand Cover Map 2007 (25 m raster, GB) v1.2 [32].
River network1:15,000 to 1:30,000OS Open Rivers Ordnance Survey (GB), EDINA maps. https://www.ordnancesurvey.co.uk/business-and-government/products/os-open-rivers.html (accessed on 29 August 2015).
River flow dataDaily (1970–2003)National River Flow Archive. Centre for Ecology and Hydrology. https://nrfa.ceh.ac.uk/data/search (accessed on 1 October 2015).
Precipitation and air temperatureDaily (1970–2003)Met Office—MIDAS Land Surface Stations data. British Atmospheric Data Centre. https://www.ceda.ac.uk/ (accessed on 7 October 2015).
Surface–groundwater withdrawsNANatural Resources Wales. Unpublished raw data.
Groundwater depth map50 mBritish Geological Survey, BSG.
Soil map50 m British Geological Survey, BSG.
Soil map3.5 kmDigital Soil Map of the World and Derived Soil Properties. FAO [33].
Aquifer designation50 mBritish Geological Survey, BSG.
Groundwater levelDaily (1975–2014)British Geological Survey, BSG.
UKCP18 model projections for the UK2.2 km resolutionBritish Atmospheric Data Centre (BADC) https://catalogue.ceda.ac.uk/uuid/ad2ac0ddd3f34210b0d6e19bfc335539 (accessed on 12 March 2022).
Table 2. River gauge stations utilized in the calibration and validation of the hydrological model.
Station NameLatitudeLongitudeGeneral Description
Manley Hall52.966−2.972A symmetrical compound crump weir.
Chester Iron bridge53.134−2.873Station utilizes Ultra-Sonic to derive flow.
Chester Suspension Bridge53.187−2.884Ultra-Sonic flow gauge.
Alyn at Pont-y-Capel53.079−2.994A symmetrical compound crump weir.
Clywedog at Bowling Bank53.027−2.903Simple crump profile weir.
Ceiriog at Brynkinalt Weir52.928−3.050Compound broad-crested weir.
Table 3. Performance statistics of the standalone SWAT model and the coupled SWAT-MODFLOW model for the calibration period of 1995–2000 for streamflow.
Station NameSWATSWAT-MODFLOW
NSER2PBIASNSER2PBIAS
Manley Hall0.920.94−3.200.880.98+16.30
Chester Iron bridge0.800.80−6.300.760.81+9.10
Chester Suspension Bridge0.720.75−18.900.840.87+5.80
Pont-y-Capel0.670.76−21.000.680.68−1.80
Bowling Bank0.480.52−19.200.470.47−0.50
Brynkinalt Weir0.680.72+8.700.570.66+24.30
Table 4. Performance statistics of the standalone SWAT model and the coupled SWAT-MODFLOW model for the validation period of 2001–2003 for streamflow.
Station NameSWATSWAT-MODFLOW
NSER2PBIASNSER2PBIAS
Manley Hall0.940.98−5.800.900.98+14.50
Chester Iron bridge0.820.82−6.200.760.79+11.40
Chester Suspension Bridge0.780.80−10.200.830.91+16.10
Pont-y-Capel0.800.82−14.700.770.78+8.80
Bowling Bank0.660.71−25.100.670.67−3.00
Brynkinalt Weir0.660.70+10.900.570.64+27.00
Table 5. Simulated baseflow results of the standalone SWAT model and the coupled SWAT-MODFLOW model for the calibration period of 1995–2000.
Station NameSWATSWAT-MODFLOW
NSER2NSER2
Manley Hall0.550.790.790.94
Chester Iron bridge0.310.690.760.91
Chester Suspension Bridge−0.100.630.900.98
Pont-y-Capel0.270.890.580.74
Bowling Bank−0.260.910.760.80
Brynkinalt Weir0.800.880.040.75
Table 6. Simulated baseflow results of the standalone SWAT model and the coupled SWAT-MODFLOW model for the validation period of 2001–2003.
Station NameSWATSWAT-MODFLOW
NSER2NSER2
Manley Hall0.760.900.880.96
Chester Iron bridge0.700.860.830.98
Chester Suspension Bridge0.560.790.980.91
Pont-y-Capel0.570.870.670.85
Bowling Bank−0.420.860.770.85
Brynkinalt Weir0.820.890.270.87
Table 7. Statistics of simulated groundwater level of the coupled SWAT-MODFLOW model for the calibration and validation periods.
Well NameCalibration (1995–2000)Validation (2001–2003)
MAEPBIASMAEPBIAS
Monitoring Well 10.35+1.400.42+1.20
Monitoring Well 20.36+0.500.64−0.80
Monitoring Well 30.94+6.001.03+6.20
Publisher’s Note: MDPI stays neutral with regard to jurisdictional claims in published maps and institutional affiliations.