Article

Evaluation of the Impact of Meteorological Factors on the Stratification of Structure in Lake Biwa, Japan

1
Organization for Research Initiatives and Development, Doshisha University, 1-3 Tatara Miyakodani, Osaka 573-1121, Japan
2
Division of Sustainable Energy and Environmental Engineering, Graduate School of Engineering, Osaka University, 2-1 Yamadaoka, Tokyo 113-8510, Japan
Hydrology 2022, 9(1), 16; https://doi.org/10.3390/hydrology9010016
Submission received: 6 December 2021 / Revised: 6 January 2022 / Accepted: 11 January 2022 / Published: 17 January 2022
(This article belongs to the Section Hydrology–Climate Interactions)

Abstract

:
Hypoxia in Lake Biwa, Japan remains a serious water environmental problem. One of the causes of hypoxia in the lake is the formation of a thermocline, which is largely affected by meteorological factors, such as (1) air temperature, (2) wind speed, and (3) precipitation. However, the effects of these three meteorological factors on the formation of the thermocline have not been clarified quantitatively. In this study, applying a three-dimensional hydrodynamic model to Lake Biwa, the effects of each of the three meteorological elements on the formation of the thermocline was quantitatively analyzed to clarify the governing factors of meteorological conditions in the formation of anoxic oxygen. Sensitivity analysis of the stratification structure in Lake Biwa was performed by changing the three meteorological factors of (1) air temperature, (2) wind speed, and (3) precipitation. As a result, the change in wind speed gives the greatest effect on the stratification structure, the change in air temperature makes the difference in the stratification structure from the surface layer to the vicinity of the thermocline, and the change in precipitation affects it less than the others.

1. Introduction

The effects of climate change and anthropogenic impacts on ecosystems are urgent problems. Large lakes are particularly subject to climatic change and anthropogenic sources affecting water pollution. Eutrophication in water bodies, one of the most important anthropogenic effects on lake systems, which leads to water degradation, has been studied for over a century and remains an important concern [1,2]. Water degradation is visible all over the world, threatening the functioning of these ecosystems an on a global scale. Global warming has also altered the phenology of lake processes, and the earlier onset of stratification occurs; as a result, phytoplankton blooms earlier [3].
As a problem of oxygen depletion of deep lakes, for example, in Lake Biwa in Japan, the overturning did not occur every year in recent years, and the dissolved oxygen in the bottom layer continued to decrease. Lake Biwa is the largest freshwater lake in Japan, which is located in Shiga Prefecture, northeast of Kyoto Prefecture. It covers an area of approximately 670 km2, and the length of the perimeter is approximately 235 km. Its average depth is approximately 41 m in the northern part of the lake, and the deepest point is approximately 104 m. The total volume of water is 27.5 billion m3. The lake supports a diverse range of life and industry. A total of 118 inlet rivers drain into Lake Biwa from the surrounding mountains, and the main outlet is the Seta River, flowing through the Yodo River, which leads to the Seto Inland Sea at Osaka Bay. The water retention time is around 5.5 years, with 15 years required for a complete replacement of the lake. The climate in Lake Biwa is considered to be a humid subtropical climate (Cfa), according to the Köppen-Geiger climate classification. The air temperature varies roughly from −3 °C in winter to 33 °C in summer in Hikone. The windier part of the year lasts from winter to spring, with an average wind speed of more than 4.1 m/s. The calmer time of year lasts from summer to autumn with an average wind speed of 3.3 m/s. There is significant rainfall throughout the year in Hikone. The wetter season lasts from summer to autumn. The rainfall in Hikone is around 1800 mm/year.
In the case of Lake Biwa, it is necessary to pay attention to future climate trends. Eutrophication was the main cause of the declining trend of dissolved oxygen concentration at the bottom, until the 1970s. After the 1980s, when the load of organic matter and nutrients from land was regulated, the bottom water, whose dissolved oxygen concentration is below 2 mg/L, was observed at Imazu-oki. Kumagai [4] and Kitazawa [5] reported that change in structure of stratification, due to climate change, has a great influence on hypoxia in the bottom layer.
The rise in air temperature in recent years strengthens stratification and impedes oxygen supply to the bottom layer. In summer, when it is hotter than usual, the surface temperature of the surface water layer, which is directly affected by the atmosphere, rises to more than 20 °C of that of the bottom water, and the period of the stratification might be longer [6]. In Lake Zurich, Switzerland, rising temperatures in spring hastened the start of stratification, increased the temperature difference between the surface and deep waters in summer, and delayed the start of overturning in autumn. Therefore, the period of stratification was postponed by 2–3 weeks [7,8]. In various lakes, holomictic lakes, where the overturning occurs more than once a year, turn to meromictic lakes, where overturning does not reach all of the layers, due to global warming. For instance, Lake Constance, in Germany, is a lake where the overturning occurs once a year, but it has been reported that the overturning does not occur due to long-term rise in air temperature [9]. Tsujimura [6] showed that the strength of stratification in Lake Biwa also increased for 30 years. Furthermore, it has been pointed out that the deep layers become oxygen-deficient, due to the delay in overturning, as the air temperature rises in winter [10,11,12].
When wind blows, diverse phenomena, such as wind-driven currents and collapse of stratification, owing to vertical mixing, occur. In addition, the various winds generate internal waves, and when the internal wave breaks by strong wind, the vertical mixing becomes active. These phenomena were measured by continuously measuring the vertical distribution of water temperature with using a mooring system [10,13,14]. As the strong wind blows, the thermocline inclines; after the wind stops, the thermocline returns to the original position sharply, creating waves that affect the deep layer. Hayami [15] and Jiao and Kumagai [16] showed that the passage of such waves (internal surge) causes vertical mixing in Lake Biwa in summer.
Fushimi [17] pointed out the possibility that the snowfall decreased mainly in the northern basin of Lake Biwa, owing to global warming; so, the amount of the snowmelt water, which is colder than the lake water and contains abundant oxygen, flowing along the bottom of the lake into Imazu-oki during the snowmelt season, has been decreasing. On the other hand, according to Furukawa [18], there was no phenomenon that snowmelt water flew into the Imazu-oki along the lake bottom. They reported that there was no correlation between the lowest value of dissolved oxygen and volume of the snowmelt water flood.
The main factor preventing the delivery of dissolved oxygen concentration to the bottom of the lake is the thermocline. The stronger the strength of the stratification, the less dissolved oxygen reaches the bottom layer. Therefore, it is important to analyze how the stratification structure in Lake Biwa seasonally and inter-annually changed. However, the change in stratification structure, due to meteorological changes over the entire body of water and depth of Lake Biwa, has not been fully elucidated. Therefore, in the previous study, we developed a hydrodynamic model in Lake Biwa and evaluated the vertical profile of water temperature, as well as the reproducibility of the flow field [19]. In this study, using the flow field model, we performed a five-year calculation of the flow field, from 2007 to 2011, and evaluated how the meteorological factors of air temperature, wind speed, and precipitation affected the stratification structure in Lake Biwa, both seasonally and inter-annually.

2. Three-Dimensional Hydrodynamic Model of Lake Biwa

2.1. Calculation Area

The target area of this study is Lake Biwa in Japan. Figure 1a shows the surrounding river area and Lake Biwa in Kansai area. Figure 1b demonstrates the calculation area and water depths in the three-dimensional hydrodynamic model in Lake Biwa. The horizontal calculation area is 36 km × 65.5 km, and its resolution is 500 m. The vertical calculation area consists of 86 layers, from the surface of the lake to the water depth of 107.5 m. The vertical grid size is 0.5 m, from the surface of the lake to the water depth of 20 m, and it gradually increases up to 2.5 m.

2.2. The Governing Equation

In this study, a 3D hydrodynamic model, developed by Koue et al. [19], was used to figure out thermocline in detail. This model was validated for reproducibility of the structure of the thermal stratification and flow field in Lake Biwa, compared with the observed data.
The origin of the axes is at the southwestern end of the computational domain on the horizontal plane. The equations of momentum (x, y direction) are written as:
u t + u u x + v u y + w u z fv = 1 p ρ 0 x + v h 2 u x 2 + v h 2 u y 2 + v z 2 u z 2 g ρ z 0 ρ x dz
v t + u v x + v v y + w v z + fu = 1 p ρ 0 y + v h 2 v x 2 + v h 2 v y 2 + v z 2 v z 2 g ρ z 0 ρ y dz
and the continuity equation is described by:
u x + v y + w z = 0
These equations are solved according to the hydrostatic pressure approximation:
0 = 1 p ρ 0 z ρ ρ 0 g
The convective–diffusive equation for lake water temperature is as follows:
T t + u T x + v T y + w   T z = Kh 2 T x 2 + Kh 2 T y 2 + Kz 2 T z 2
In which u, v and w are the x, y and z components of the flow velocity (m/s), g is the acceleration (due to gravity) (9.8 m/s2), ρ is the water density (kg/m3), ρ0 is the water reference density (103 kg/m3), p is the pressure (N/m2), T is the water temperature (K), f is the Coriolis parameter (8.34 × 10⁻⁵ 1/s corresponds to 35° N), νh is the horizontal vortex viscosity of the equations of momentum (1.0 m2/s), νz is the vertical vortex viscosity (m2/s) of the equations of momentum, κh is the horizontal vortex diffusivity (1.0 m2/s), and κz is the vertical vortex diffusivity (m2/s). The viscosity and diffusivity of the horizontal vortex (1.0 m2/s) were selected as the constant numbers. Considering the degree of the circulation in Lake Biwa, the vortex viscosity and diffusivity are estimated, approximately, at this value.
When the air temperature rises, the thermocline is produced at water depths of 10 to 30 m. The thermocline reduces the vertical transportation of momentum and thermal energy. With this in mind, the vertical vortex viscosity and diffusivity parameter are calculated by utilizing the Richardson number. The Richardson number is a dimensionless number that indicates the proportion of the term of buoyancy to the term of flow gradient and is calculated as follows:
Ri = g ρ 0 ρ z ( U z ) 2
where U = u 2 + v 2 is the horizontal flow velocity (m/s). The vertical vortex viscosity and diffusivity are estimated by using:
ν z = 0.0001 ( 1.0 + 5.2 R i )
and
κ z = 0.0001 ( 1.0 + 10 3 × R i ) 3 2 ,
respectively.

2.3. Initial Conditions

The horizontal and vertical velocity were both adjusted to 0 m/s, and the temperature of water was calculated using linear interpolation of measured vertical distribution data. The Lake Biwa Environmental Research Institute took measurements twice a month at the Imazu-oki observation station (35°23′41″ N, 136°07′57″ E) (Figure 2), at water depths of 0.5 m, 5 m, 10 m, 15 m, 20 m, 30 m, 40 m, 60 m, 80 m, and around 90 m.

2.4. Boundary Conditions

In the baseline case, the boundary conditions were set to the same conditions described by Koue et al. [19]. The meso-scale model grid point value (MSM-GPV) data, produced by Japan Meteorological Agency, provided the air temperature, atmospheric pressure, wind direction, wind speed, and relative humidity overall for Lake Biwa. For ground level data, the MSM GPV data has spatial resolutions of 0.0625° (longitude) 0.05° (latitude) and a temporal resolution of 1 h. The data was horizontally interpolated into the three-dimensional hydrodynamic model’s surface meshes. Hourly observations at the Hikone Local Meteorological Observatory (35°16′30″ N, 136°14′36″ E) were used to calculate solar radiation. Over the lake, the data was estimated to be horizontally uniform. The boundary conditions were set as the water temperature and flow volume, simulated by the Yodo river basin model, for 56 rivers flowing into Lake Biwa.

2.5. Computer Simulation Exemplifications

2.5.1. Baseline Simulation

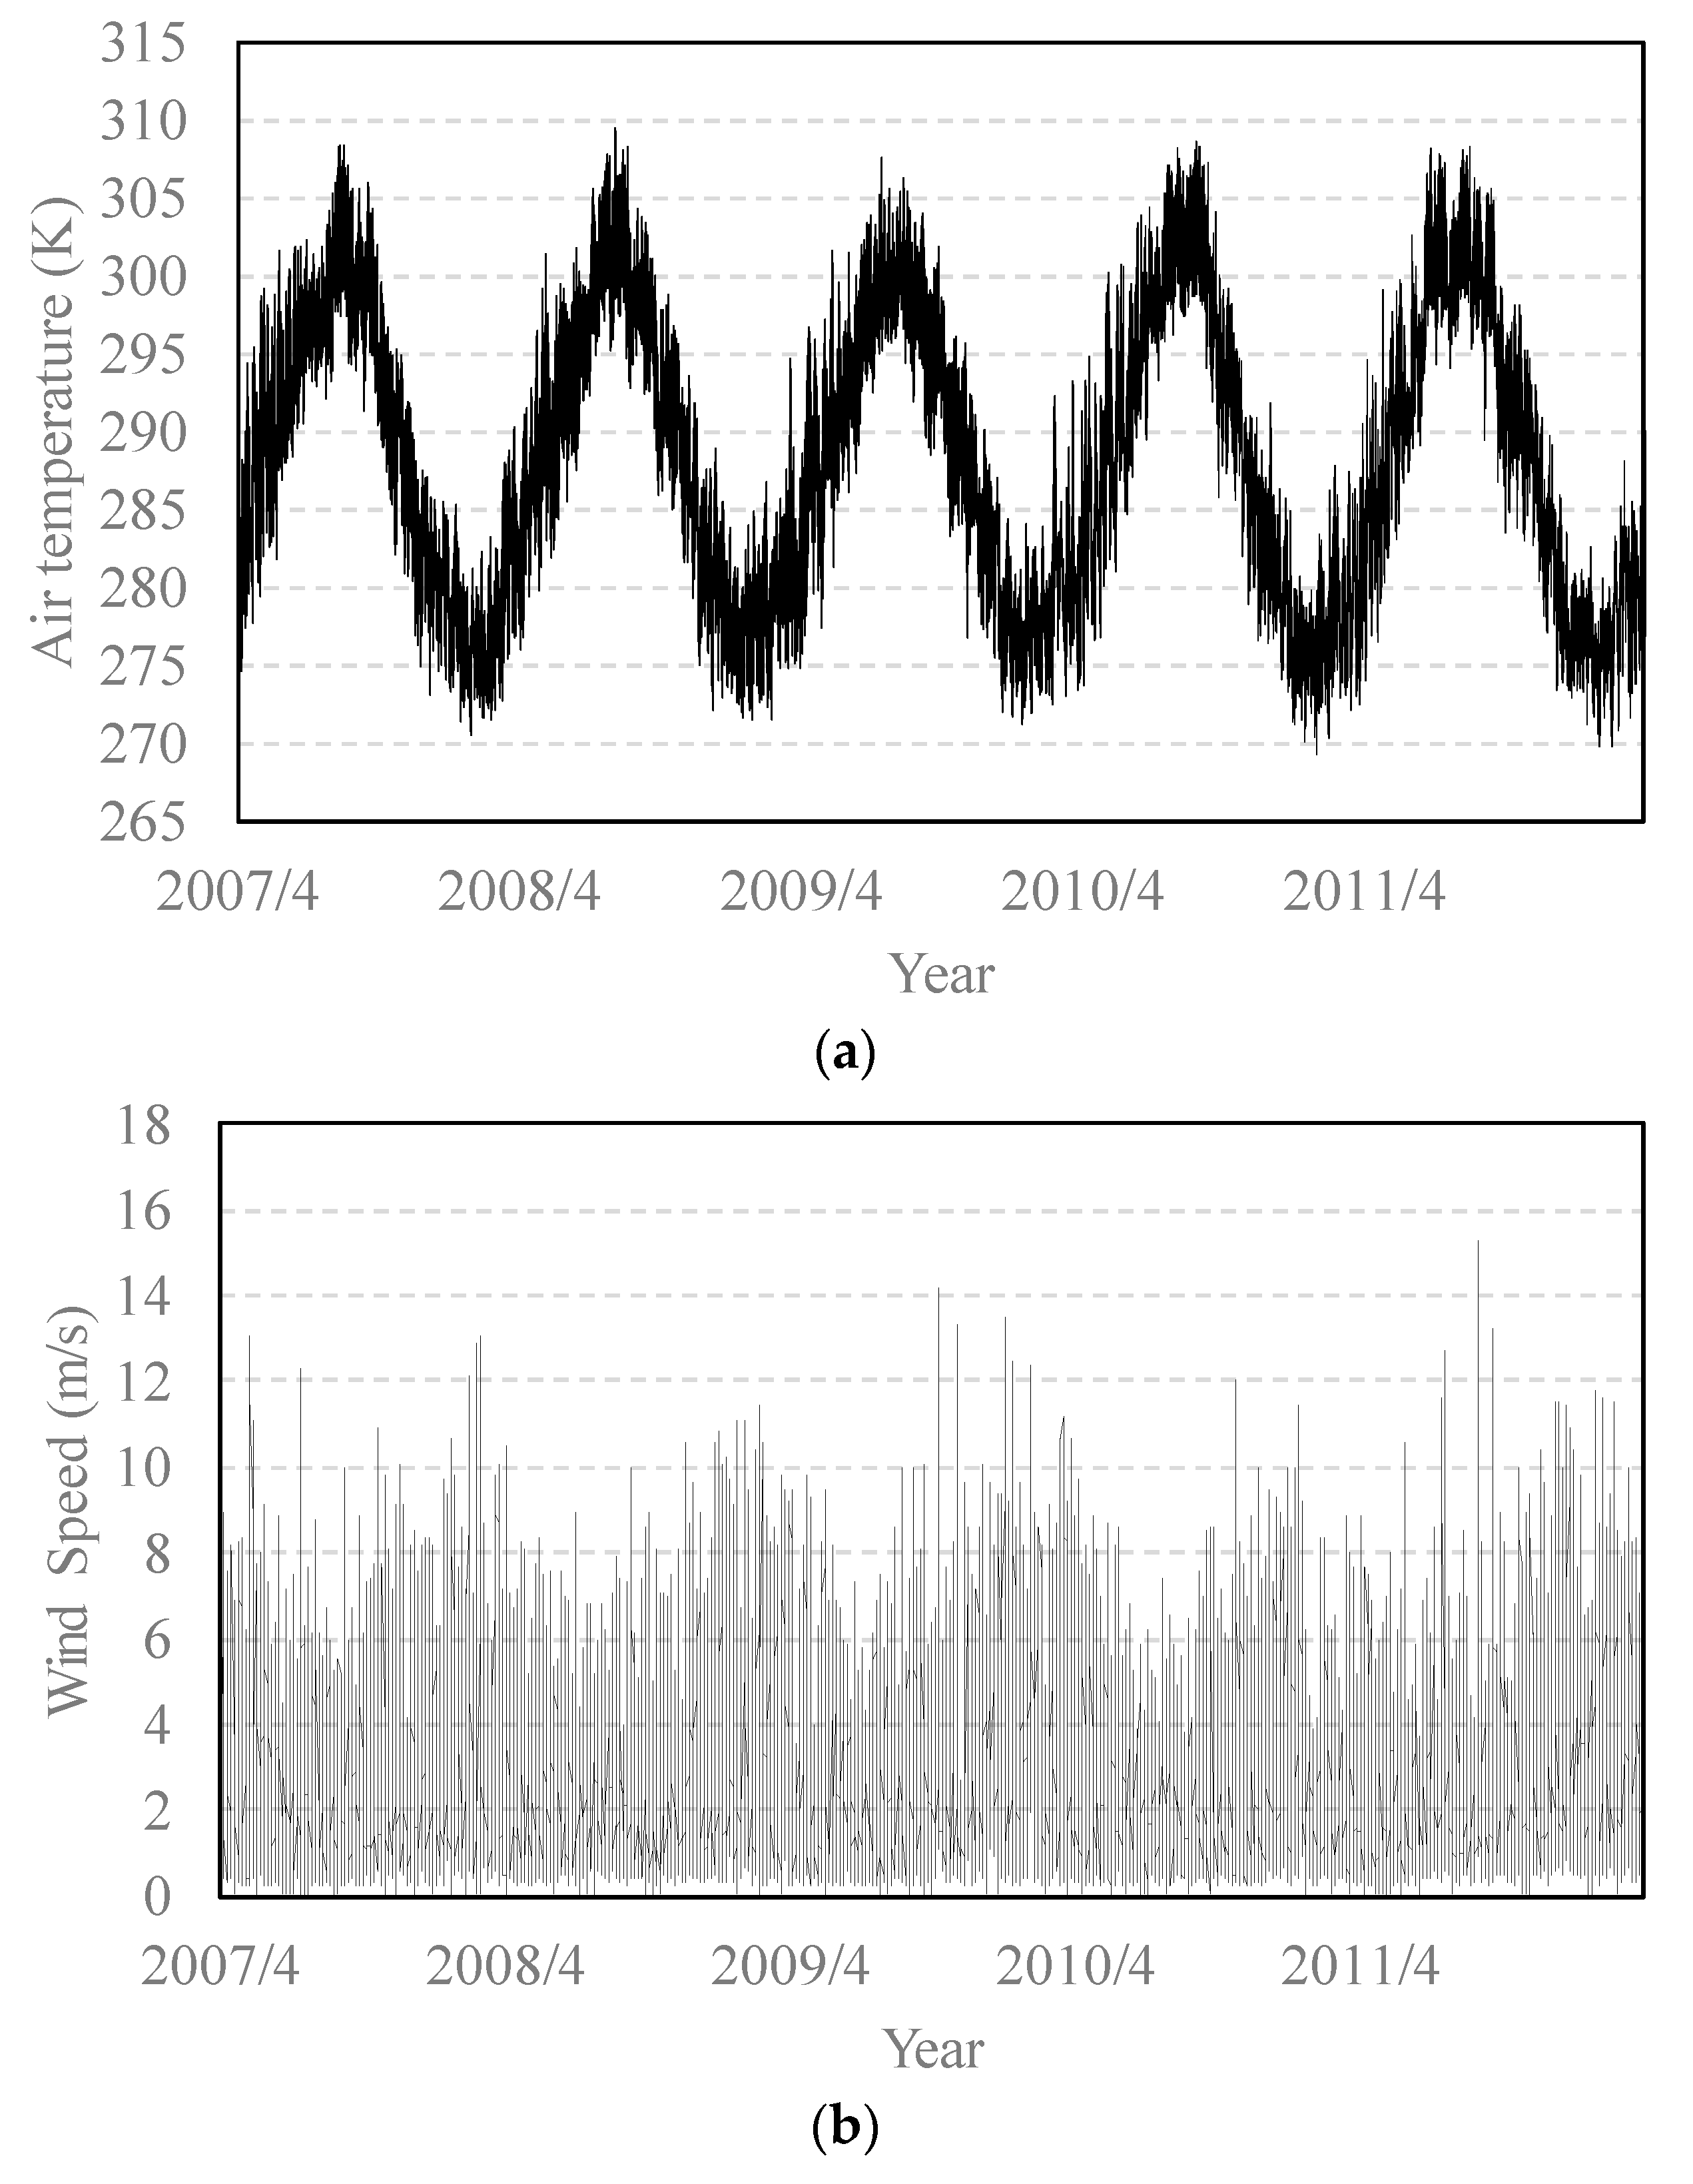
The baseline simulation (BASE) was performed using weather data, derived from MSM GPV from 1 April 2007 to 31 March 2012 (Japanese fiscal year (JFY) 2007 to 2011), with a warm-up period from 1 April 2006 to 31 March 2007. Table 1 shows the annual average values of the measured air temperature, wind speed, and precipitation at Hikone. Figure 2 depicts the data of the observed air temperature, wind speed, and precipitation at Hikone (observation point) every 1 h. As described in Figure 3b, the wind speed was higher during autumn and winter than in other seasons. Spring, summer, autumn, and winter were set as the months of April to June, July to September, October to December, and January to March, respectively. Table 2 indicates the seasonal mean values of these variables.

2.5.2. Cases of the Variation of Air Temperature, Wind Speed, and Precipitation

Using climate data with varying air temperature, wind speed, and precipitation, virtual scenarios were conducted over the same period to examine their impact on stratification structure. The variation coefficient (σ/µ) was calculated in the sensitivity analysis from the average value (µ) and standard deviation (σ) of the annual average air temperature, wind speed, and precipitation for 30 years at Hikone Local Meteorological Observatory, from 1981 to 2010, in order to consider the climate change for the recent 30 years. The variation coefficient (σ/µ) for air temperature was 0.21 percent, 4 percent for wind speed, and 12 percent for precipitation. Each modified weather data set was generated by multiplying 1 + 2σ/µ, 1 − 2σ/µ by air temperature, wind speed, and precipitation in MSM-GPV data. The cases of AT + 2σ (AT − 2σ), WS + 2σ (WS − 2σ), and Pre + 2σ (Pre − 2σ) show an increase (decrease) in air temperature, wind speed, and precipitation, respectively.

2.6. Sensitivity Analysis on Air Temperature, Wind Speed, and Precipitation

An object floating neutrally (density is equal to the surrounding fluid) is placed in a continuous stratified fluid. When this object is raised upward, it becomes heavier than the density of the surrounding fluid; if it is pushed down, it becomes lighter than the density of the surrounding fluid, so the resilience that tries to return to the original position works. Since the strength of this resilience is proportional to the displacement in the vertical direction, this object makes a simple vibration if the fluid is not disturbed with the motion of the object and the viscosity is ignored. This frequency is called Brunt–Väisara frequency. Since it is proportional to the square root of the vertical change in density, it is used as a parameter to represent the stratification strength.
The square of the buoyancy frequency is described as follows.
N 2 = g ρ · ρ z
ρ = 1000.07 − 0.0469(T − 273.15)2 − 0.0035(T − 273.15)
It is statically stable when N2 > 0, and statically unstable when N2 < 0.

3. Results and Discussion

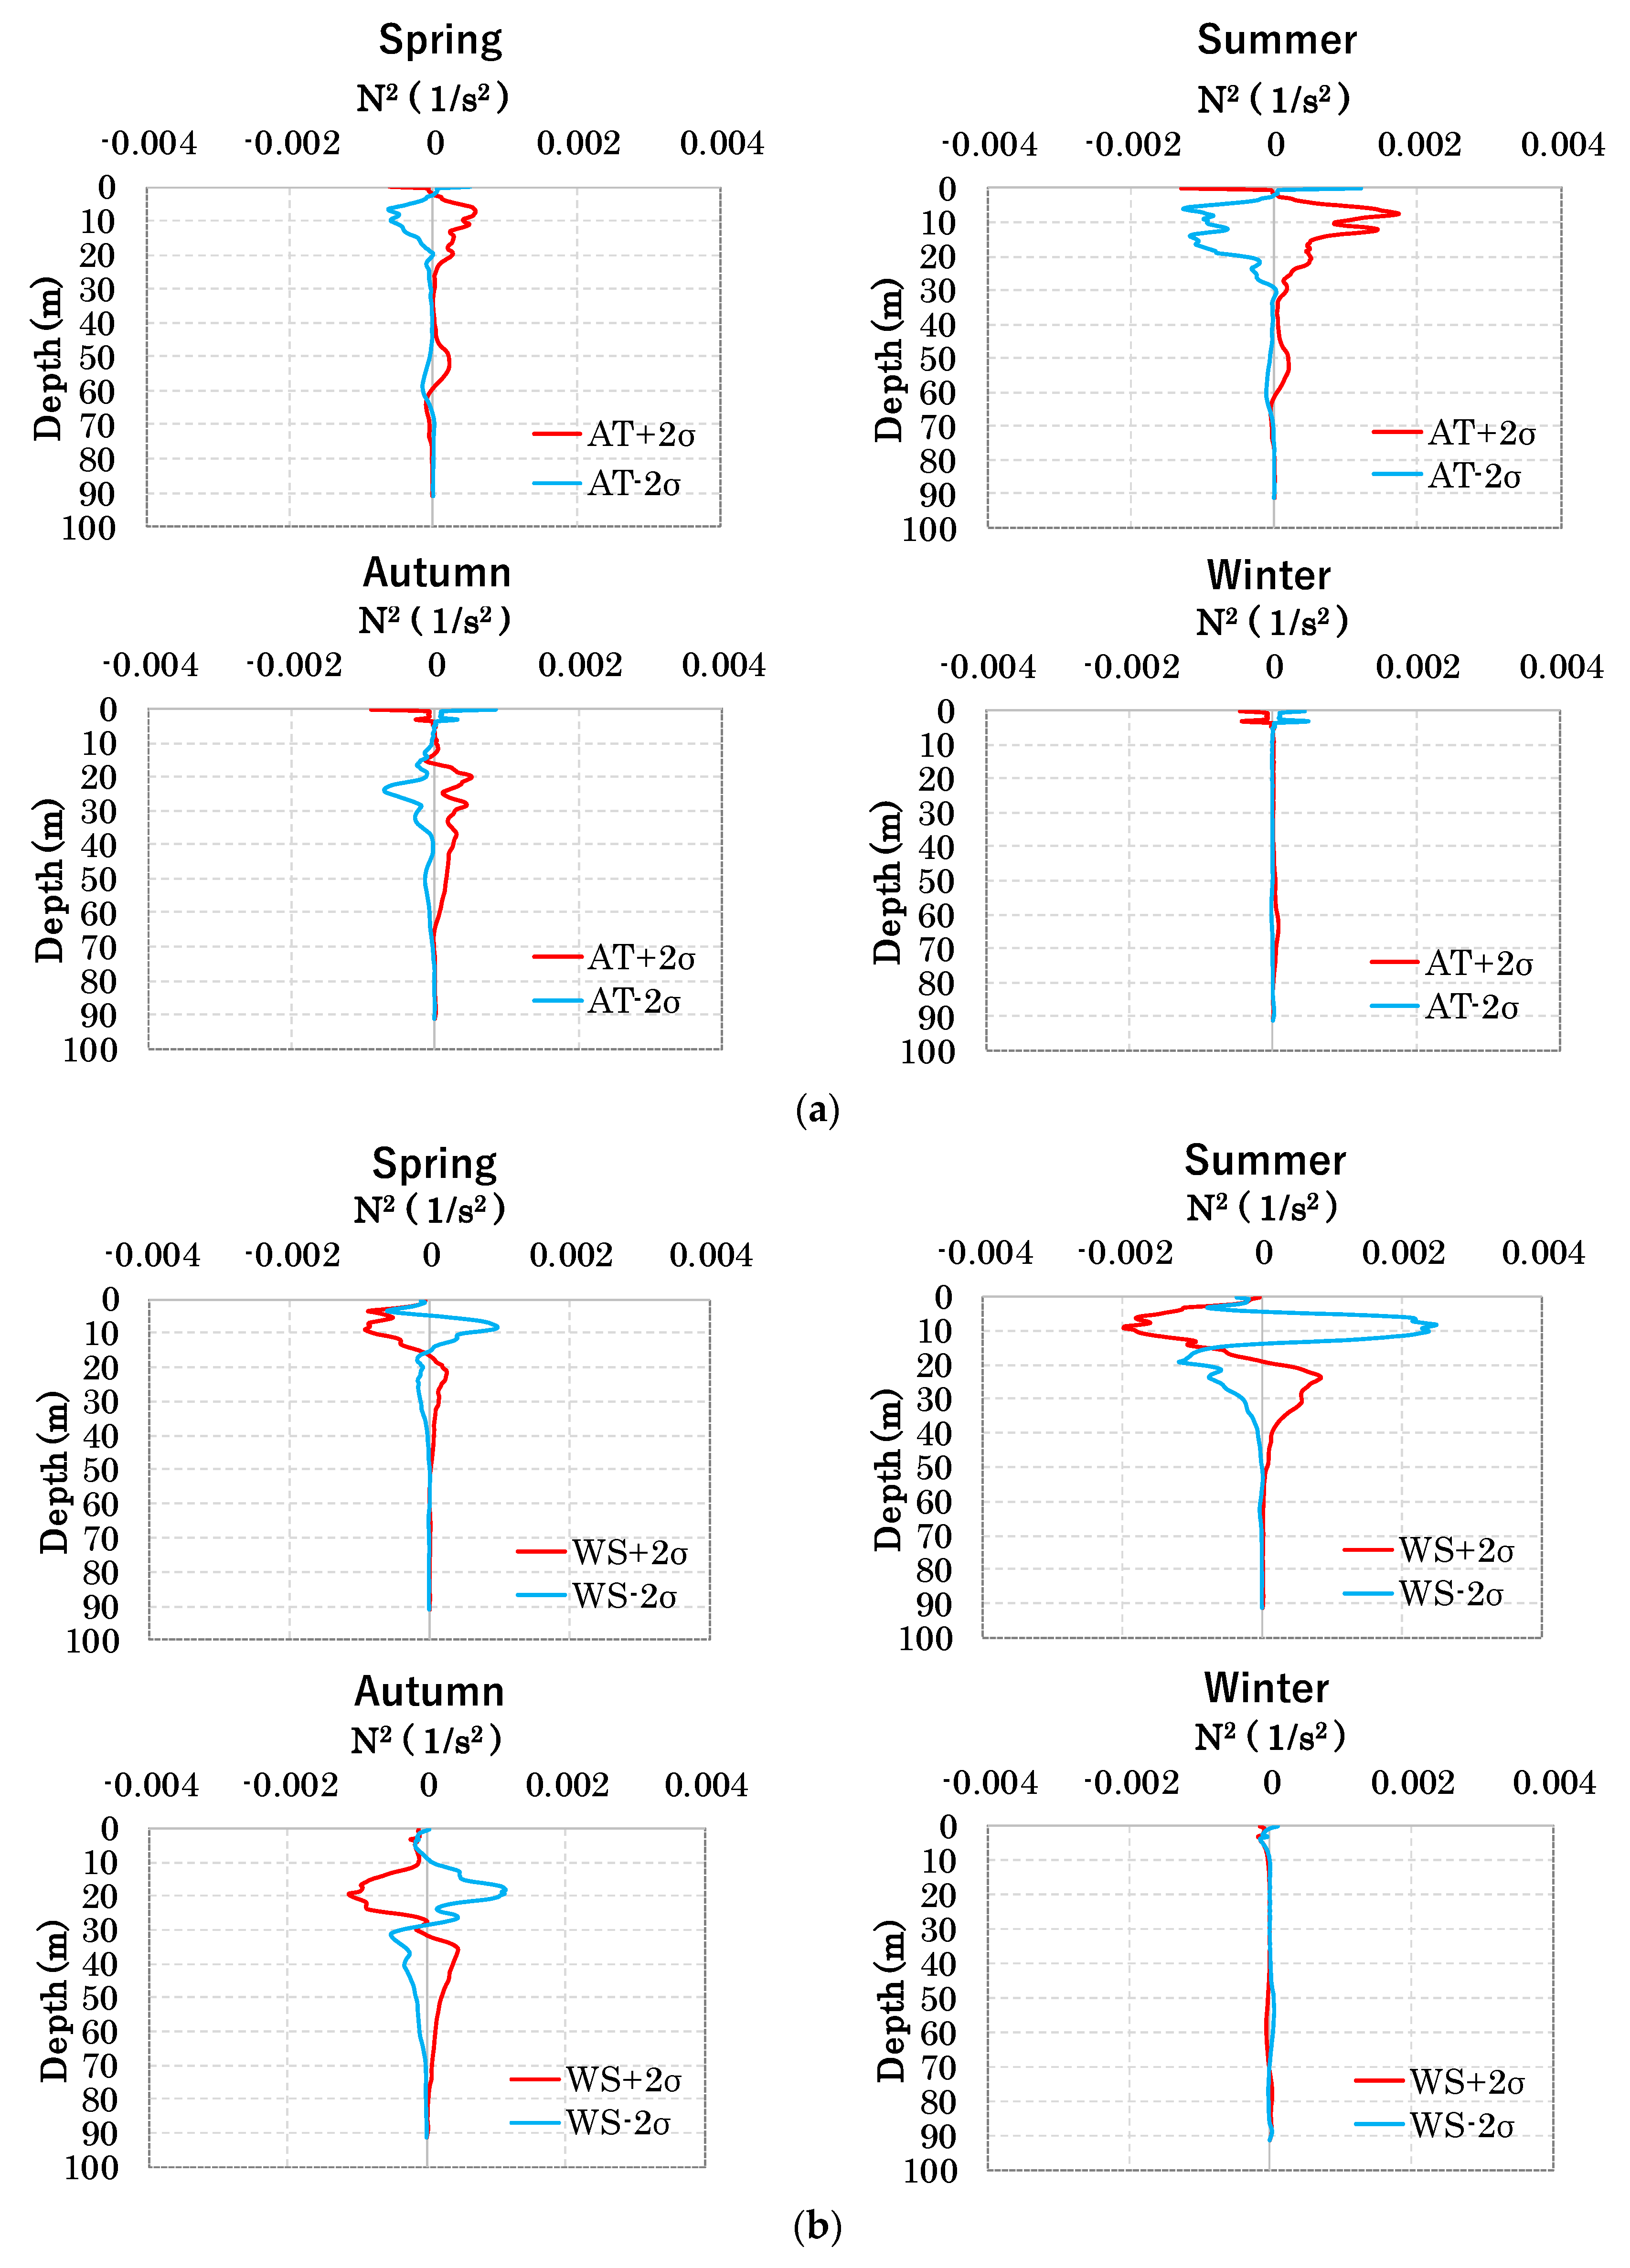
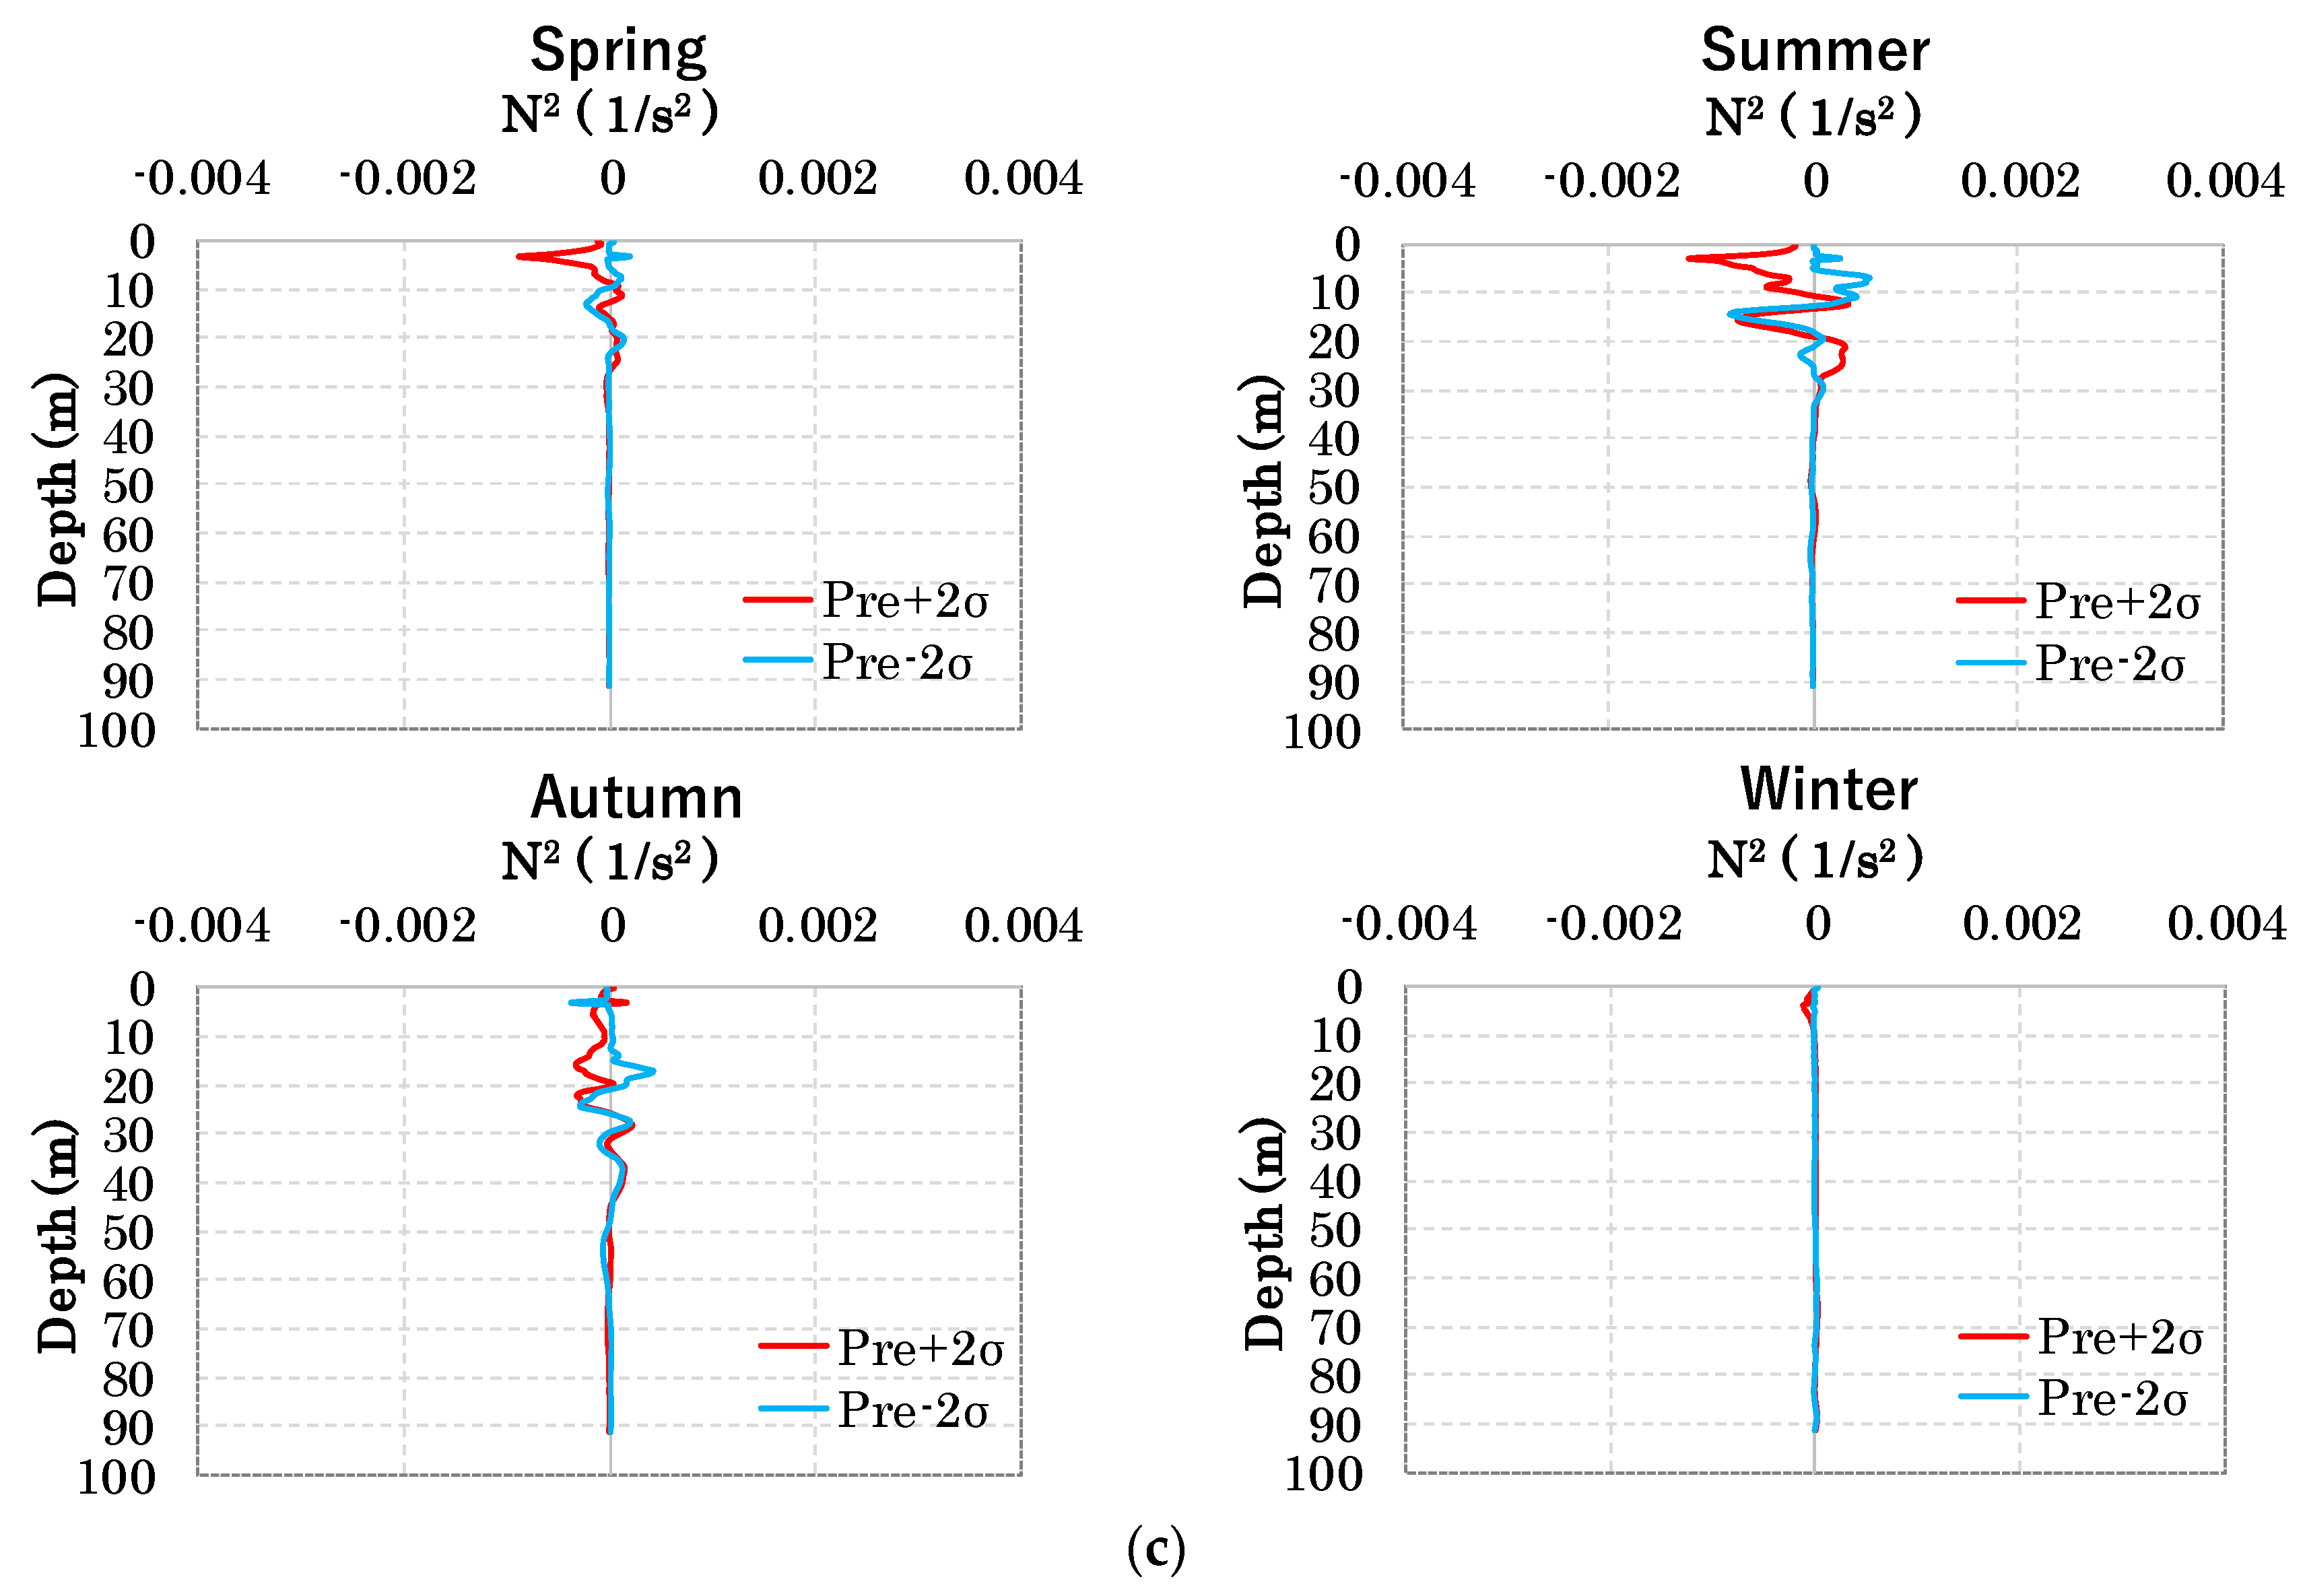
The vertical distribution of the five-year mean differences for the seasonal average squares of the buoyancy frequency between each case and the baseline case is depicted in Figure 3.
In case of AT + 2σ (−2σ), the stratification was enhanced (reduced), primarily at a water depth of 10 m, during spring and summer, compared with BASE. During autumn and winter, the position where stratification was enhanced (reduced) fluctuated between a water depth of 20 to 30 m and 60 to 70 m (Figure 3a). During spring and summer, the heat transfer of the heating flux increased because of the rise in air temperature and heat stored from the lake’s surface layer to right above the thermocline, enhancing the stratification. During autumn and winter, as the air temperature dropped, the surface layers cooled, and the flux of the cooling was transferred to the deep layer.
With regard to the effect of wind speed, the stratification was reduced (enhanced) in case of WS + 2σ (−2σ), mostly at a water depth of 10 m during spring and summer, compared with BASE. During autumn, the stratification was reduced at a water depth of 10 to 30 m, and the stratification was enhanced at a water depth of 30 to 50 m, in case of WS + 2σ. The stratification was enhanced at a water depth of 10 to 30 m, and it was not enhanced under thermocline, in case of WS − 2σ. During winter, the stratification was enhanced (reduced) at a water depth of more than 50 m, in case of WS + 2σ (−2σ) (Figure 3b). The influence of variation of wind speed was higher than that of air temperature during the period when stratification was reduced in spring and autumn. Even in the summer, in which stratification was enhanced, the effect of variation of wind speed had a larger impact on deep water than that of air temperature.
As for the variation in precipitation, in case of Pre + 2σ (−2σ), the stratification was reduced (enhanced), principally at a water depth of approximately 5 m during spring and summer, compared with BASE, due to the cooling (heating) of the lake surface, as well as the amount of river flow. During autumn, the position where the stratification was reduced (enhanced) fluctuated from a water depth of 5 m to a water depth of around 20 m (Figure 3c).
Table 3 indicates the difference between the five-year average value of the period of thermocline existence, from 2007 to 2011, in BASE and each meteorological condition. The starting date of existence of thermocline was set as the date of the beginning of the formation of the thermocline. The ending date of the existence of thermocline was set as the date of the disappearing of the thermocline. As described in Table 3, the period of thermocline changed, depending on each meteorological condition. The ending date of the existence of the thermocline tended to be postponed, owing to the increase in air temperature. In terms of the increase (decrease) in wind speed, the starting date of forming the thermocline postponed (advanced) than that in BASE, and the ending date advanced (postponed) than that in BASE. Under conditions of increase (decrease) of wind speed, the period of thermocline fluctuated more than that of variation in air temperature and precipitation, indicating that the wind speed had a more significant effect on the period of the existence of thermocline.
According to other studies [20,21,22], the duration of stratification and annual average lake stability are projected to increase in Lake Tahoe in the next 30 years; however, the comparison of each climate change, such as air temperature, wind speed, and precipitation, is not studied, and this study indicated the wind speed had a greater impact on the duration of the thermocline’s existence. Changes in the thermal regimes of large lakes will have a significant impact on the world’s freshwater ecosystems. It is important to, in the future, consider the extent to which each meteorological element changes with climate change and how this affects the water deterioration of the lake.

4. Conclusions

The strong stratification leads to low dissolved oxygen concentration peculiarly in the bottom layer of the lake, causing the aggravation of water quality. In this research, the impacts of meteorological elements, such as air temperature, wind speed, and precipitation, on the stratification structure in Lake Biwa, Japan were examined via simulation, using the three-dimensional hydrodynamic model. We investigated the change of stratification structure by adding the variation in air temperature, wind speed, and precipitation. As a result, the effect of the variation of wind speed was more significant than that of the variation in air temperature during the period in which stratification was reduced in spring and autumn. Even in the summer, in which stratification was enhanced, the effect of variations in wind speed had a more significant effect on deeper layer than variations in air temperature and precipitation. Under conditions of increase (decrease) in wind speed, the period of the existence thermocline increased (decreased) more than that of variation in air temperature and precipitation. Regarding variations in precipitation, the intensity of stratification in the surface layer changed slightly, but as the water depth increased, it hardly changed. In other words, in the case where the upper and lower limits of each meteorological element were disturbed, the change in wind speed had the greatest influence on the stratification structure, and the change in air temperature changed the stratification from the surface layer to the vicinity of thermocline. The change in precipitation, including river flow, altered the surface layer flow, and it varied the strength of stratification slightly. In this study, the influence of each meteorological element on the stratification structure was clarified. However, the direct effects of climate change on the lake ecosystem require the combined use of an atmospheric model that can handle the changes in each meteorological element associated with climate change, as well as an ecosystem model that responds to physical behavior. It is important to predict how each meteorological element associated with climate change will affect the stratified structure of the lake, in order to protect the ecosystem and ensure drinking water for people.

Funding

This research received no external funding.

Institutional Review Board Statement

Not applicable.

Informed Consent Statement

Not applicable.

Data Availability Statement

The meteorological data in Shiga Prefecture were provided by Japan Meteorological Agency, and water-temperature data were given by Lake Biwa Environmental Research Institute via Internet. The author is grateful for these support.

Conflicts of Interest

The author declares no conflict of interest.

References

  1. Smith, V.H.; Schindler, D.W. Eutrophication science: Where do we go from here? Trends Ecol. Evol. 2009, 24, 201–207. [Google Scholar] [CrossRef] [PubMed]
  2. Chislock, M.F.; Doster, E.; Zitomer, R.A.; Wilson, A.E. Eutrophication: Causes, Consequences, and Controls in Aquatic Eco-systems. Nat. Educ. Knowl. 2013, 4, 10. [Google Scholar]
  3. Winder, M.; Schindler, D.E. Climatic effects on the phenology of lake processes. Global Change Biol. 2004, 10, 1844–1856. [Google Scholar] [CrossRef] [Green Version]
  4. Kumagai, M.; Ishikawa, K.; Jiao, C.; Aota, Y. Climate change and hypoxic phenomena in the norther part of Lake Biwa. Res. Rep. Lake Biwa Environ. Res. Inst. 2005, 22, 171–177. [Google Scholar]
  5. Kitazawa, D.; Ishikawa, T.; Kumagai, M. The analysis by the numerical simulation about the effects of the climate change for the past 50 years on an ecological system. Inst. Ind. Sci. 2010, 62, 45–49. [Google Scholar]
  6. Tsujimura, S.; Aoki, S.; Okumura, Y.; Yada, M.; Jiao, C.; Ishikawa, K.; Nakajima, T.; Ishikawa, T. Monitoring Analysis on Grasping the Actual State of Low Oxygenation in Lake Biwa and the Impact on the North Lake Ecosystem; Lake Biwa Environment Research Institute: Otsu, Japan, 2009; pp. 58–72. [Google Scholar]
  7. Livingstone, D.M. Impact of Secular Climate Change on the Thermal Structure of a Large Temperate Central Eu ropean Lake. Clim. Change 2003, 57, 205–225. [Google Scholar] [CrossRef]
  8. Arai, T. Climate change and variations in the water temperature and ice cover of inland waters. Jpn. J. Limnol. 2009, 70, 99–116. [Google Scholar] [CrossRef] [Green Version]
  9. Straile, D.; Jöhnk, K.; Henno, R. Complex effects of winter warming on the physicochemical characteristics of a deep lake. Limnol. Oceanogr. 2003, 48, 1432–1438. [Google Scholar] [CrossRef]
  10. Hayami, Y.; Fujiwara, T. Recent Warming of the Deep Water in Lake Biwa. Oceanogr. Jpn. 1999, 8, 197–202. [Google Scholar] [CrossRef] [Green Version]
  11. Endoh, S.; Yamashita, S.; Kawakami, M.; Okumura, Y. Recent Warming of Lake Biwa Water. Jpn. J. Limnol. 1999, 60, 223–228. [Google Scholar] [CrossRef]
  12. Yoshimizu, C.; Yoshiyama, K.; Tayasu, I.; Koitabashi, T.; Nagata, T. Vulnerability of a large monomictic lake (Lake Biwa) to warm winter event. Limnology 2010, 11, 233–239. [Google Scholar] [CrossRef]
  13. Kanari, S. Internal Waves in Lake Biwa (I)—The Responses of the Thermocline to the Wind Action—Bulletin of the Disaster Prevention Research Institute. Ph.D. Thesis, Kyoto University, Kyoto, Japan, 1970; pp. 19–26. [Google Scholar]
  14. Saggio, A.; Imberger, J. Internal wave weather in a stratified lake. Limnol. Oceanogr. 1998, 43, 1780–1795. [Google Scholar] [CrossRef]
  15. Hayami, Y.; Fujiwara, T.; Kumagai, M. Internal Surge in Lake Biwa Induced by Strong Winds of a Typhoon. Jpn. J. Limnol. 1996, 57, 425–444. [Google Scholar] [CrossRef]
  16. Jiao, C.; Kumagai, M. Large Amplitude Nonlinear Internal Surge in Lake Biwa. Jpn. J. Limnol. 1995, 56, 279–289. [Google Scholar] [CrossRef] [Green Version]
  17. Fushimi, H. Influence of climatic warming on the amount of snow cover and water quality of Lake Biwa, Japan. Ann. Glaciol. 1993, 18, 257–260. [Google Scholar] [CrossRef] [Green Version]
  18. Furukawa, H.; Kawamura, K.; Hara, T.; Kido, K.; Fukuju, S. Fundamental study on dissolved oxygen supply into deep layers in lake biwa. J. Jpn. Soc. Civ. Eng. 2007, 63, 144–153. [Google Scholar] [CrossRef] [Green Version]
  19. Koue, J.; Shimadera, H.; Matsuo, T.; Kondo, A. Evaluation of Thermal Stratification and Flow Field Reproduced by a Three-Dimensional Hydrodynamic Model in Lake Biwa, Japan. Water 2018, 10, 47. [Google Scholar] [CrossRef] [Green Version]
  20. Sahoo, G.B.; Forrest, A.L.; Schladow, S.G.; Reuter, J.E.; Coats, R.; Dettinger, M. Climate change impacts on lake thermal dynamics and ecosystem vulnerabilities. Limnol. Oceanogr. 2016, 61, 496–507. [Google Scholar] [CrossRef] [Green Version]
  21. Anderson, E.J.; Stow, C.A.; Gronewold, A.D.; Mason, L.A.; McCormick, M.J.; Qian, S.S.; Ruberg, S.A.; Beadle, K.; Constant, S.A.; Hawley, N. Seasonal overturn and stratification changes drive deep-water warming in one of Earth’s largest lakes. Nat. Commun. 2021, 12, 1688. [Google Scholar] [CrossRef]
  22. Woolway, R.I.; Sharma, S.; Weyhenmeyer, G.A.; Debolskiy, A.; Golub, M.; Mercado-Bettín, D.; Perroud, M.; Stepanenko, V.; Tan, Z.; Grant, L.; et al. Phenological shifts in lake stratification under climate change. Nat. Commun. 2021, 12, 2318. [Google Scholar] [CrossRef]
Figure 1. (a) The surrounding river and Lake Biwa, in the Kansai area; (b) calculation domain of the topography and water depth of Lake Biwa.
Hydrology 09 00016 g001
Figure 2. Time variation of (a) air temperature, (b) wind speed, and (c) precipitation of weather conditions, from JFY 2007 to 2011, at Hikone (observation point).
Hydrology 09 00016 g002aHydrology 09 00016 g002b
Figure 3. Seasonal five-year averages of vertical distribution of Brunt–Väisara frequency differences between BASE and each case (the change in) (a) air temperature, (b) wind speed, and (c) precipitation.
Hydrology 09 00016 g003aHydrology 09 00016 g003b
Table 1. Annual average measured data for air temperature (AT), wind speed (WS), and precipitation (Pre) at Hikone (observation point).
JFY20072008200920102011
AT (K)288.10288.35288.15288.25288.35
WS (m/s)2.752.642.742.552.82
Pre (mm/h)15601460145017701900
Table 2. Seasonal average measured data of air temperature (AT), wind speed (WS), and precipitation (Pre) at Hikone (observation point) for five years.
JFYSpringSummerAutumnWinter
AT (K)290.19299.13285.30278.07
WS (m/s)2.442.442.823.11
Pre (mm/h)468.4475.1328.2356.3
Table 3. Difference of the five-year average value of the period of thermocline, between each meteorological condition and BASE.
Starting DateEnding DateStarting DateEnding DateStarting DateEnding DateStarting DateEnding DateStarting DateEnding Date
JFY20072008200920102011
BASE4/812/154/1212/104/712/54/1912/64/612/17
Period of thermocline (days)251242242231255
244.2 (5-year average value)
AT + 2σ4/712/224/1212/104/712/44/1912/84/612/18
Difference from BASE (days) +80−1+2+1
+2 (5-year average value)
AT − 2σ4/1012/114/1412/104/712/44/1912/94/612/16
Difference from BASE (days)−6−2−1+3−1
−1.4 (5-year average value)
WS + 2σ4/912/124/1512/44/712/44/1912/84/612/18
Difference from BASE (days)−6−11−13−5−9
−8.8 (5-year average value)
WS − 2σ4/712/204/612/234/612/124/1812/144/512/24
Difference from BASE (days)+6+19+8+9+8
+10 (5-year average value)
Pre + 2σ4/812/154/1212/124/712/44/1912/84/612/18
Difference from BASE (days)0+2−1+2+1
+0.8 (5-year average value)
Pre − 2σ4/812/154/1312/104/712/44/1912/84/612/19
Difference from BASE (days)0−1−1+2+2
+0.4 (5-year average value)
Publisher’s Note: MDPI stays neutral with regard to jurisdictional claims in published maps and institutional affiliations.