Article

Characteristics of Flow over Rectangular Labyrinth Weirs with Round Corners

1
Department of Water Resources Engineering, College of Engineering, University of Sulaimani, Sulaymaniyah 46002, Iraq
2
Civil and Environmental Engineering and Construction, University of Nevada, 4505 Maryland Parkway, Las Vegas, NV 89154, USA
*
Authors to whom correspondence should be addressed.
Hydrology 2021, 8(4), 158; https://doi.org/10.3390/hydrology8040158
Submission received: 30 August 2021 / Revised: 9 October 2021 / Accepted: 13 October 2021 / Published: 18 October 2021

Abstract

:
The hydraulic performance of round-cornered rectangular labyrinth weirs with varying weir heights and effective lengths has not been explored in the existing literature to the authors’ knowledge. The purpose of this experimental study was to see how the height and effective length of round-cornered rectangular labyrinth weirs affect their discharge efficiency. Nine flat-crested rectangular labyrinth weirs made of high-density polyethylene (HDPE) were tested in a rectangular flume under various discharges to fulfill the goals of this study. The discharge coefficients for the weirs were then calculated. The hydraulic efficiency of weirs with round corners increases as the weir height (P) increases, according to the findings; however, with effective length of the weir to channel width ratios (LC/B) ≤ 1.78, the effect of the weir height diminishes. For the HT/P ranges used in this study, 0.1 ≤ HT/P ≤ 0.65, the round-cornered rectangular labyrinth weirs with higher LC/B ratios (greater M values) showed improved hydraulic efficiency. Furthermore, the effects of the round-cornered rectangular labyrinth weirs’ headwater inflation can be mitigated by increasing the effective length of the weirs;by increasing M values (LC/B ratios). Using multiple linear regression analysis, a satisfactory correlation equation was found between discharge coefficients of round-cornered rectangular labyrinth weirs, CB, and the other parameters, LC, P, and h.

1. Introduction

Constructing a labyrinth weir is a practical and cost-effective approach to improving a dam’s spillway discharge capacity without expanding the existing spillway channel width or water heads over the crest [1,2,3]. A labyrinth weir is a weir with a crest length that is greater than the width of a channel or spillway [4]. It is usually made by placing linear weirs in a zigzag pattern and folding them in plan view. Because labyrinth weirs are usually made up of repeated simple shapes (cycles) in plan-view, such as half-circular, circular, triangular, rectangular, and trapezoid (trapezoidal) shapes, both their design and construction are very cost-effective [5,6,7]. The discharge, head of water flowing over the weirs, and weir geometry are the elements that influence their performance [4,8]. The total crest length of the weir (effective crest length, LC) cycle width, sidewall angle, upstream wall height, downstream wall height, wall thickness (t), crest shape, and weir apex shape horizontally normal to the flow direction (apex configuration or weir tip shape) are the factors that control the weir geometry [1,3,6].
The rectangular labyrinth weir [5,9,10] is one of the labyrinth weir forms. A rectangular labyrinth weir is a labyrinth weir with two adjacent weir sides that form a right angle (90 degrees); the weir tips (apexes) are perpendicular to the sidewalls [4]. This form has many advantages, such as a structurally strong body and being economically cost-effective [11,12], although these weirs have their drawbacks as well. One of the main drawbacks, similar to triangular and trapezoidal labyrinth weirs, is nappe interference (nappe collision) problems. When the water sheets running over two neighboring walls meet, this is known as nappe interference. As a result, the discharge efficiency of the labyrinth weirs is reduced [2]. The nappe interference can form in the upstream corners of rectangular weirs due to the collision of flow sheets from the upstream apex and sidewalls. As a result, the discharge efficiency of the rectangular labyrinth weirs may be reduced. It is thought that upgrading the corner designs of rectangular labyrinth weirs will reduce or eliminate nappe interference and boost hydraulic efficiency. Although many researchers have looked at the hydraulic performance of rectangular labyrinth weirs [4,5,9,10,12,13,14], the hydraulic performance of rectangular labyrinth weirs with different corner shapes has not been explored in the existing literature, except by Yousif and Karakouzian (2020) [15].
Yousif and Karakouzian (2020), in an attempt to improve the hydraulic performance of rectangular labyrinth weirs, so as to alleviate the adverse effects of nappe interference and headwater inflation, studied the effects of the corner shape on the flow properties over the labyrinth weirs. In their study, the effects of different corner shapes on the hydraulic performance of the rectangular labyrinth weirs were evaluated. It was found that by modifying the corner shape from a sharp (90 degree) to a round shape, the discharge capacity was increased by 15% on average; however, the effects of the height and effective length of the rectangular labyrinth weirs with round corners on the hydraulic efficiency were not addressed, which are the main aims of this study.

2. Materials and Methods

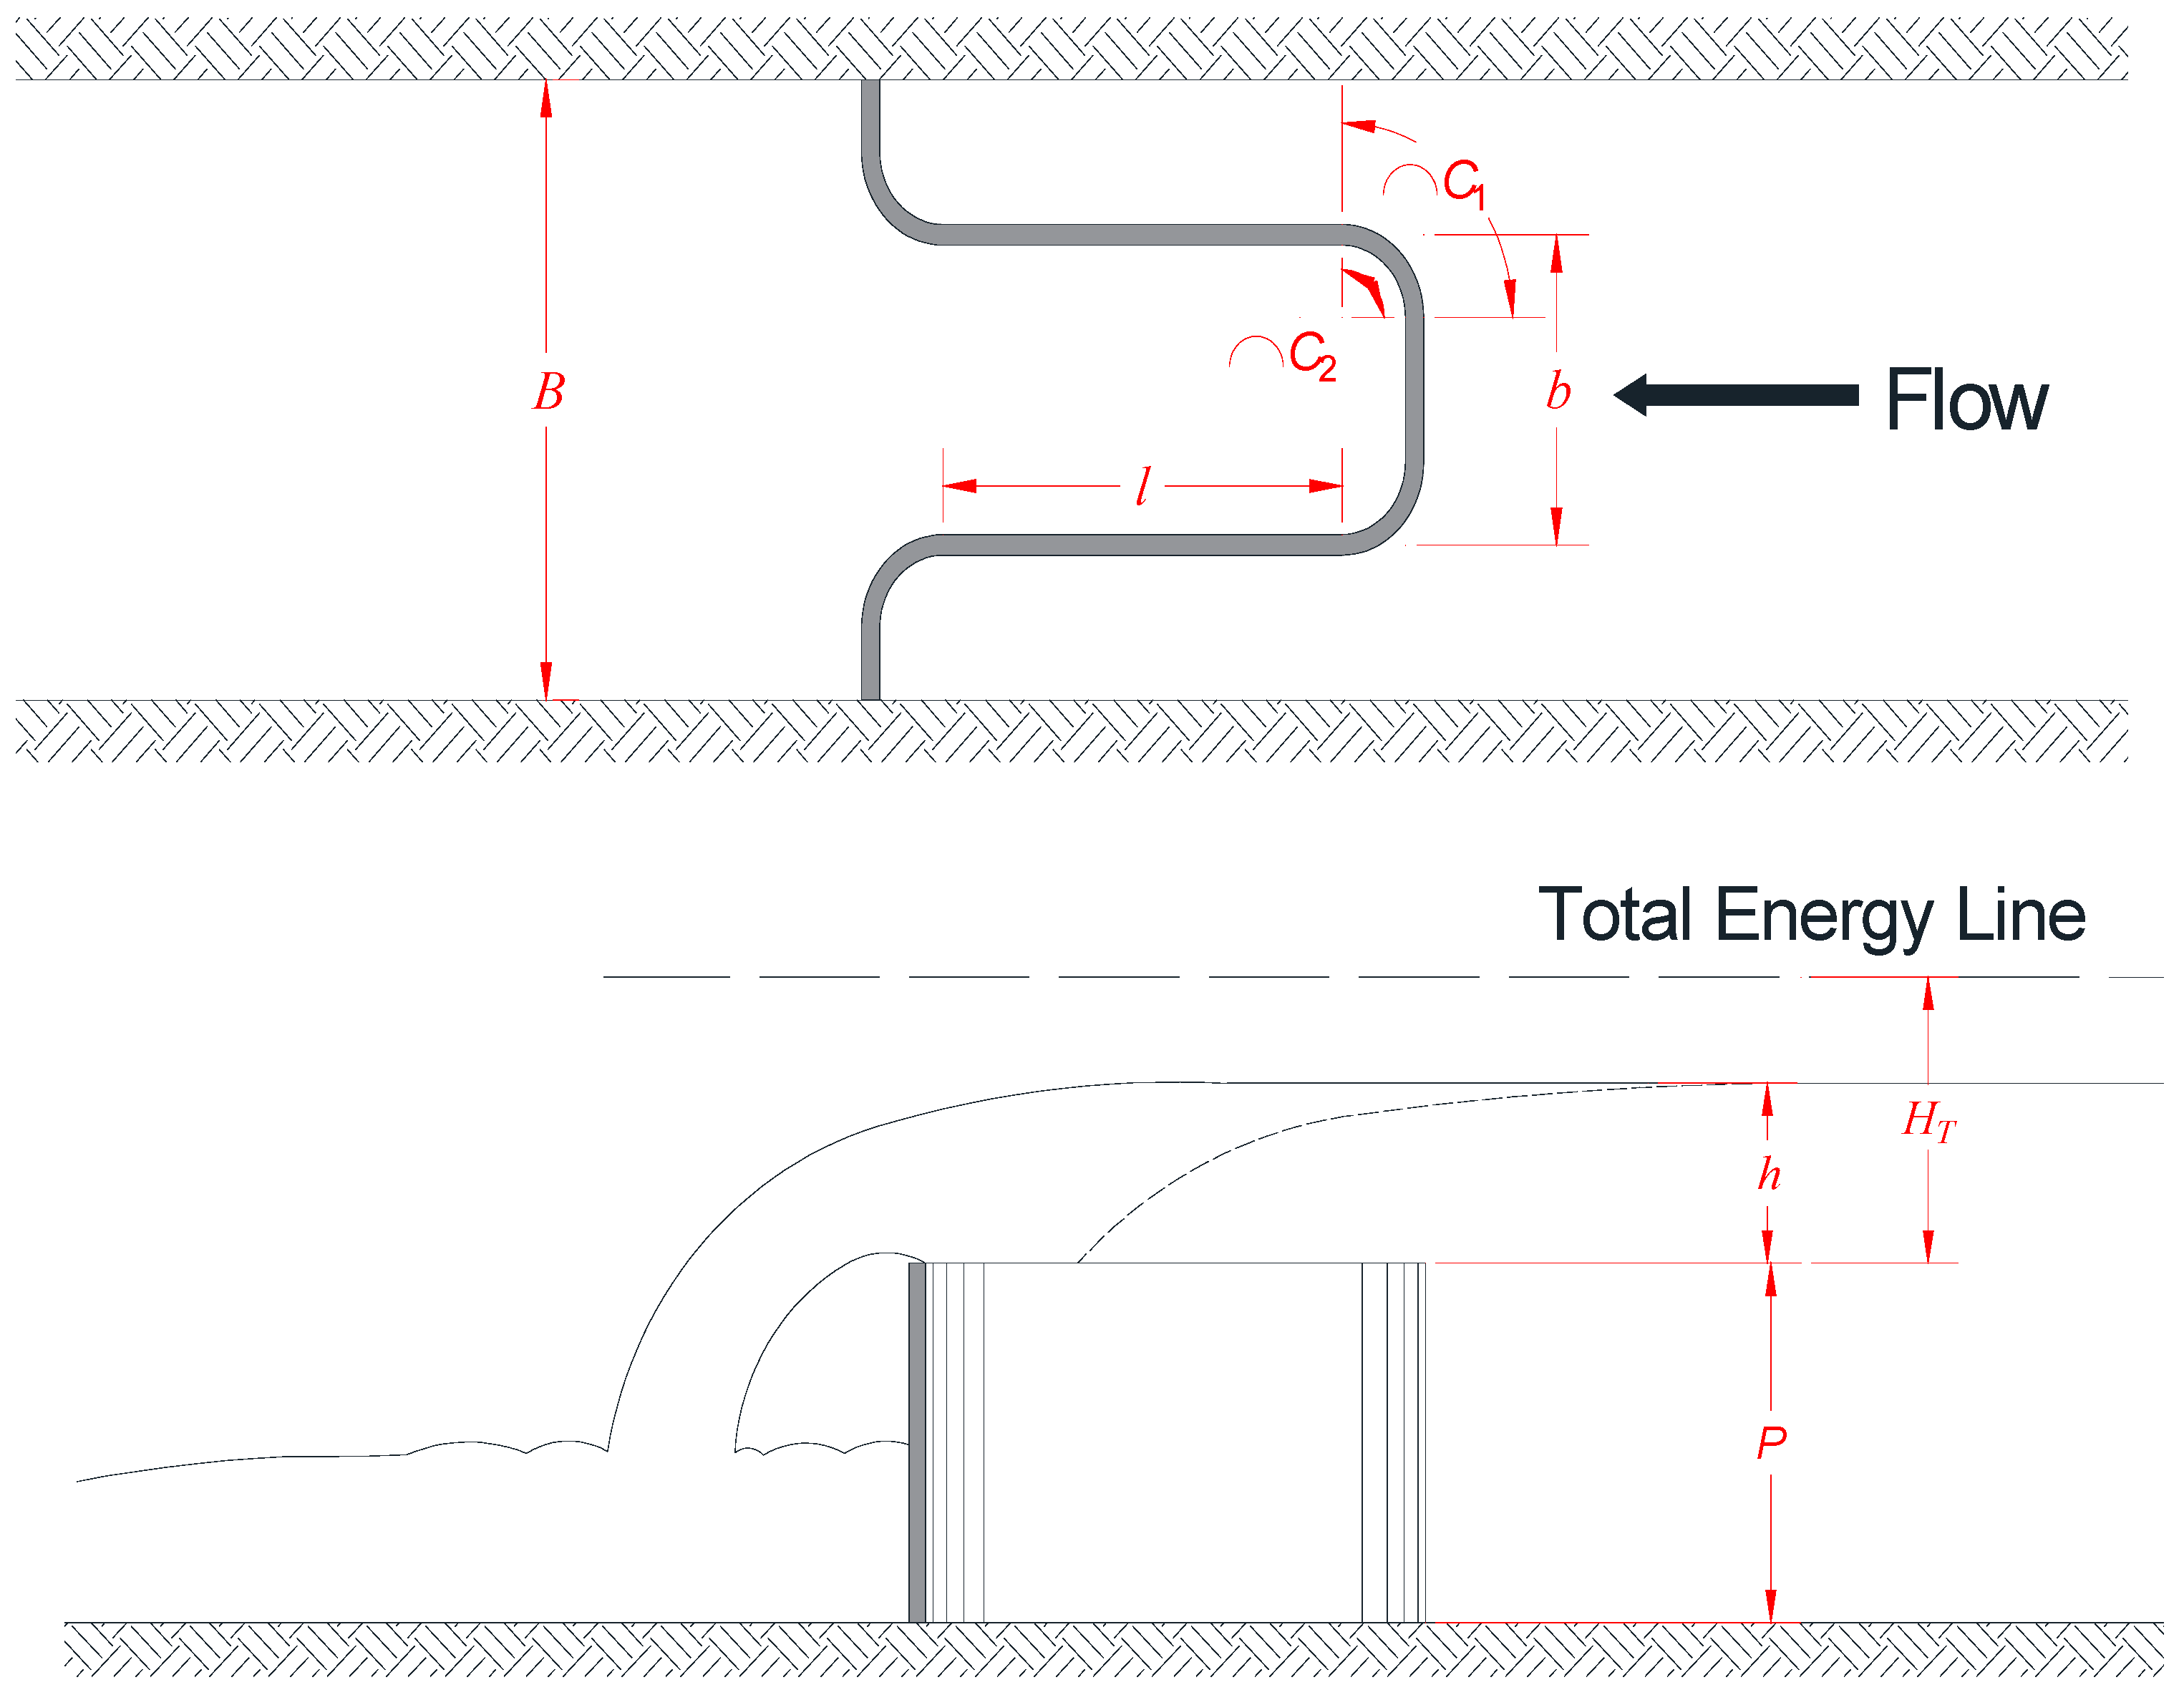
Nine rectangular labyrinth weirs were constructed and placed in a laboratory flume (S6MKII Teaching and Research Flume, built by Armfield company) at the University of Sulaimani to meet the goals of this study. High-density polyethylene (HDPE) was used to make the models (1-cm-thick walls). Round corners and flat crest shapes characterized the rectangular labyrinth weir versions. Three different weir heights were tested, as well as three different effective lengths. The slope of the flume’s steel bed (5 m long, 0.3 m wide, 0.45 m deep, with Plexiglas sidewalls) was adjusted to zero for all runs. A sketch of the models and a photograph of the flume are shown in Figure 1 and Figure 2, respectively. The details of the models examined in this study are shown in Table 1.
The models were then evaluated under different steady-state settings without artificial aeration devices after being placed in the middle of the flume in a reversed orientation. An ultrasonic flowmeter was used to measure the steady discharges, which ranged from 0.003 to 0.03 m3/s. A point gauge with 0.1 mm accuracy was employed to measure the depth of water flowing over the crest of the models, h (see Figure 3), at a distance greater than or equal to 5 h upstream of the weirs. After fifteen to twenty minutes had passed and the steady-state situation had stabilized, measurements were taken for each discharge. In each run, which lasted 3 to 4 h, photographs, videos, and visual inspections were used to document the hydraulic performance of the models. The details of the experiments are presented in Table 2.

3. Results and Discussion

In this experimental study, the hydraulic performance of nine round-cornered rectangular labyrinth weirs was evaluated. To determine the coefficient of discharge for the weirs, the head−discharge correlations shown below were used [8,11]:
Q = 2 3 · 2 g · C L · L C · H T 1.5 = 2 3 · 2 g C B · B · ( h + V a 2 2 g ) 1.5  
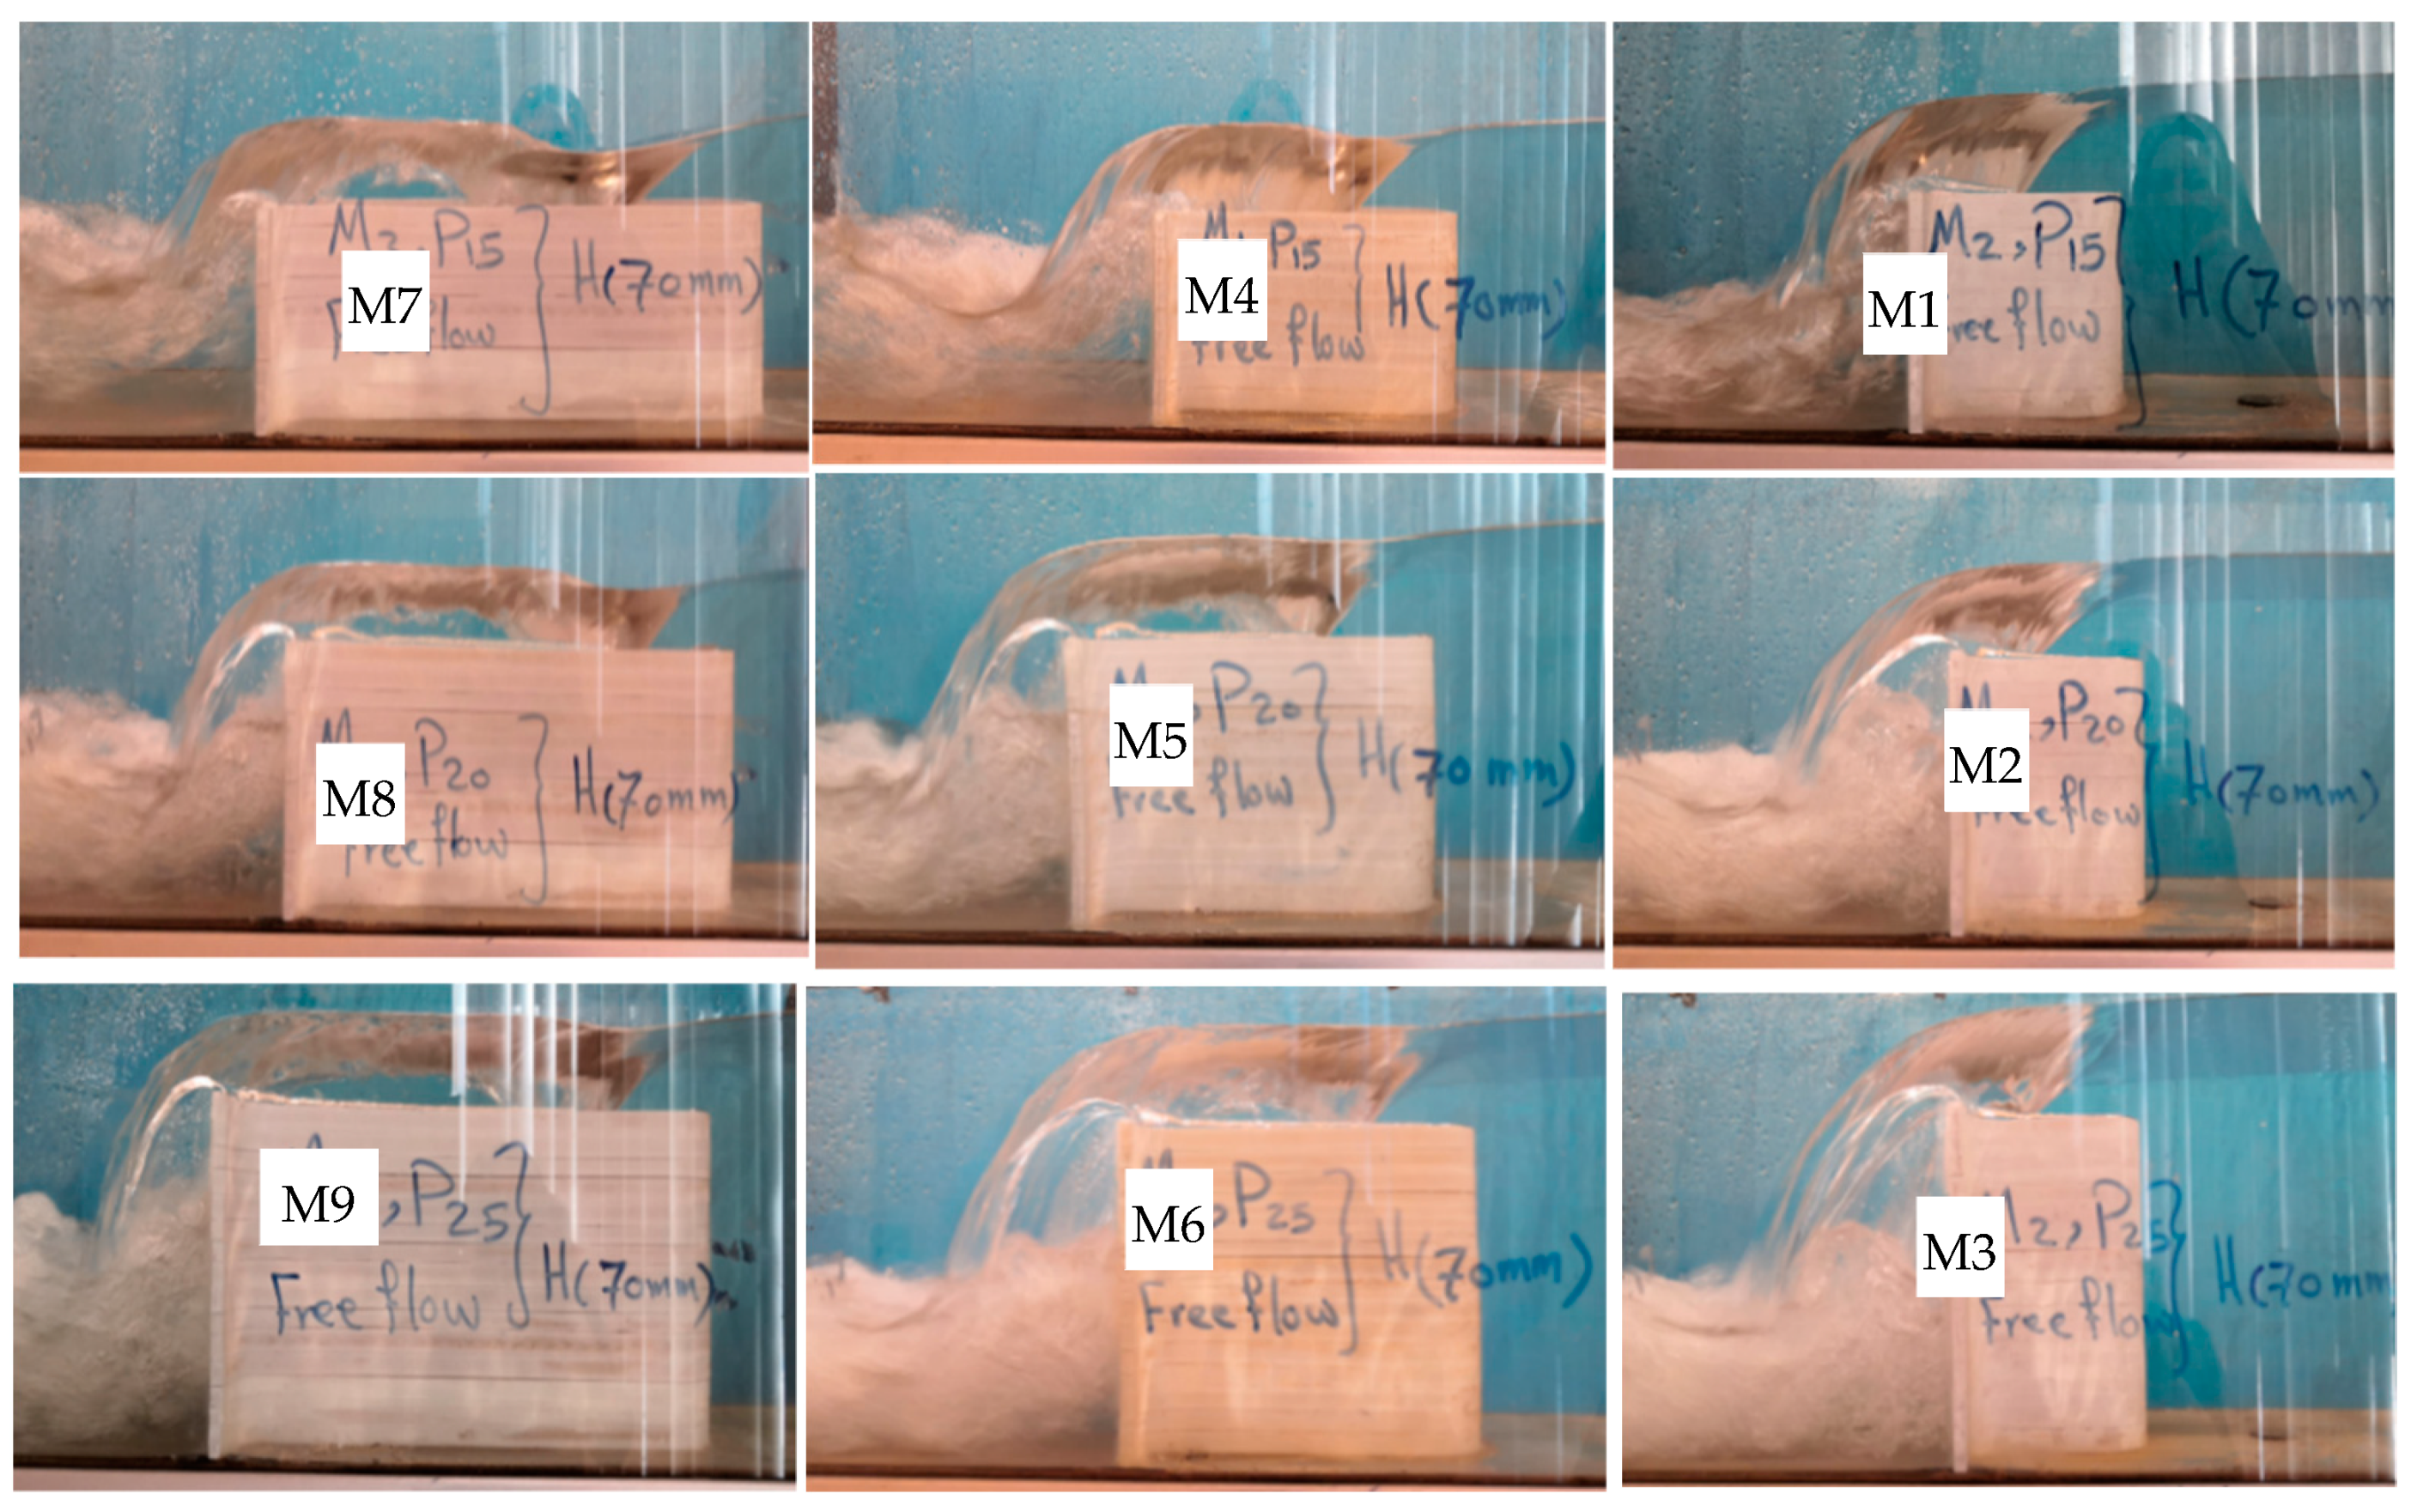
where Q is the overflow discharge, g is the gravitational acceleration, CL and CB are the coefficients of discharge (dimensionless), LC is the centerline length of the effective length of the weir crest, B is the width of the channel (flume), HT is the total head of the water flowing over the weirs (see Figure 3), h is the depth of water flowing over the weir crest, and Va is the velocity of approach {Q/[B∗(h+P)]}. Figure 4 shows the photographs of all models tested for the same water depth, h = 70 mm.
To identify and quantify the effects of the variables studied here, the experimental results are presented in both figures and tables, as shown in Figure 5, Figure 6, Figure 7, Figure 8, Figure 9, Figure 10, Figure 11, Figure 12, Figure 13, Figure 14, Figure 15, Figure 16, Figure 17, Figure 18, Figure 19 and Figure 20 and Table 3, Table 4 and Table 5.

3.1. Hydraulic Performance of the Models

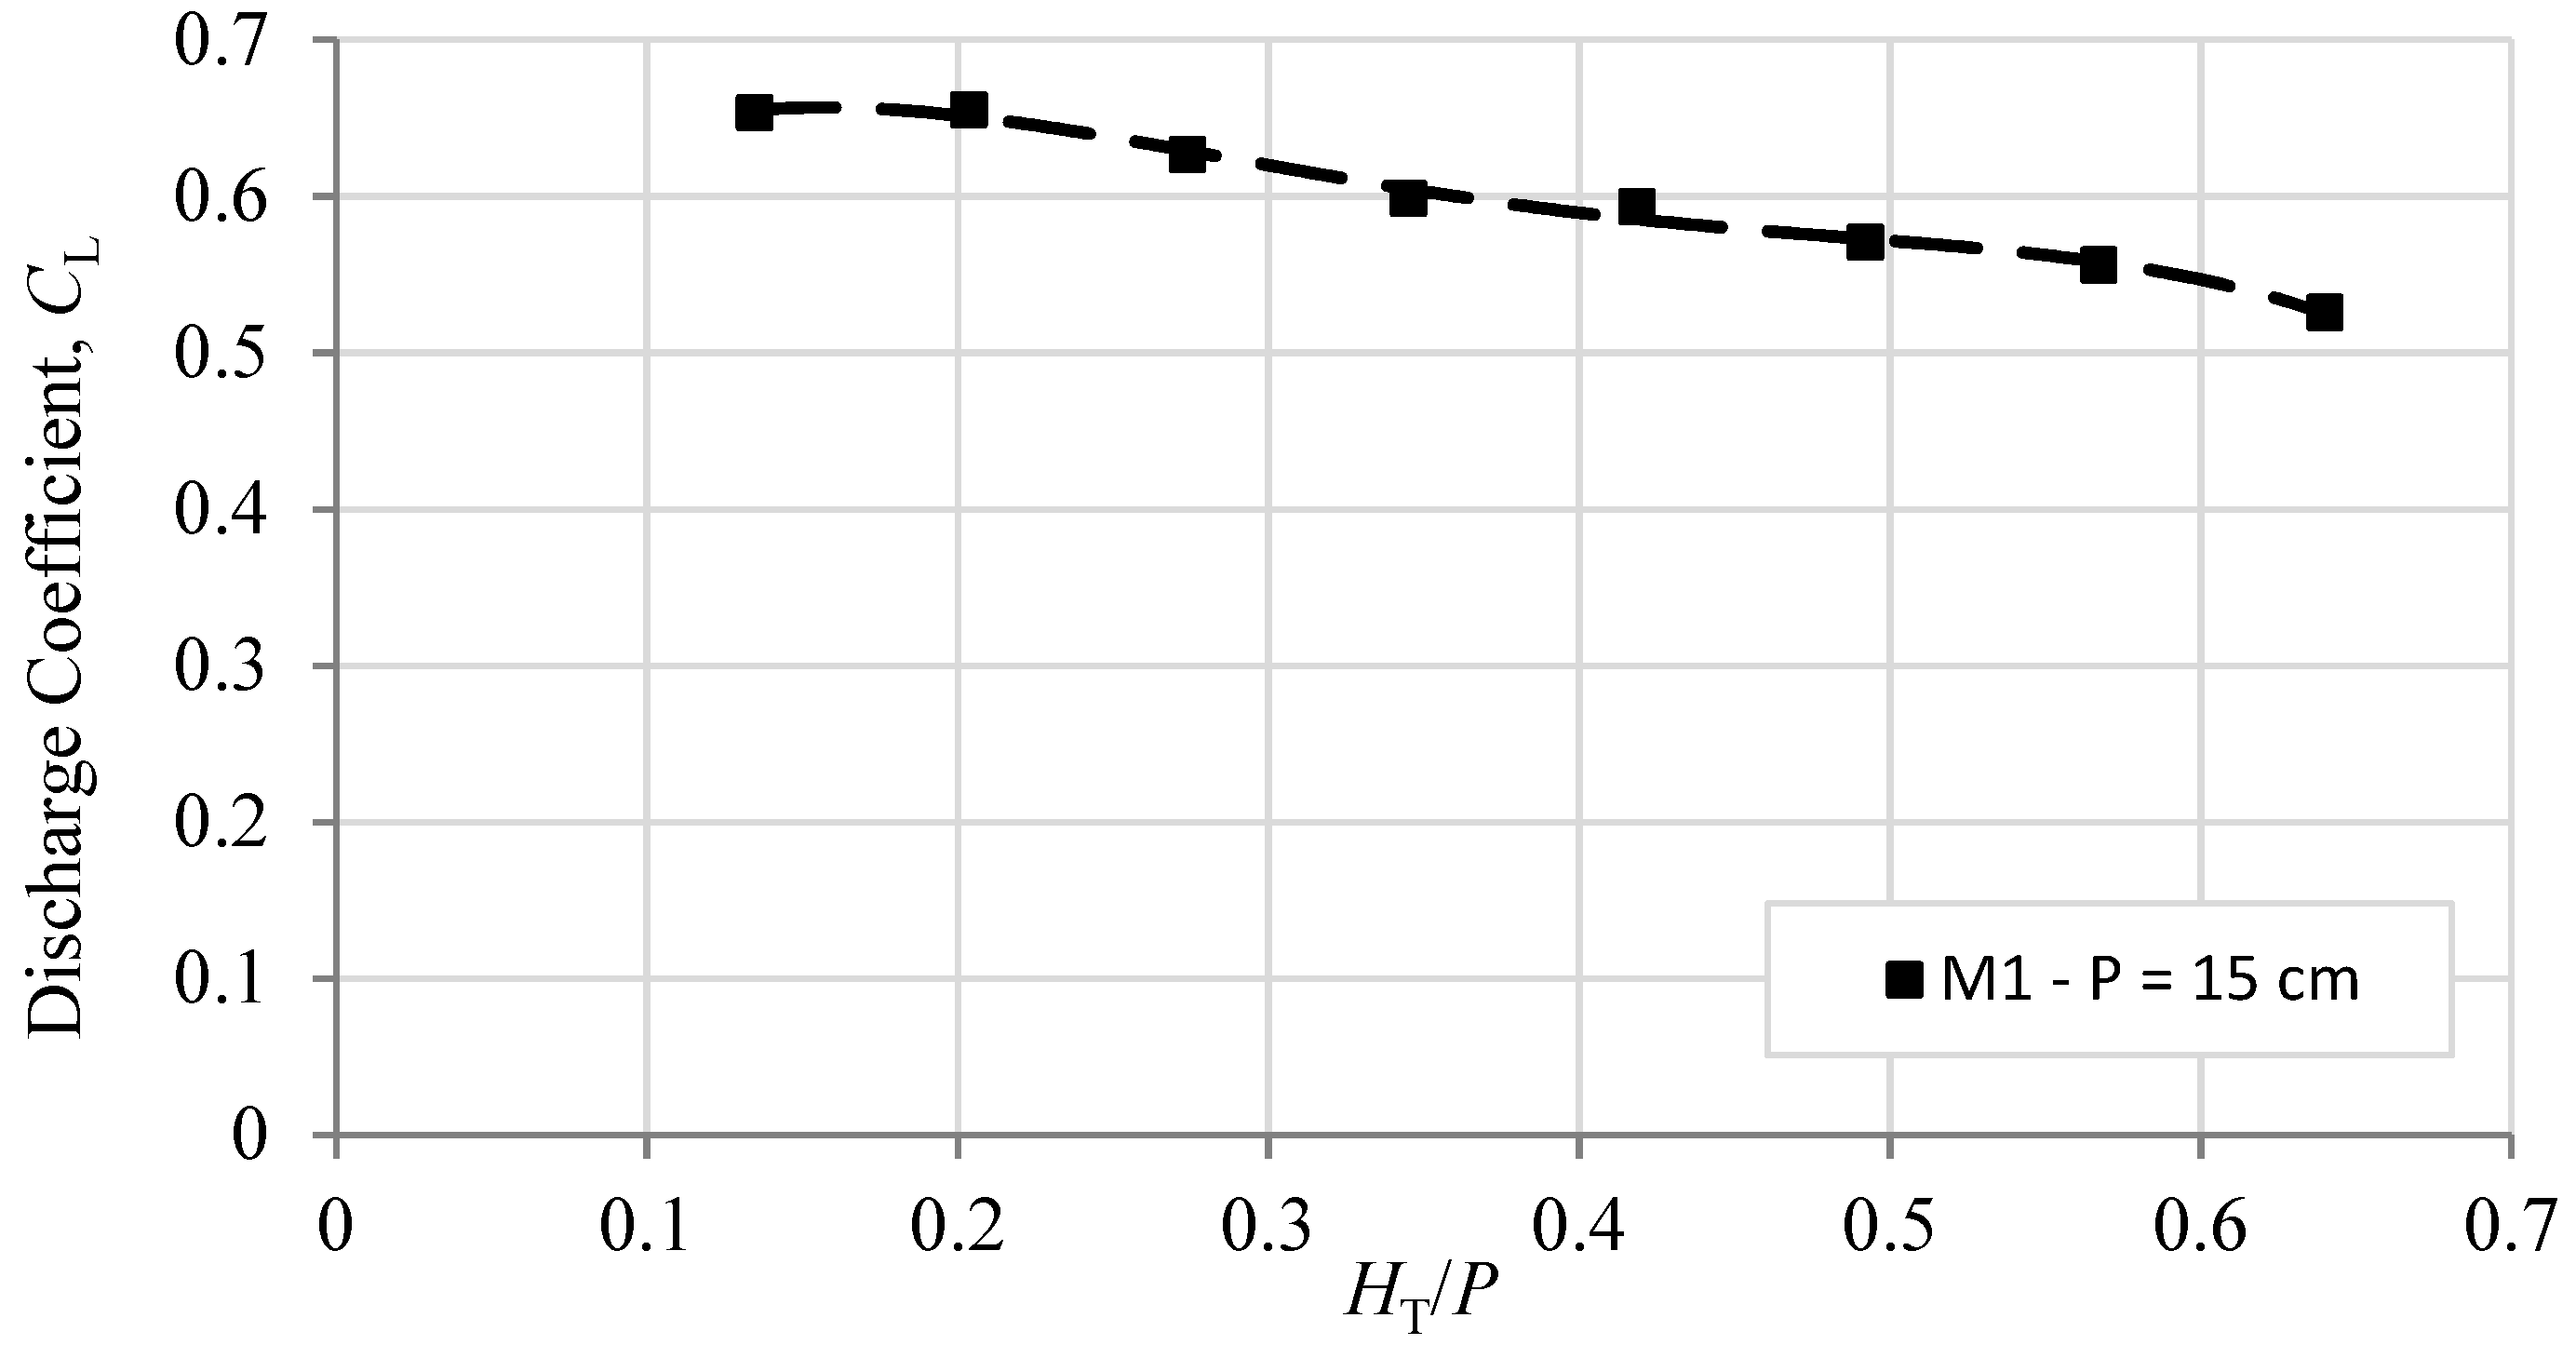
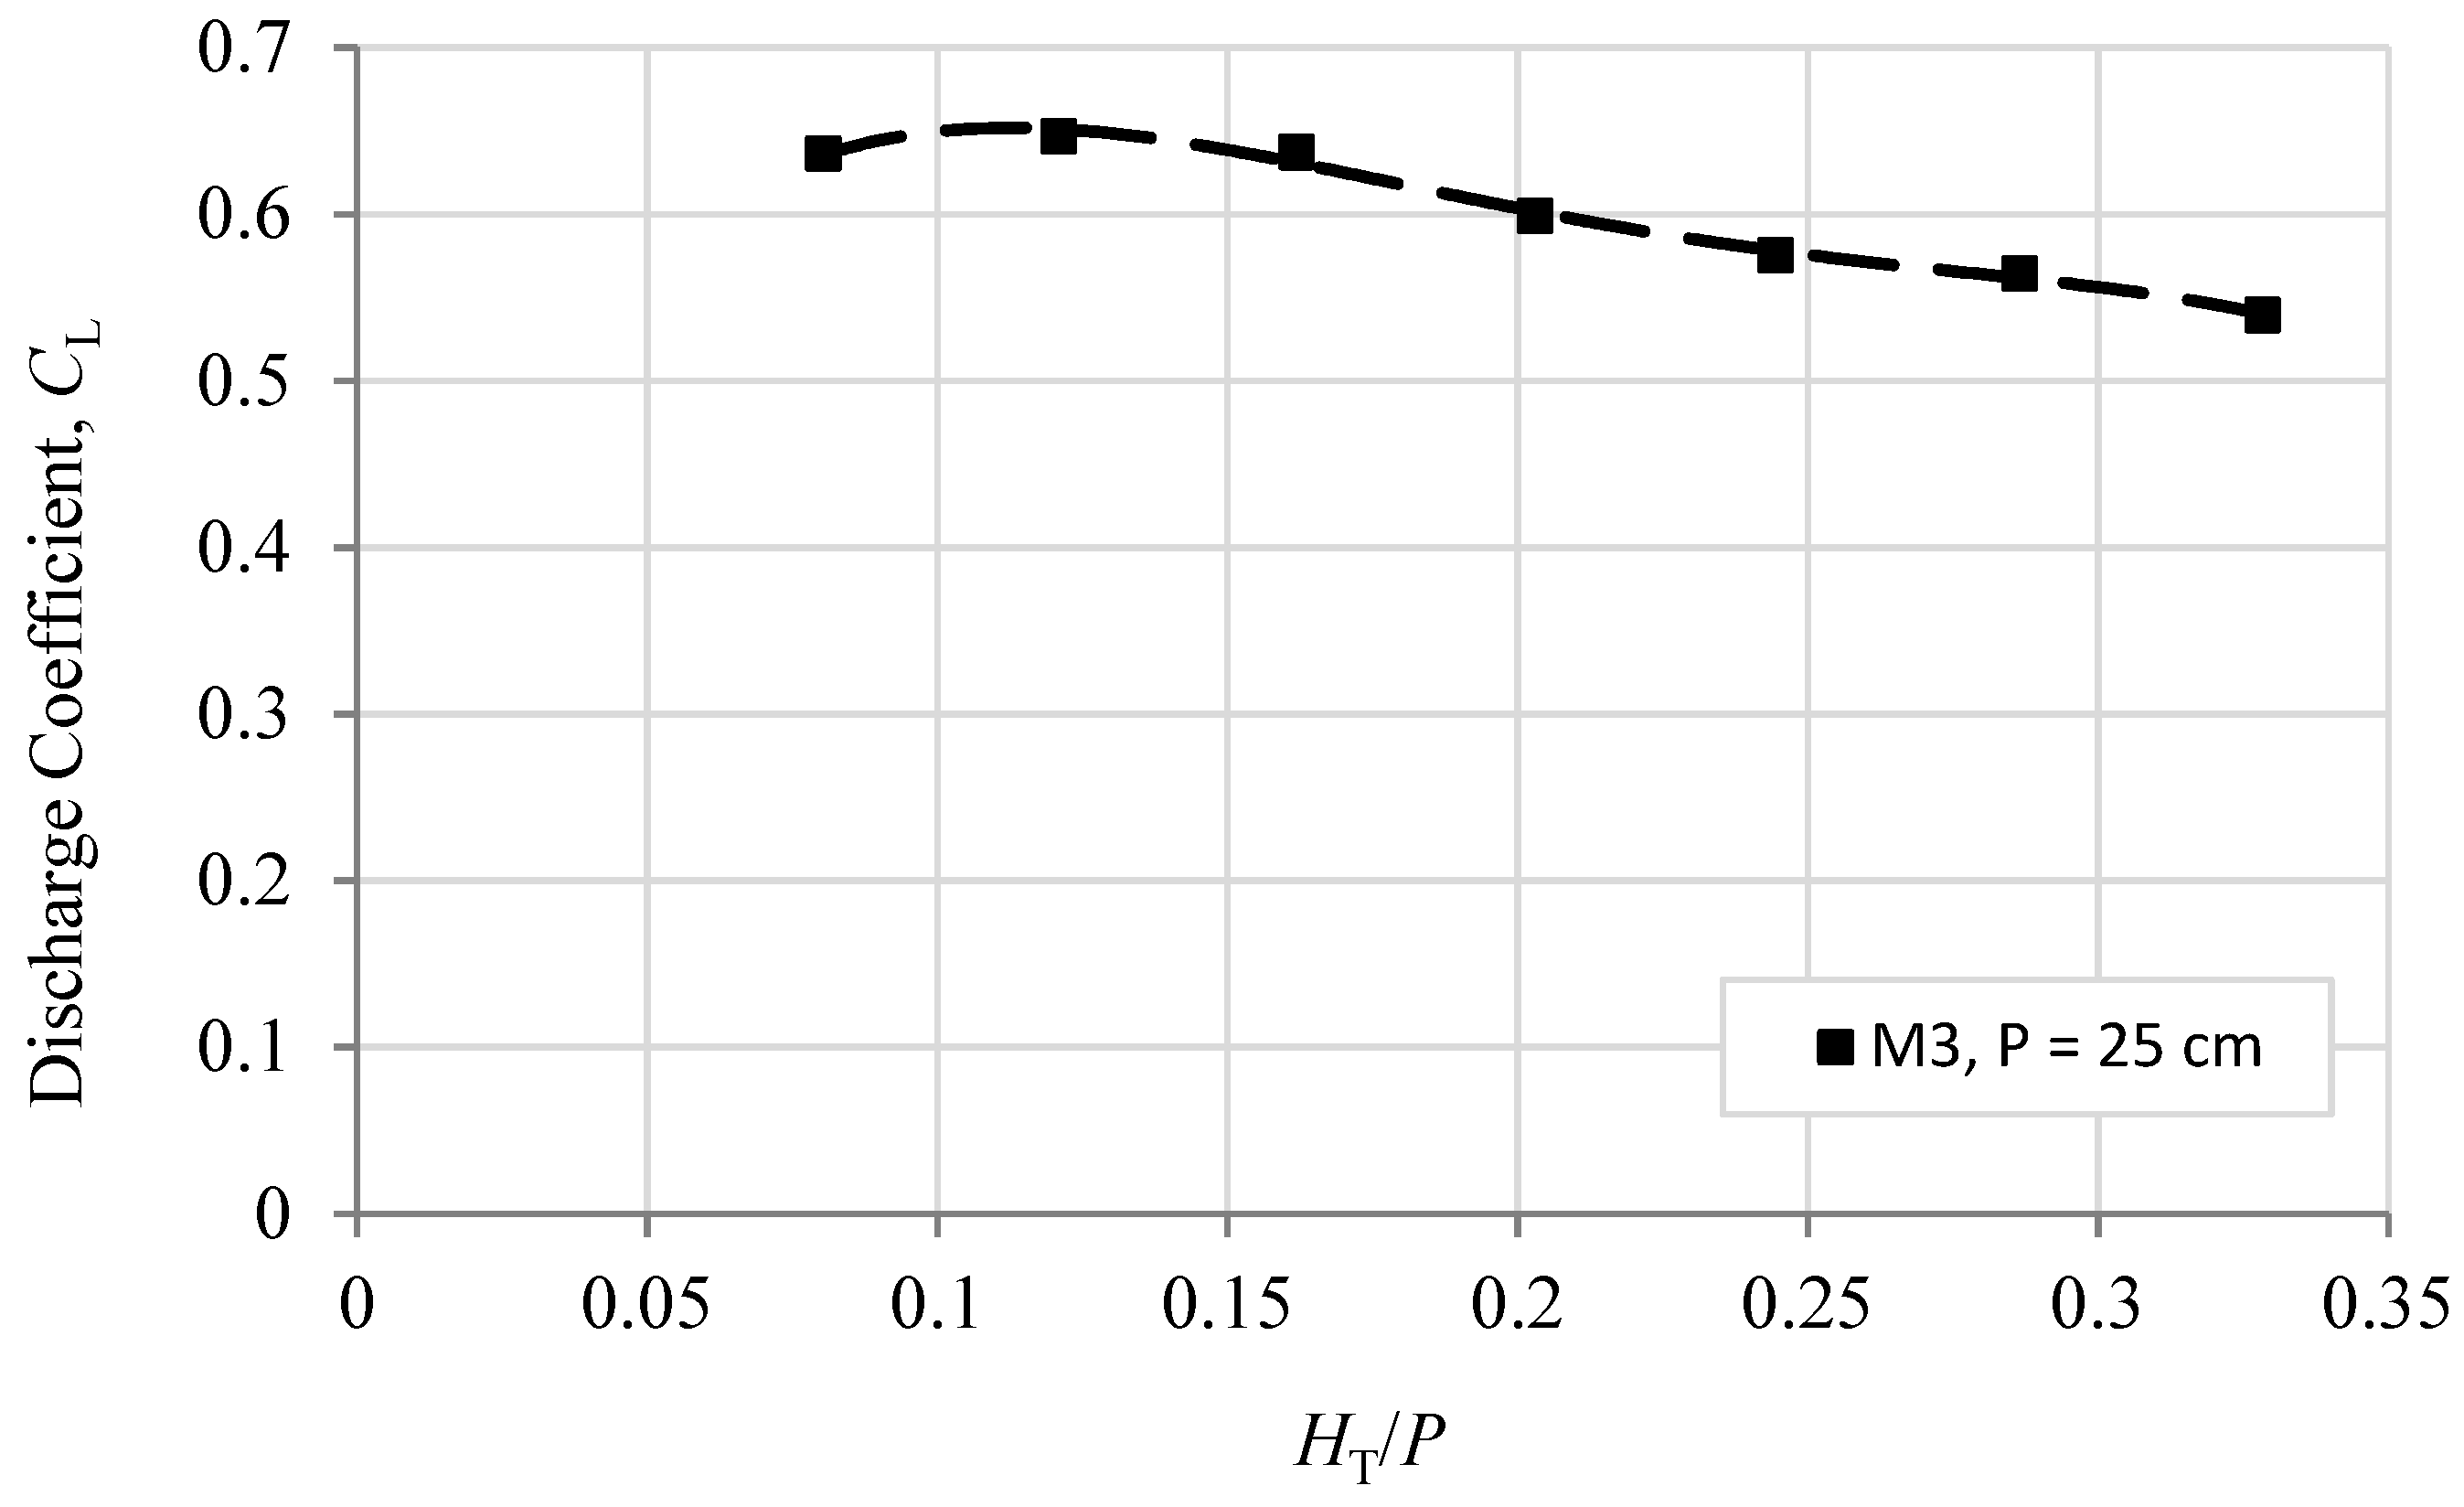
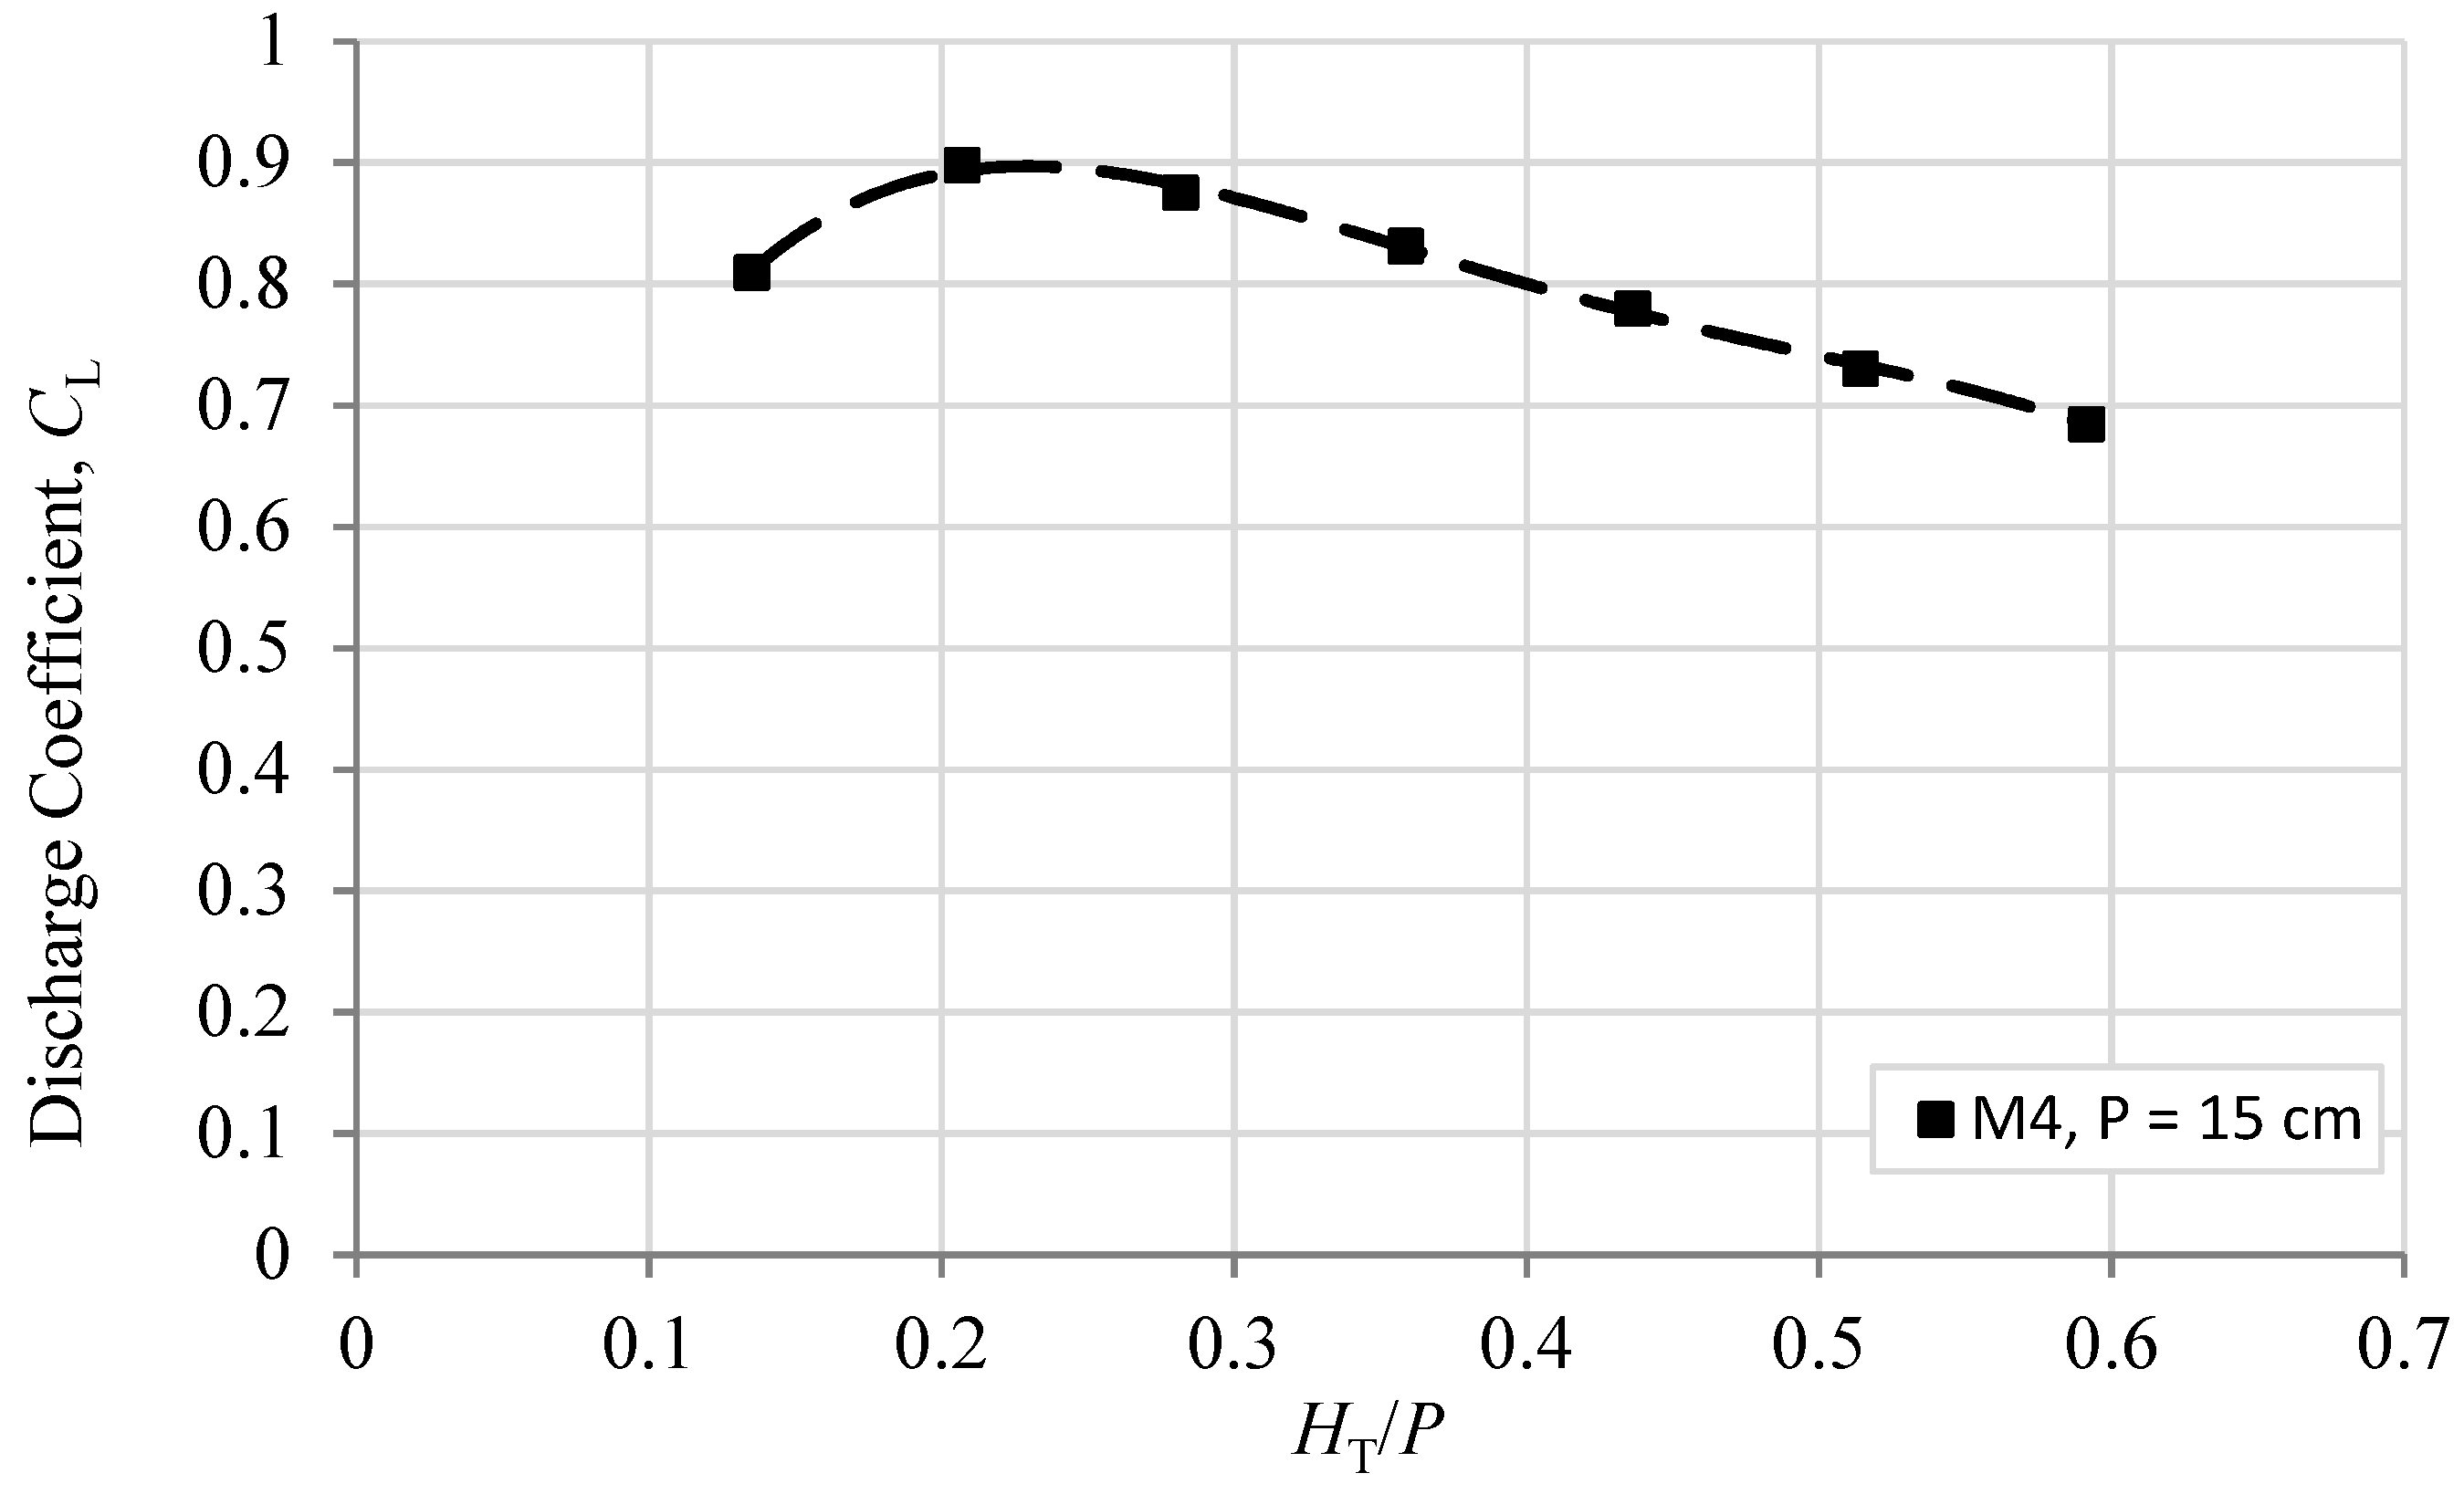
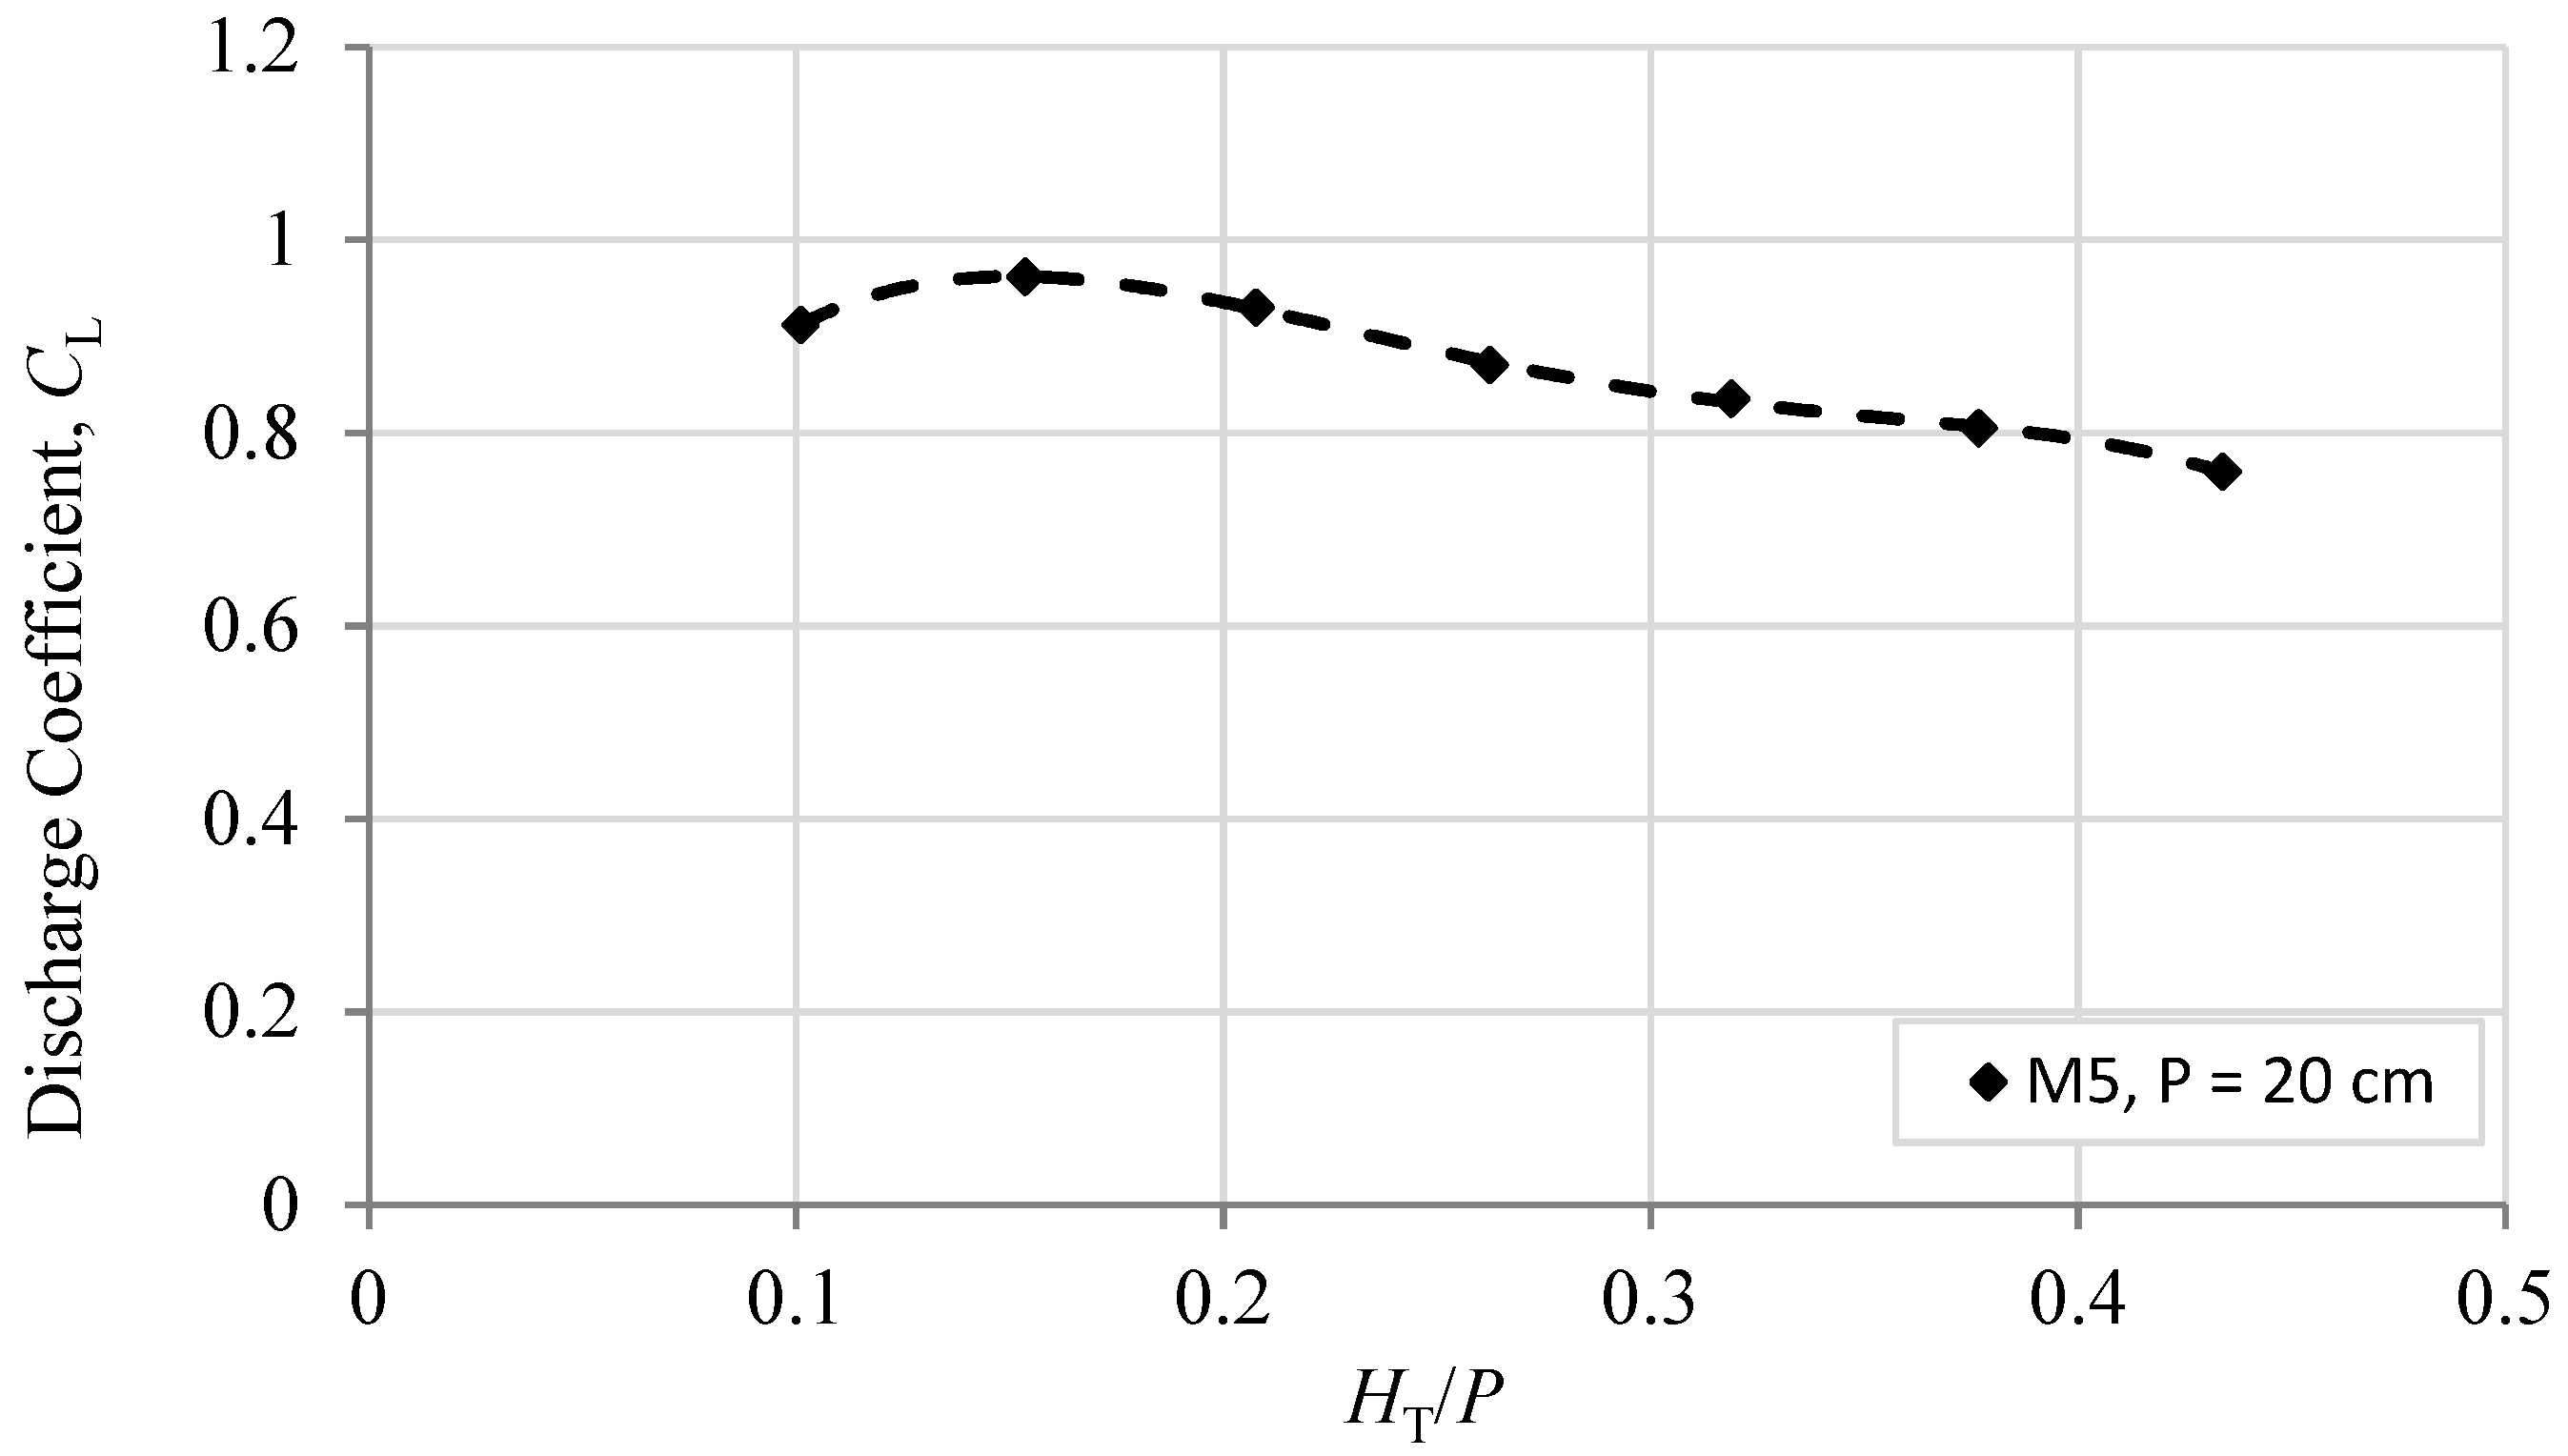
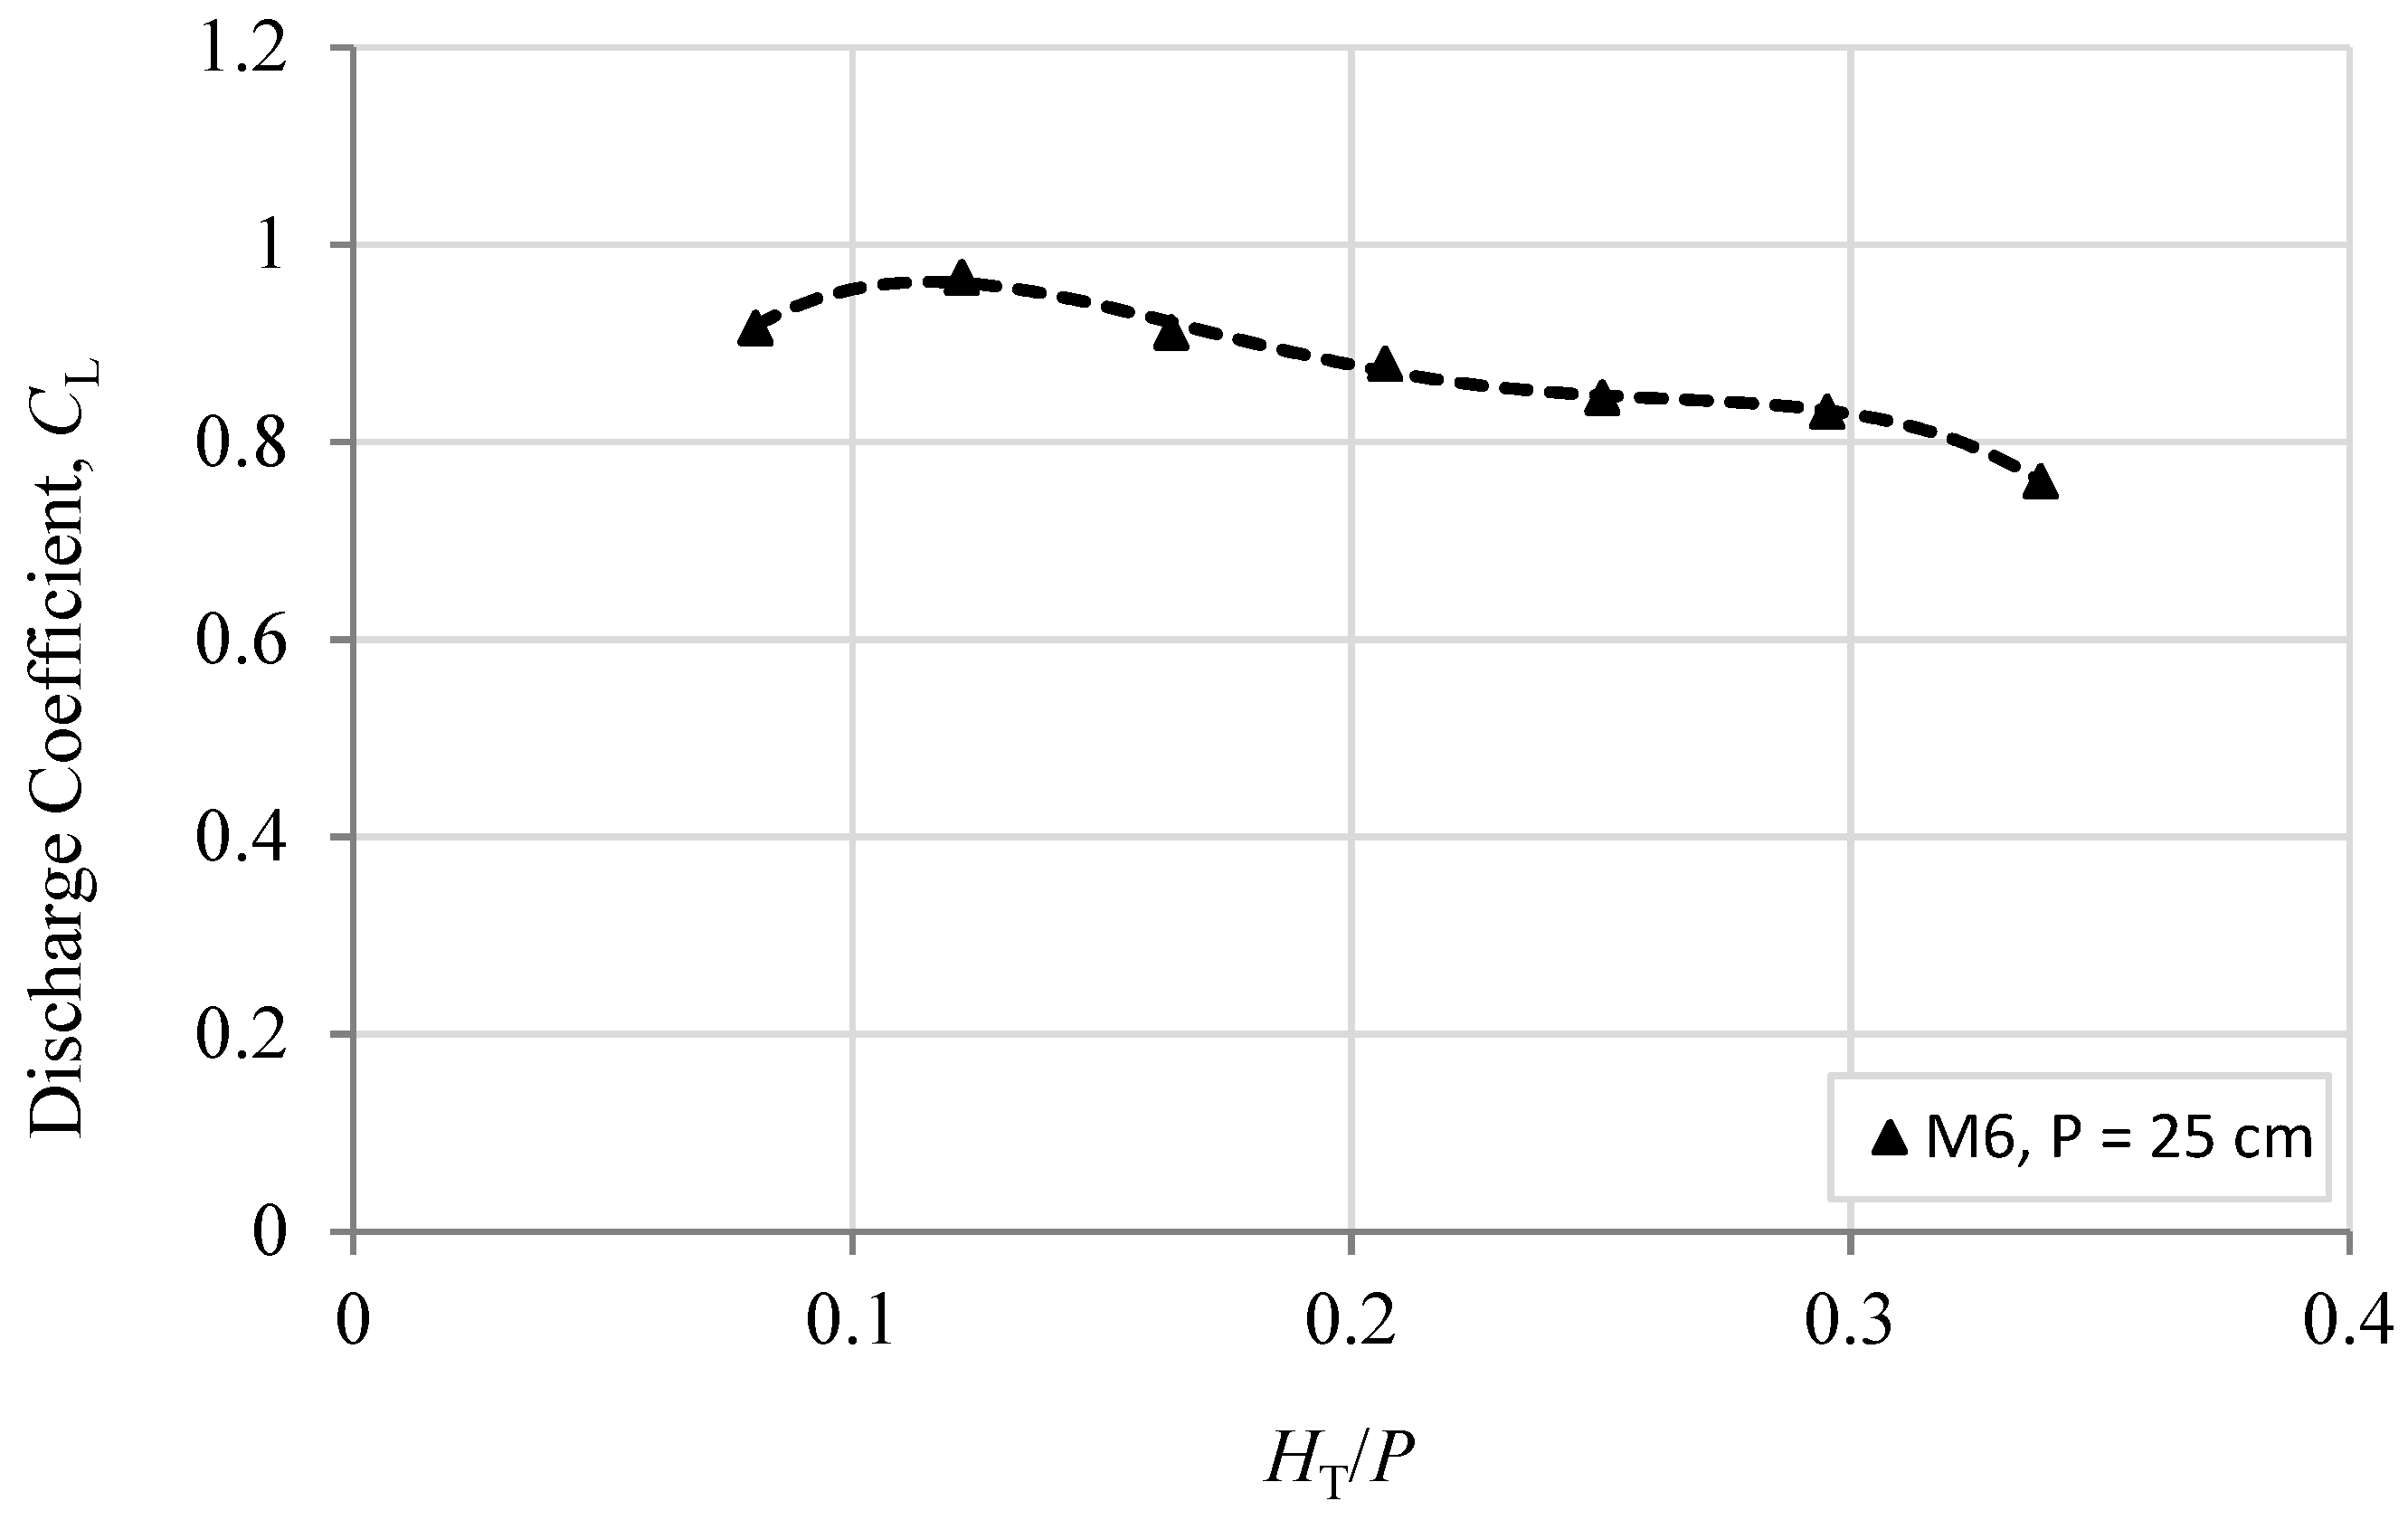
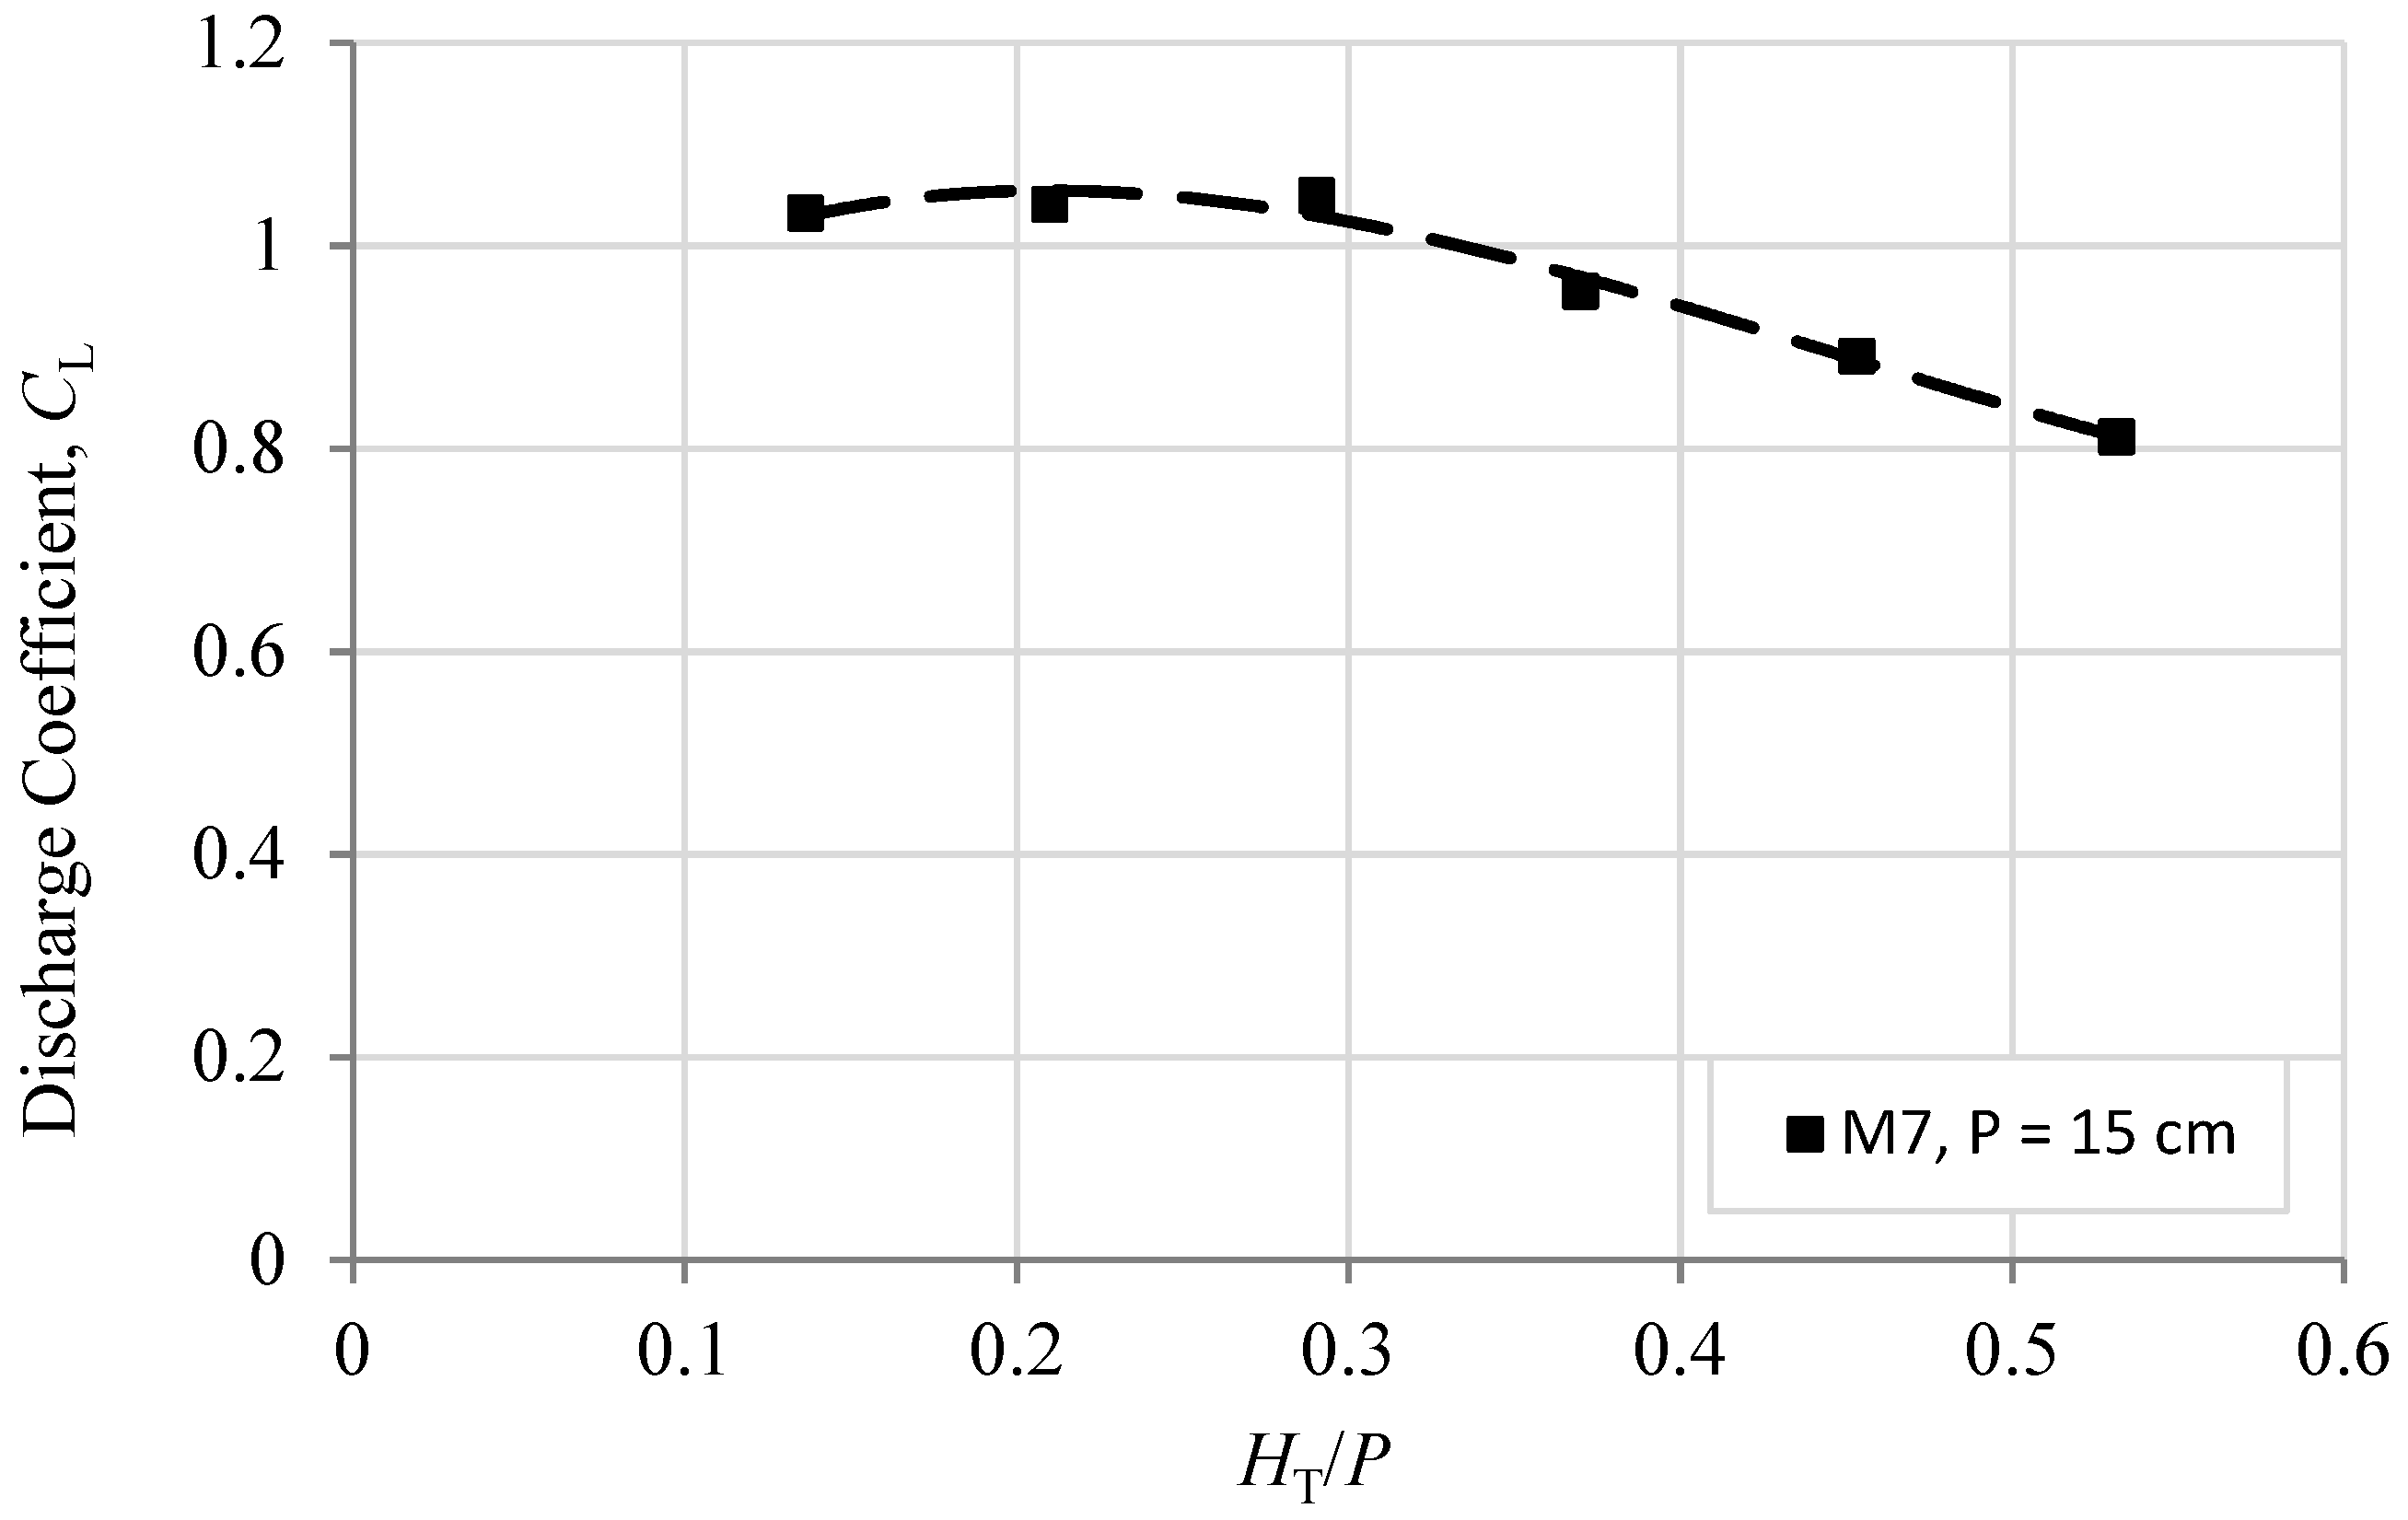
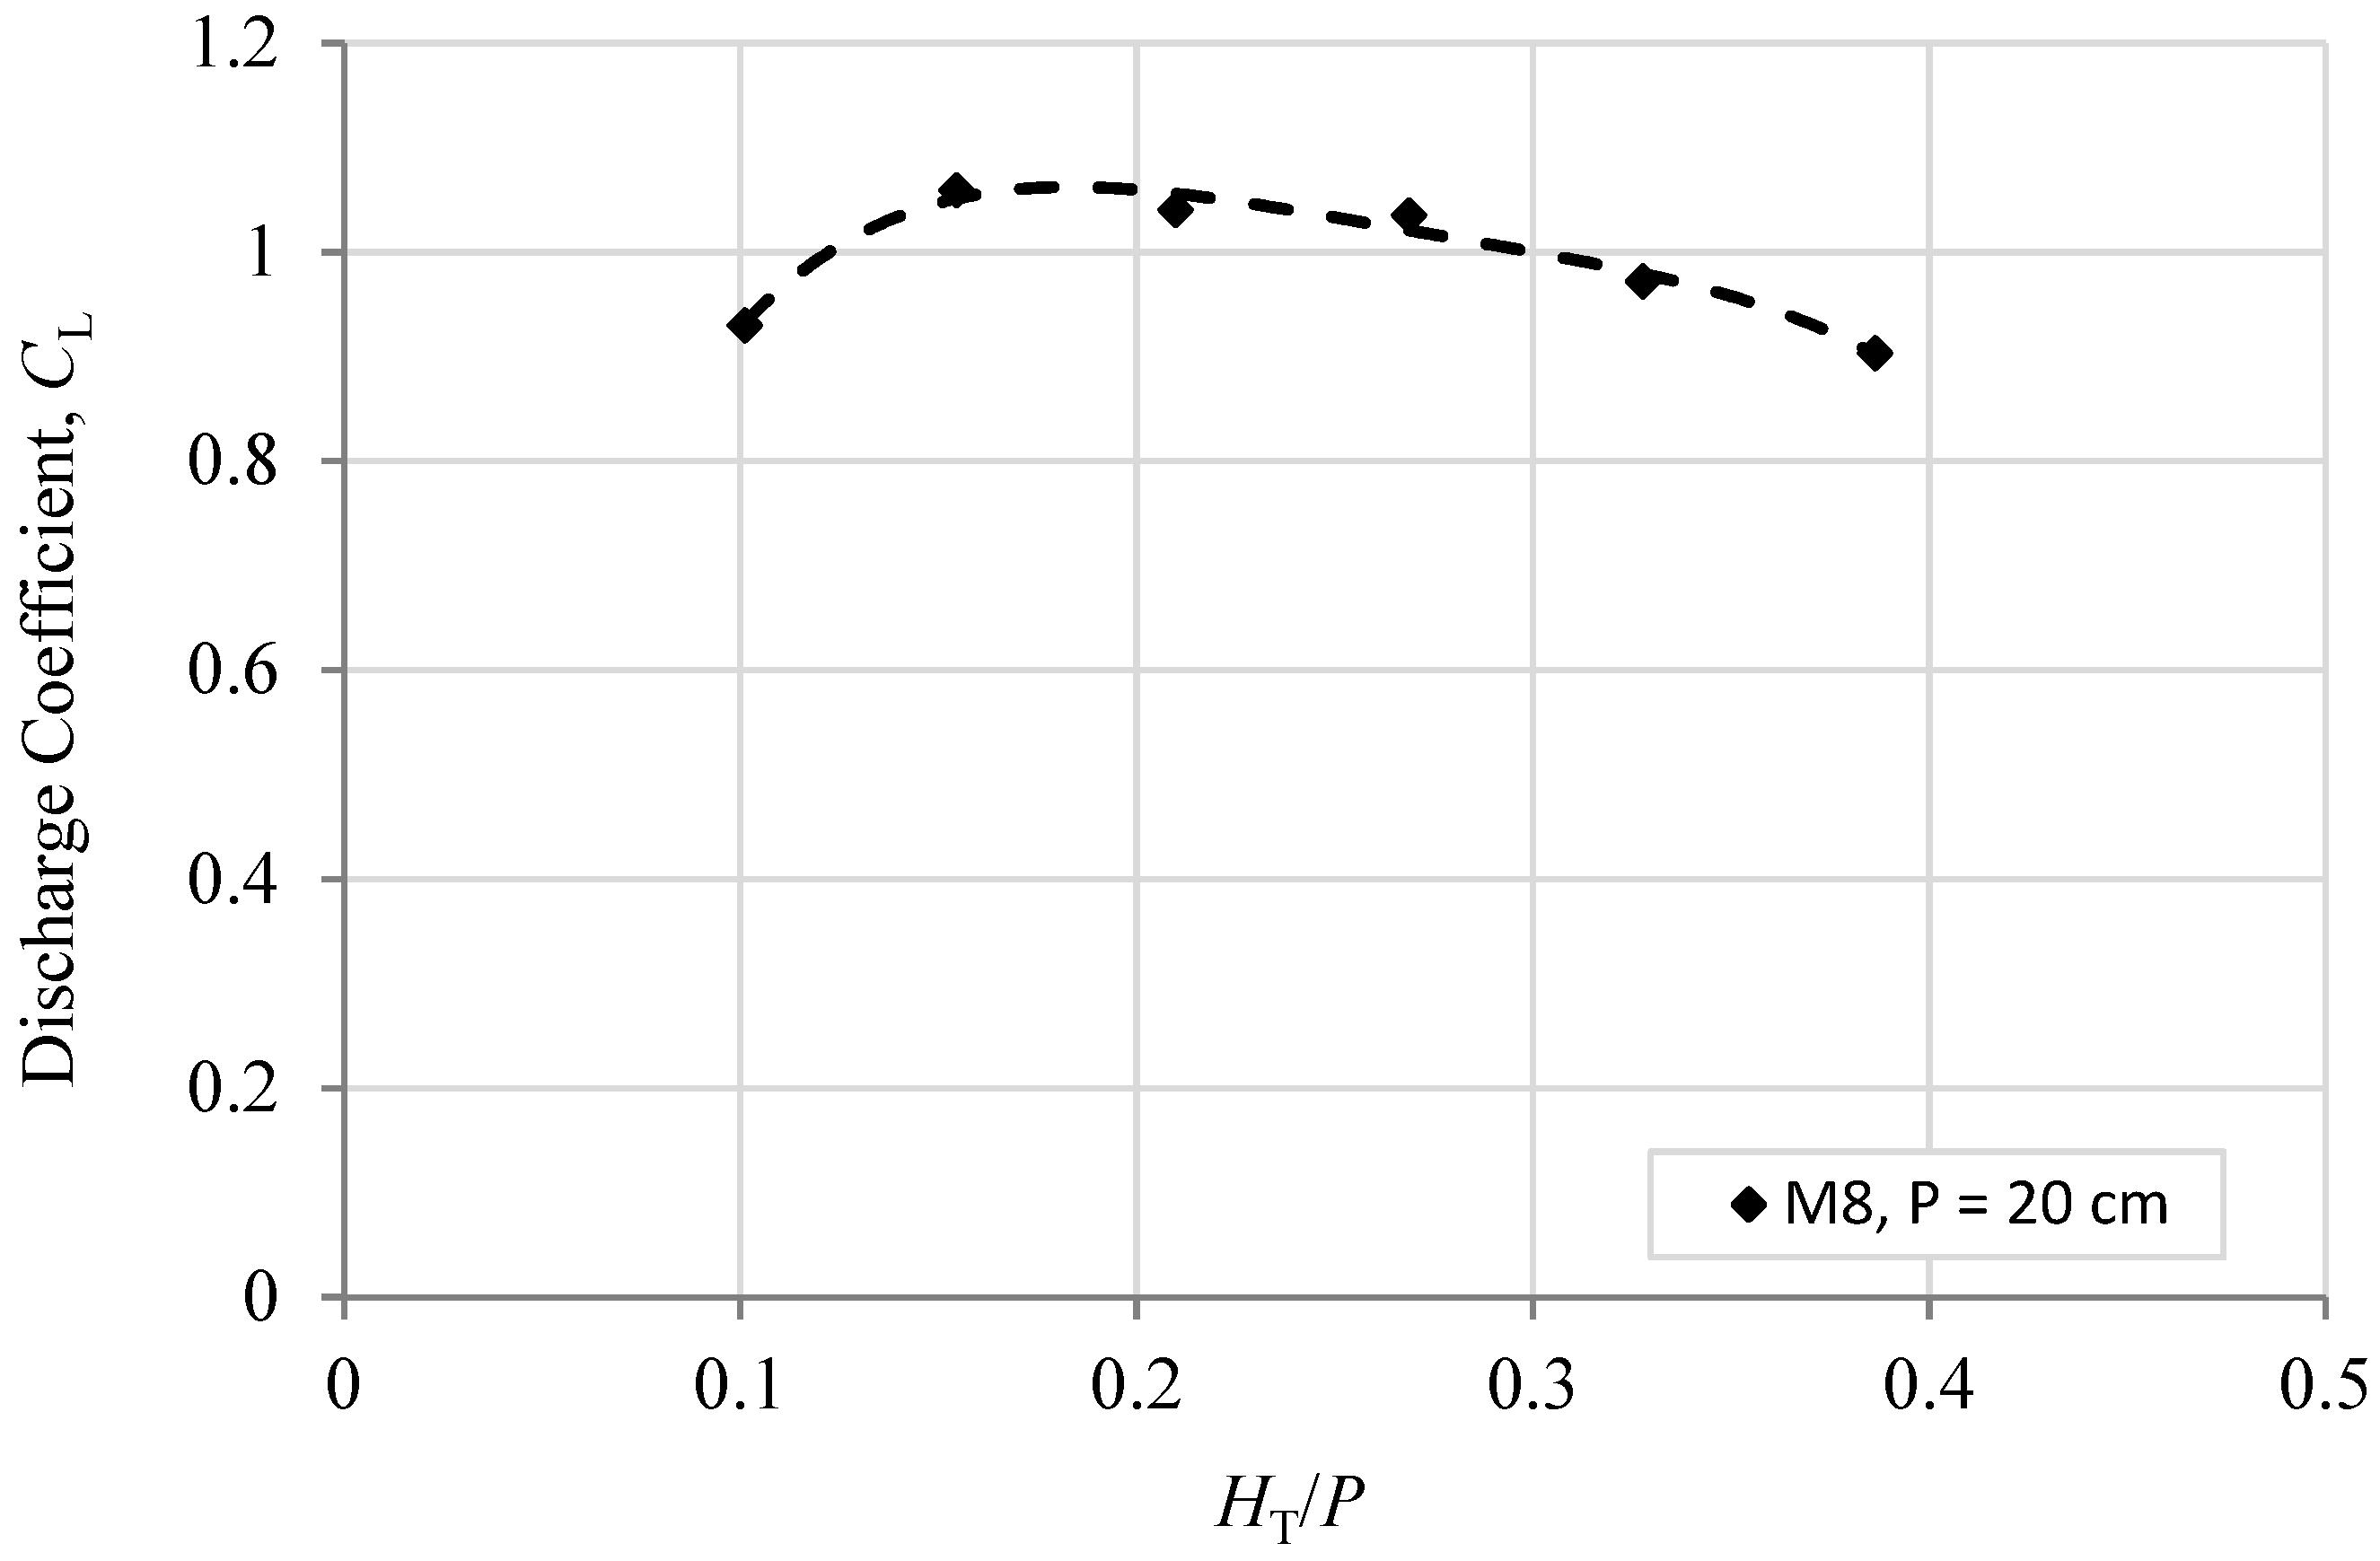
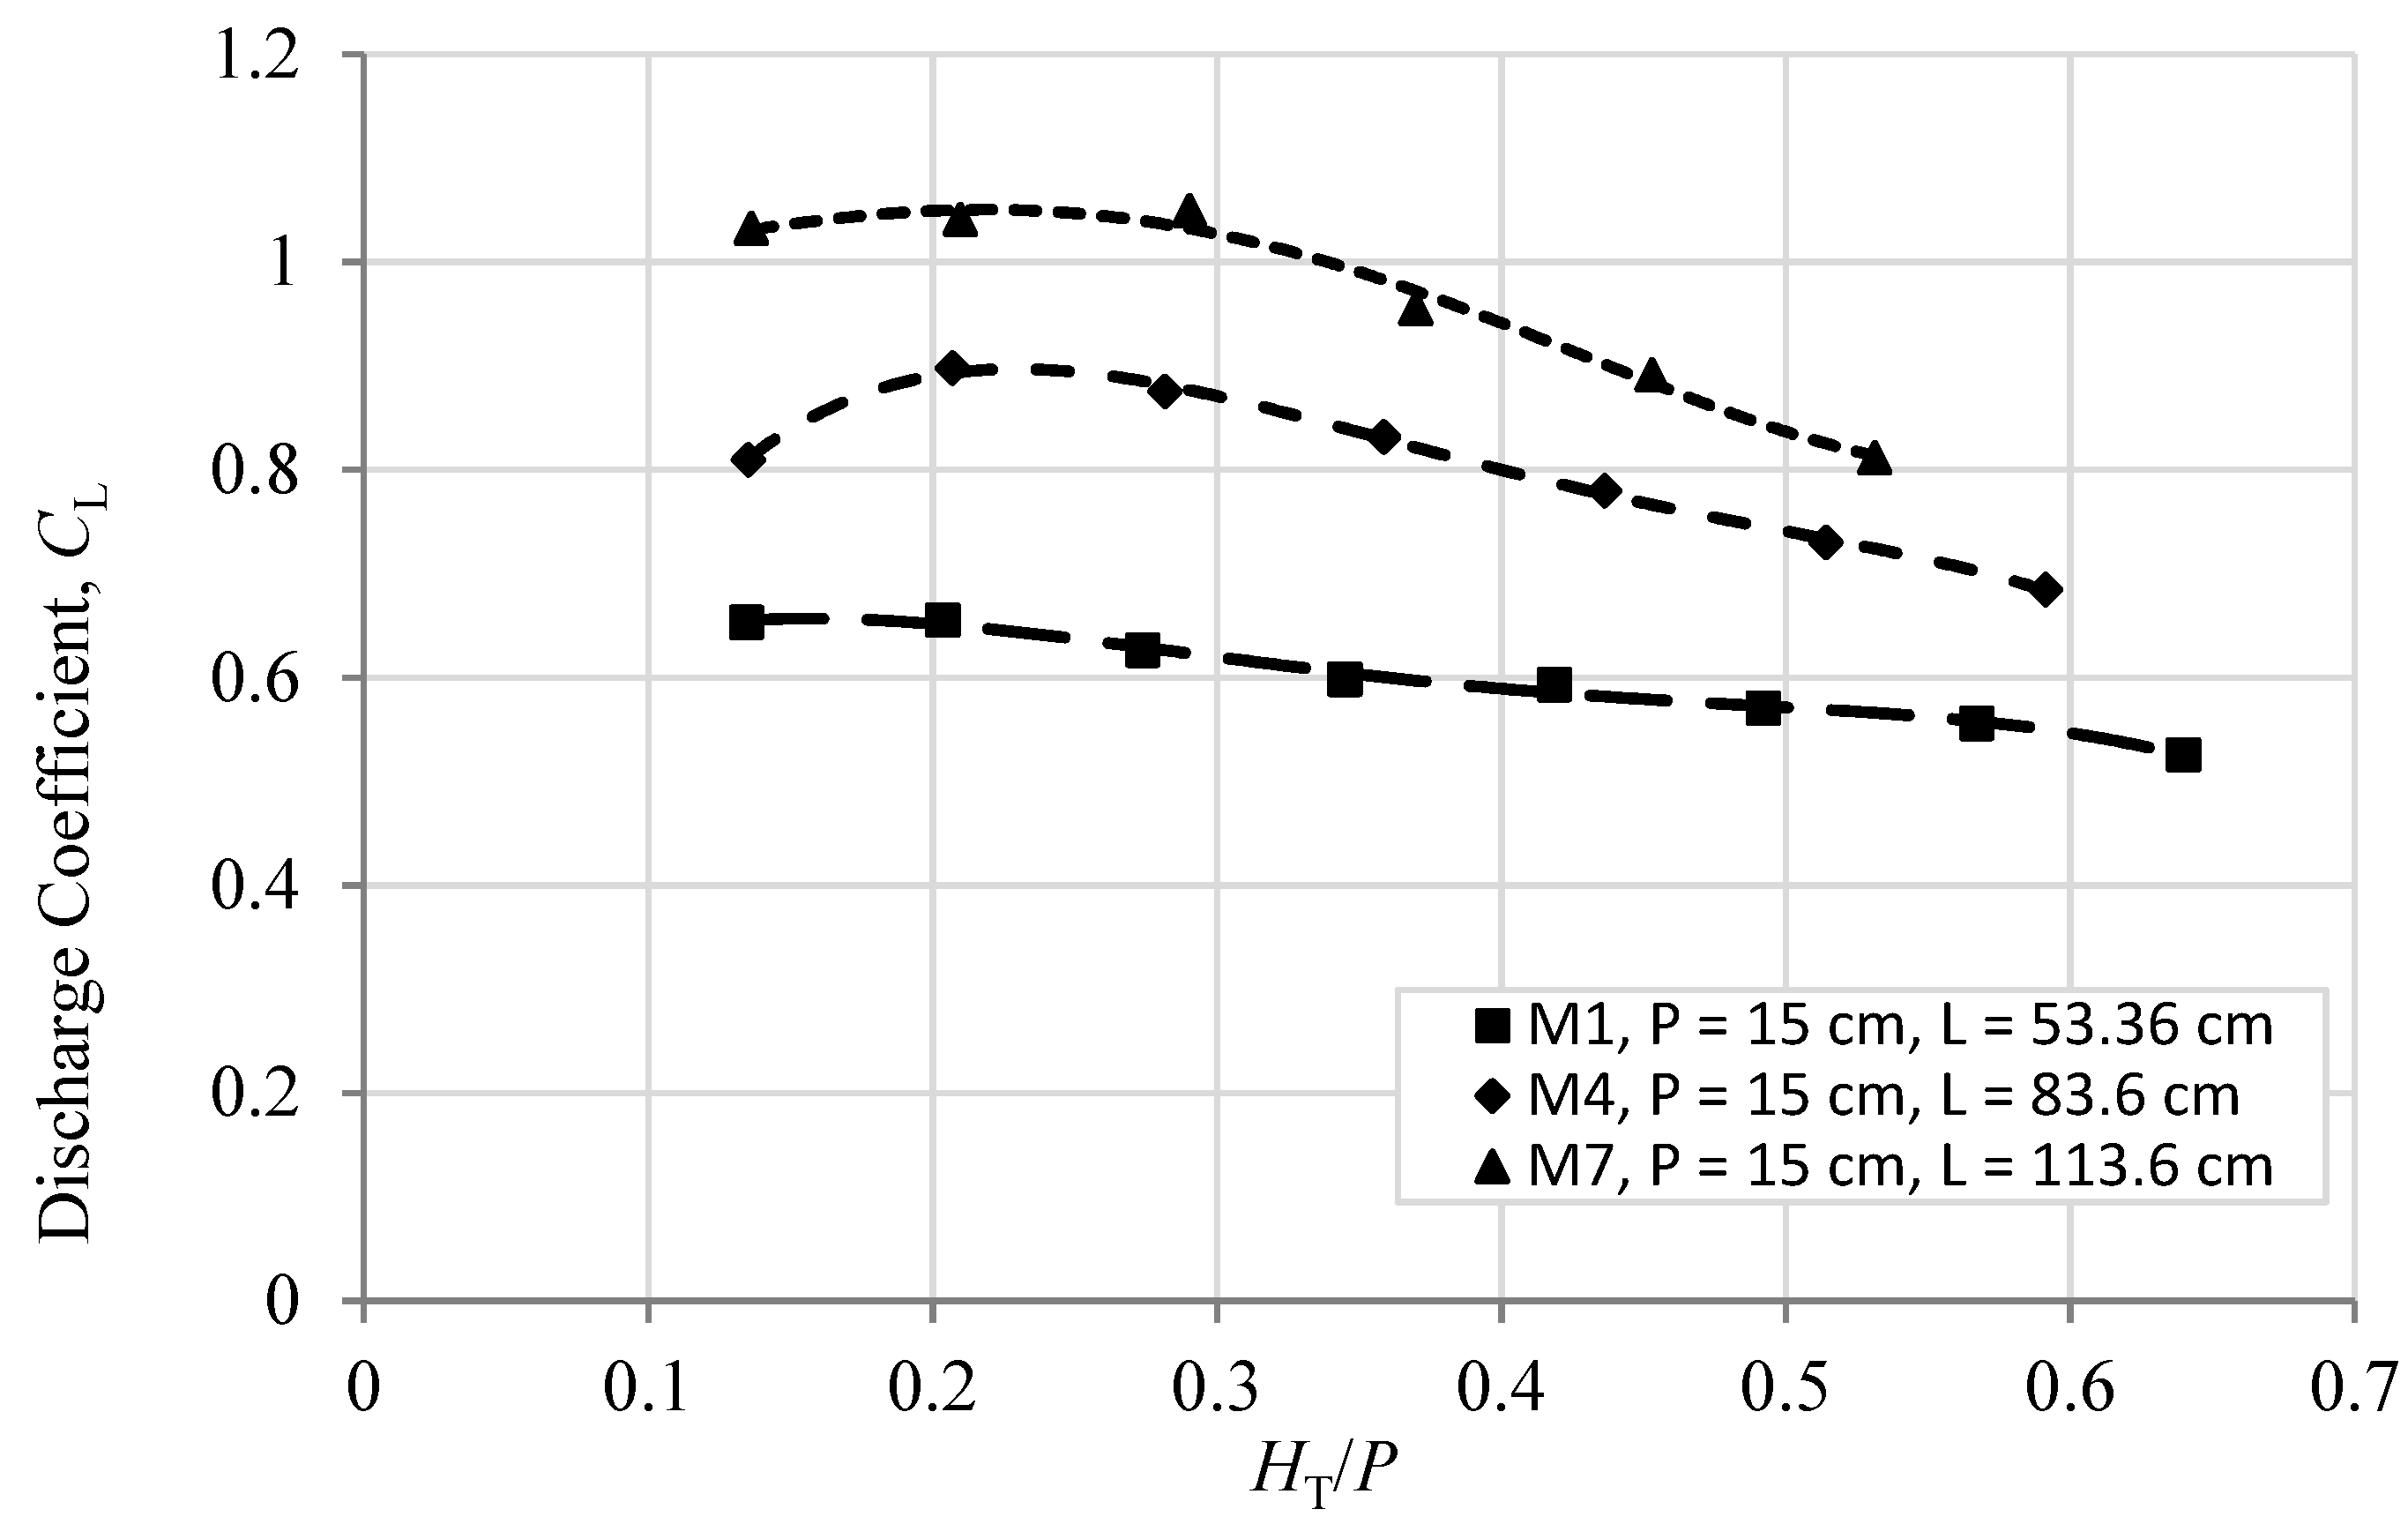
Figure 5, Figure 6, Figure 7, Figure 8, Figure 9, Figure 10, Figure 11, Figure 12 and Figure 13 show the values of the discharge coefficient (CL) for each model plotted against HT/P ratios to evaluate the hydraulic performance of the labyrinth weirs. The changes in CL values for HT/P ratios can be divided into two parts based on the figures for the range of HT/P from 0.08 to 0.65. The value of CL increases for modest discharges up to HT/P ≤ 0.1 to 0.22 (depending on the weir height and effective length), whereas it decreases after those values. The depth of flow over labyrinth weirs at which self-aeration ceases is the water depth at which the CL value begins to decline [5]. Headwater inflation, nappe interaction and interferences, or both, are responsible for the decrease in CL values [2,5]. The values of CL and the HT/P ratios are correlated using the 4th degree polynomial model, as illustrated below:
C L = a 0 + a 1 ( H T P ) + a 2 ( H T P ) 2 + a 3 ( H T P ) 3 + a 4 ( H T P ) 4  
Table 3 presents the values of the coefficient of the polynomial model, a0 to a5, as well as R2.

3.2. Effects of Weir Height on the Hydraulic Efficiency

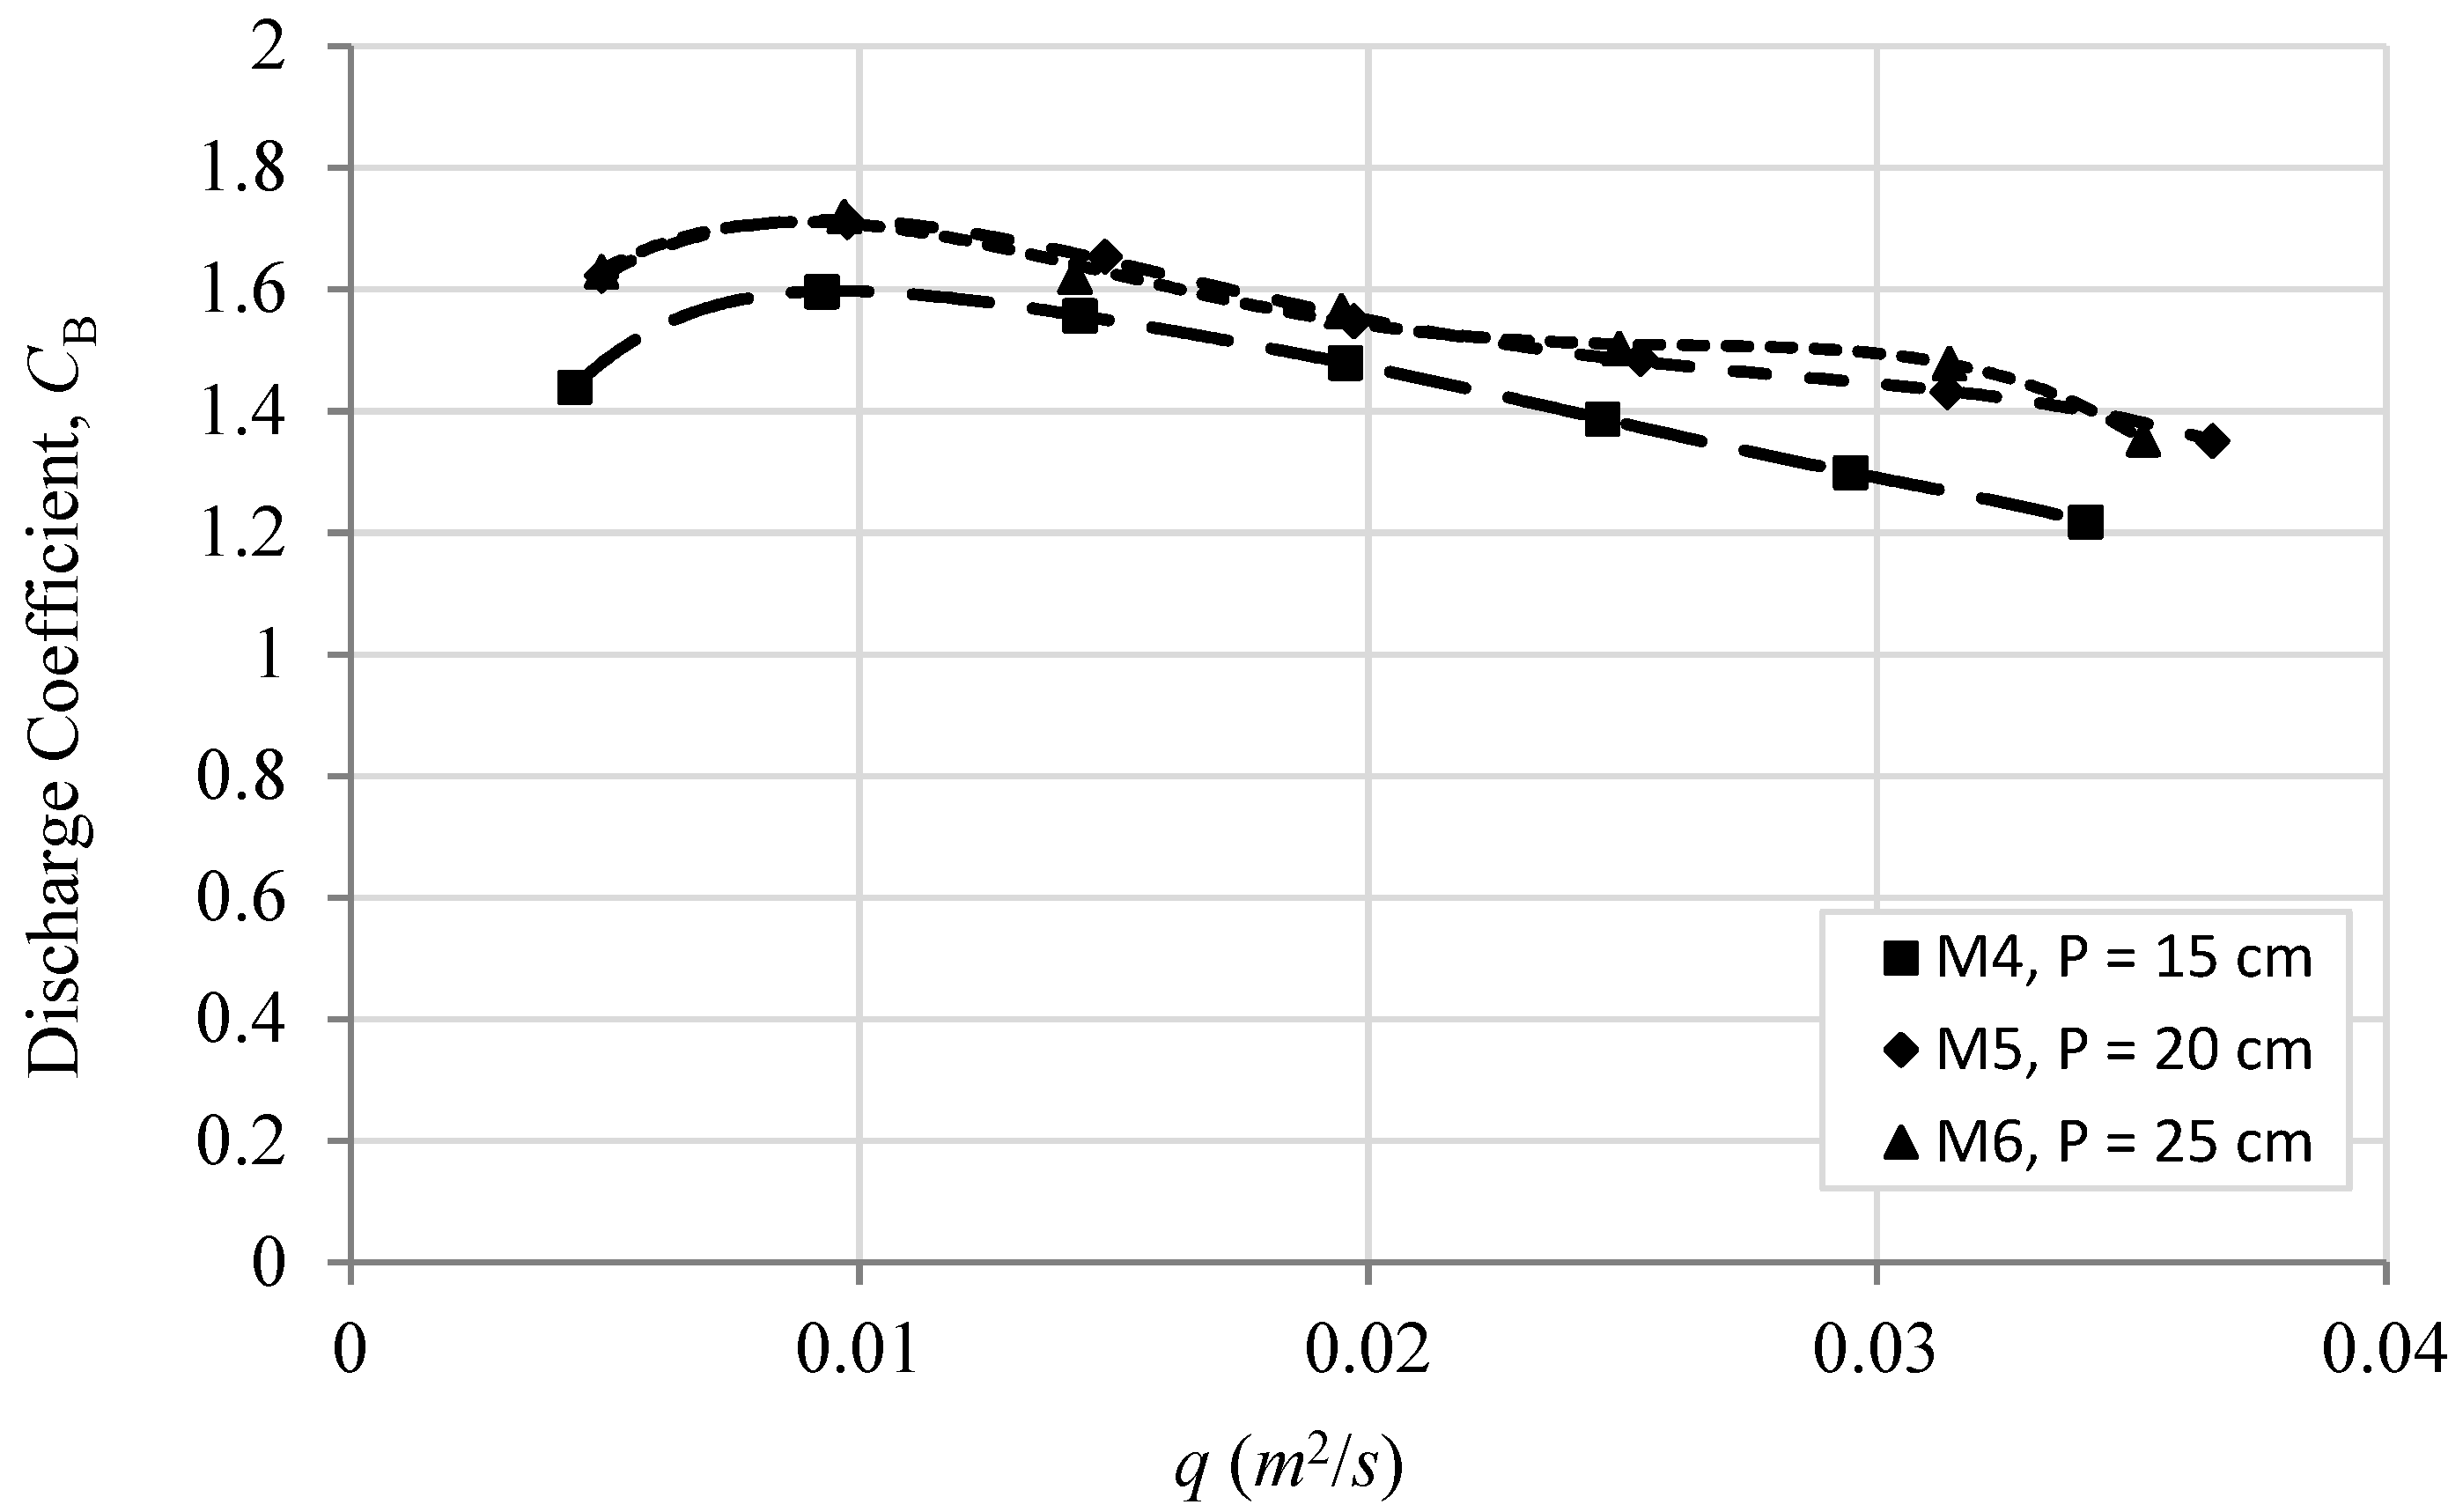
With increasing weir height (P), the hydraulic efficiency of rectangular labyrinth weirs with round corners improves; however, as demonstrated in Figure 14, the influence of weir height decreases for weirs with effective length of the weir crest to channel width ratios (LC/B) ≤ 1.78. In other words, for weirs with LC/B = 1.78 (M1, M2, and M3), the change in weir height, P, had no effect; comparable variations in CB values were seen for the three different weir heights, P = 15, 20, and 25 cm, respectively. As a result, the hydraulic efficiency of rectangular labyrinth weirs with LC/B ratios less than or equal to 1.78 is unaffected by weir height. As shown in Figure 15 and Figure 16 and Table 4, the values of CB for labyrinth weirs with LC/B ratios ≥ 2.79 were greater than those with lower heights; the CB values for weirs with P ≥ 200 mm were higher than those with P = 150 mm (LC/B ratios = 1.78). This is because longer rectangular labyrinth weirs have less headwater inflation and nappe interaction; for rectangular labyrinth weirs with LC/B ratios ≥ 2.79 and B/P ratios ≤ 1.5, the effects of nappe interaction and interferences are reduced due to the deeper downstream throat of the weirs, which leads to an increase in the weirs’ discharge capacity.
As the B/P ratio was reduced from 2 to 1.5, the CB values of the M5 and M6 models (relative to M4) increased by 9% on average, as shown in Figure 15 and Table 4. A similar pattern was seen for models M7, M8, and M9, as illustrated in Figure 16 and Table 4. The CB values of the M8 model (relative to M7) improved by 4.3 percent on average as the B/P ratio decreased from 2 to 1.5. The CB values of the M9 model (relative to the M7) increased by 8.3 percent on average as the B/P ratio declined from 2 to 1.2.

3.3. Effects of Weir Length on the Hydraulic Efficiency

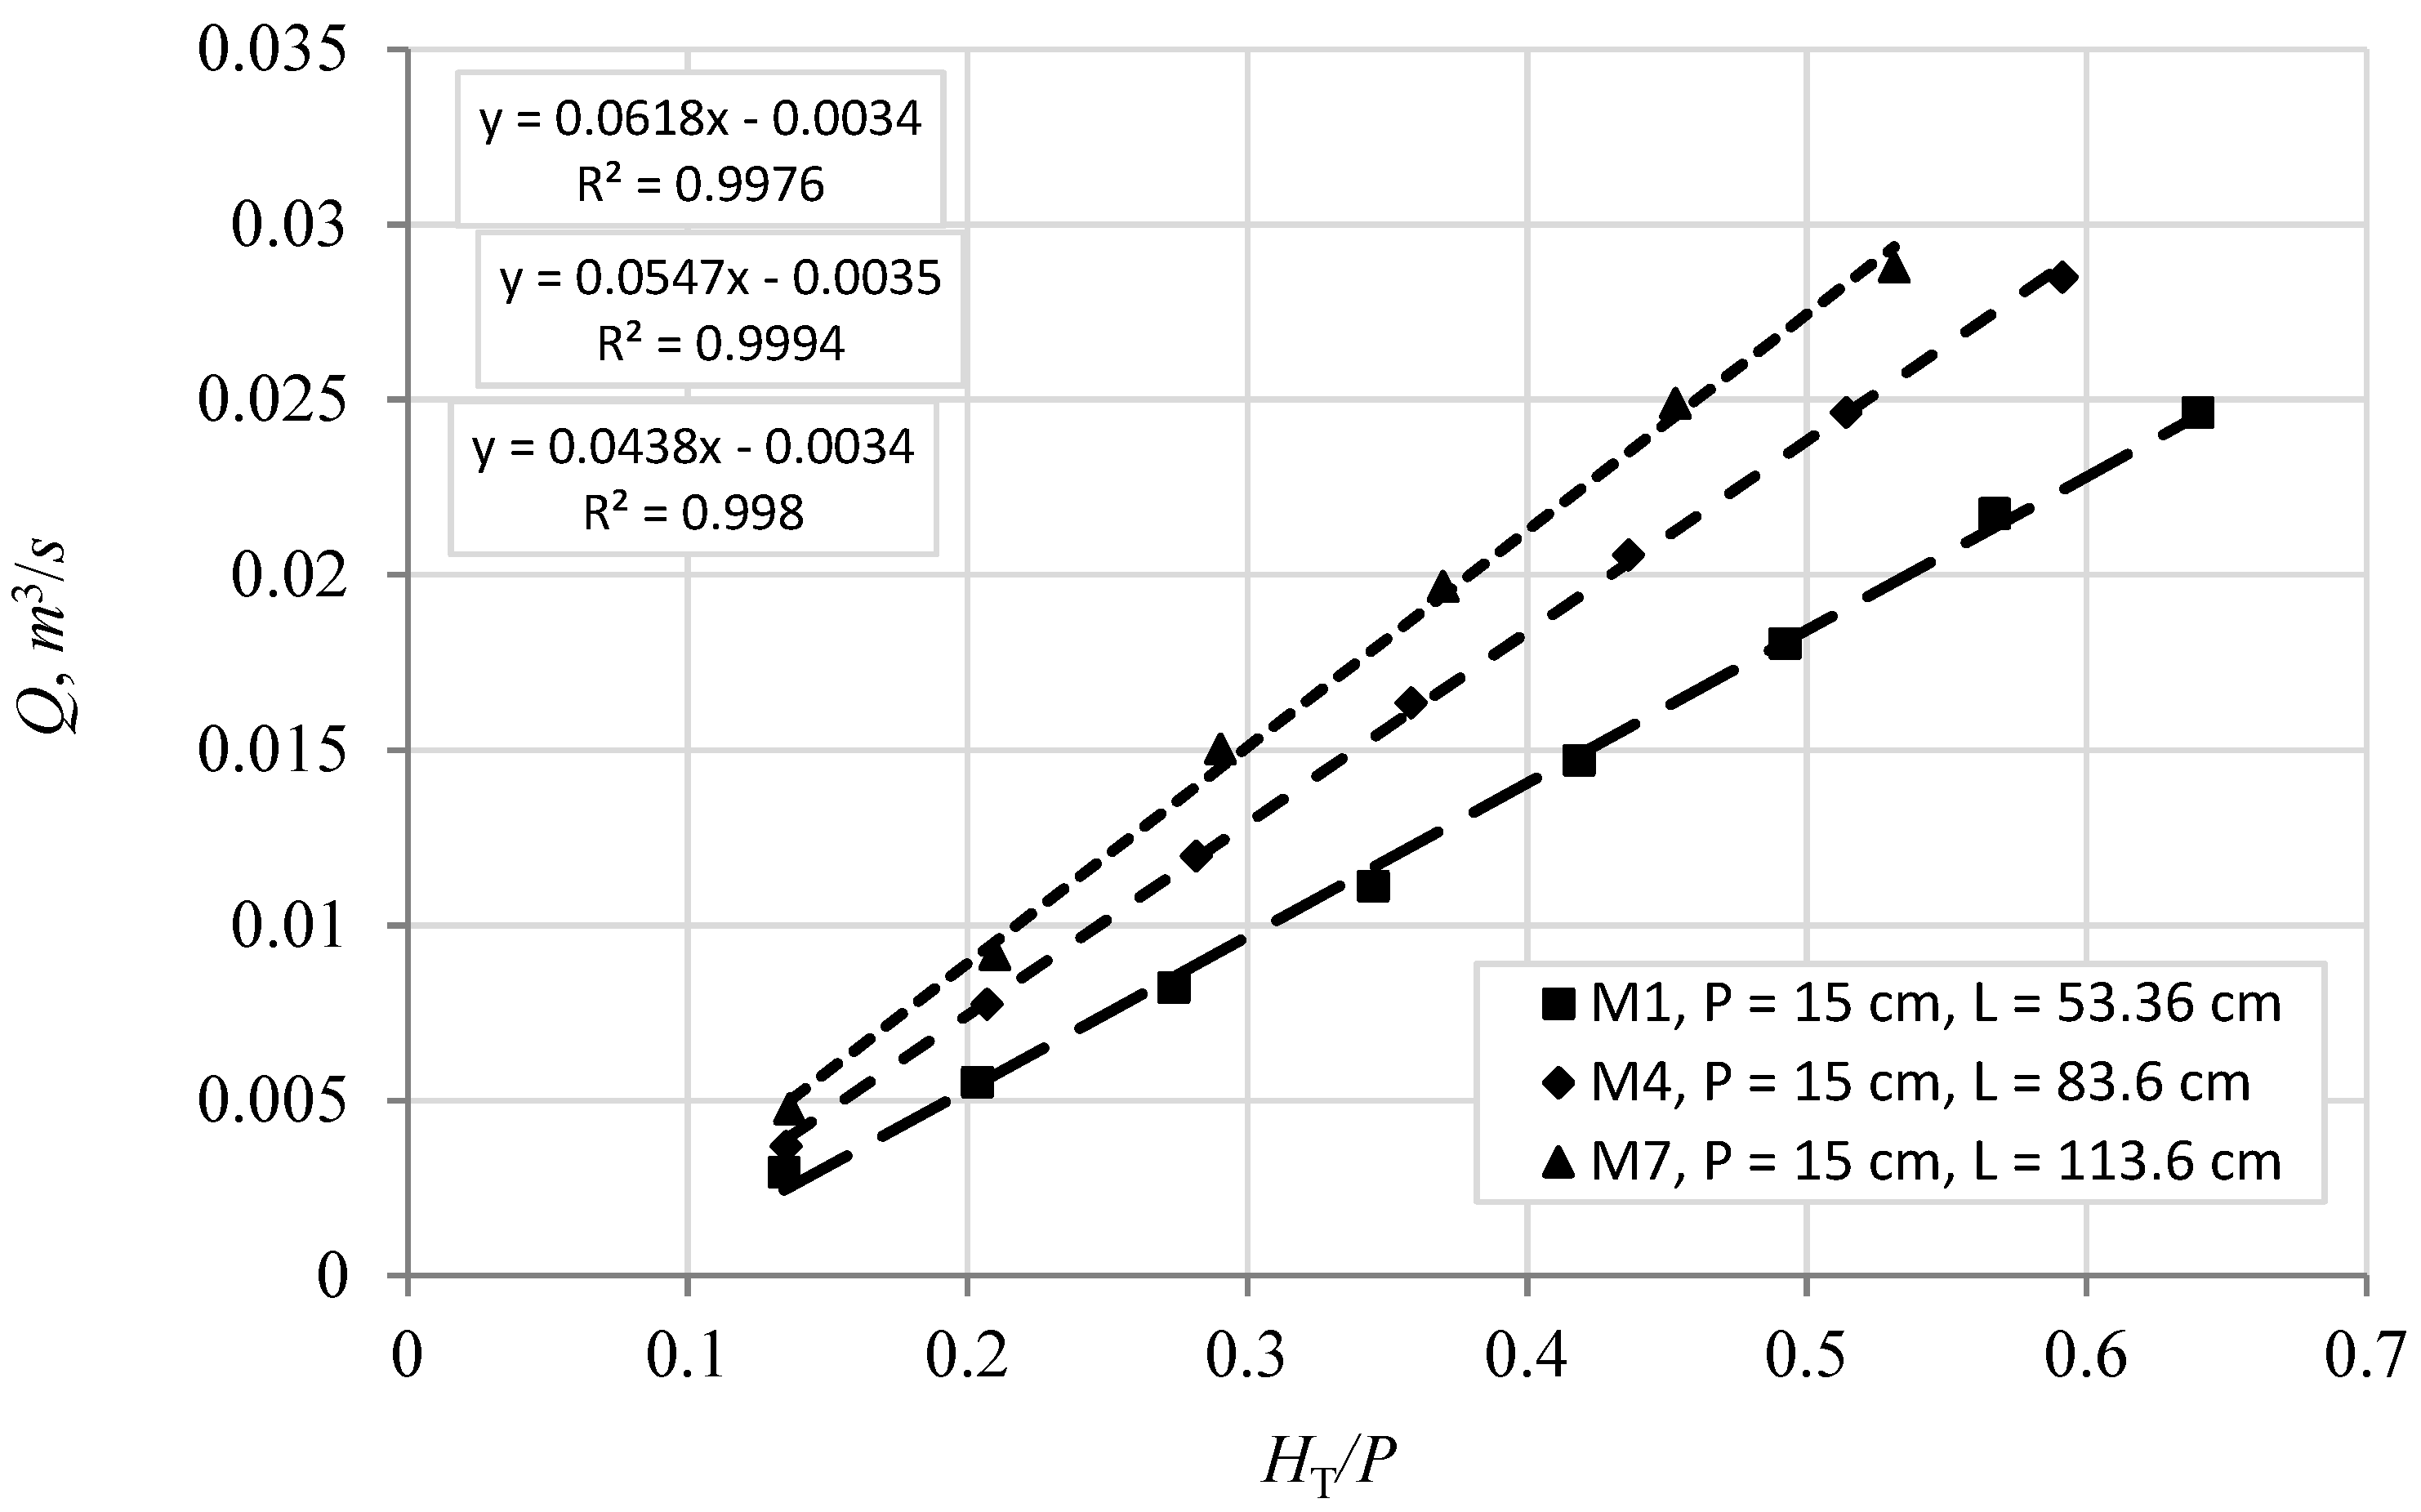
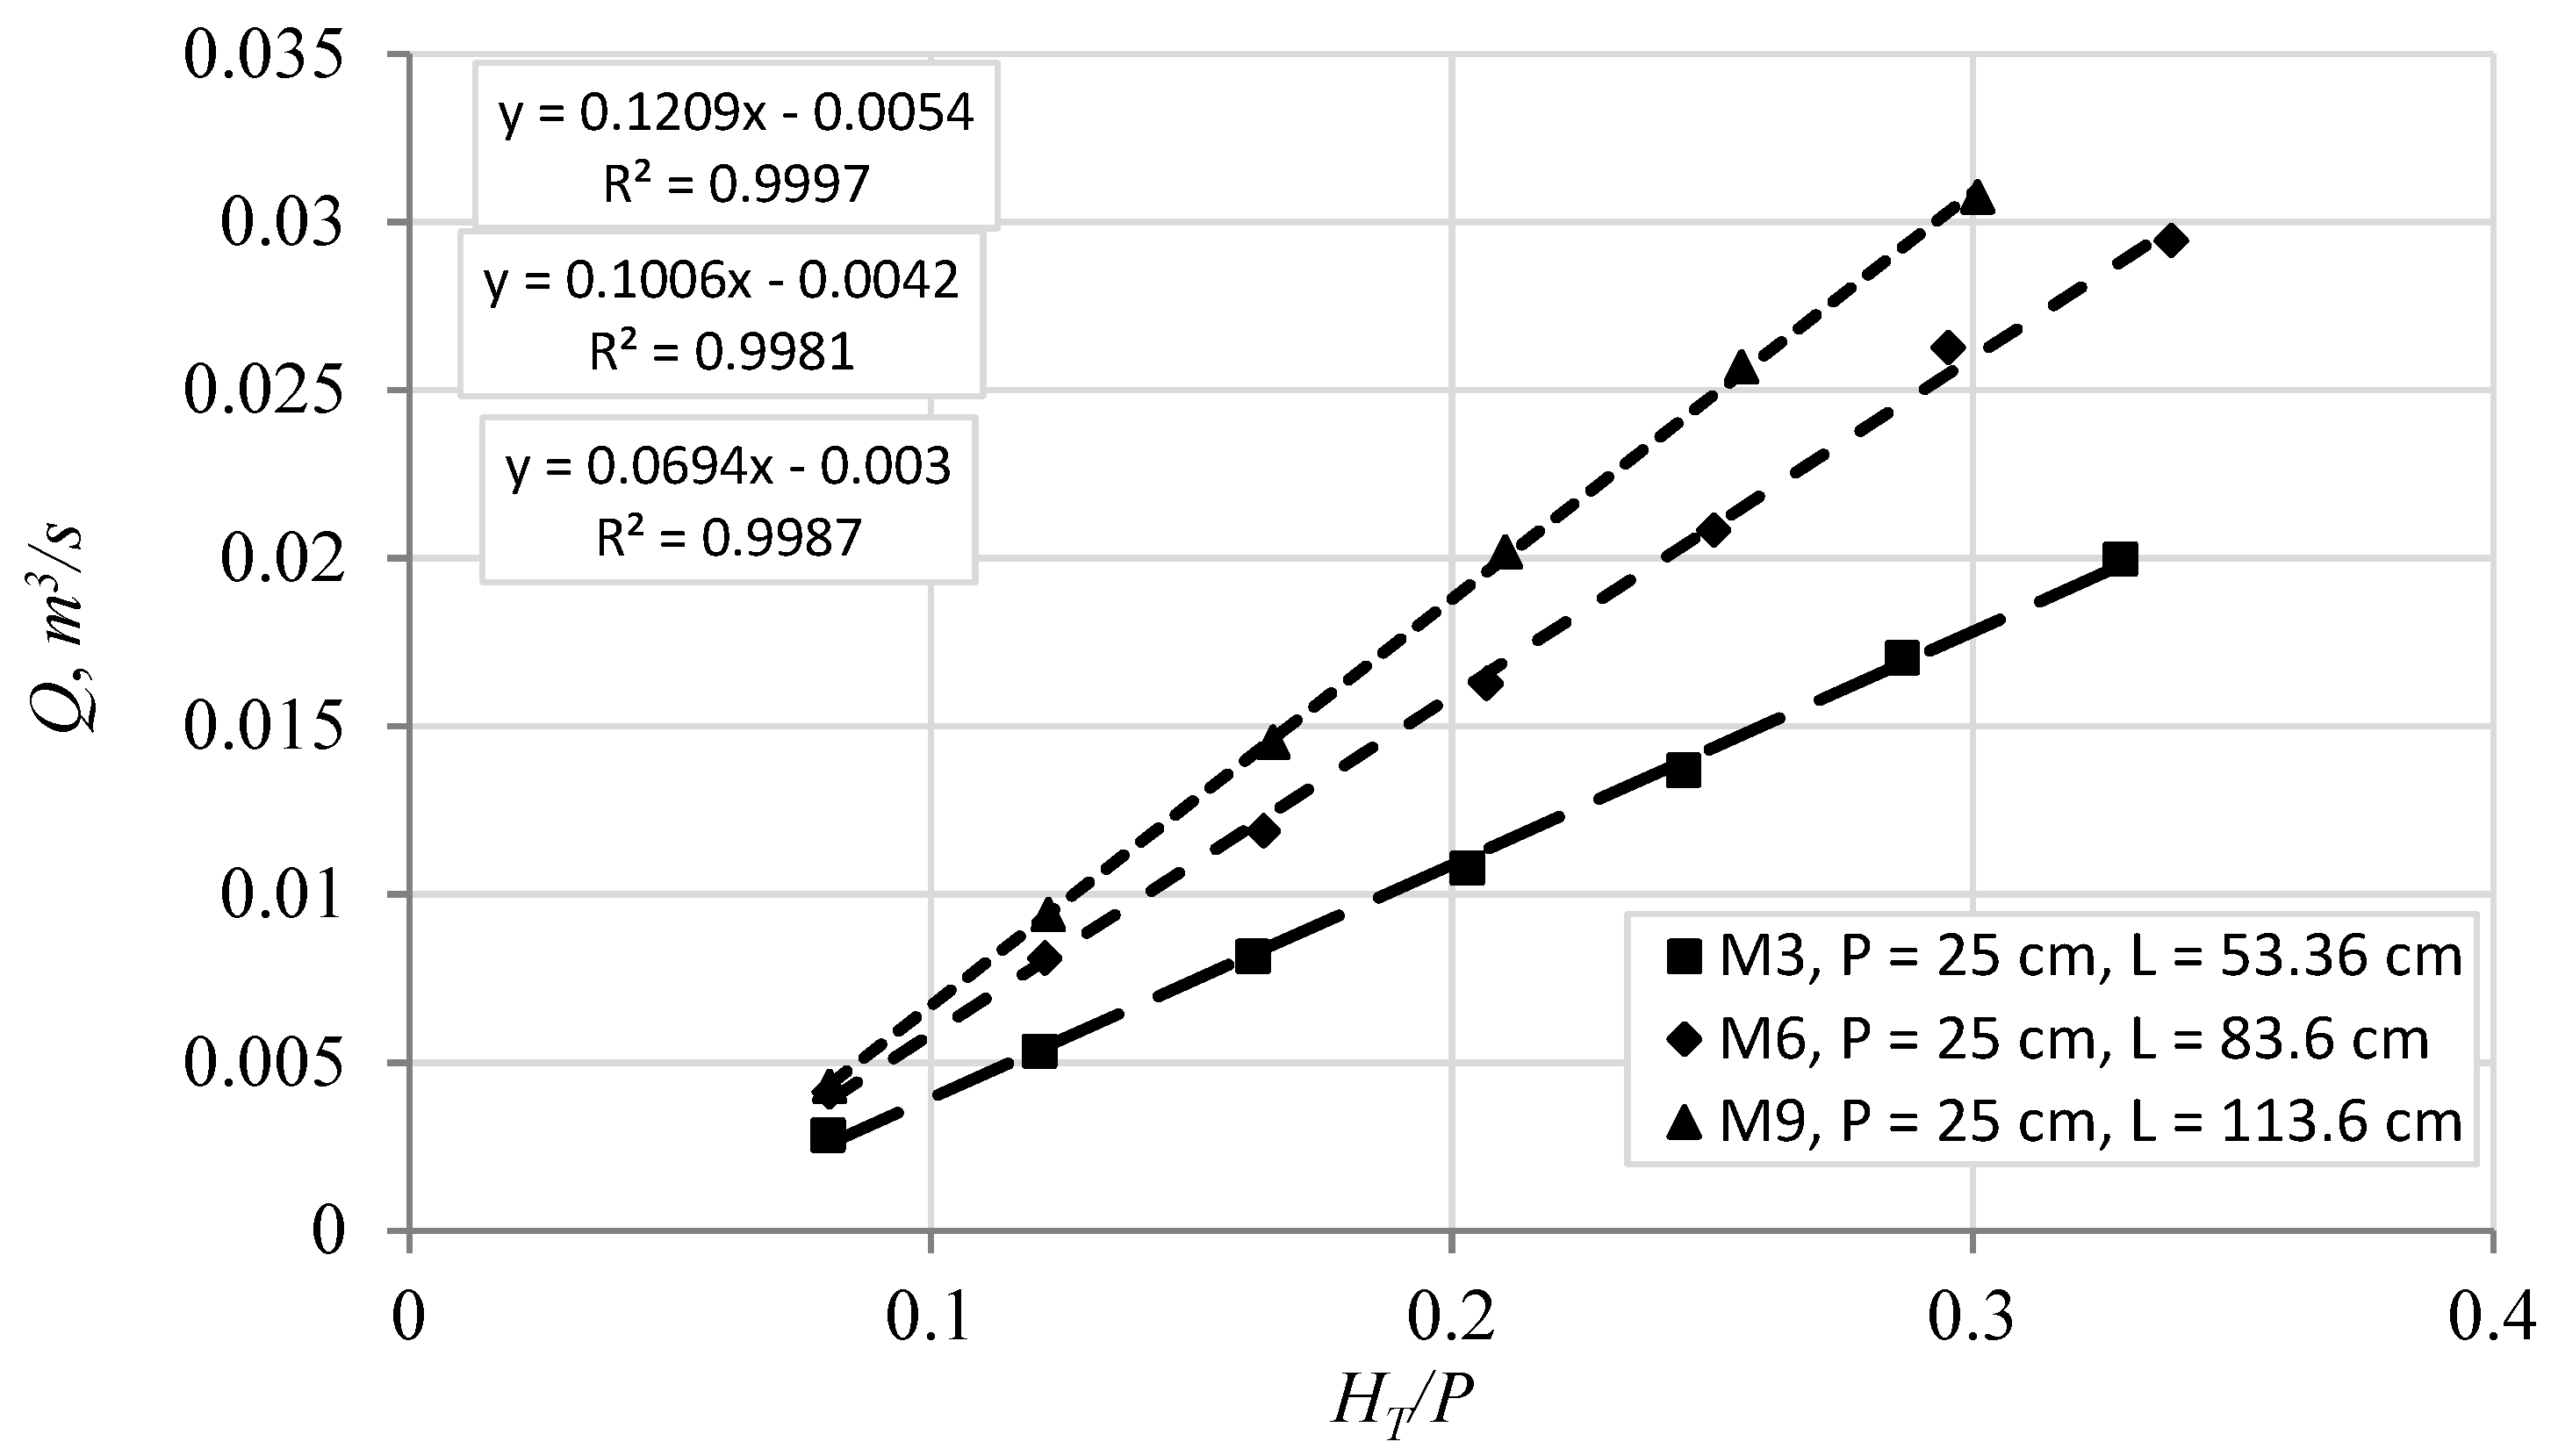
The rectangular labyrinth weirs with greater LC/B ratios (higher M values) showed higher hydraulic efficiency for the discharge rates utilized in this study, 0.003 ≤ Q ≤ 0.03 m3/s. Figure 17, Figure 18 and Figure 19 show that weirs with greater LC/B ratios (higher M values) gave higher total discharges, Q, with the same HT/P ratios. Table 5 shows that when the effective length of the weirs increased by 57%, the total discharge, Q, increased by 33% to 54%. When the effective length increased by 113 percent, the percentages grew to almost 80%. This was mainly because as the M value (LC/B ratio) increases, the discharge capacity also increases.
The coefficients of discharge, CL, of the labyrinth weirs with greater M values were higher than those of the labyrinth weirs with smaller M values (Figure 20, Figure 21 and Figure 22). In other words, the CL values for weirs with LC/B = M = 3.79 were greater than the CL values for weirs with M = 2.79 and M = 1.78 for the same weir height and HT/P ratios. The CL values for weirs with M = 2.79 were also greater than the CL values for weirs with M = 1.78. The consequences of headwater inflation may have been responsible for this. As the effective lengths of the labyrinth weirs, LC, increased, the effect of headwater inflation reduced; a longer weir produces less headwater inflation [2,5,15]. As a result, by increasing the effective length of rectangular labyrinth weirs and increasing the M values (LC/B ratios), the effects of headwater inflation of rectangular labyrinth weirs can be mitigated.
According to Figure 20 and Table 5, the CL values of the M4 model (relative to M1) increased by 34.2 percent on average when the M value increased from 1.78 to 2.79 (the effective length increased by 57 percent). While the M value increased from 1.78 to 3.79 as the effective length increased by 113 percent, the CL values of the M7 model (compared to M1) increased by 57.2 percent on average.
A similar pattern was seen for models M2, M5, and M8, as illustrated in Figure 21 and Table 5. The CL values of the M5 model (relative to M2) increased by 44.2 percent on average as the effective length increased by 57 percent. The CL values of the M8 model (relative to M2) increased by 84.7 percent on average as the effective length increased by 113 percent.
For models M3, M6, and M9, the CL values of the M6 model (relative to M3) increased by 46.6 percent on average as the effective length increased by 57 percent. The CL values of the M9 model (relative to the M3) increased by 69.1 percent on average while the effective length increased by 113 percent, as shown in Figure 22 and Table 5.

3.4. Regression Analysis

Because varied values of LC, P, and h resulted in different CB values in Figure 15, Figure 16, Figure 17, Figure 18, Figure 19, Figure 20, Figure 21 and Figure 22, there is a possibility that they are related. Accordingly, to find any probable correlation equations between discharge coefficients of round-cornered rectangular labyrinth weirs, CB, and other parameters such as effective length (LC), weir height (P), and water depth above the weir crest (h), the discharge coefficient was chosen as the dependent variable in the linear analysis model, with the other variables serving as independent variables. As shown below, a linear relationship is assumed for the depiction of the relationship between the variables:
C B = β 1 + β 2 ( L C B ) + β 3 ( P B ) + β 4 ( h B )  
where β1, β 2, β 3, and β 4 are the model constants.
Sixty-two experimental results were employed in the multiple linear regression analysis. Forty-four (44) experimental results were utilized to determine the model, while the remaining data (18 results) were used to evaluate the model. The following equation emerged from the multiple linear regression analysis:
C B = 0.553 + 0.333 ( L C B ) + 0.204 ( P B ) + 1.094 ( h B )  
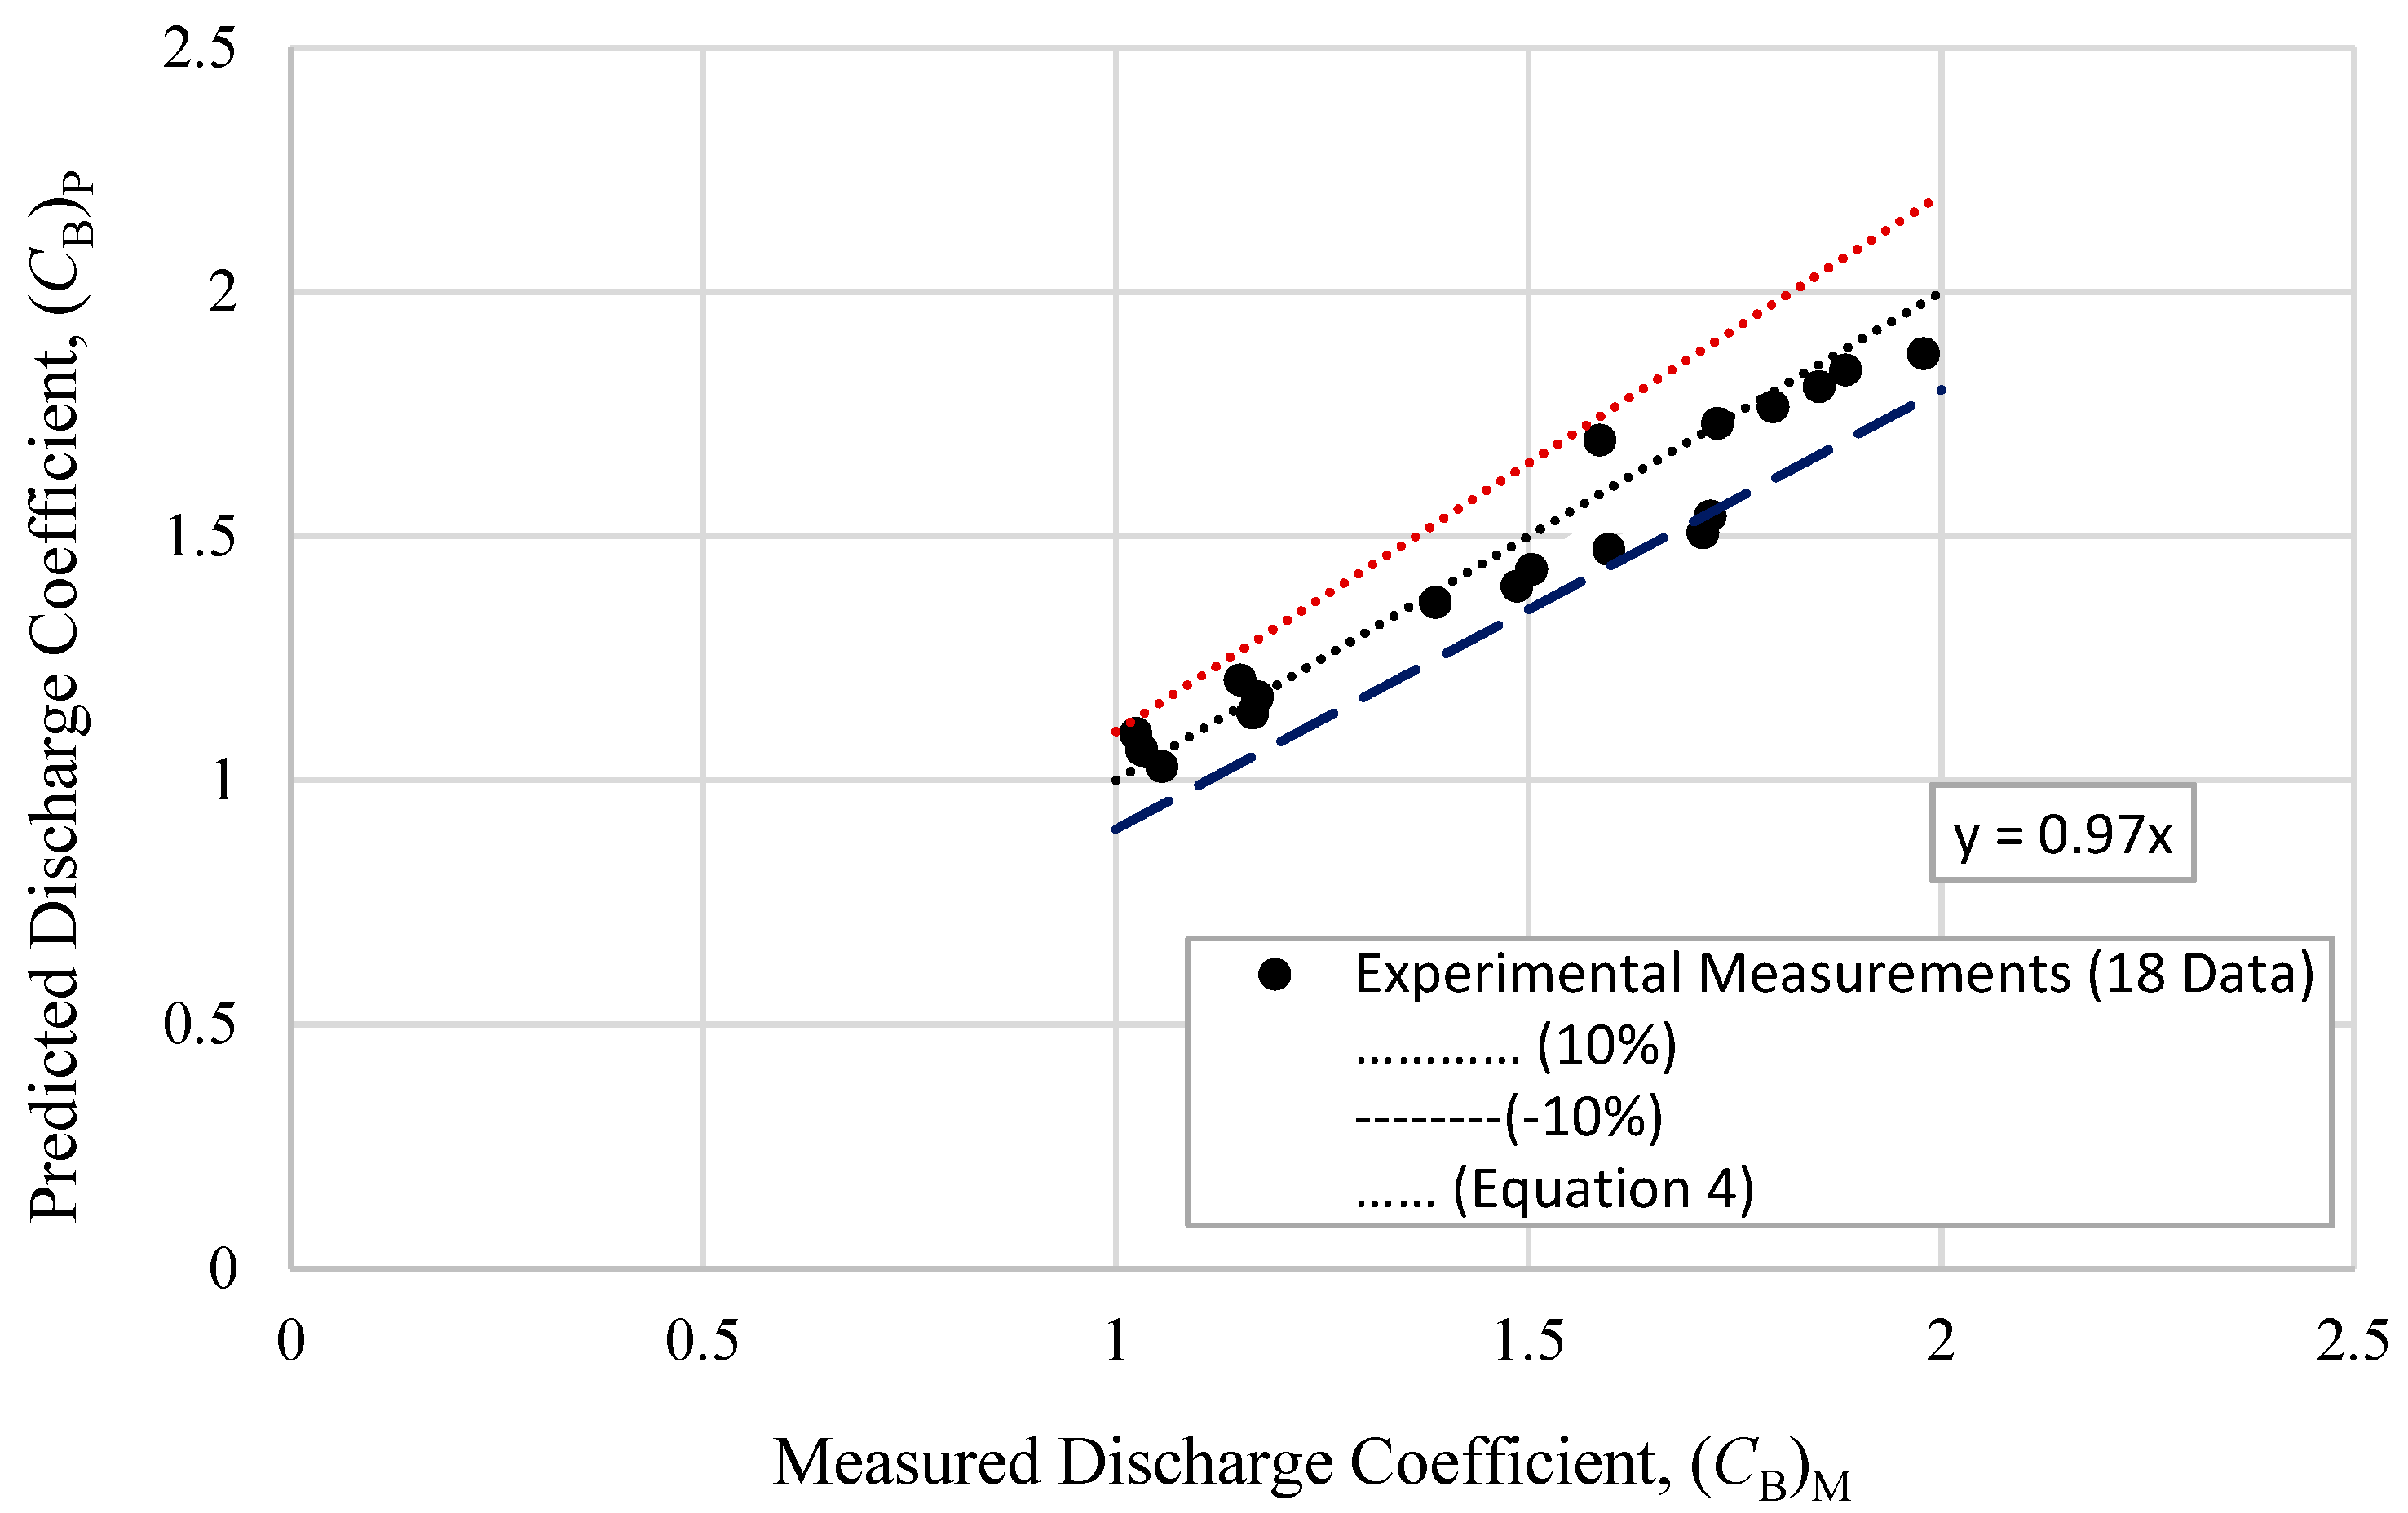
The root mean square errors (RMSE), mean absolute errors (MAE), mean relative error percentage (RE), and coefficient of determination (R2) for the multiple linear regression analysis were 0.8874, 0.03943, 4.75%, and 0.9187, respectively. Equation 4 was used to compare the observed discharge coefficients to the computed values in Figure 23. The measured values and the computed values from the proposed equation showed satisfactory agreement.

4. Conclusions

The hydraulic performance of the flow over round-cornered rectangular labyrinth weirs was investigated experimentally by varying the effective length and weir heights. In a prismatic flume, nine models were erected and tested. Next, the discharge coefficients for the nine models were calculated for various overflow discharges. The following conclusions can be drawn:
  • For round-cornered rectangular labyrinth weirs, the discharge coefficient, CL, increases as the HT/P ratios increase until a certain value of HT/P is reached, after which CL values decrease steadily;
  • Round-cornered rectangular labyrinth weirs with greater LC/B ratios (higher M values) showed higher hydraulic efficiency for the HT/P ranges utilized in this study, 0.1 ≤ HT/P ≤ 0.65. The discharge coefficient increased by 35.7 percent on average as the effective length increased by 57 percent. On average, the discharge coefficient increased by 70% while the effective length increased by 113 percent;
  • As the weir height (P) increases, the hydraulic efficiency of round-cornered rectangular labyrinth weirs increases marginally. For the effective length of the weir to the channel width ratios (LC/B) ≤ 1.78, however, the influence of weir height diminishes;
  • One should increase the weir height or effective length to lessen the influence of headwater inflation and nappe interferences of flows across round-cornered rectangular labyrinth weirs;
  • Using multiple linear regression analysis, a satisfactory correlation equation was found between discharge coefficients of round-cornered rectangular labyrinth weirs, CB, and the other parameters, namely the effective length (LC), weir height (P), and water depth over the weir crest (h).

Author Contributions

Conceptualization, O.S.Q.Y. and M.K.; methodology, W.Q., A.S.A., O.S.Q.Y. and K.Z.A.; data curation, O.S.Q.Y., W.Q. and A.S.A.; writing—original draft preparation, O.S.Q.Y.; writing—review and editing, M.K., K.Z.A., W.Q. and A.S.A.; supervision, O.S.Q.Y. and M.K.; All authors have read and agreed to the published version of the manuscript.

Funding

This research received no external funding.

Institutional Review Board Statement

Not Applicable.

Informed Consent Statement

Not Applicable.

Data Availability Statement

All data that support the findings of this study are available from the corresponding author upon reasonable request.

Acknowledgments

The tests were carried out in the Hydraulic Laboratory of the College of Engineering at the University of Sulaimani. Hiwa Karim Saeed and Goran Jalal Jamal provided help during the experimental work.

Conflicts of Interest

The authors declare no conflict of interest.

References

  1. Bilhan, O.; Emiroglu, M.; Miller, C. Experimental Investigation of Discharge Capacity of Labyrinth Weirs with and without Nappe Breakers. World J. Mech. 2016, 6, 207–221. [Google Scholar] [CrossRef] [Green Version]
  2. Crookston, B.M.; Tullis, B.P. Labyrinth weirs: Nappe interference and local submergence. J. Irrig. Drain Eng. 2012, 138, 757–765. [Google Scholar] [CrossRef]
  3. Tullis, P.; Amanian, N.; Waldron, D. Design of labyrinth spillways. J. Hydraul. Eng. 1995, 121, 247–255. [Google Scholar] [CrossRef]
  4. Taylor, G. The Performance of Labyrinth Weirs. Ph.D. Thesis, University of Nottingham, Nottingham, UK, 1968. [Google Scholar]
  5. Azimi, A.H.; Hakim, S.S. Hydraulics of flow over rectangular labyrinth weirs. Irrig. Sci. 2019, 37, 183–193. [Google Scholar] [CrossRef]
  6. Jansen, R.B. Advanced dam Engineering for Design, Construction, and Rehabilitation; Springer Science & Business Media: Berlin/Heidelberg, Germany, 1988. [Google Scholar]
  7. Safarrazavi Zadeh, M.; Esmaeili Varaki, M.; Biabani, R. Experimental study on flow over sinusoidal and semicircular labyrinth weirs. ISH J. Hydraul. Eng. 2019, 1–10. [Google Scholar] [CrossRef]
  8. Crookston, B.M. Labyrinth Weirs. Ph.D. Dissertation, Utah State University, Logan, UT, USA, 2010. [Google Scholar]
  9. Anderson, R.M.; Tullis, B.P. Comparison of piano key and rectangular labyrinth weir hydraulics. J. Hydraul. Eng. 2012, 138, 358–361. [Google Scholar] [CrossRef]
  10. Kabiri-Samani, A.; Javaheri, A.; Borghei, S.M. Discharge coefficient of a rectangular labyrinth weir. ICE’s Water Manag. 2013, 166, 443–451. [Google Scholar] [CrossRef]
  11. Henderson, F.M. Open Channel Flow (No. 532 H4); Macmillan: New York, NY, USA, 1966. [Google Scholar]
  12. Rostami, H.; Heidarnejad, M.; Purmohammadi, M.H.; Kamanbedast, A.; Bordbr, A. An Experimental study into discharge coefficient of labyrinth weirs with rectangular-shaped plans. Fresen. Environ. Bull. 2016, 25, 5138–5144. [Google Scholar]
  13. Emadi, A.R.; Rezaei, M. Experimental study of rectangular labyrinth weirs. J. Water Soil (Agric. Sci. Technol.) 2015, 29, 1438–1446. [Google Scholar]
  14. Heidarour, M.; Mousavi, S.F.; Zarmehri, A.R. Investigation of rectangular and U-shaped labyrinth weirs. JWSS-Isfahan Univ. Technol. 2006, 10, 519–531. [Google Scholar]
  15. Yousif, O.S.; Karakouzian, M. Effect of Corner Shape on Hydraulic Performance of One-Cycle Rectangular Labyrinth Weirs. Fluids 2020, 5, 117. [Google Scholar] [CrossRef]
Figure 1. Isometric view of round-cornered rectangular labyrinth weir and definition of the main symbols.
Hydrology 08 00158 g001
Figure 2. Armfield S6−MKII laboratory flow channel.
Hydrology 08 00158 g002
Figure 3. Illustrative chart of the flow over the rectangular labyrinth weirs.
Hydrology 08 00158 g003
Figure 4. Photographs of the models, h = 70 mm.
Hydrology 08 00158 g004
Figure 5. Variations in the discharge coefficient, CL, as a function of the HT/P ratio for the M1 model.
Hydrology 08 00158 g005
Figure 6. Variations in the discharge coefficient, CL, as a function of the HT/P ratio for the M2 model.
Hydrology 08 00158 g006
Figure 7. Variations in the discharge coefficient, CL, as a function of the HT/P ratio for the M3 model.
Hydrology 08 00158 g007
Figure 8. Variations in the discharge coefficient, CL, as a function of the HT/P ratio for the M4 model.
Hydrology 08 00158 g008
Figure 9. Variations in the discharge coefficient, CL, as a function of the HT/P ratio for the M5 model.
Hydrology 08 00158 g009
Figure 10. Variations in the discharge coefficient, CL, as a function of the HT/P ratio for the M6 model.
Hydrology 08 00158 g010
Figure 11. Variations in the discharge coefficient, CL, as a function of the HT/P ratio for the M7 model.
Hydrology 08 00158 g011
Figure 12. Variations in the discharge coefficient, CL, as a function of the HT/P ratio for the M8 model.
Hydrology 08 00158 g012
Figure 13. Variations in the discharge coefficient, CL, as a function of the HT/P ratio for the M9 model.
Hydrology 08 00158 g013
Figure 14. Discharge coefficient, CB, vs. unit discharge, q, for models M1, M2, and M3.
Hydrology 08 00158 g014
Figure 15. Discharge coefficient, CB, vs. unit discharge, q, for models M4, M5, and M6.
Hydrology 08 00158 g015
Figure 16. Discharge coefficient, CB, vs. unit discharge, q, for models M7, M8, and M9.
Hydrology 08 00158 g016
Figure 17. Total discharge, Q, vs. HT/P for models M1, M4, and M7.
Hydrology 08 00158 g017
Figure 18. Total discharge, Q, vs. HT/P for models M2, M5, and M8.
Hydrology 08 00158 g018
Figure 19. Total discharge, Q, vs. HT/P for models M3, M6, and M9.
Hydrology 08 00158 g019
Figure 20. Discharge coefficient, CL, vs. HT/P for models M1, M4, and M7.
Hydrology 08 00158 g020
Figure 21. Discharge coefficient, CL, vs. HT/P for models M2, M5, and M8.
Hydrology 08 00158 g021
Figure 22. Discharge coefficient, CL, vs. HT/P for models M3, M6, and M9.
Hydrology 08 00158 g022
Figure 23. Measured vs. Calculated Discharge Coefficients (CB) for all models.
Hydrology 08 00158 g023
Table 1. Characteristics of the weir models.
ModelB (mm)b (mm)l (mm)t (mm)C1 (mm)C2 (mm)P (mm)LC * (mm)LC/BB/P
M1300150751042.532.5150533.61.782.0
M2300150751042.532.5200533.61.781.5
M3300150751042.532.5250533.61.781.2
M43001502251042.532.52008362.792.0
M53001502251042.532.52008362.791.5
M63001502251042.532.52008362.791.2
M73001503751042.532.525011363.792.0
M83001503751042.532.525011363.791.5
M93001503751042.532.525011363.791.2
* The effective length (centerline length) of the weir.
Table 2. Details of the experimental runs.
ModelQ, m3/sh, m(HT/P) *
M10.00295–0.02460.02–0.090.1345–0.639
M20.00296–0.02390.02–0.090.1005–0.4693
M30.00285–0.01990.02–0.080.0803–0.3283
M40.00368–0.02850.02–0.080.1351–0.5913
M50.00412–0.03050.02–0.080.101–0.4338
M60.00412–0.02940.02–0.080.805–0.338
M70.00475–0.02870.02–0.070.1363–0.5313
M80.00421–0.03050.02–0.070.101–0.3863
M90.00429–0.03070.02–0.070.0806–0.3009
* P = weir height; HT = total head over the weir measured at a distance ≥ 5h, see Figure 3.
Table 3. Coefficients and R2 values of the polynomial models.
Modela0a1a2a3a4R2
M10.52572.0505−10.4819.409−12.5660.991
M20.59531.1898−6.2026.80720.78420.9954
M30.33287.3478−57.45176−192.840.992
M40.11889.0016−35.87457.483−33.5270.9975
M50.230112.801−76.787183.44−156.70.9992
M60.119519.614−158.05513.9−595.850.9926
M70.97290.1194.778−21.41920.5960.9839
M8−0.071117.962−102.55251.25−231.10.9728
M9−0.514133.727−249.88786.4913.580.9924
Table 4. Changes in the CB values due to the weir height.
ParametersPercentage Changes
M5/M4M6/M4M8/M7M9/M7
Weir Length to Channel Width ratios, LC/B2.792.793.793.79
Coefficient of Discharge (CB)5.3–124.45–13.50.0–13.60.0–18
(8.8) *(9.4) *(4.3) *(8.3) *
* Average values.
Table 5. Changes in the total discharge and discharge coefficient due to the effective length.
ParametersPercentage Changes
M4/M1M7/M1M5/M2M8/M2M6/M3M9/M3
Length ratios LC/LC1.5672.1291.5672.1291.5672.129
Total Discharge (Q)28.5–48.447.8–85.255–4462.1–66.448–70.976–89.7
(33.6) *(57.5) *(46.9) *(65.3) *(53.7) *(79.5) *
Coefficient of Discharge (CL)26.8–40.543–65.738.1–46.762.3–96.344.2–48.849.6–77.1
(34.2) *(57.2) *(44.2) *(84.7) *(46.6) *(69.1) *
* Average values.
Publisher’s Note: MDPI stays neutral with regard to jurisdictional claims in published maps and institutional affiliations.