
Evaluation of Evaporation from Water Reservoirs in Local Conditions at Czech Republic

 , , , and
Abstract
1. Introduction
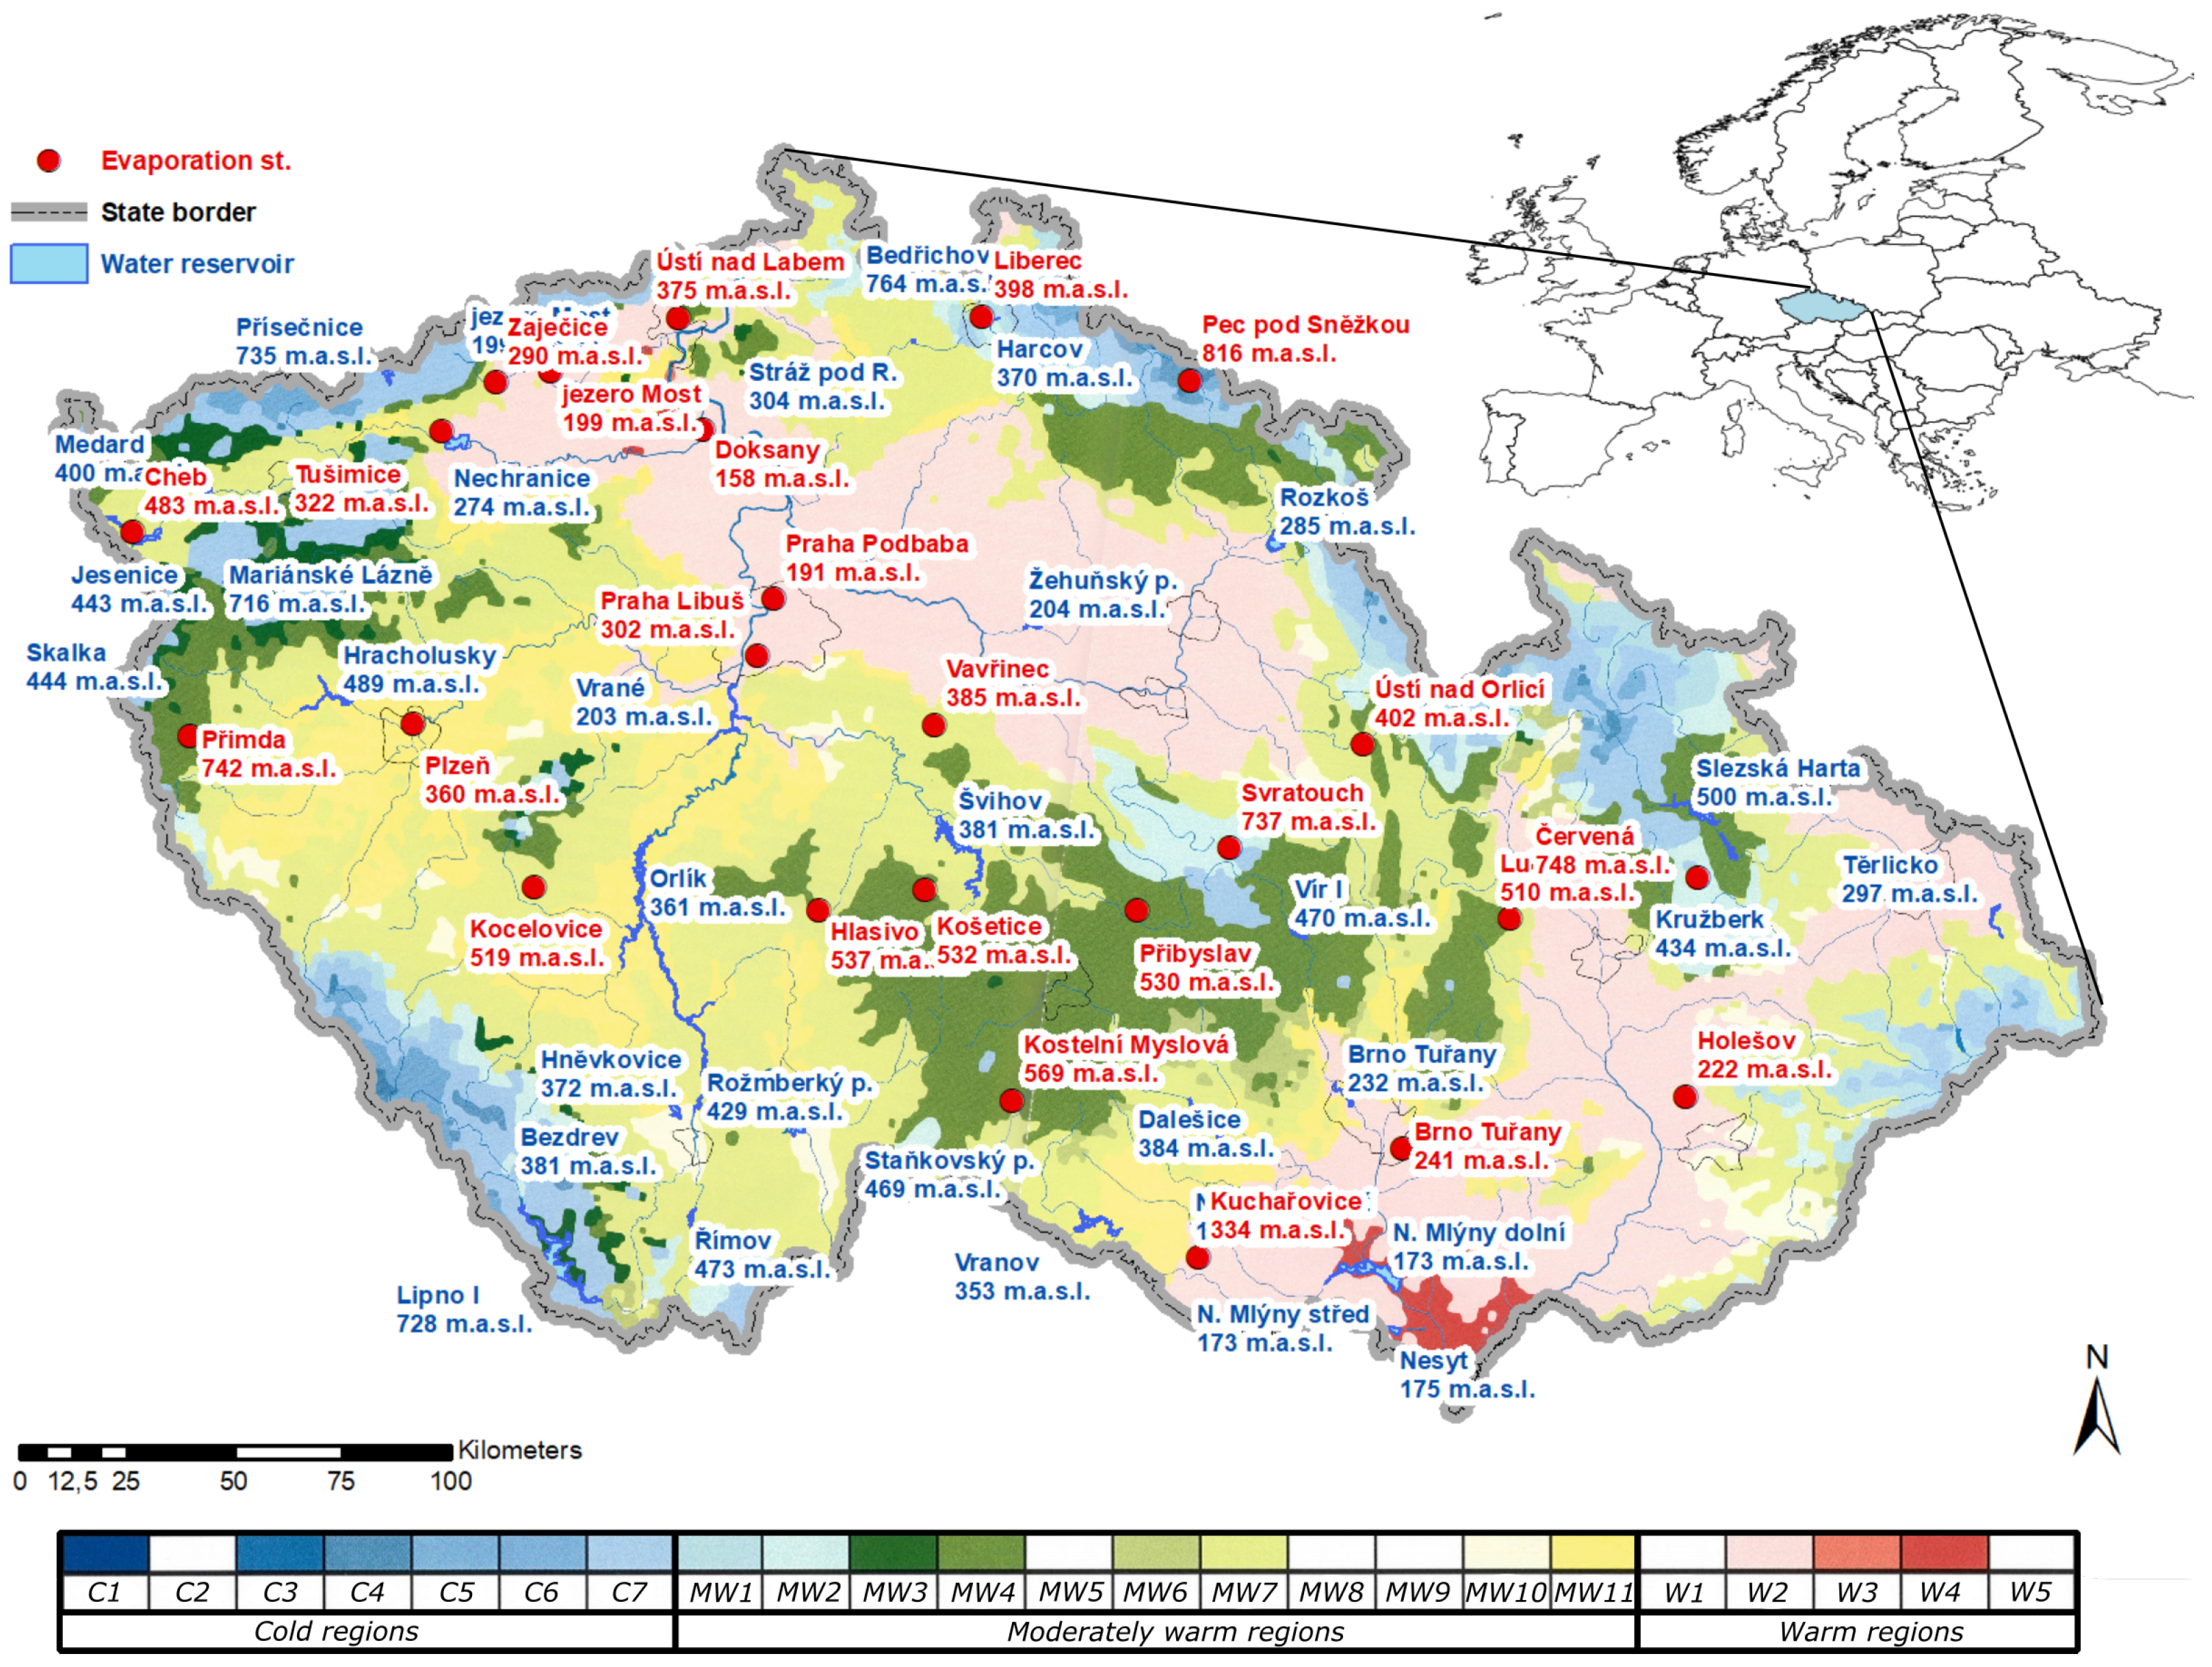
2. Study Area and Data
Climate Reanalysis
3. Methods
3.1. Linear Regression
- leapBackward,
- leapForward,
- leapSeq.
3.2. Random Forest Regression
3.3. Evaluation of Regression
3.4. Evaluation of Regression by Goodness-of-Fit (GOF)
- (i)
- The is given by:where is the residual sum of squares and the total sum of squares from predicted evaporation values and of tested data of cross validation .
- indicates a measure of the quality of the regression model and explains the proportion of variability in the dependent variable of the model , it may attain maximum value of 1, which means perfect prediction of the dependent variable. Conversely, value of 0 means that the model provides no information for understanding the dependent variable and is useless.
- (ii)
- RMSE is given by:where is predicted evaporation values i-th case, tested data from cross validation and N is the total number of simulated values.
- It was used as the standard statistical metric providing a relatively high weight to large errors.
- (iii)
- MAE is given by:The mean absolute error (MAE) is calculated as the average of the absolute differences between the predicted evaporation values and tested data from cross validation .
- MAE is used to measure how close the predictions or forecasts are to the final results. ’Absolute’ means that negative values are converted to positive values. The error is less sensitive to occasional very large errors because it does not amplify calculation errors.
- (iv)
- RERR is given by:is the ratio of the absolute error between -predicted evaporation values and -tested data to the true of the value -predicted evaporation values.
- It is a dimensionless quantity and can be given in percentages, it may attain both positive and negative values. Relative error can be used to compare quantities with different dimensions.
3.5. Final Evaluation of Regression Models
4. Results and Discussion
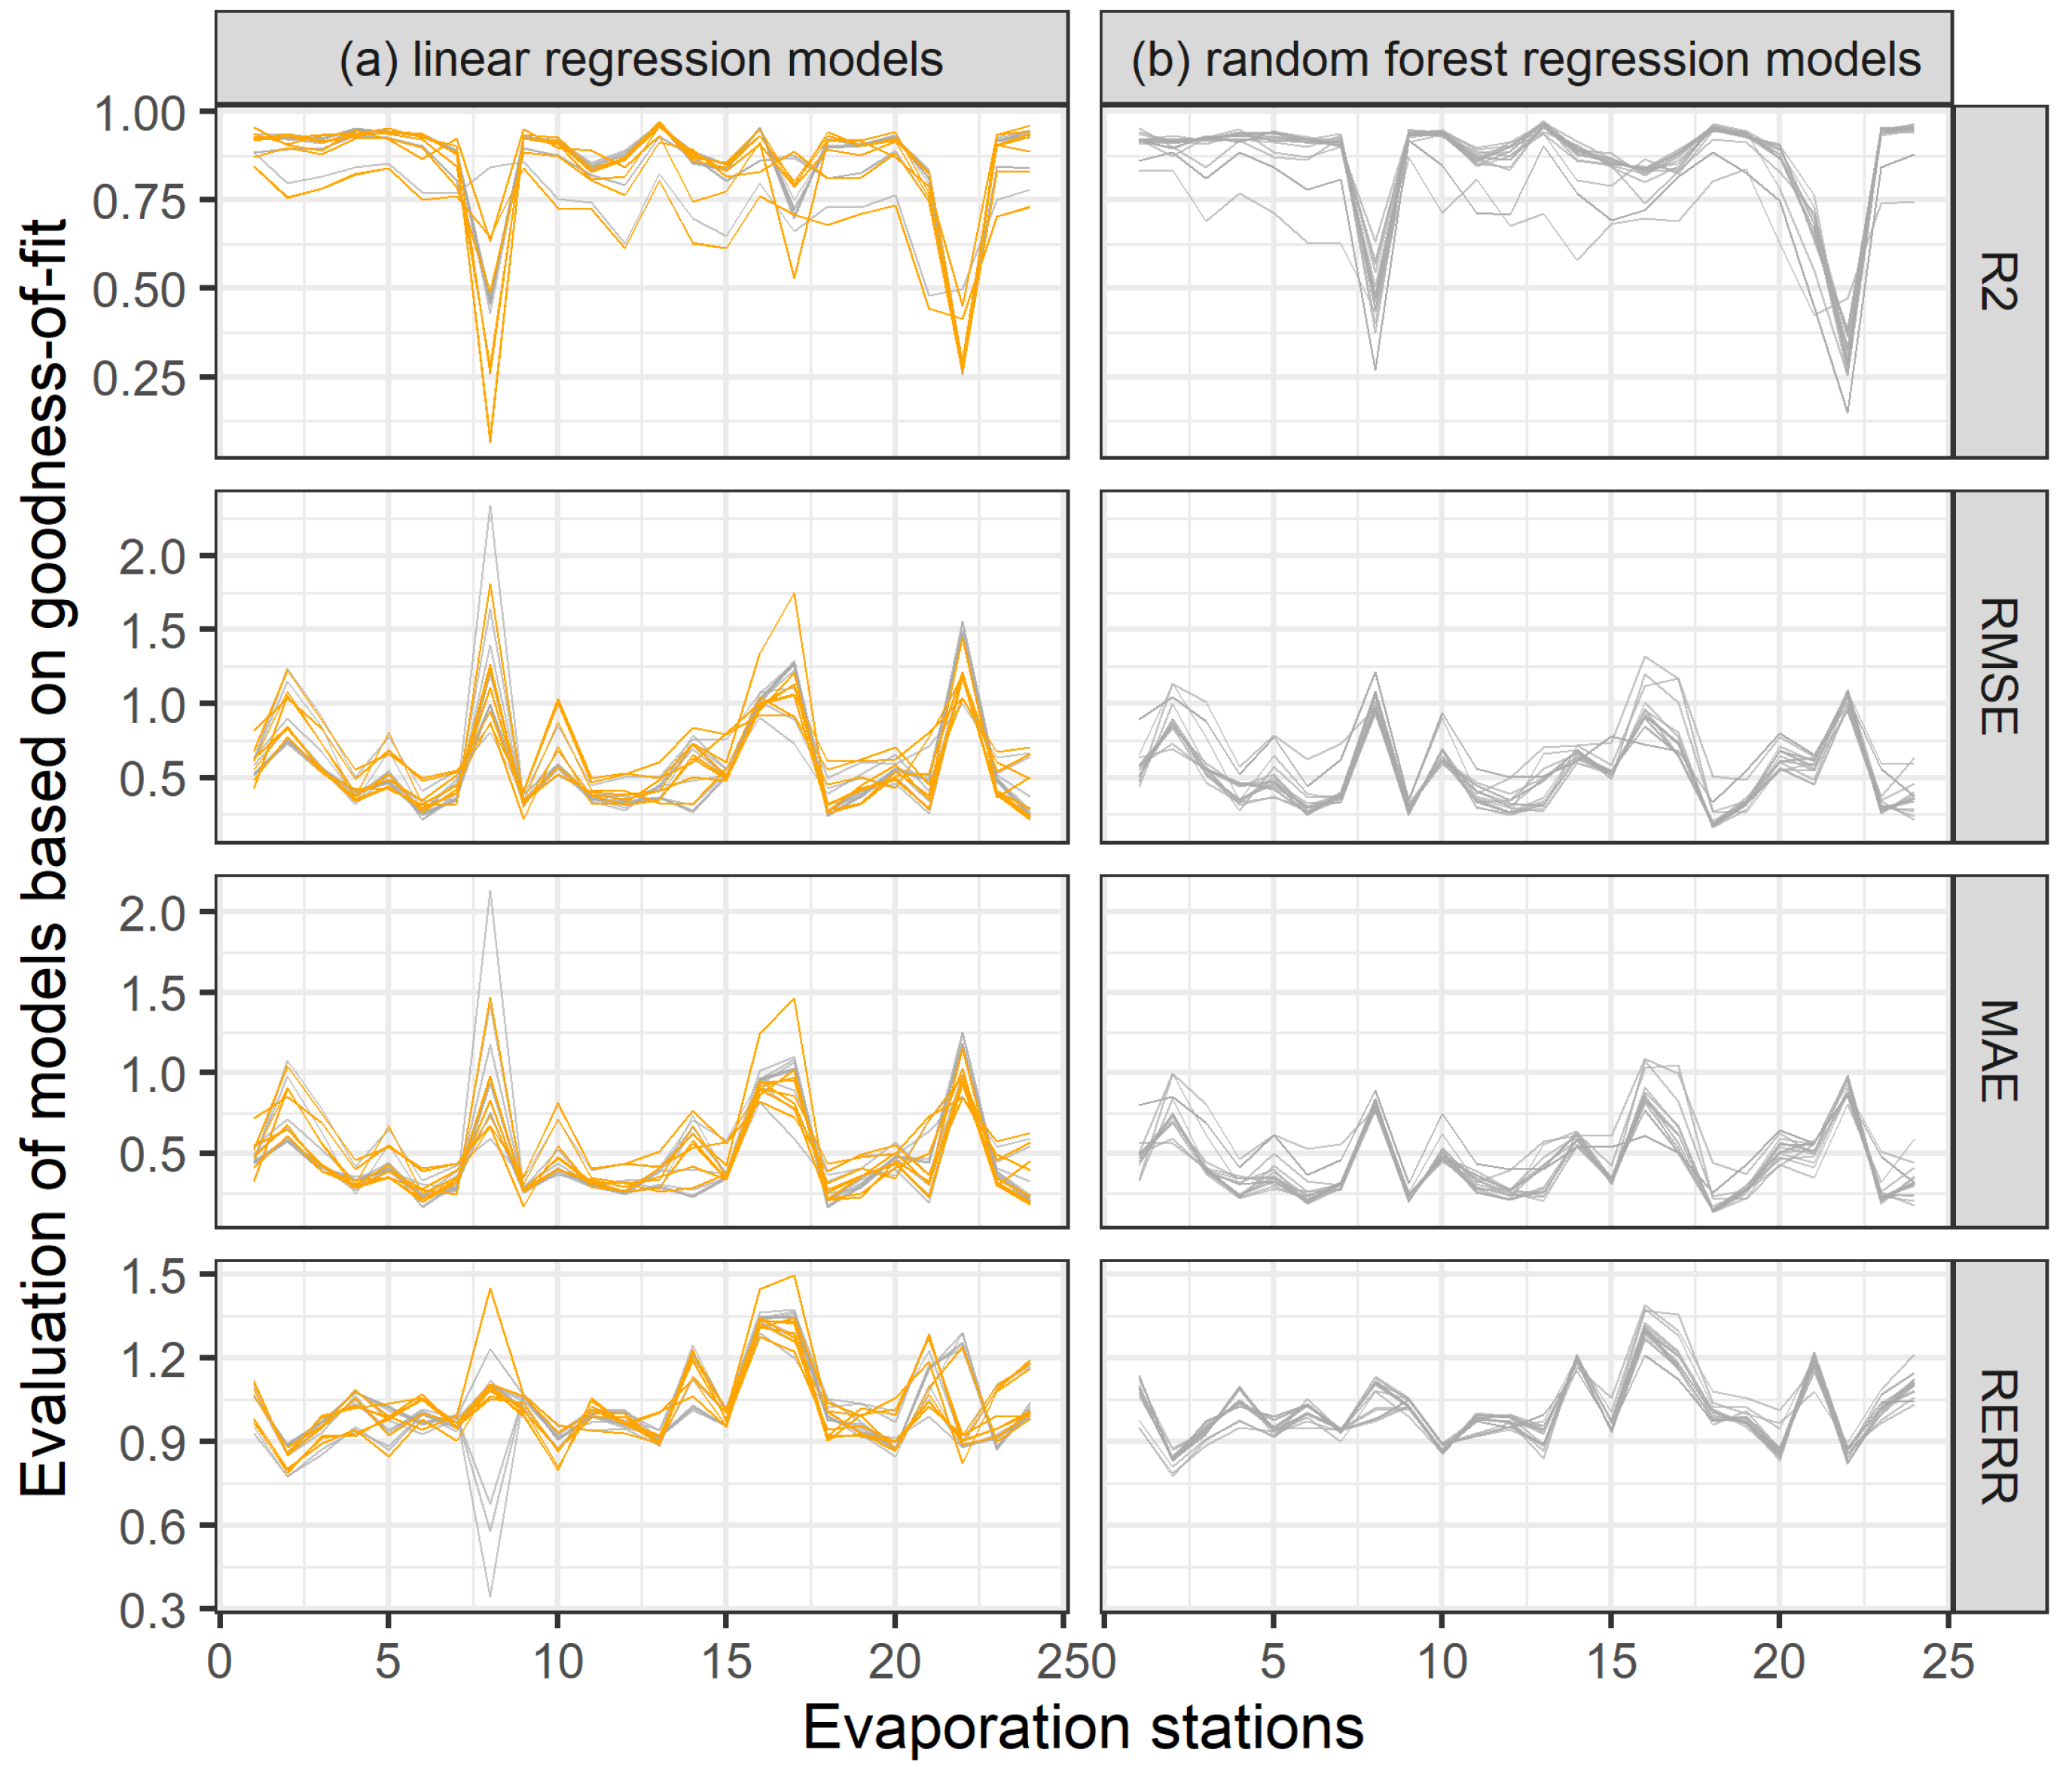
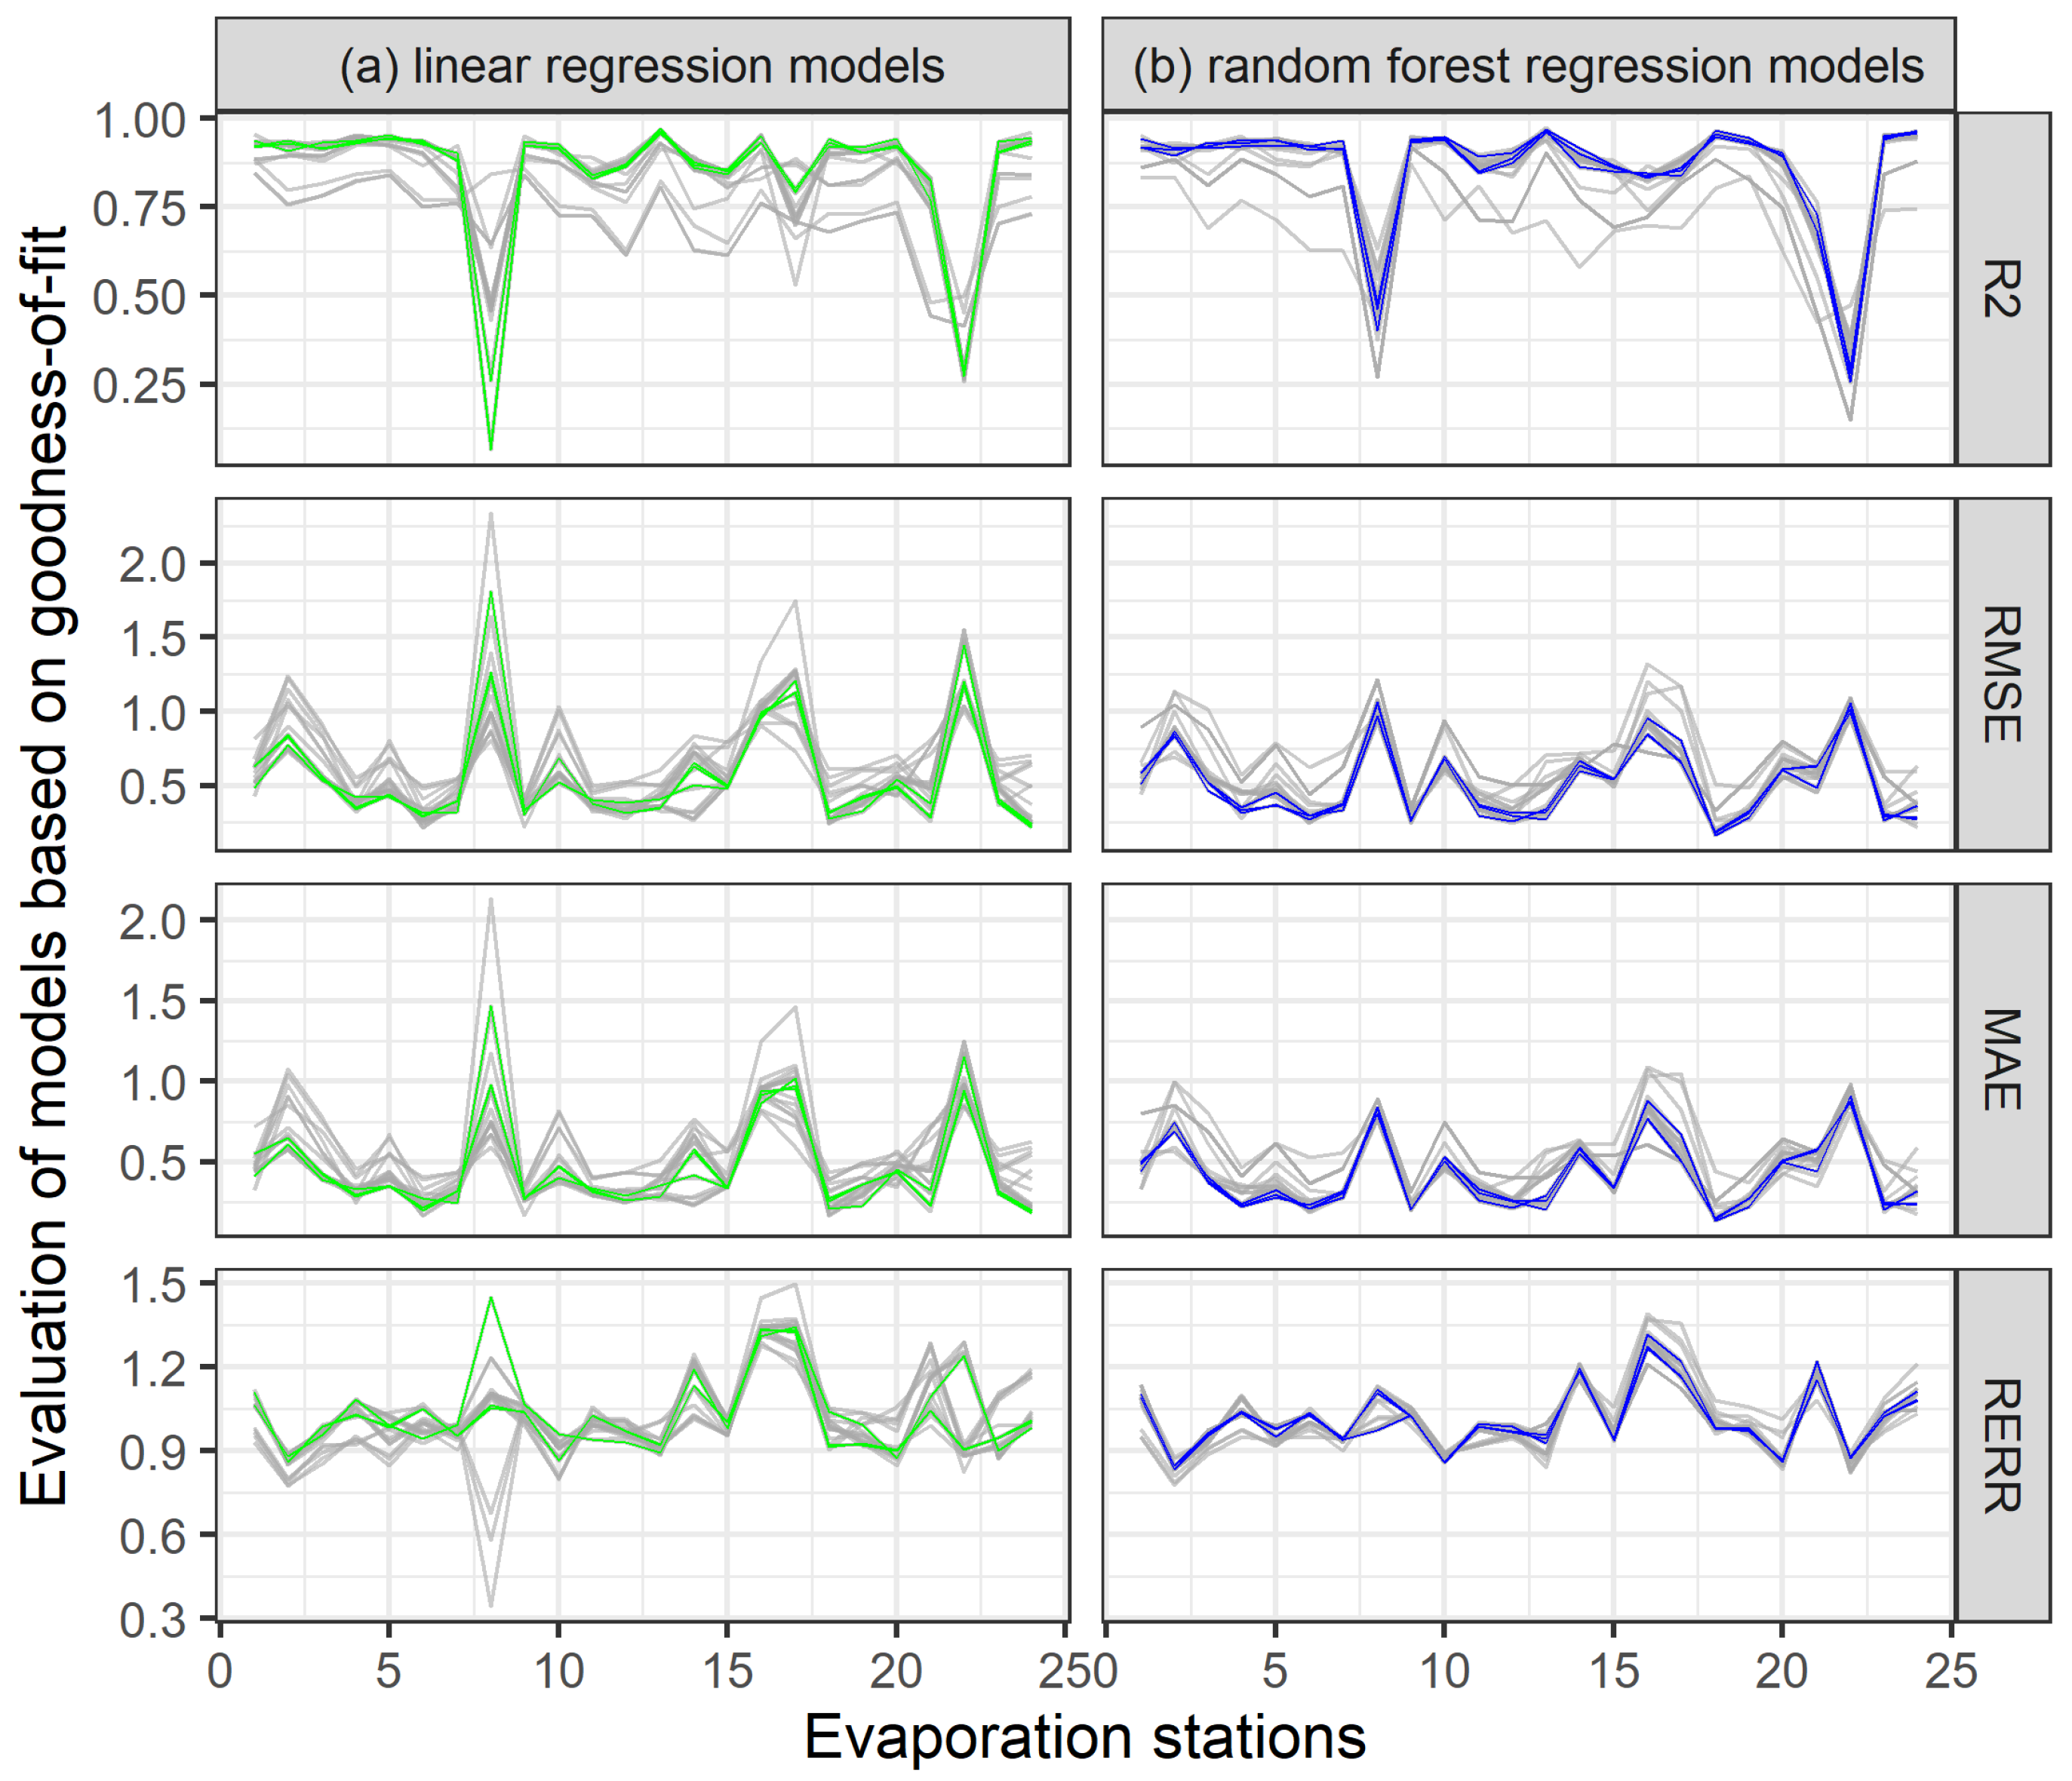
4.1. Evaluation of Regression Models
- (i)
- In the training data, one station out of 24 stations was selected and validation of the inferred patterns from 23 stations was performed for this station.
- (ii)
- Validation was carried out successively for all stations and models.
- (iii)
- For validations, the goodness-of-fit , RMSE, MAE and RERR were calculated.
- (iv)
- Based on the RMSE, the function of R [32] rank() was used, which lists the order of individual values corresponding in an ascending order to the sorted vector. After creating a unique identifier, a matrix was created where the models were on the x-axis and on the stations on the y-axis were. Based on this matrix, the best models were selected.
- LM1, LM7, LM8, LM12, RFM4, RFM5, RFM15 are formula identifiers for evaporation,
- T … temperature (2 m) [°C],
- ST … surface temperature [°C],
- P … surface pressure [Pa],
- W … wind speed [m·s−1],
- R … surface net solar radiation [W·m−2],
- D … dew point [°C],
- H … relative humidity [%],
- asl … elevation above sea level [m],
- X … longitude,
- Y … latitude.
4.2. Model Application to Water Reservoirs
5. Concluding Remarks
Author Contributions
Funding
Institutional Review Board Statement
Informed Consent Statement
Data Availability Statement
Conflicts of Interest
Abbreviations
| LM | Linear Model |
| RFM | Random forest Model |
| GOF | goodness-of-fit |
| EWM | evaporimeter |
| ERA5-Land | climate reanalysis product |
| ECMWF | European Centre for Medium-Range Weather Forecasts |
| COPERNICUS | European Union’s Earth Observation Programme |
| CDS | Climate Data Store |
| API | Application Program Interfaces |
| GRIB | General Regularly-distributed Information in Binary form |
| NetCDF | Network Common Data Form |
| MAE | Mean Absolute Error |
| RMSE | Root Mean Squared Error |
| R2 | Coefficient of Determination |
| RERR | Relative Error |
| AIC | Akaike Information Criterion |
| Quantile-Quantile Plot |
Appendix A

| ID | Manual Linear Regression |
|---|---|
| LM1 | E ~ (T * R) + D + P + asl + Y |
| LM2 | E ~ T + () + R + Y |
| LM3 | E ~ H + W + T + ST + asl |
| LM4 | E ~ W + T + asl + (X * Y) |
| LM5 | E ~ W + T + (X * Y) + asl |
| LM6 | E ~ W + T + R + (X * Y) + asl |
| LM7 | E ~ W + (T * D) + R + asl + Y + X |
| LM8 | E ~ X + Y + asl + (T * D) + R) |
| ID | Stepwise regression |
| LM9 | E ~ ST |
| LM10 | E ~ ST + R |
| LM11 | E ~ ST + R + Y |
| LM12 | E ~ ST + R + D + Y |
| LM13 | E ~ ST + R + D + asl + Y |
| LM14 | E ~ ST + R + D + P + asl + Y |
| LM15 | E ~ ST + R + D + P + asl + Y + X |
| LM16 | E ~ W + ST + R + D + P + asl + Y + X |
| LM17 | E ~ W + T + ST + R + D + P + asl + Y + X |
| LM18 | E ~ W + T + ST + R + D + P + H + asl + Y + X |
| ID | Random forest regression |
| RFM1 | E ~ (T * R) + D + P + asl + Y |
| RFM2 | E ~ H + W + T + ST + asl |
| RFM3 | E ~ W + T + asl + (X * Y) |
| RFM4 | E ~ W + (T * D) + R + asl + Y + X) |
| RFM5 | E ~ X + Y + asl + (T * D) + R |
| RFM6 | E ~ ST |
| RFM7 | E ~ ST + R |
| RFM8 | E ~ ST + R + Y |
| RFM9 | E ~ ST + R + D + Y |
| RFM10 | E ~ ST + R + D + asl + Y |
| RFM11 | E ~ ST + R + D + P + asl + Y |
| RFM12 | E ~ ST + R + D + P + asl + Y + X |
| RFM13 | E ~ W + ST + R + D + P + asl + Y + X |
| RFM14 | E ~ W + T + ST + R + D + P + asl + Y + X |
| RFM15 | E ~ W + T + ST + R + D + P + H + asl + Y + X |
| Water Reservoir | LM 1 | LM 7 | LM 8 | LM 12 | RF 4 | RF 5 | RF 15 | |
|---|---|---|---|---|---|---|---|---|
| 1 | Mariánské Lázně | 456.57 | 406.37 | 407.53 | 460.76 | 448.25 | 441.19 | 440.32 |
| 2 | Medard | 517.42 | 419.89 | 420.58 | 445.50 | 464.99 | 461.08 | 452.22 |
| 3 | Nesyt | 734.47 | 738.63 | 738.35 | 720.95 | 693.63 | 694.18 | 693.05 |
| 4 | Rožmberk | 621.84 | 577.57 | 579.15 | 581.44 | 581.58 | 576.09 | 555.99 |
| 5 | Staňkovský pond | 629.94 | 570.13 | 570.85 | 586.79 | 566.87 | 562.56 | 550.49 |
| 6 | Bezdrev | 629.52 | 568.50 | 568.80 | 564.59 | 571.94 | 567.83 | 564.59 |
| 7 | jezero Most | 507.42 | 470.84 | 468.07 | 449.22 | 540.34 | 546.20 | 510.86 |
| 8 | Bedřichov | 302.96 | 379.47 | 381.93 | 398.94 | 442.42 | 435.92 | 442.27 |
| 9 | Brno | 612.95 | 625.37 | 626.29 | 606.97 | 627.63 | 625.78 | 609.18 |
| 10 | Dalešice | 617.56 | 606.14 | 606.28 | 607.93 | 608.56 | 607.86 | 597.58 |
| 11 | Harcov | 437.17 | 405.10 | 408.10 | 404.30 | 452.33 | 447.10 | 445.74 |
| 12 | Hněvkovice | 616.43 | 565.34 | 566.31 | 570.69 | 569.44 | 565.61 | 546.01 |
| 13 | Nové Mlýny dolní | 715.26 | 723.92 | 724.69 | 703.13 | 690.91 | 692.57 | 689.31 |
| 14 | Nové Mlýny horní | 716.69 | 718.96 | 719.29 | 696.68 | 684.96 | 685.64 | 682.96 |
| 15 | Nové Mlýny střed | 719.17 | 718.65 | 719.25 | 693.89 | 685.19 | 685.79 | 682.40 |
| 16 | Orlík | 566.86 | 536.74 | 536.87 | 551.54 | 557.05 | 557.89 | 539.68 |
| 17 | Přísečnice | 392.88 | 364.87 | 363.56 | 404.01 | 448.05 | 445.16 | 429.48 |
| 18 | Rozkoš | 483.40 | 480.53 | 481.91 | 453.28 | 514.23 | 513.06 | 489.23 |
| 19 | Skalka | 485.34 | 421.82 | 425.00 | 460.64 | 472.03 | 467.27 | 459.67 |
| 20 | Slezská Harta | 455.25 | 487.71 | 483.71 | 463.05 | 507.73 | 511.28 | 480.48 |
| 21 | Stráž pod Ralskem | 447.56 | 439.12 | 441.68 | 430.19 | 464.72 | 459.26 | 462.60 |
| 22 | Těrlicko | 510.93 | 547.67 | 546.09 | 492.15 | 538.75 | 537.80 | 507.56 |
| 23 | Vranov | 646.21 | 617.51 | 616.28 | 621.22 | 602.25 | 599.90 | 590.68 |
| 24 | Vrané | 547.91 | 543.23 | 540.54 | 543.30 | 512.07 | 509.25 | 520.30 |
| 25 | Vír I | 521.65 | 513.87 | 512.16 | 510.30 | 528.49 | 531.97 | 504.17 |
| 26 | Hracholusky | 543.98 | 491.44 | 490.70 | 513.37 | 500.41 | 497.08 | 491.13 |
| 27 | Jesenice | 507.08 | 421.91 | 424.18 | 456.80 | 468.90 | 464.60 | 456.41 |
| 28 | Kružberk | 508.67 | 503.72 | 499.90 | 480.90 | 512.99 | 515.47 | 489.92 |
| 29 | Lipno I | 586.06 | 508.19 | 510.88 | 541.07 | 516.80 | 512.38 | 476.28 |
| 30 | Nechranice | 493.24 | 479.92 | 476.84 | 465.56 | 502.13 | 500.34 | 490.44 |
| 31 | Římov | 625.90 | 558.38 | 559.47 | 564.04 | 560.89 | 557.42 | 524.97 |
| 32 | Švihov | 546.86 | 527.77 | 526.51 | 533.85 | 513.68 | 512.63 | 506.66 |
| 33 | Žehuňský pond | 536.57 | 564.87 | 563.07 | 548.24 | 543.89 | 539.64 | 551.57 |
References
- Beran, A.; Hanel, M.; Nesládková, M.; Vizina, A. Increasing water resources availability under climate change. Procedia Eng. 2016, 162, 448–454. [Google Scholar] [CrossRef][Green Version]
- Možný, M.; Trnka, M.; Vlach, V.; Vizina, A.; Potopová, V.; Zahradníček, P.; Štepánek, P.; Hájková, L.; Staponites, L.; Žalud, Z. Past (1971–2018) and future (2021–2100) pan evaporation rates in the Czech Republic. J. Hydrol. 2020, 590, 125390. [Google Scholar] [CrossRef]
- Tang, Q.; Gao, H.; Lu, H.; Lettenmaier, D.P. Remote sensing: Hydrology. Prog. Phys. Geogr. 2009, 33, 490–509. [Google Scholar] [CrossRef]
- Schultz, G.A.; Engman, E.T. Remote Sensing in Hydrology and Water Management; Springer Science & Business Media: Berlin/Heidelberg, Germany, 2012. [Google Scholar]
- Calera, A.; Campos, I.; Osann, A.; D’Urso, G.; Menenti, M. Remote sensing for crop water management: From ET modelling to services for the end users. Sensors 2017, 17, 1104. [Google Scholar] [CrossRef]
- Beran, A.; Hanel, M.; Nesládková, M.; Vizina, A.; Kožín, R.; Vyskoč, P. Climate change impacts on water balance in Western Bohemia and options for adaptation. Water Supply 2019, 19, 323–335. [Google Scholar] [CrossRef]
- Chahine, M.T. The hydrological cycle and its influence on climate. Nature 1992, 359, 373–380. [Google Scholar] [CrossRef]
- Zhao, L.; Xia, J.; Xu, C.; Wang, Z.; Sobkowiak, L.; Long, C. Evapotranspiration estimation methods in hydrological models. J. Geogr. Sci. 2013, 23, 359–369. [Google Scholar] [CrossRef]
- Beran, A.; Kašpárek, L.; Vizina, A.; Šuhájková, P. Water loss by evaporation from free water surface. Vodohospod. Tech.-Ekon. Inf. 2019, 61, 12–18. [Google Scholar]
- Šuhájková, P. Evaporation from VÚV TGM evaporation stations. Vodohospod. Tech.-Ekon. Inf. 2020, 5, 16–27. [Google Scholar]
- Markonis, Y.; Kumar, R.; Hanel, M.; Rakovec, O.; Máca, P.; AghaKouchak, A. The rise of compound warm-season droughts in Europe. Sci. Adv. 2021, 7, eabb9668. [Google Scholar] [CrossRef]
- Rodell, M.; Beaudoing, H.K.; L’ecuyer, T.; Olson, W.S.; Famiglietti, J.S.; Houser, P.R.; Adler, R.; Bosilovich, M.G.; Clayson, C.A.; Chambers, D.; et al. The observed state of the water cycle in the early twenty-first century. J. Clim. 2015, 28, 8289–8318. [Google Scholar] [CrossRef]
- Glenn, E.P.; Huete, A.R.; Nagler, P.L.; Hirschboeck, K.K.; Brown, P. Integrating remote sensing and ground methods to estimate evapotranspiration. Crit. Rev. Plant Sci. 2007, 26, 139–168. [Google Scholar] [CrossRef]
- Hersbach, H.; Bell, B.; Berrisford, P.; Hirahara, S.; Horányi, A.; Muñoz-Sabater, J.; Nicolas, J.; Peubey, C.; Radu, R.; Schepers, D.; et al. The ERA5 global reanalysis. Q. J. R. Meteorol. Soc. 2020, 146, 1999–2049. [Google Scholar] [CrossRef]
- Srivastava, A.; Sahoo, B.; Raghuwanshi, N.S.; Singh, R. Evaluation of Variable-Infiltration Capacity Model and MODIS-Terra Satellite-Derived Grid-Scale Evapotranspiration Estimates in a River Basin with Tropical Monsoon-Type Climatology. J. Irrig. Drain. Eng. 2017, 143, 04017028. [Google Scholar] [CrossRef]
- Singh, V.P.; Xu, C.Y. Evaluation and Generalization of 13 Equations for Determining Free Water Evaporation. Hydrol. Process. 1997, 11, 311–323. [Google Scholar] [CrossRef]
- Allen, R.G.; Pereira, L.S.; Raes, D.; Smith, M. Crop Evapotranspiration-Guidelines for Computing Crop Water Requirements-FAO Irrigation and Drainage Paper 56; FAO: Rome, Italy, 1998; Volume 300, p. D05109. [Google Scholar]
- Xu, C.Y.; Singh, V.P. Evaluation and generalization of radiation-based methods for calculating evaporation. Hydrol. Process. 2000, 14, 339–349. [Google Scholar] [CrossRef]
- Xu, C.Y.; Singh, V.P. Evaluation and generalization of temperature-based methods for calculating evaporation. Hydrol. Process. 2001, 15, 305–319. [Google Scholar] [CrossRef]
- Xu, C.Y.; Singh, V.P. Cross comparison of empirical equations for calculating potential evapotranspiration with data from Switzerland. Water Resour. Manag. 2002, 16, 197–219. [Google Scholar] [CrossRef]
- Almorox, J.; Senatore, A.; Quej, V.H.; Mendicino, G. Worldwide assessment of the Penman–Monteith temperature approach for the estimation of monthly reference evapotranspiration. Theor. Appl. Climatol. 2018, 131, 693–703. [Google Scholar] [CrossRef]
- Jacobs, A.F.G.; De Bruin, H.A.R. Makkink’s equation for evapotranspiration applied to unstressed maize. Hydrol. Process. 1998, 12, 1063–1066. [Google Scholar] [CrossRef]
- Budyko, M.I. Climate and Life; Academic Press: Cambridge, MA, USA, 1974. [Google Scholar]
- Moteva, M.; Kazandjiev, V.; Zhivkov, Z.; Kireva, R.; Mladenova, B.; Matev, A.; Kalaydzhieva, R. Estimation of Crop Evapotranspiration in Bulgaria Climate Conditions. Sci. Pap.-Ser. A Agron. 2014, 57, 255–263. [Google Scholar]
- Beran, A.; Vizina, A. Derivation of regression equations for calculation of evaporation from a free water surface and identification of trends in measured variables in Hlasivo station. Vodohospod. Tech.-Ekon. Inf. 2013, 4, 4–8. [Google Scholar]
- Breiman, L. Ranfom forests. Mach. Learn. 2001, 45, 5–32. [Google Scholar] [CrossRef]
- Ishwaran, H.; Kogalur, U.B. Fast Unified Random Forests for Survival, Regression, and Classification (RF-SRC); R Package Version 2.10.1; 2021; Available online: https://rdrr.io/cran/randomForestSRC/man/rfsrc.html (accessed on 25 August 2021).
- Kumar, M.; Bandyopadhyay, A.; Raghuwanshi, N.S.; Singh, R. Comparative study of conventional and artificial neural network-based ETo estimation models. Irrig. Sci. 2008, 26, 531–545. [Google Scholar] [CrossRef]
- Ghaderpour, E.; Vujadinovic, T.; Hassan, Q.K. Application of the Least-Squares Wavelet software in hydrology: Athabasca River Basin. J. Hydrol. Reg. Stud. 2021, 36, 100847. [Google Scholar] [CrossRef]
- Shadmani, M.; Marofi, S.; Roknian, M. Trend Analysis in Reference Evapotranspiration Using Mann-Kendall and Spearman’s Rho Tests in Arid Regions of Iran. Water Resour. Manag. Int. J. Publ. Eur. Water Resour. Assoc. (EWRA) 2012, 26, 211–224. [Google Scholar] [CrossRef]
- Chen, Y.; Guan, Y.S.G.; Zhang, D. Investigating trends in streamflow and precipitation in Huangfuchuan Basin with wavelet analysis and the Mann-Kendall test. Water 2016, 8, 77. [Google Scholar] [CrossRef]
- R Core Team. R: A Language and Environment for Statistical Computing; R Foundation for Statistical Computing: Vienna, Austria, 2020. [Google Scholar]
- Tolasz, R.; Míková, T.; Valeriánová, A.; Voženílek, V. Atlas Podneb í Česka. Palacký University Olomouc, Czech Hydrometeorological Institute. 2007. Available online: https://www.geoinformatics.upol.cz/publikace/atlas-podnebi-ceska (accessed on 25 August 2021).
- Šuhájková, P.; Kožín, R.; Beran, A.; Melišová, E.; Vizina, A.; Hanel, M. Update of empirical relationships for calculation of free water surface evaporation based on observation at Hlasivo station. Vodohospod. Tech.-Ekon. Inf. 2019, 61, 4–11. [Google Scholar]
- Vondráková, A.; Vávra, A.; Voženílek, V. Climatic regions of the Czech Republic. J. Maps 2013, 9, 425–430. [Google Scholar] [CrossRef]
- Mrkvičková, M. Evaluation of the measurements at the Hlasivo evaporation station. Vodohospod. Tech.-Ekon. Inf. 2007, 49, 9–11. [Google Scholar]
- Dee, D.P.; Uppala, S.M.; Simmons, A.J.; Berrisford, P.; Poli, P.; Kobayashi, S.; Andrae, U.; Balmaseda, M.A.; Balsamo, G.; Bauer, P.; et al. The ERA-Interim reanalysis: Configuration and performance of the data assimilation system. Q. J. R. Meteorol. Soc. 2011, 137, 553–597. [Google Scholar] [CrossRef]
- Muñoz-Sabater, J. ERA5-Land monthly averaged data from 1981 to present. Copernic. Clim. Chang. Serv. (C3s) Clim. Data Store (CDS) 2019, 10, 24381. [Google Scholar]
- Alduchov, O.A.; Eskridge, R.E. Improved Magnus form approximation of saturation vapor pressure. J. Appl. Meteorol. 1996, 35, 601–609. [Google Scholar] [CrossRef]
- Akaike, H. Factor analysis and AIC. In Selected Papers of Hirotugu Akaike; Springer: Berlin/Heidelberg, Germany, 1987; pp. 371–386. [Google Scholar]
- Hadley, W. ggplot2: Elegant Graphics for Data Analysis; Springer: New York, NY, USA, 2016. [Google Scholar]
- Bruce, P.; Bruce, A. Practical Statistics for Data Scientists: 50 Essential Concepts. 2017. Available online: http://www.sthda.com/english/articles/37-model-selection-essentials-in-r/154-stepwise-regression-essentials-in-r/ (accessed on 11 March 2018).
- Aleh, M. Regresní Stromy. Master’s Thesis, Univerzita Karlova v Praze, Staré Město, Czech, 2013. [Google Scholar]
- Antipov, E.A.; Pokryshevskaya, E.B. Mass appraisal of residential apartments: An application of Random forest for valuation and a CART-based approach for model diagnostics. Expert Syst. Appl. 2012, 39, 1772–1778. [Google Scholar] [CrossRef]
- Nhu, V.H.; Shahabi, H.; Nohani, E.; Shirzadi, A.; Al-Ansari, N.; Bahrami, S.; Miraki, S.; Geertsema, M.; Nguyen, H. Daily Water Level Prediction of Zrebar Lake (Iran): A Comparison between M5P, Random Forest, Random Tree and Reduced Error Pruning Trees Algorithms. ISPRS Int. J. Geo-Inf. 2020, 9, 479. [Google Scholar] [CrossRef]
- Westerhuis, J.A.; Hoefsloot, H.C.; Smit, S.; Vis, D.J.; Smilde, A.K.; van Velzen, E.J.; van Duijnhoven, J.P.; van Dorsten, F.A. Assessment of PLSDA cross validation. Metabolomics 2008, 4, 81–89. [Google Scholar] [CrossRef]
- Nagelkerke, N.J. A note on a general definition of the coefficient of determination. Biometrika 1991, 78, 691–692. [Google Scholar] [CrossRef]
- Chai, T.; Draxler, R.R. Root mean square error (RMSE) or mean absolute error (MAE)?–Arguments against avoiding RMSE in the literature. Geosci. Model Dev. 2014, 7, 1247–1250. [Google Scholar] [CrossRef]
- Park, H.; Stefanski, L. Relative-error prediction. Stat. Probab. Lett. 1998, 40, 227–236. [Google Scholar] [CrossRef]
- Vizina, A.; Horáček, S.; Hanel, M. Recent Developments of the Bilan Model. Vodohospod. Tech.-Ekon. Inf. 2015, 57, 7–10. [Google Scholar]
- Melišová, E.; Vizina, A.; Staponites, L.R.; Hanel, M. The Role of Hydrological Signatures in Calibration of Conceptual Hydrological Model. Water 2020, 12, 3401. [Google Scholar] [CrossRef]
- Vyskoč, P.; Beran, A.; Peláková, M.; Kožín, R.; Vizina, A. Preservation of drinking water demand from water reservoirs in climate change conditions. Vodohospod. Tech.-Ekon. Inf. 2021, 63, 4–18. [Google Scholar]


| Goodness-of-Fit | Limit Values | Station above the Limit Value |
|---|---|---|
| <0.2 | Hlasivo, reservoir Most | |
| RMSE | <1.5 | Hlasivo, reservoir Most, Praha Podbaba |
| MAE | <1 | Hlasivo, reservoir Most, Praha Podbaba, Praha Libuš, Dukovany |
| RERR | <1.3 | Hlasivo, reservoir Most, Praha Podbaba, Praha Libuš |
| ID | R | RMSE | MAE | RERR |
|---|---|---|---|---|
| LM1 | 0.85 | 0.58 | 0.47 | 1.04 |
| LM7 | 0.84 | 0.56 | 0.45 | 1.01 |
| LM8 | 0.84 | 0.56 | 0.46 | 1.02 |
| RFM4 | 0.86 | 0.51 | 0.42 | 1.02 |
| RFM5 | 0.86 | 0.51 | 0.42 | 1.02 |
| RFM15 | 0.86 | 0.51 | 0.42 | 1.01 |
Publisher’s Note: MDPI stays neutral with regard to jurisdictional claims in published maps and institutional affiliations. |
© 2021 by the authors. Licensee MDPI, Basel, Switzerland. This article is an open access article distributed under the terms and conditions of the Creative Commons Attribution (CC BY) license (https://creativecommons.org/licenses/by/4.0/).
Share and Cite
Melišová, E.; Vizina, A.; Hanel, M.; Pavlík, P.; Šuhájková, P. Evaluation of Evaporation from Water Reservoirs in Local Conditions at Czech Republic. Hydrology 2021, 8, 153. https://doi.org/10.3390/hydrology8040153
Melišová E, Vizina A, Hanel M, Pavlík P, Šuhájková P. Evaluation of Evaporation from Water Reservoirs in Local Conditions at Czech Republic. Hydrology. 2021; 8(4):153. https://doi.org/10.3390/hydrology8040153
Chicago/Turabian StyleMelišová, Eva, Adam Vizina, Martin Hanel, Petr Pavlík, and Petra Šuhájková. 2021. "Evaluation of Evaporation from Water Reservoirs in Local Conditions at Czech Republic" Hydrology 8, no. 4: 153. https://doi.org/10.3390/hydrology8040153
APA StyleMelišová, E., Vizina, A., Hanel, M., Pavlík, P., & Šuhájková, P. (2021). Evaluation of Evaporation from Water Reservoirs in Local Conditions at Czech Republic. Hydrology, 8(4), 153. https://doi.org/10.3390/hydrology8040153