1. Introduction
Flood is one of the most significant natural disasters in the world that cause about USD 40 billion losses in human life and properties every year [
1]. Recent global warming and climate change amplify the flooding by increasing frequency and intensity of severe floods in the near future [
2]. Flood risk mitigation is a major challenge for hydrological scientists and civil engineers.
The traditional method of flood risk mitigation aims to at reduce the flood risks by land surface hydraulic structures such as dams, river embankments, and reservoirs [
3]. Those hydraulic structures only focus on the surface water domain in the wet season without considering the impacts of groundwater and groundwater flooding. The groundwater domain in the surface floods are generally assumed to be fully saturated and most of peak flow is caused by primarily precipitation [
4]. However, the variabilities in groundwater level can cause various flood situations. For example, the surface flood generally infiltrates into the aquifer. The infiltration of surface water can vary according to the conditions of soil moisture and groundwater levels. The initially wet condition of soil moisture contributes to the fast groundwater level rise. These conditions drive the steep and rapid hydrograph during floods. Thus, it is difficult to forecast the flood situation considering the complex process of surface and groundwater interactions [
5].
Many hydrological models have been developed for river management and flood management, such as the Hydrologic Modeling System (HEC-1 and HMS), developed by the US Army Corp-Hydrologic Engineering Center [
6], and the Revitalised Flood Hydrograph (ReFH) rainfall-runoff model used for simulation of design flood events in the UK [
3,
7]. HEC-HMS is one of the most utilized hydrologic modeling tools in many countries (USA, Europe, and Asia) in order to simulate the influences of climate change [
8] and land use on stream flow [
9,
10,
11]. In addition, a number of studies have focused on the applications of data scarce catchments [
3]. The conceptual hydrological model is generally used in data scarce catchments, and it does not properly consider groundwater flow. Recently, the hydrological data records and qualities have been improved from many efforts (e.g., Hydrological Survey Center in Korea).
In order to simulate reliable prediction of flooding, it is necessary to consider the interactions between surface water and groundwater domains. Nowadays, there is an increasing need for an integrated surface water and groundwater model [
12]. However, the integrated surface water and groundwater model has been rarely used for flood assessment, and its significance has not been widely recognized. Understanding the interactions between surface water and groundwater is important for flood simulation, and provides useful knowledge about the complex flood processes [
13]. This study explores the role of groundwater and streamflow interactions in the flood runoff at the Miho catchment in South Korea. The Hydrological-Ecological Integrated watershed-scale Flow model (HEIFLOW) model is used for the hourly flood simulations to investigate the impact of groundwater discharge on the peak stream runoff at the flood events.
2. Study Area and Data
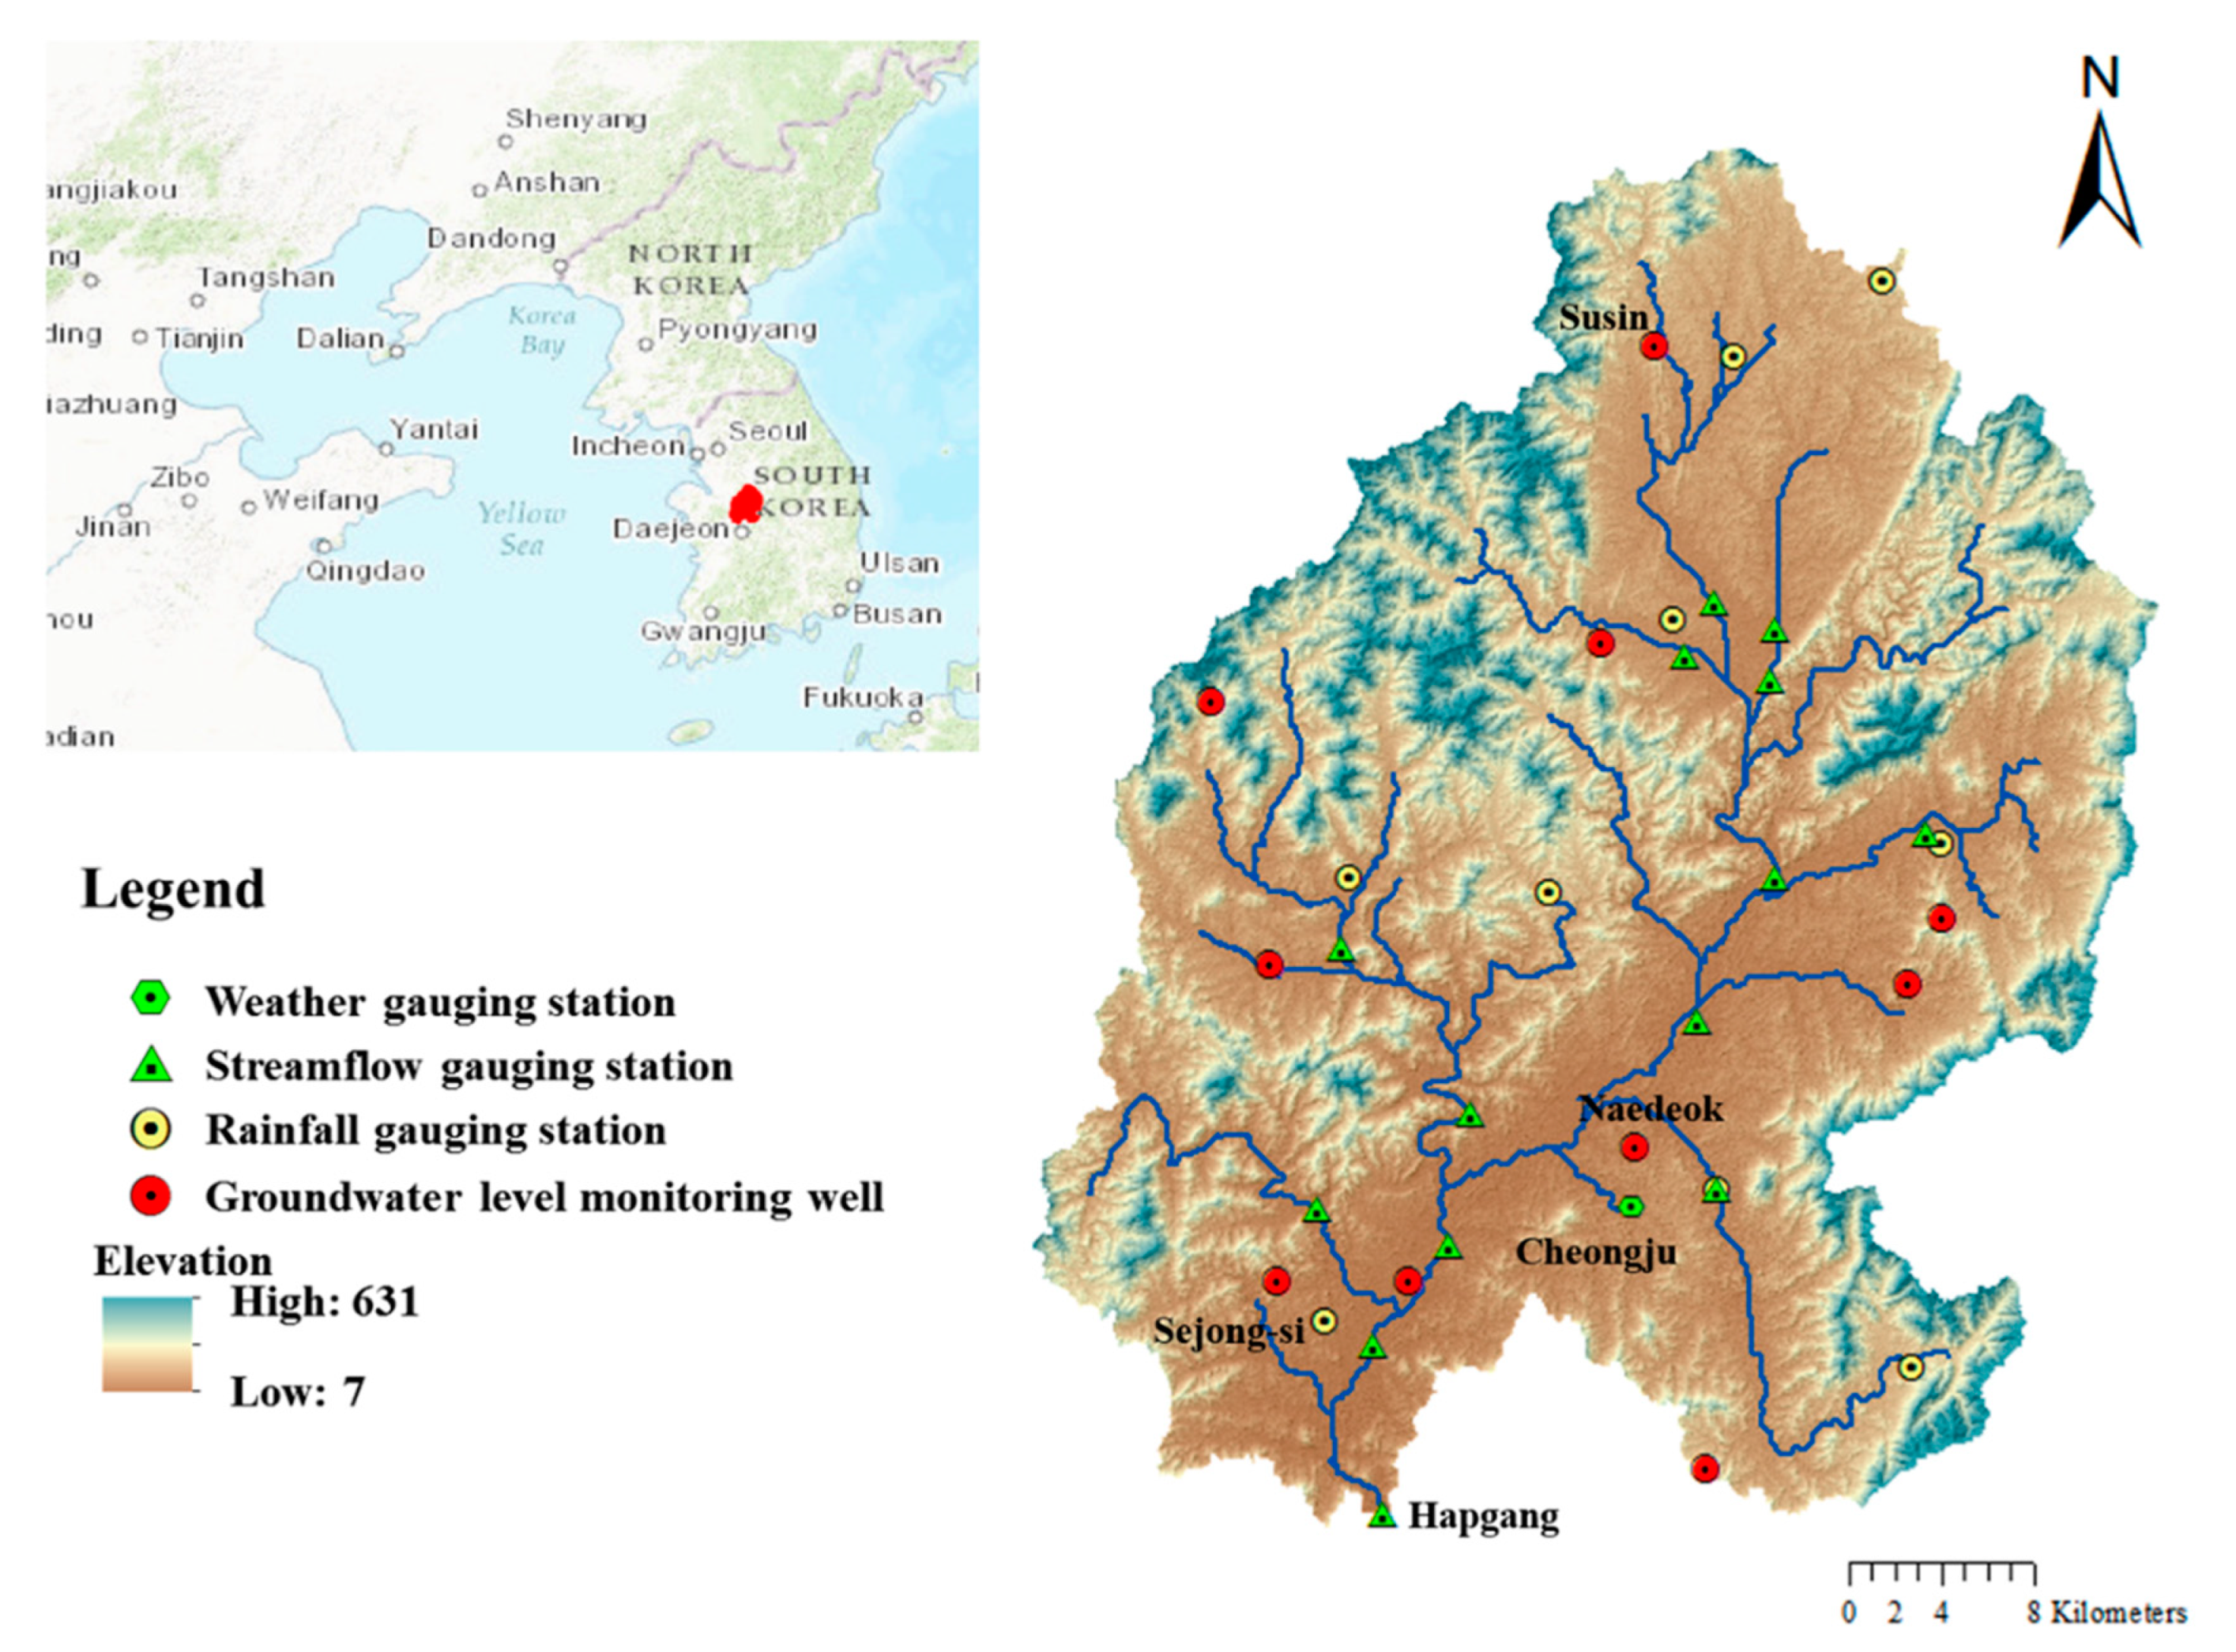
The Miho catchment, which is located in the northern part of the Geum River Basin (GRB), is the largest catchment in the GRB in South Korea (
Figure 1). The strategic water management plan is continuously required in the Miho catchment because the outflows from the Miho catchment highly affect the water quality and quantity of the downstream of GRB. The catchment area is approximately 1800 km
2 and the elevation ranges from 7 m to 631 m. The average precipitation indicates that about 70% of annual precipitation (1239 mm) is concentrated in the summer wet season [
3].
The data set for this study requires the geological, meteorological, and hydrological data sets for developing the HEIFLOW model. The geological data set in the Miho catchment employs a 30 m spatial resolution digital elevation model (DEM), a land-use map, soil maps, hydrogeological map, and bore hole information. Those geological data sets are obtained from the ASTER DEM (
http://asterweb.jpl.nasa.gov accessed in 15 July 2021), Water Resources Management Information System (WAMIS,
http://www.wamis.go.kr accessed on 26 July 2021) and Groundwater information Service (GIMS,
http://www.gims.go.kr accessed on 26 July 2021). The hourly meteorological data from 2013 to 2014 are obtained by the WAMIS and Korea Meteorological Administration (KMA). The precipitation data sets are prepared from the eight rainfall gauging stations, the locations of which are shown in
Figure 1. The hourly weather information such as the temperature, air pressure, relative humidity, wind speed and sunshine hours is employed from the Cheongju weather station. The Hapgang water level gauging station, which is located in the outlet of the Miho catchment, is selected to obtain the hourly streamflow observations (WAMIS). The hourly groundwater level data in the study catchment are provided by the 10 groundwater level monitoring wells in
Figure 1 (GIMS).
3. Methods
This study employs Hydrological-Ecological Integrated watershed-scale Flow (HEIFLOW) to describe the impacts of the groundwater on flood events. HEIFLOW is a three-dimensional distributed eco-hydrological coupling model, whose forerunner is Groundwater and Surface-water FLOW (GSFLOW). The GSFLOW generally simulates the hydrologic process, which integrates the Precipitation-Runoff Modeling System (PRMS) [
14] with the Modular Groundwater Flow Model (MODFLOW-2005) [
15] in the basin scale. However, it has limitations for the time step of simulation, ecological processes, land use changes, and dynamic land use. The modified version of GSFLOW was developed by Tian et al. [
16] in order to improve the limitations of GSFLOW.
The model construction of HEIFLOW requires many processes such as watershed delineation, processing the input data sets, model parameterizations, calibration, and analysis of model results. Thus, the visual hydrological ecological integrated watershed-scale flow (VHF) [
16] is used to construct the complex processes of HEIFLOW model for the Miho catchment. The model domain boundary and stream networks of Miho catchment are delineated with the uniform grids in both surface and groundwater domains to reduce the computation errors [
17].
The surface water model domain in the Miho catchment is delineated into 7220 grids, which have a width and height of 500 m. These grids are defined as Hydrologic Response Unit (HRU) of PRMS and MODFLOW grids. The HRUs contain the input data of surface model domain of HEIFLOW such as elevation, basin area, aspect, latitude, longitude, land cover type, and soil type. The input data sets of HEIFLOW are required to estimate the initial model parameter values for the model calibration. The metrological input data for the Miho catchment were employed from the Cheongju weather station of KMA. The hourly rainfall data from the eight rain gauge stations were interpolated by the inverse distance weighting (IDW) method.
The initial parameter values of HRUs are estimated from the DEM, land use, soil type and vegetation data sets. The major surface model parameters are considered as the plant canopy density (covden_win and covden_sum), the maximum storage of the plant canopy for precipitation (snow_intcp, srain_intcp, and wrain_intcp), and the water contents of soil zone (soil_moist_init, soil moist_max, soil_rechr_init, and soil_rechr_max). The initial surface model parameter sets are further calibrated. The groundwater domain in the Miho catchment is divided into three layers for the groundwater modeling. The groundwater model domains of this study are represented by three layers (i.e., layer 1, layer 2 and layer 3 from top to bottom). All the layer types are set as convertible. A convertible layer means that it can be either confined or unconfined, depending on the elevation of the computed water table. The major parameter sets of groundwater domain contain the horizontal hydraulic conductivity (HK), vertical hydraulic conductivity (VK), specific storage (SS), and specific yield (SY). Both SS and SY are applied for the three layers since they are convertible. The parameter zone of groundwater domain is divided into 41 parameter zones by the information of hydrogeological map and bore hole in the Miho catchment, and the initial groundwater model parameters are adjusted by the daily GSFLOW model in the Miho catchment in previous research [
17]. The input data sets for the surface model are generated by the VHF. In the HEIFLOW model, stream network is generally divided into the reaches and segments. The stream network of Miho catchment model contains the 123 segments with the 1269 reaches. The adjusted model parameter sets of HEIFLOW are represented in
Table 1.
4. Results and Discussions
The HEIFLOW model in the Miho catchment was calibrated by the daily GSFLOW modeling research from Joo et al. [
17]. The HEIFLOW model was employed to verify the hydrological processes in the Miho catchment with hourly time step in 2013.
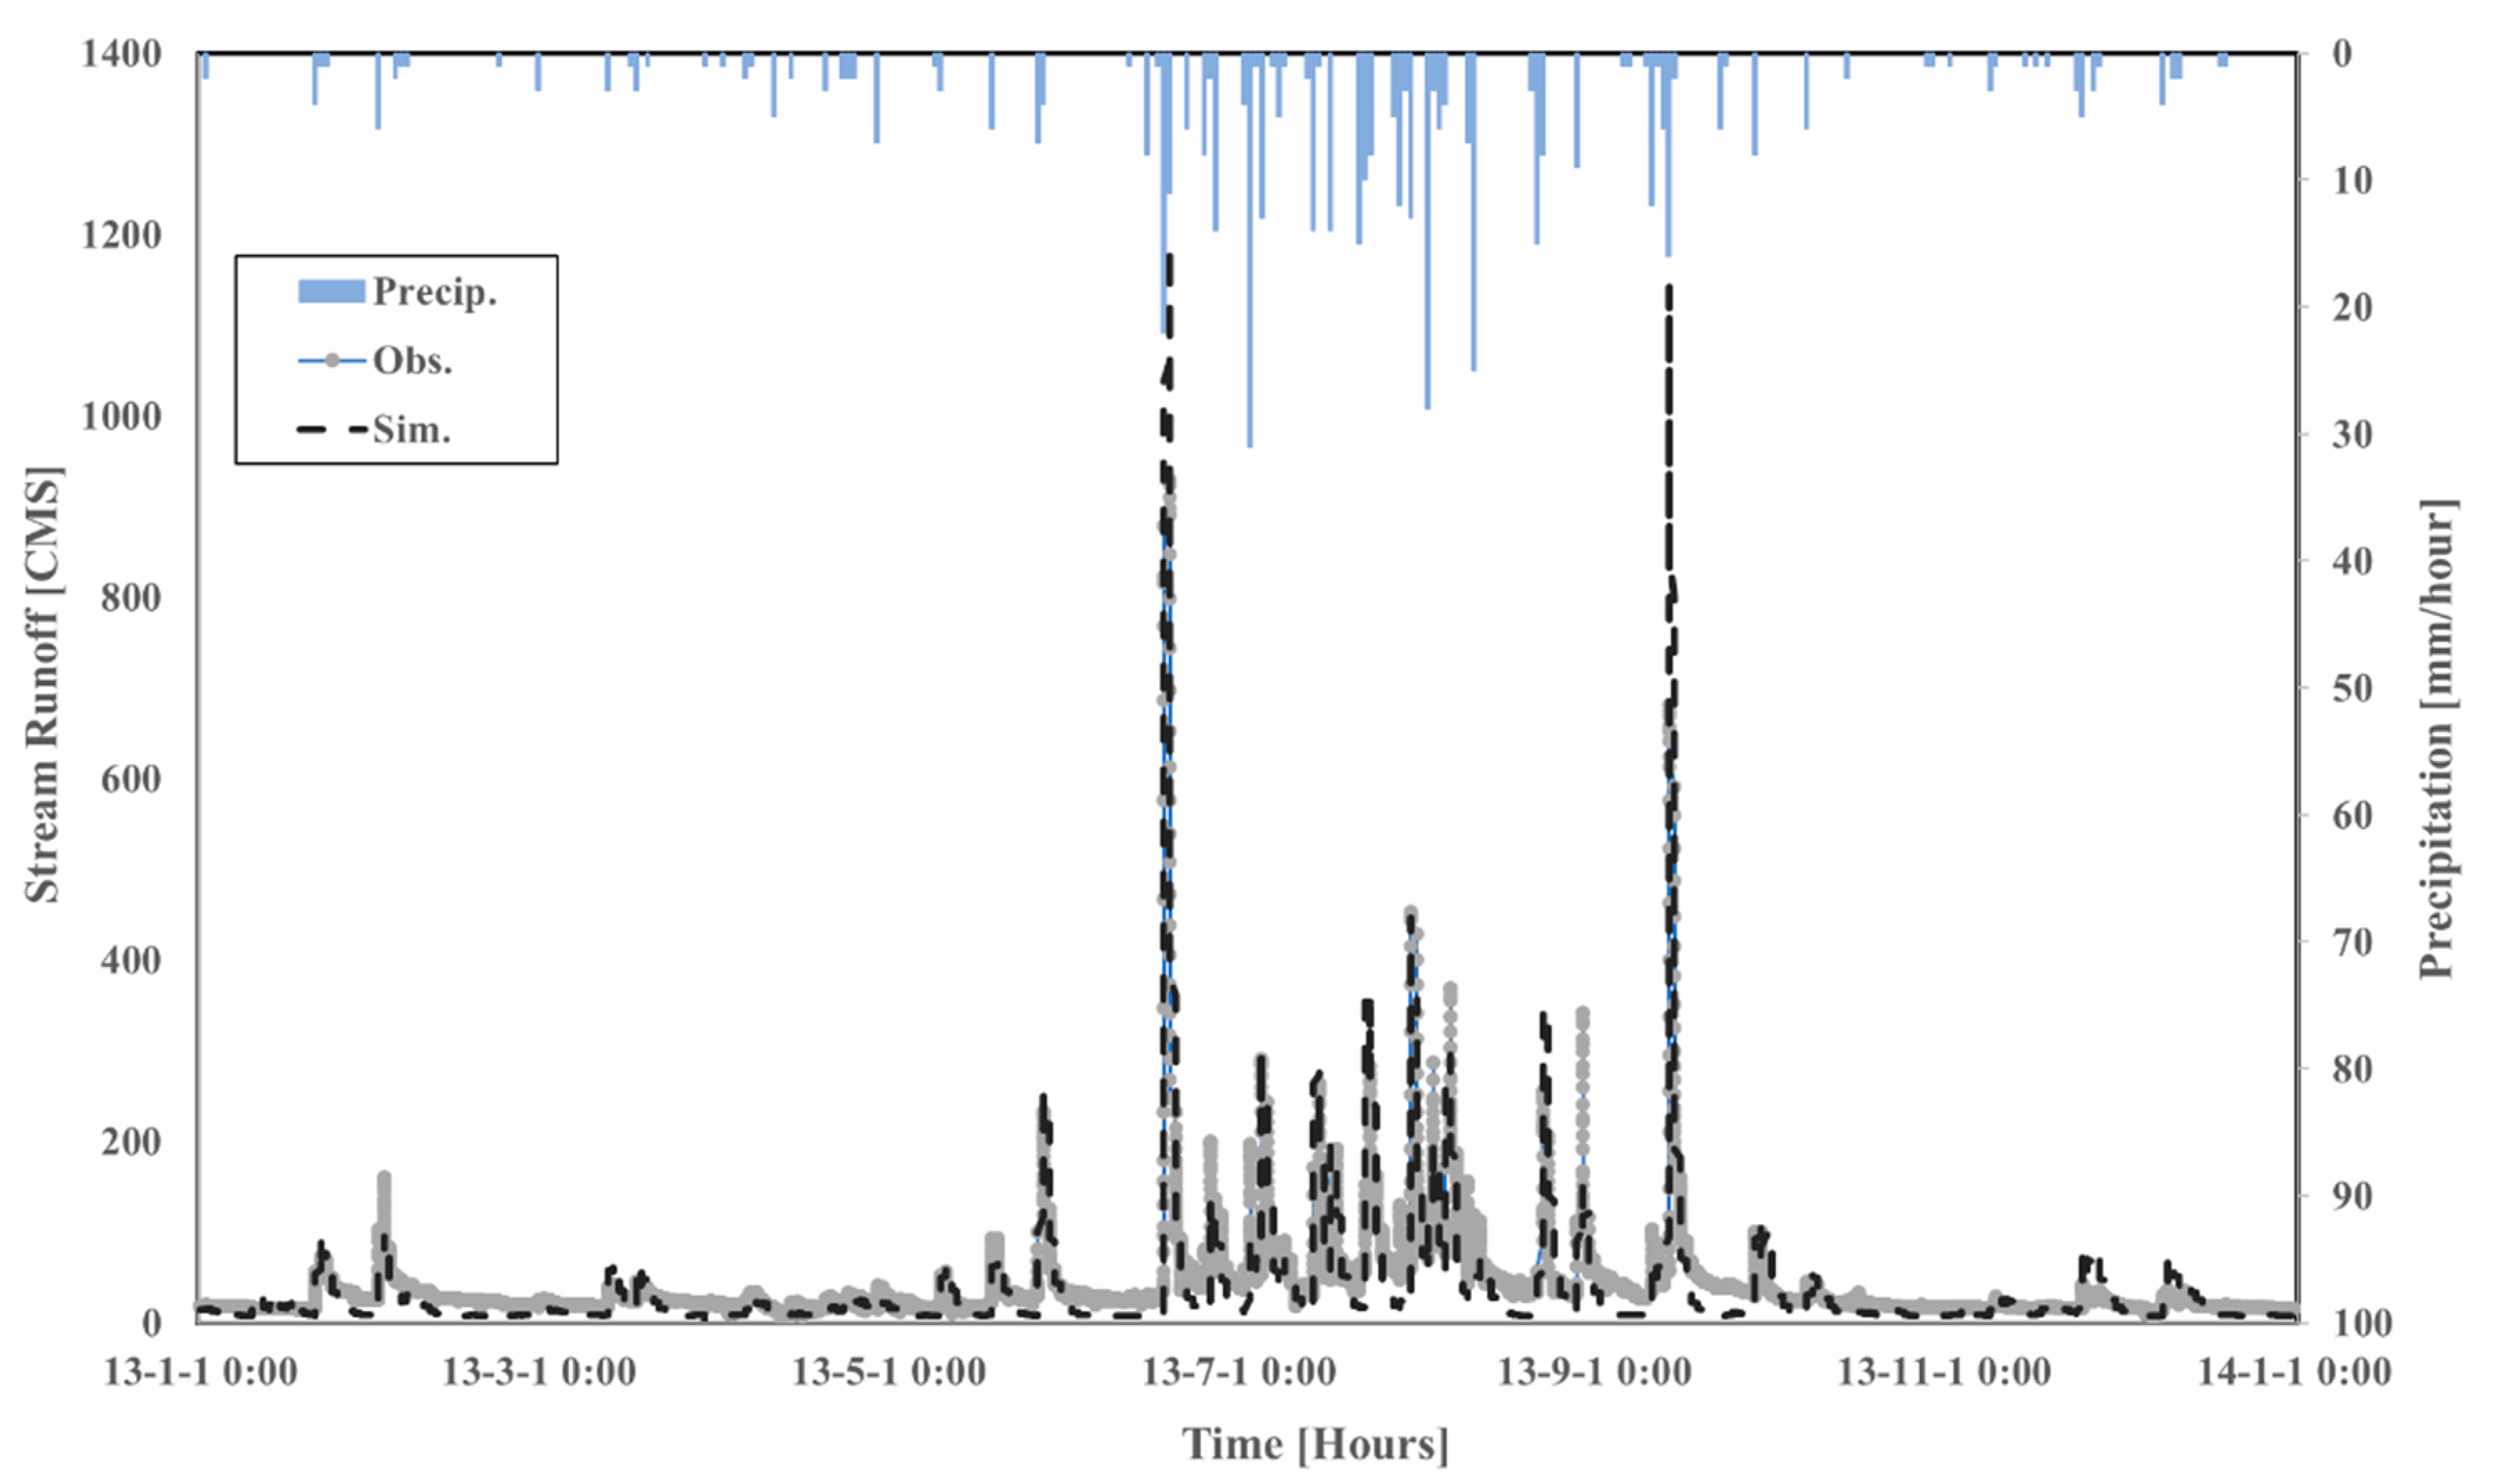
Figure 2 shows the model evaluation of the Miho catchment by the Nash–Sutcliffe model efficiency coefficient (NSE). The gray line indicates the observed stream runoff at the outlet of the Mho catchment at the Hapgang water level gauging station, and the black dashed line represents the HEIFLOW model simulation. The blue bar graph in
Figure 2 indicates the hourly rainfall at the Sejong-si rain gauge station, which is the nearest rain gauge station from the outlet of Miho catchment. The model performance of the Miho catchment indicates appropriate simulation runoff with 0.64 NSE in hourly time step. The stream hydrograph of the HEIFLOW model is generally underestimated in the low flow regime and is overestimated in the peak flow regime.
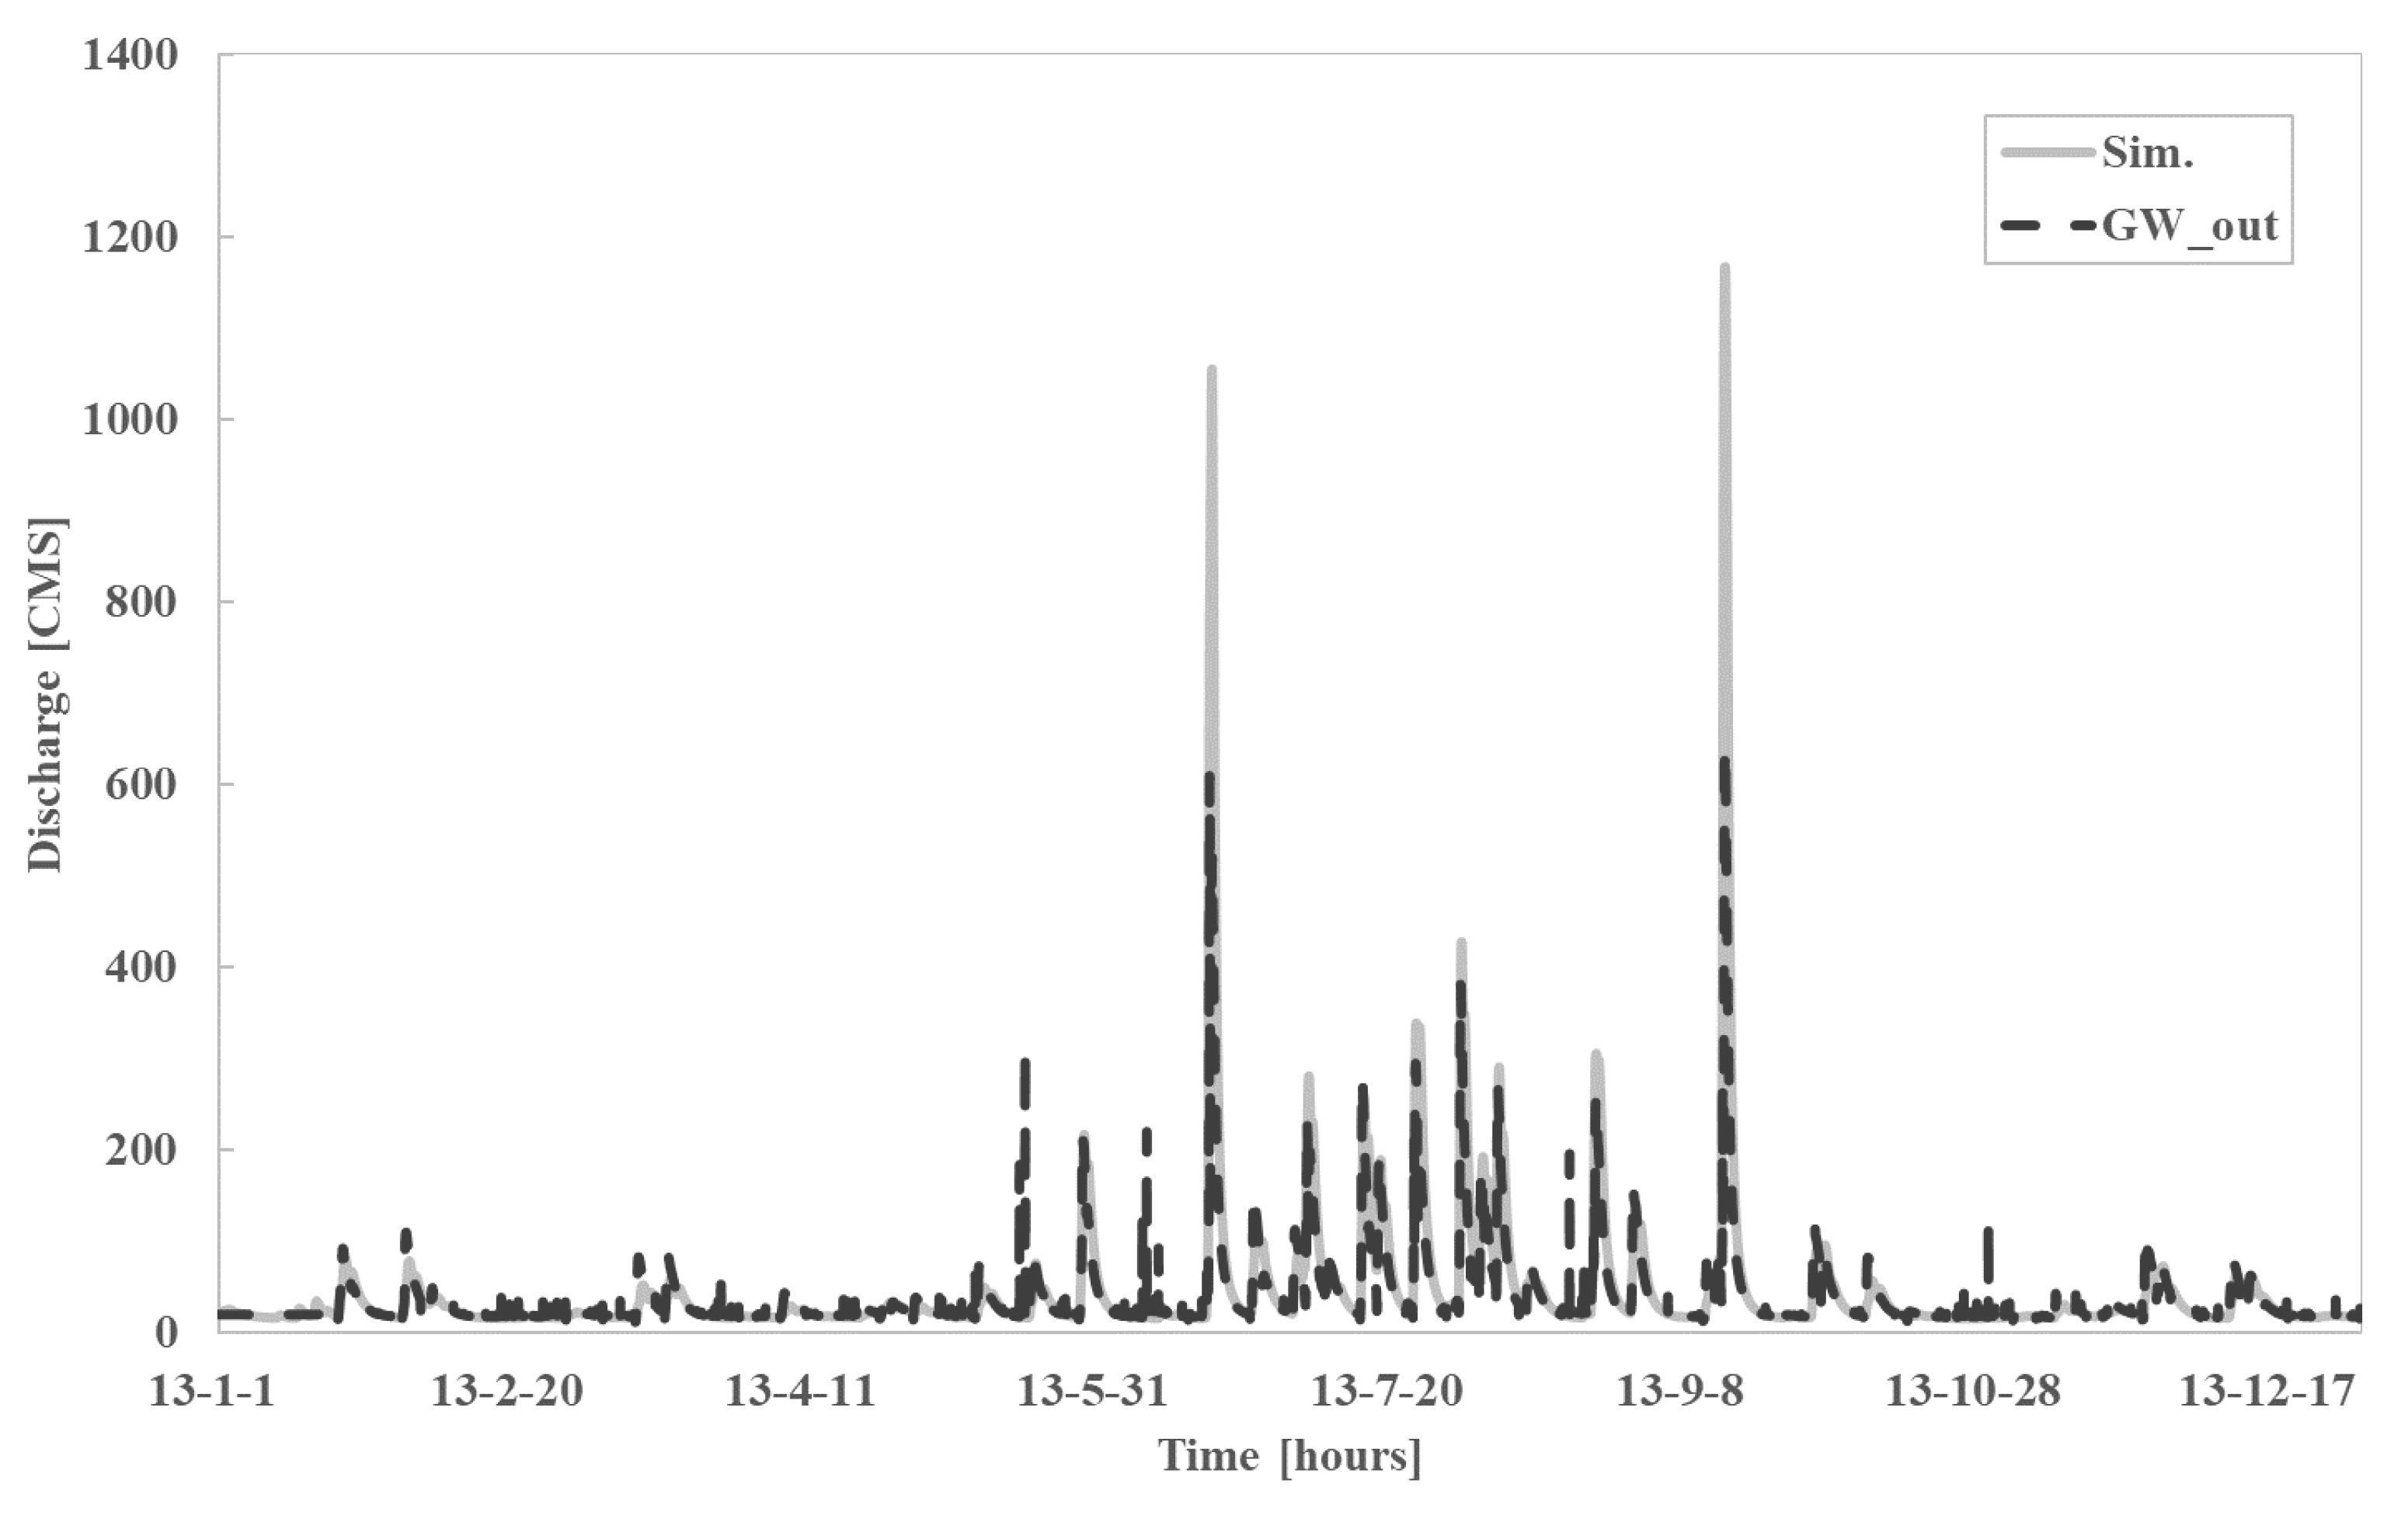
Figure 3 illustrates the interactions between the stream flow and groundwater. The gray line indicates the simulated stream runoff, and the dark dashed line represents the total groundwater discharge out (GW_out) to the streams. The temporal variability of GW_out shows the similar pattern with the stream runoff. GW_out in the dry season (see
Figure 3) is generally larger than stream runoff because the streamflow is lost through evaporation and recharge to groundwater. The results in
Figure 3 indicate that most of baseflow for the downstream of Miho catchment is sourced from the groundwater. These also represent the peak flow during flooding is highly influenced by the groundwater flow to the stream.
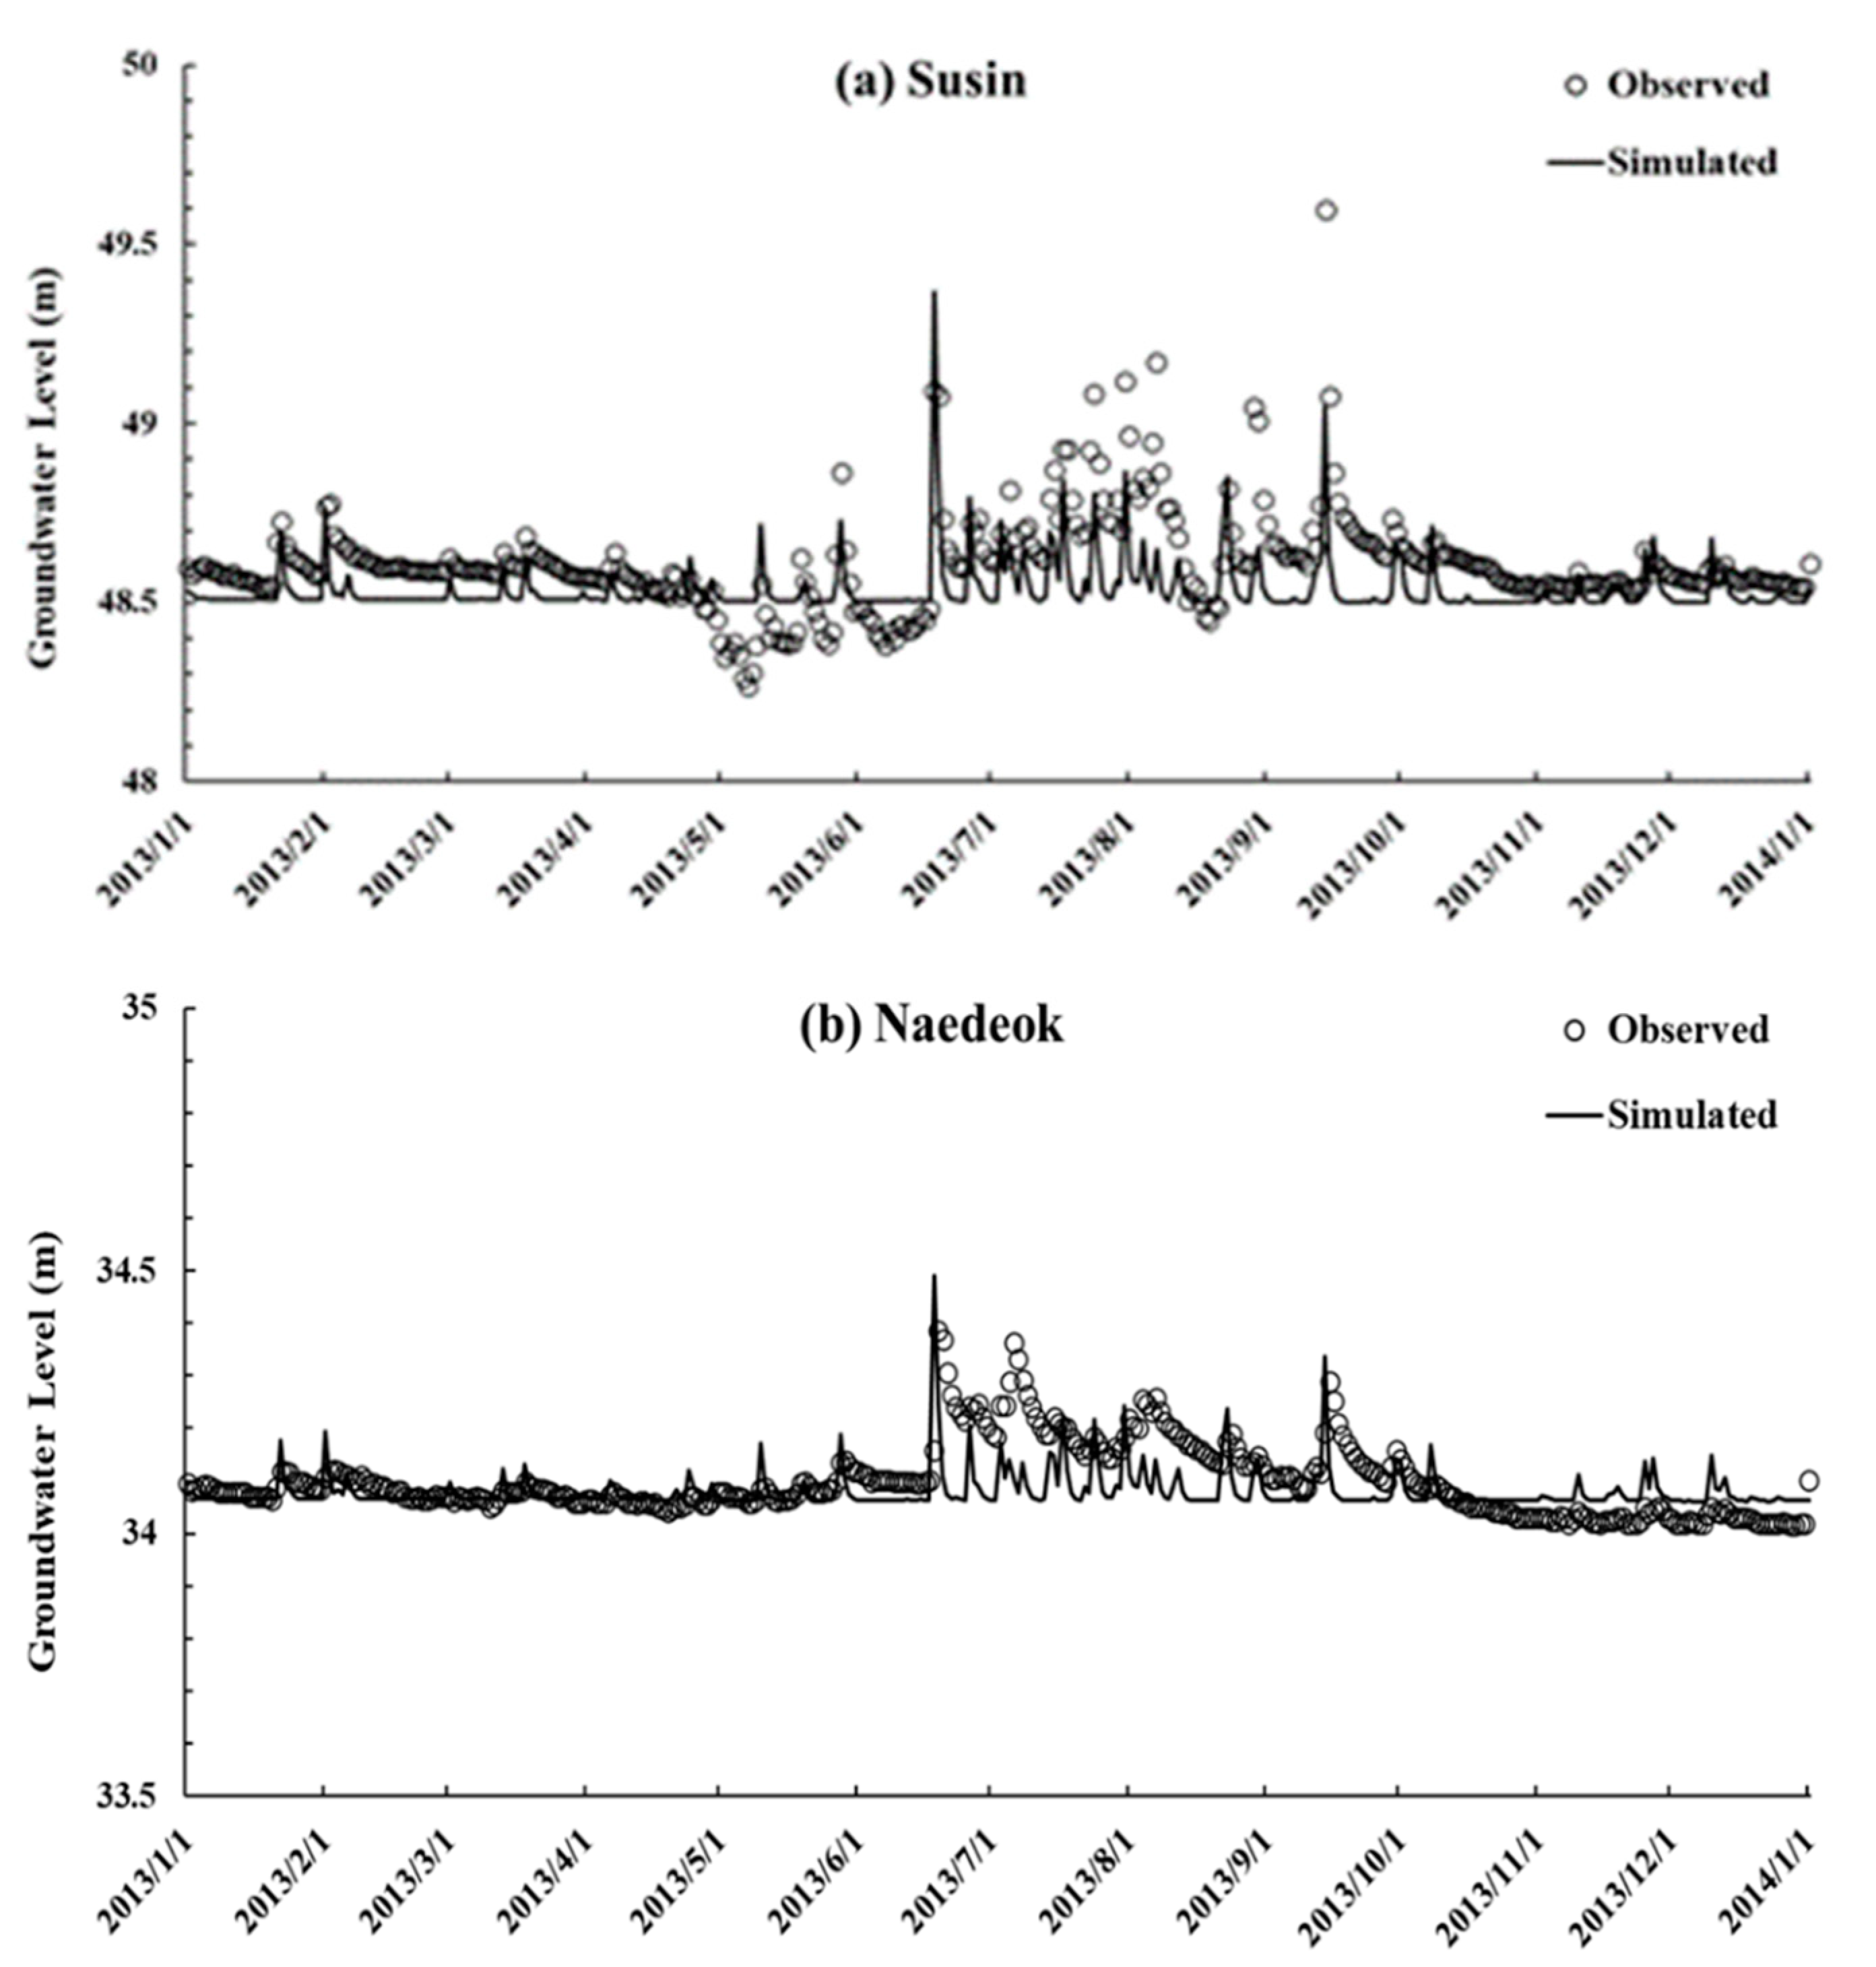
Figure 4 compares the simulated and observed groundwater levels at daily time scale for two groundwater monitoring wells. The RMSE between the daily observed groundwater levels and corresponding simulated levels for the Susin and Naedeok monitoring wells are equal to 1.12 m and 0.25 m, respectively, while the RMSE between the daily observed and simulated groundwater levels for all the 10 monitoring wells ranges from 0.25 m to 2.06 m. As shown in
Figure 4, the groundwater levels at the two wells are greatly influenced by stream-aquifer interactions. The model can capture the fluctuation pattern of groundwater level at daily time scale.
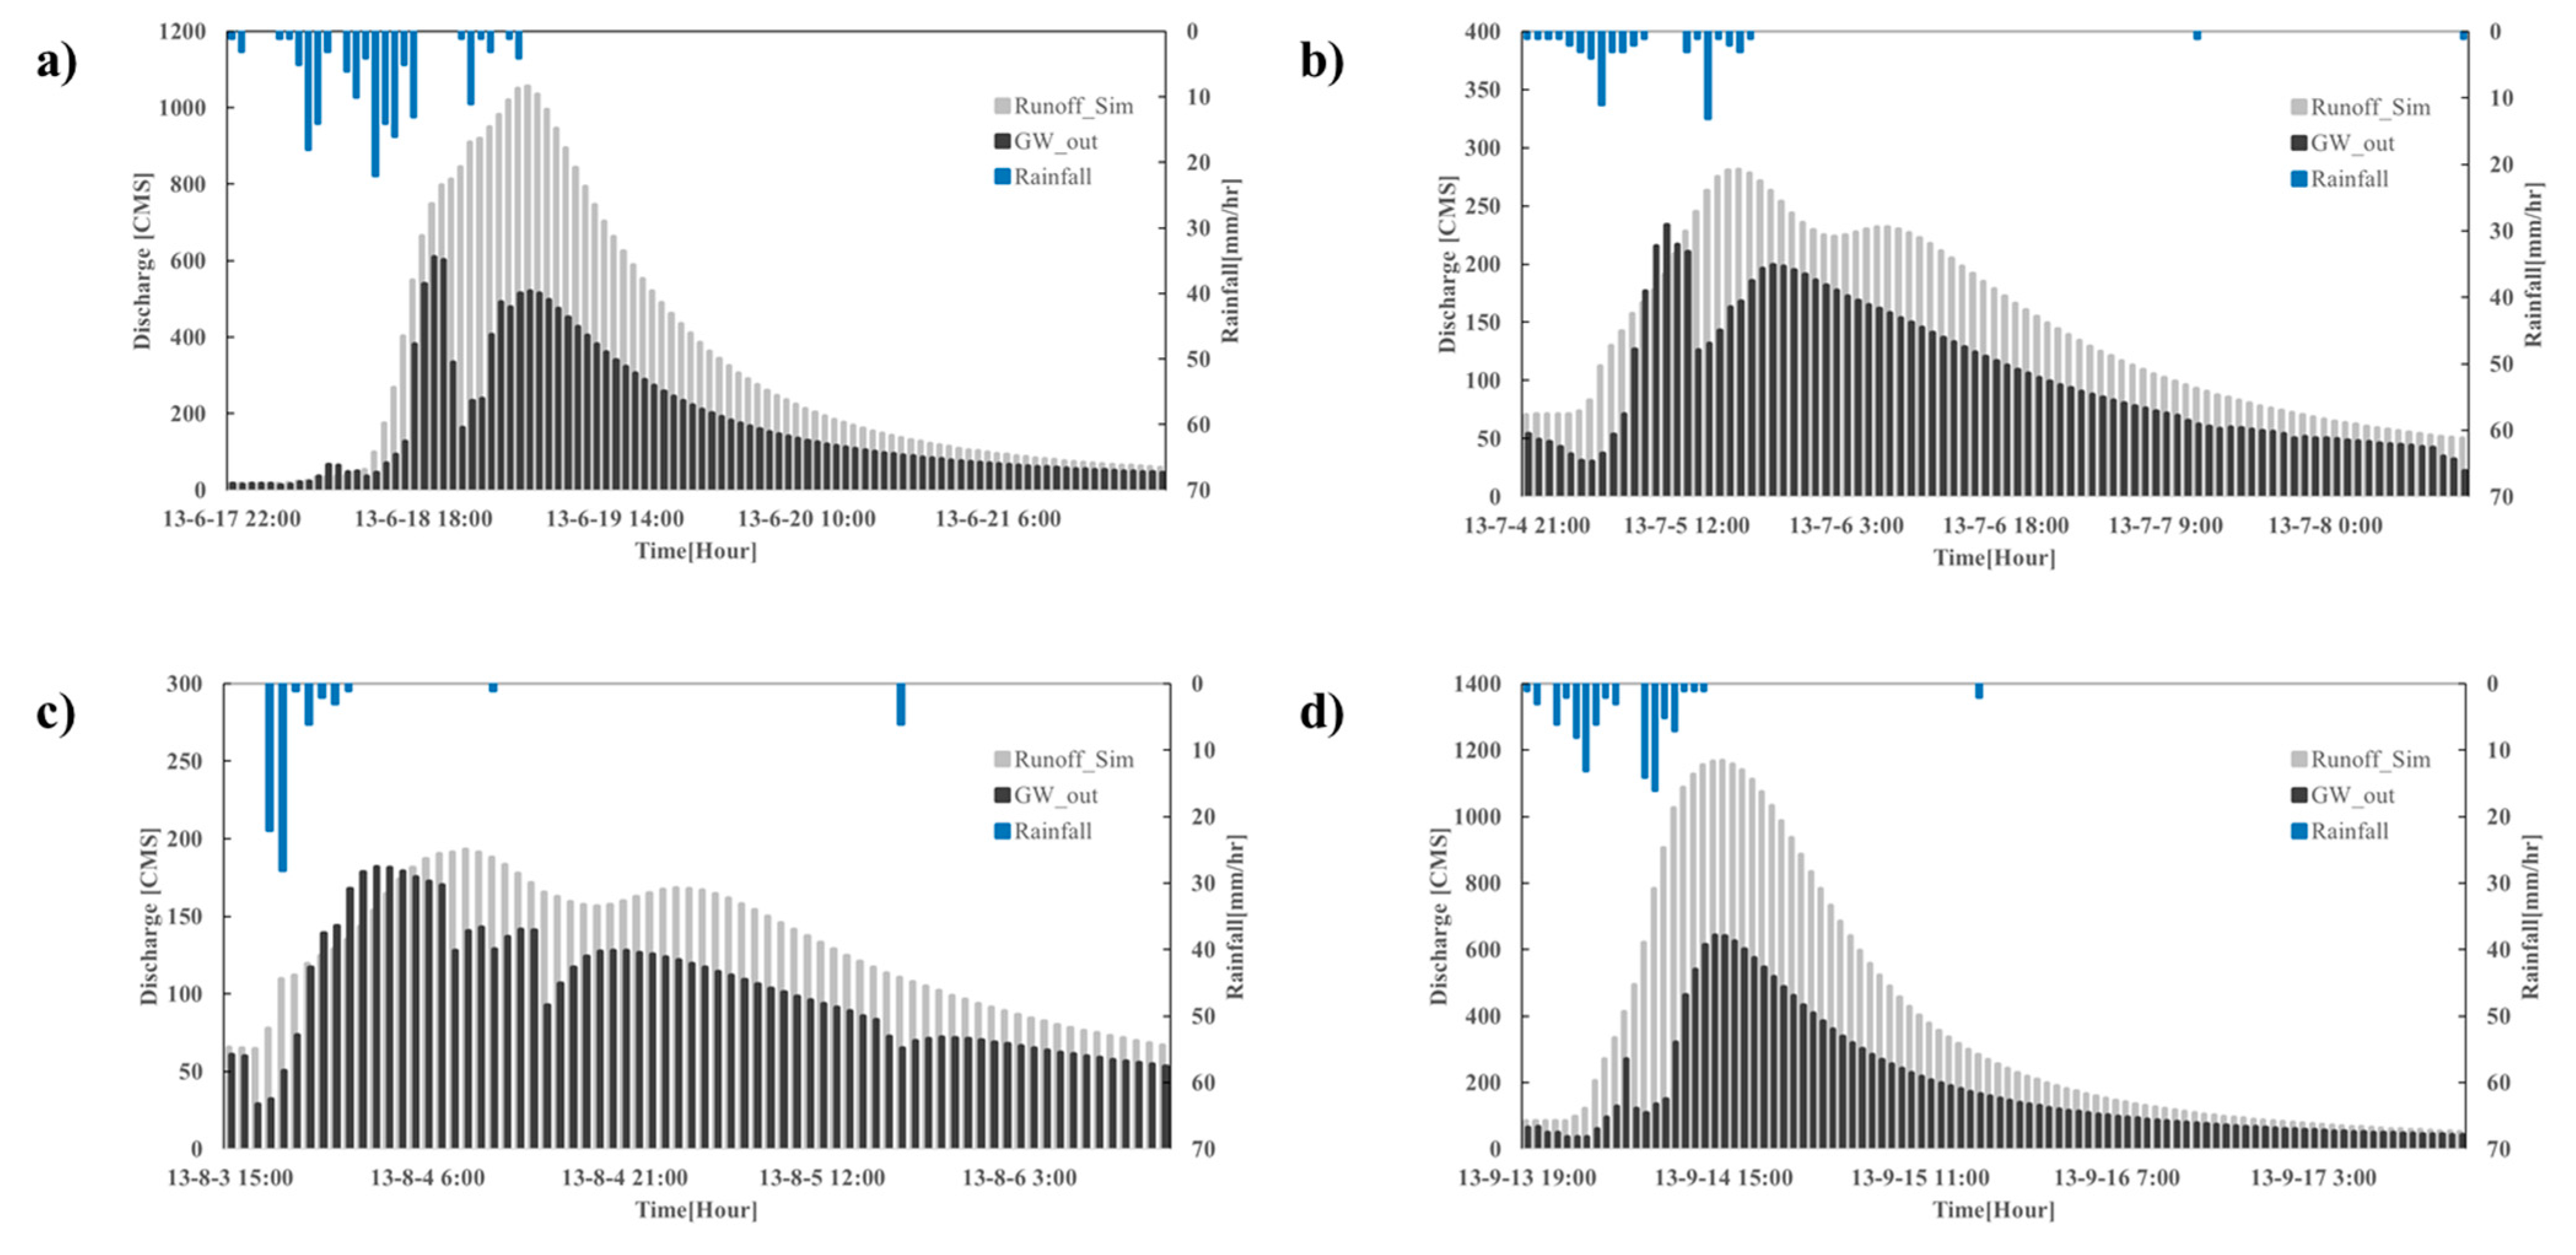
Figure 5 indicates the surface and groundwater interactions during the flood events. This study selects the four flood events in 2013. The details of flood events in this study are described in
Table 2. The cumulated rainfall events are shown in
Table 2 and the hourly rainfalls are illustrated as the blue bar graphs in
Figure 5. Entire flood events in
Figure 5a–d show that the groundwater discharges to the stream flow are highly related to the rainfall. In addition, the rising and falling limbs in stream hydrograph are generally affected from the variability of groundwater discharge to the stream. The responses of the GW_out and stream runoff indicate that stream runoff is faster response than the GW_out from the rainfall. The flood events in
Figure 5 have the multiple rainfall events except
Figure 5c. The GW_out in
Figure 5 shows that GW_out patterns affect the peak discharge in the stream. For example, GW_out in
Figure 5a,c showa similar patterns, and these two events have the multiple peaks in stream discharge. Both events also show that GW_out is dramatically reduced after the first peak of GW_out. The variabilities of GW_out are causing to mitigate the peak stream discharge and make multiple peaks in the streamflow hydrograph. However, the event 4 in
Figure 5d indicates the different fluctuation of GW_out to the event 1 and 2. The fluctuation patterns of GW_out in event 1 and event 4 show that the peak stream discharge of event 4 is approximately 100 m3/s larger than event 1 although the rainfall is smaller than event 1.
5. Conclusions
This study tested the HEIFLOW model with the hourly time step at the Miho catchment in South Korea. The integrated surface and groundwater model for the flood event is successfully verified with the 0.64 NSE. The major conclusions of this study are as follows.
First, the HEIFLOW enables complex interactions to be simulated between the groundwater domain and stream. The model verification results indicate acceptable simulation in entire flood events. Second, the hourly flood simulation employing the HEIFLOW shows potential as one of the methods for the flood risk management in South Korea. These also have the advantage of understanding the interactions between surface and groundwater domains. Finally, the results indicate that the hydrological response at the Miho catchment is highly affected by the groundwater conditions. The interactions between surface water and groundwater domains should be fully considered to mitigate the water hazards at the catchment scale.
This study is the first application of HEIFLOW model in South Korea. Thus, further study will test the HEIFLOW model in other catchments to generalize our suggestion. It is also required to test this flood simulation into the recent historical severe flood event and regions in South Korea.
Author Contributions
Conceptualization, J.J. and Y.T.; Methodology, J.J. and Y.T.; Writing—Original draft, J.J.; Writing—Review and editing, Y.T. All authors have read and agreed to the published version of the manuscript.
Funding
This research was funded by the National Natural Science Foundation of China (No. 41890852 and No. 42071244).
Acknowledgments
The data used in this study, if not collected by the authors or acknowledged in the text, were provided by the Water Management Information System (WAMIS), Korea Meteorological Administration (KMA) and Groundwater Information Service (GIMS).
Conflicts of Interest
The authors declare no conflict of interest.
References
- Gaume, E.; Bain, V.; Bernardara, P.; Newinger, O.; Barbuc, M.; Bateman, A.; Blaškovičová, L.; Bloschl, G.; Borga, M.; Dumitrescu, A.; et al. A compilation of data on European flash floods. J. Hydrol. 2009, 367, 70–78. [Google Scholar] [CrossRef] [Green Version]
- Yu, X.; Moraetis, D.; Nikolaidis, N.P.; Li, B.; Duffy, C.; Liu, B. A coupled surface-subsurface hydrologic model to assess groundwater flood risk spatially and temporally. Environ. Model. Softw. 2019, 114, 129–139. [Google Scholar] [CrossRef]
- Joo, J.; Kjeldsen, T.; Kim, H.-J.; Lee, H. A comparison of two event-based flood models (ReFH-rainfall runoff model and HEC-HMS) at two Korean catchments, Bukil and Jeungpyeong. KSCE J. Civ. Eng. 2014, 18, 330–343. [Google Scholar] [CrossRef]
- Acreman, M.; Holden, J. How Wetlands Affect Floods. Wetlands 2013, 33, 773–786. [Google Scholar] [CrossRef] [Green Version]
- Kreibich, H.; Thieken, A.; Grunenberg, H.; Ullrich, K.; Sommer, T. Extent, perception and mitigation of damage due to high groundwater levels in the city of Dresden, Germany. Nat. Hazards Earth Syst. Sci. 2009, 9, 1247–1258. [Google Scholar] [CrossRef] [Green Version]
- Feldman, A.D. Hydrologic Modeling System HEC-HMS: Technical Reference Manual; US Army Corps of Engineers Hydrologic Engineering Center: Washington, DC, USA, 2000.
- Kjeldsen, T.R. The Revitalised FSR/FEH Rainfall-Runoff Method; Center for Ecology & Hydrology: Wallingford, Oxfordshire, UK, 2007. [Google Scholar]
- Markus, M.; Angel, J.R.; Yang, L.; Hejazi, M.I. Changing estimates of design precipitation in Northeastern Illinois: Comparison between different sources and sensitivity analysis. J. Hydrol. 2007, 347, 211–222. [Google Scholar] [CrossRef]
- McColl, C.; Aggett, G. Land-use forecasting and hydrologic model integration for improved land-use decision support. J. Environ. Manag. 2007, 84, 494–512. [Google Scholar] [CrossRef] [PubMed]
- Ali, M.; Khan, S.J.; Aslam, I.; Khan, Z. Simulation of the impacts of land-use change on surface runoff of Lai Nullah Basin in Islamabad, Pakistan. Landsc. Urban Plan. 2011, 102, 271–279. [Google Scholar] [CrossRef]
- Du, J.; Qian, L.; Rui, H.; Zuo, T.; Zheng, D.; Xu, Y.; Xu, C.-Y. Assessing the effects of urbanization on annual runoff and flood events using an integrated hydrological mod-eling system for Qinhuai River basin, China. J. Hydrol. 2012, 464, 127–139. [Google Scholar] [CrossRef]
- Padilla, F.; Hernández, J.-H.; Juncosa, R.; R.-Vellando, P. Modelling integrated extreme hydrology. Int. J. Saf. Secur. Eng. 2016, 6, 685–696. [Google Scholar]
- Bernard-Jannina, L.; Britob, B.; Sun, X.; Jauchb, E.; Nevesb, R.; Sauvagea, S.; Sánchez-Péreza, J.-M. Spatially distributed modelling of surface water-groundwater exchanges during overbank flood events–a case study at the Garonne River. Adv. Water Resour. 2016, 94, 146–159. [Google Scholar] [CrossRef] [Green Version]
- Leavesley, G.; Lichty, R.; Troutman, B.; Saindon, L. Precipitation-runoff modeling system; user’s manual. Water-Resour. Investig. Rep. 1983, 83, 4238. [Google Scholar]
- Harbaugh, A.W. MODFLOW-2005, the US Geological Survey Modular Ground-Water Model: The Ground-Water Flow Process; US Department of the Interior: Washington, DC, USA; US Geological Survey: Reston, VA, USA, 2005.
- Tian, Y.; Zheng, Y.; Han, F.; Zheng, C.; Li, X. A comprehensive graphical modeling platform designed for integrated hydrological simulation. Environ. Model. Softw. 2018, 108, 154–173. [Google Scholar] [CrossRef]
- Joo, J.; Tian, Y.; Zheng, C.; Zheng, Y.; Sun, Z.; Zhang, A.; Chang, H. An integrated modeling approach to study the surface water-groundwater interactions and influence of tem-poral damping effects on the hydrological cycle in the Miho catchment in South Korea. Water 2018, 10, 1529. [Google Scholar] [CrossRef] [Green Version]
| Publisher’s Note: MDPI stays neutral with regard to jurisdictional claims in published maps and institutional affiliations. |
© 2021 by the authors. Licensee MDPI, Basel, Switzerland. This article is an open access article distributed under the terms and conditions of the Creative Commons Attribution (CC BY) license (https://creativecommons.org/licenses/by/4.0/).


