1. Introduction
Occurrences of high waters defined by maximal water level or water wave flow caused by numerous factors that could initiate floods are described in [
1,
2]. High water studies through rainfall–runoff modeling are important for water resource management, water system design, real-time forecasting, flood design [
3], and the construction of hydro-technical objects [
4]. Their frequencies/occurrences are used as input for hydrological forecasts, i.e., for protection and risk estimation of flooding. In recent years, Ref. [
3] stated that there are 64 different hydrological models, though not all are suitable for every basin. For example, a continuous rainfall–runoff model is used operationally in the Croatian Meteorological and Hydrological Service, named the Sava Super Model [
5], which also includes the research area of this paper. Other models used for determining the peak discharge are directed at specifying the characteristics of the Design Hydrograph [
6]. However, the model designed in this paper is not similar to any of the mentioned models, although it uses Equation (3) of the Srebrenović unit hydrograph for peak discharge [
1,
2]. This emphasizes the need for an individual approach to almost every catchment area.
According to Žugaj [
1], different factors influence runoff. They can be categorized into five major groups: geographical, geological, biological, climatological, and anthropological factors. In this paper, we confine the model to some geographical (size and slope of catchment area), geological (porosity of soils), and climatological (precipitation) factors.
The city of Zagreb is vulnerable to Sava River floods in its lower laying areas and to flash floods from the streams that flow towards the northern areas of the city from Medvednica Mt. [
7]. A total of 19 retentions were constructed along Medvednica’s streams to protect the city from the flashy flows of the 100-year recurrence discharges. The upper part of Kašina Stream is a rarity among Medvednica’s streams in that it has no dam nor retention; thus, it can react naturally to precipitation. This is why it was selected for this research.
Here, we show how the basic POS methodology has been adapted for application in a hydrological flood probability model, conserving its simplicity. The presented probability model, with small corrections, could be applied to the entire area of this mountain.
2. The Study Area
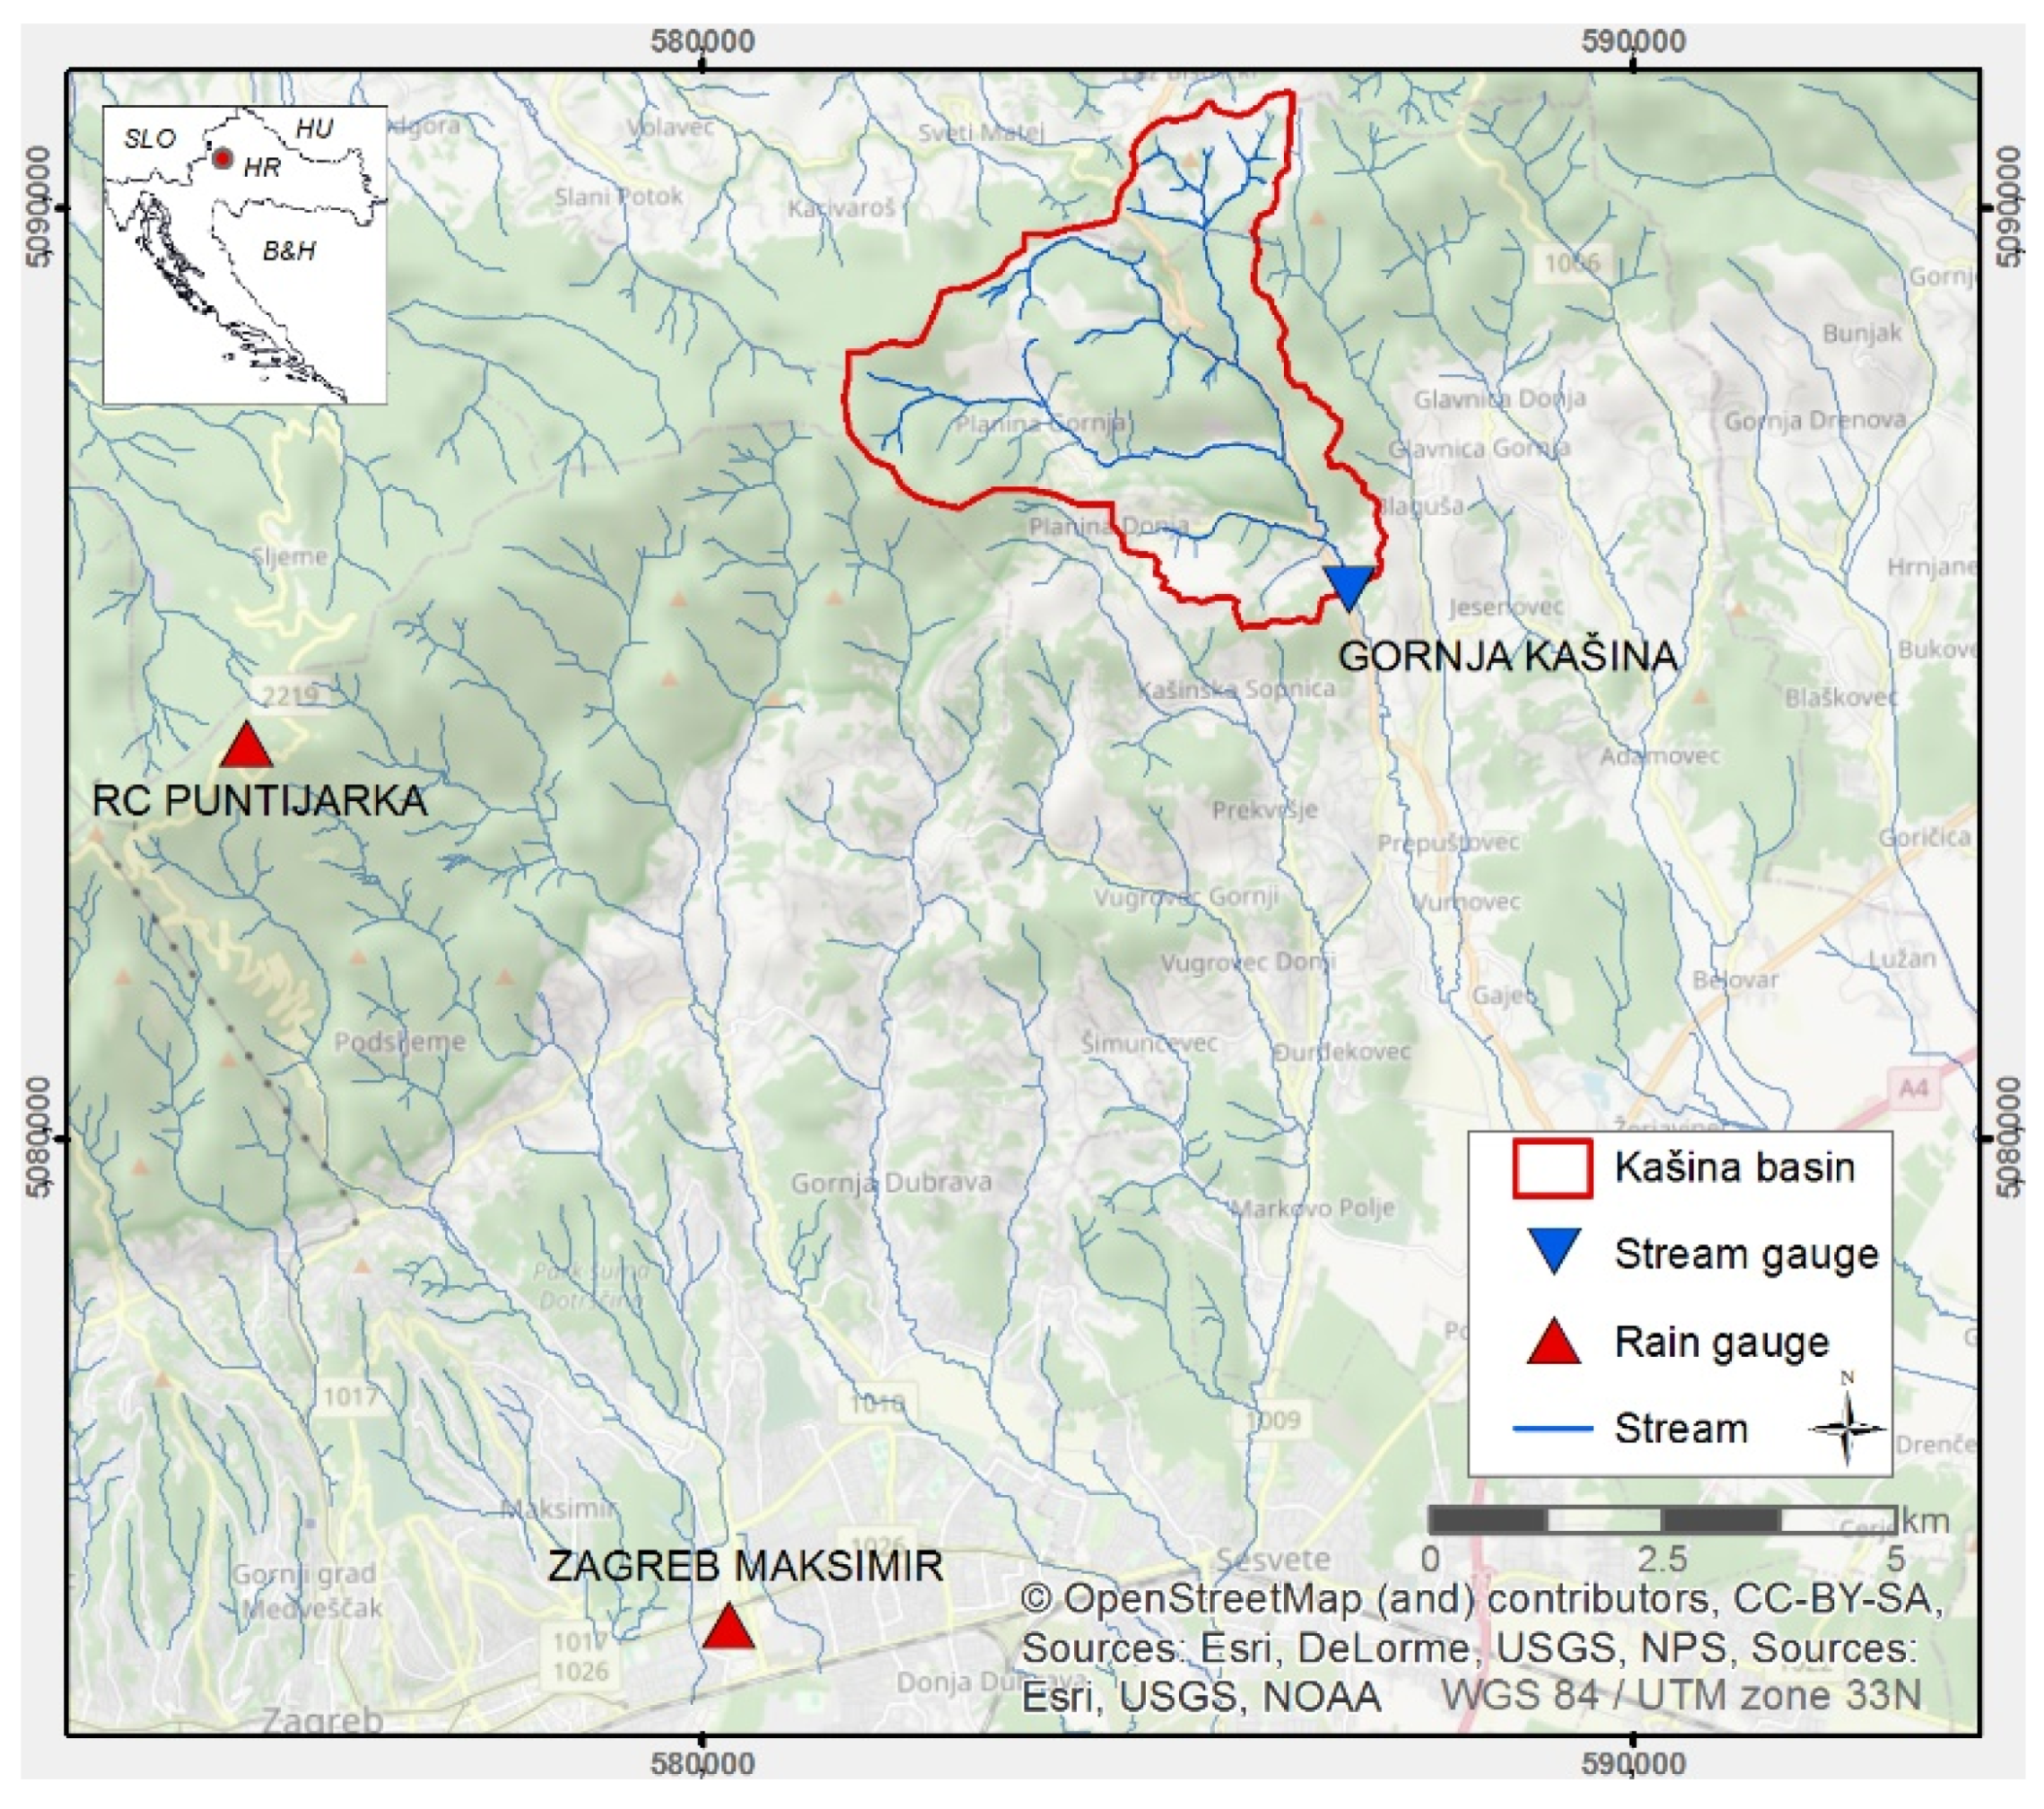
The study area of the Kašina Basin is situated in the central northwestern part of Croatia, north of the city of Zagreb (see
Figure 1) along the southeastern hills of Medvednica Mt. The basin covers 17.1 km
2, with altitudes of 195–625 m a.s.l. Its area covers the hilly part of the Kašina Basin, upstream from the “Gornja Kašina” stream gauge (586954.886 E, 5085893.794 N, 195.087 m a.s.l. (WGS84/UTM33N)). The drainage network consists of a few mountainous streams that emerge just below the main Medvednica Mt. ridge. The Kašina Stream starts after the confluence of the 3.7 km long Suhodol and 2.5-km long Šokot Stream. There are two additional small right tributaries—Vukov Dol, 3.2 km long, and Bjelak, 1.9 km long. The Kašina Stream by itself has a length of 3 km to the Gornja Kašina stream gauge.
A measuring instrumentation network that covers the studied watershed consists of two automatic meteorological stations in the vicinity—Zagreb Maksimir (123 m a.s.l.) in the eastern part of the city, RC Puntijarka at Medvednica Mt. (991 m a.s.l.)—and one stream gauge—Gornja Kašina (see
Figure 1).
The climate of the study area is assigned to a warm temperate climate (Cfb in the Köppen–Geiger climate classification system) [
8]. The long-term (1981–2015) climatological data for Zagreb Maksimir and Puntijarka meteorological stations are given in
Table 1.
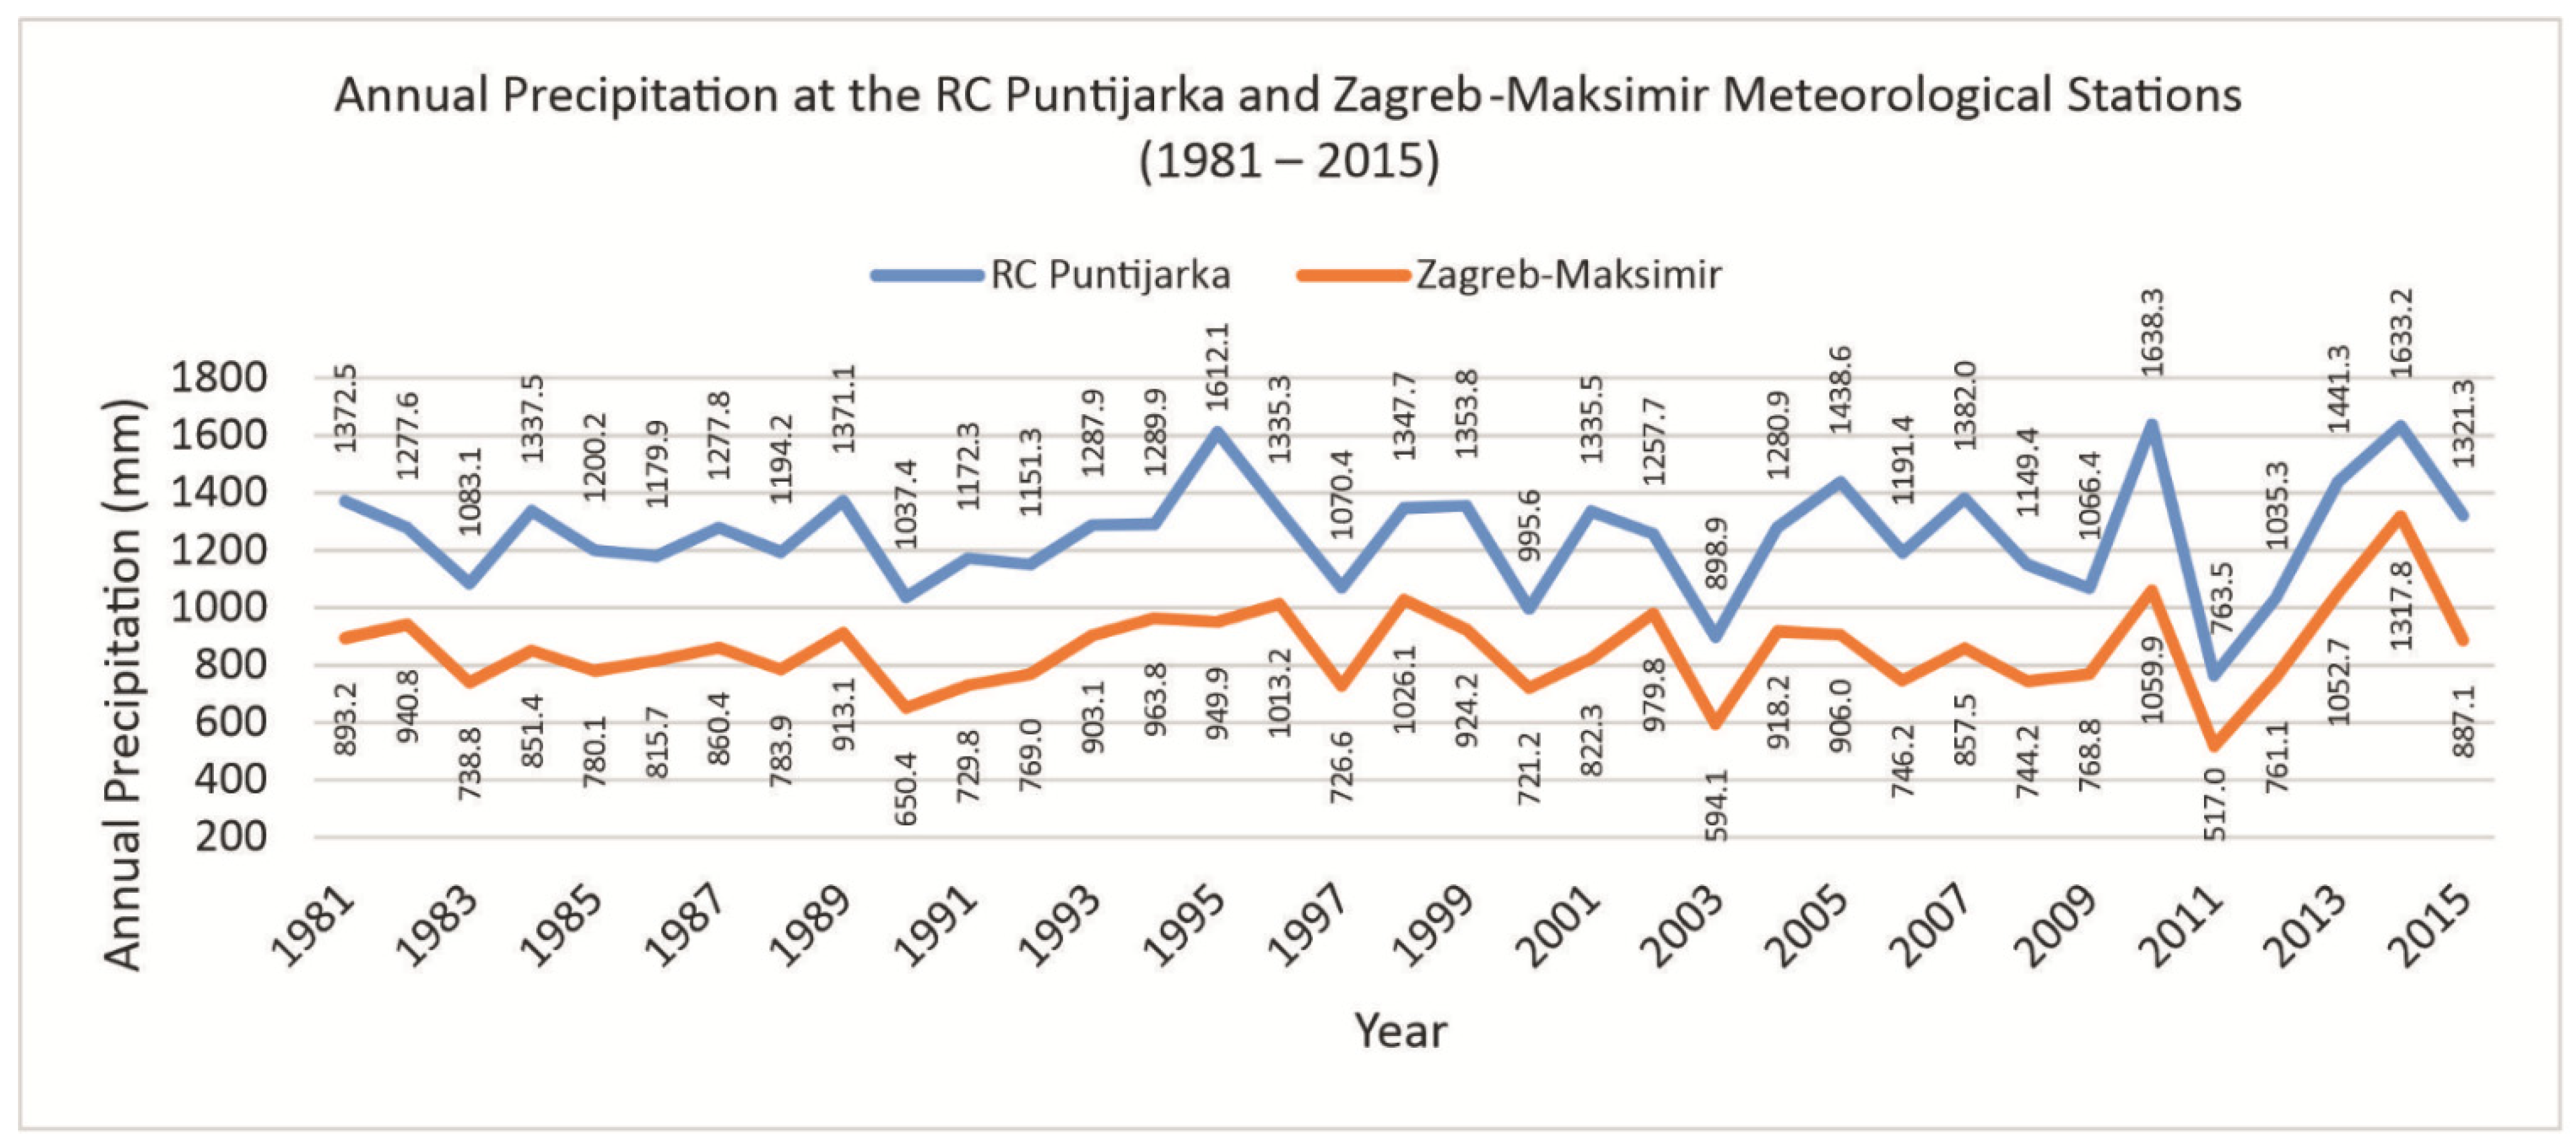
RC Puntijarka has lower temperatures and higher precipitation than Zagreb Maksimir because of its significantly higher altitude. The warmest month was July and the coldest month was January at both meteorological stations. Most precipitation occurs during the warm period of the year (April–November) with two precipitation peak months—June and September. The year of 2014 gave the maximal annual precipitation of 1317.8 mm at Zagreb Maksimir but also the maximal monthly recorded precipitation in February, May and June. During the period of 1981–2015, the five “wet” years with precipitation above normal were 2014, 2010, 2013, 1998, 1996, while the years of 2011, 2003, 1990, 2000, 1997 were the five “dry” years, with precipitation below average. A similar pattern was recorded at RC Puntijarka where five “wet” years, with precipitation above normal were 2014, 2010, 1995, 2013, 2005, etc. and the five driest years were 2011, 2003, 2000, 2012 and 1990, with precipitation below average.
CORINE database for Land Cover (CLC 2018) GIS vector layer [
9] was used to determine the land use data for the Kašina catchment. There were six CLC classes identified within the study area of which broad-leaved forest covers its majority with 61.8%, transitional woodland/shrub 12.4% and land principally occupied by agriculture, with significant areas of natural vegetation covering 9.5%.
Lithologically, there were [
10,
11,
12,
13] metamorphic diabase and gabbro (Paleozoic) transgressively overlaid with conglomerate (Miocene), including alternations of clay, marl, limestone and coal.
Slišković and Šarin [
14] described permeable deposits in detail and listed impermeable ones. The mountain creek sediments are generally weakly permeable, and intrusive, highly metamorphic and clayey-marlitic rocks are impermeable. Miocene alternation of clastic and clastic-carbonate sediments [
14,
15] are weakly permeable without significant water reservoirs but, generally, the permeability of unconsolidated and weakly consolidated alluvium depends on granulometry.
Soil types in the analyzed basin could not be extracted in detail because large scale pedological maps do not exist. The most applicable were available in [
16,
17,
18]. The following soils were recognized:
rendzina on marl (flysch) or soft limestones;
rendzina on dolomite and limestone;
acid, brown soil over metamorphites and clastites;
brown soil over dolomite.
Those soils are automorphic, where wetting happens solely by precipitation in free filtration through soil over a relatively short period [
19]. Rendzina, as soil, is formed over weathered rocks in different climates, but always with high porosity, drainage and weak water retention capacity, over a depth of about 40 cm [
19,
20]. Acid soil is formed over acidic substrates in mountain ranges with humid or peri-humid climates. It could be with humus, loess, and/or exposed podzolic soil [
19]. Brown soil is developed over the carbonates, in a forest environment, on different altitudes, and is relatively shallow [
20], with loess and loam components [
19].
3. Materials and Methods
The methodology of flooding risk estimation applied here is estimated adapting the general probability of success (POS), which is explained and used in numerous papers, e.g., [
21,
22,
23,
24,
25,
26,
27,
28,
29,
30]. The POS is a simple, flexible, robust, deterministical statistical method developed for the probability calculation of a selected statistical event, based on the multiplication of each method category selected to describe an observed event. The categories are statistical independent events (e.g., [
23,
27]). The methodology was developed primarily for hydrocarbon systems, but was later adapted in different estimations of numerous geological systems. The POS calculation is based on Equation (1):
where:
POS—total probability of an observed geological event,
p—probability of a particular geological category,
1–n—number of geological categories.
Data are derived and a model had been examined for the flash/urban flood that happened in the city of Zagreb (Croatia), during the night of 24–25 July 2020, and compared with data collected in the same period on a hydrological station located upstream, on Medvednica Mt.
The model categories are selected according to geological and hydrological data available for the basin. The number and type are derived and simplified according to the scheme that describes total flow using components [
2]. Consequently, the boundary conditions are determined from data on:
3.1. Precipitations in Basin and Medvednica Mt.
Data are taken from annual records collected on two automatic meteorological stations: (1) “Zagreb-Maksimir” and (2) “RC Puntijarka”; both for the period 1981–2015 (see
Figure 2). Calculation of the annual mean showed a value of 1052.4 mm for the Kašina Stream basin.
3.2. Flow and Flow Section of the “Gornja Kašina” Hydrological Station
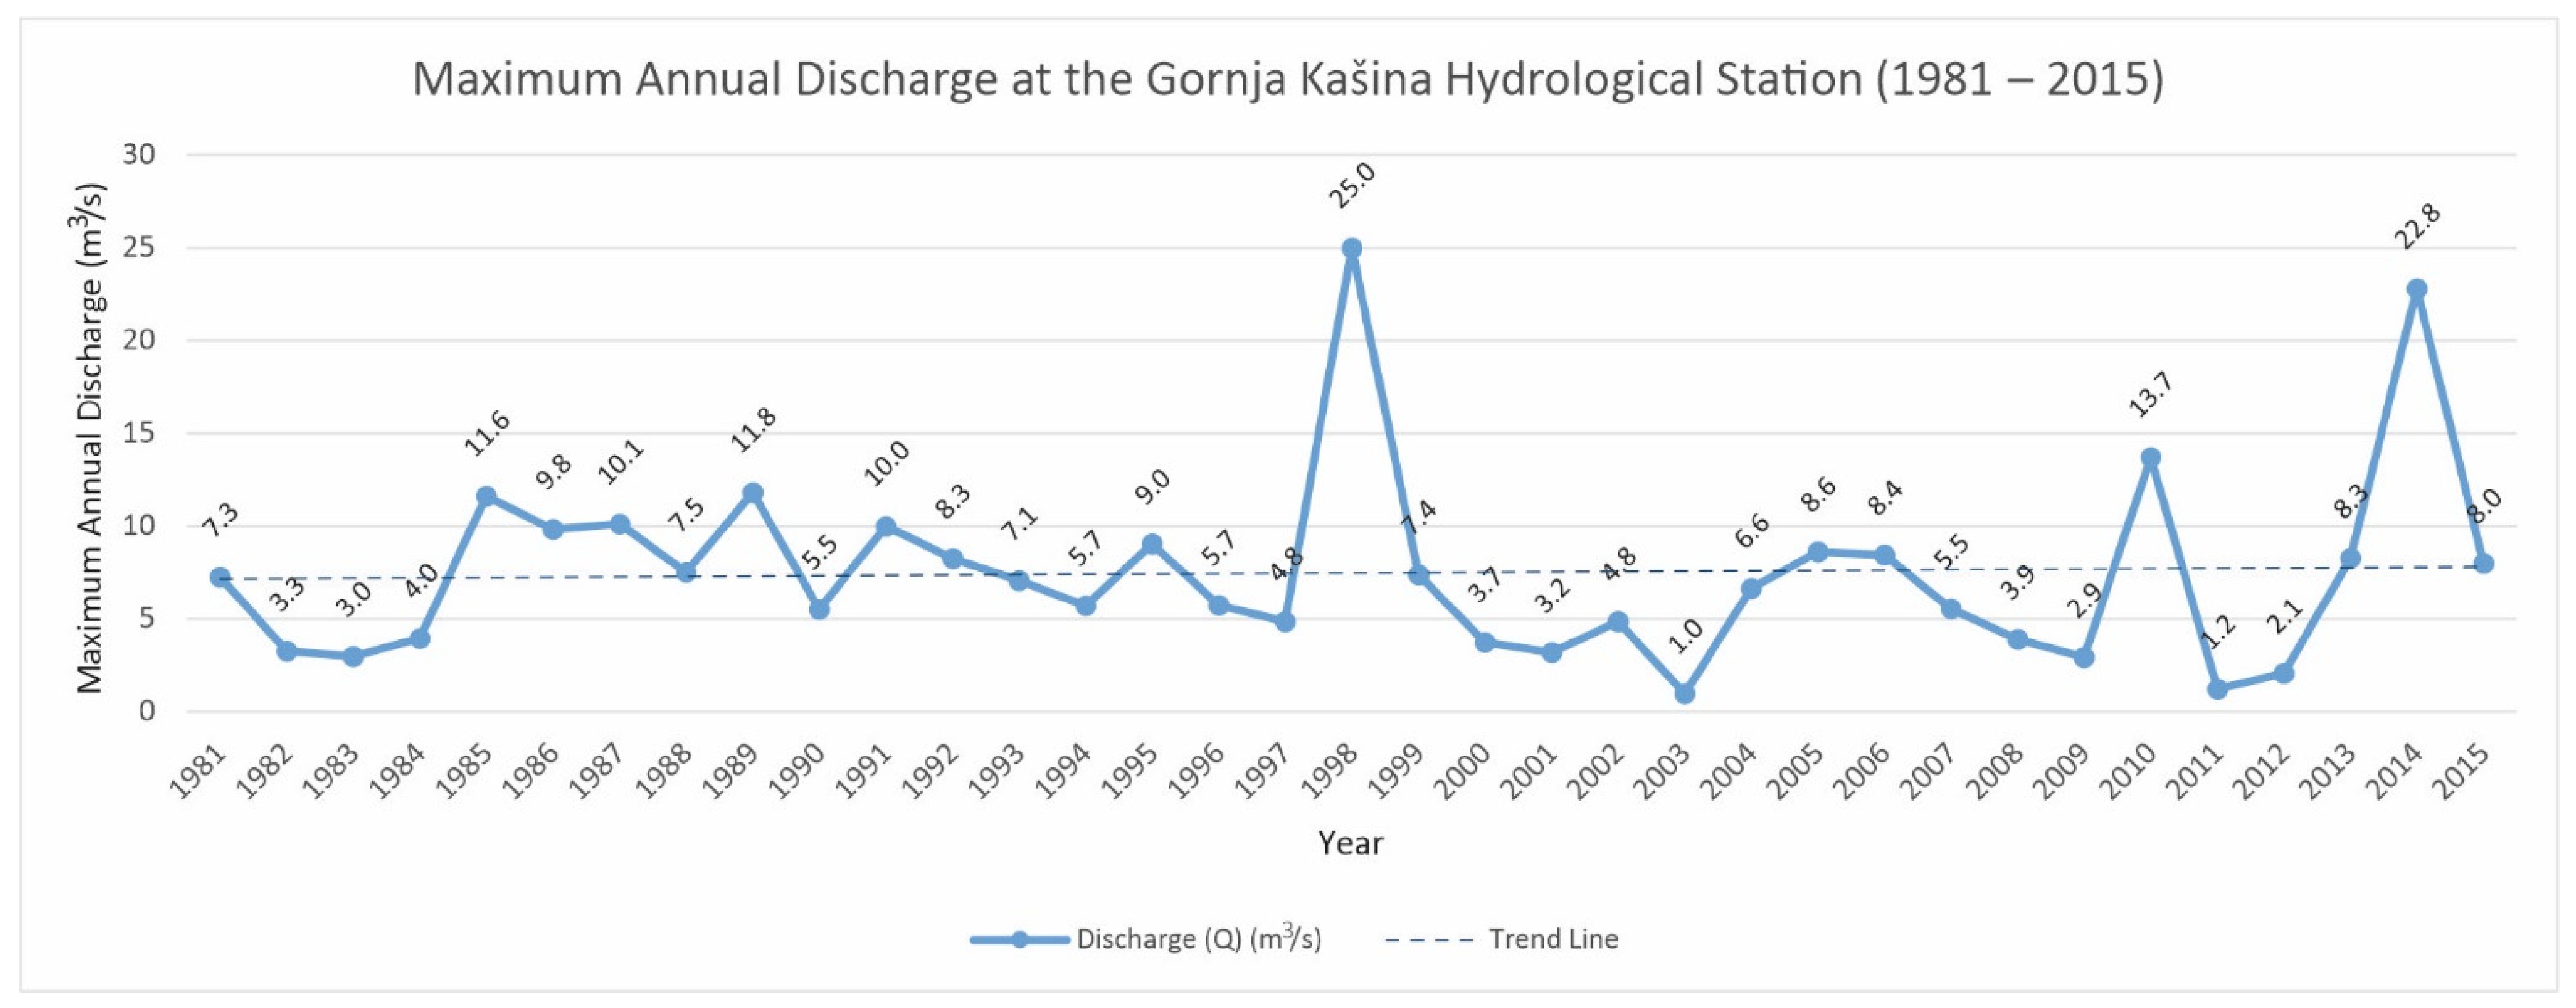
“Gornja Kašina” hydrological station has the discharge measured for the periods 1980–2015 and 2017–recent. The discharges are used for the calculation of the discharge curve as a function of water-level Q = f(H). We analyzed maximal annual discharge 1980–2015 (see
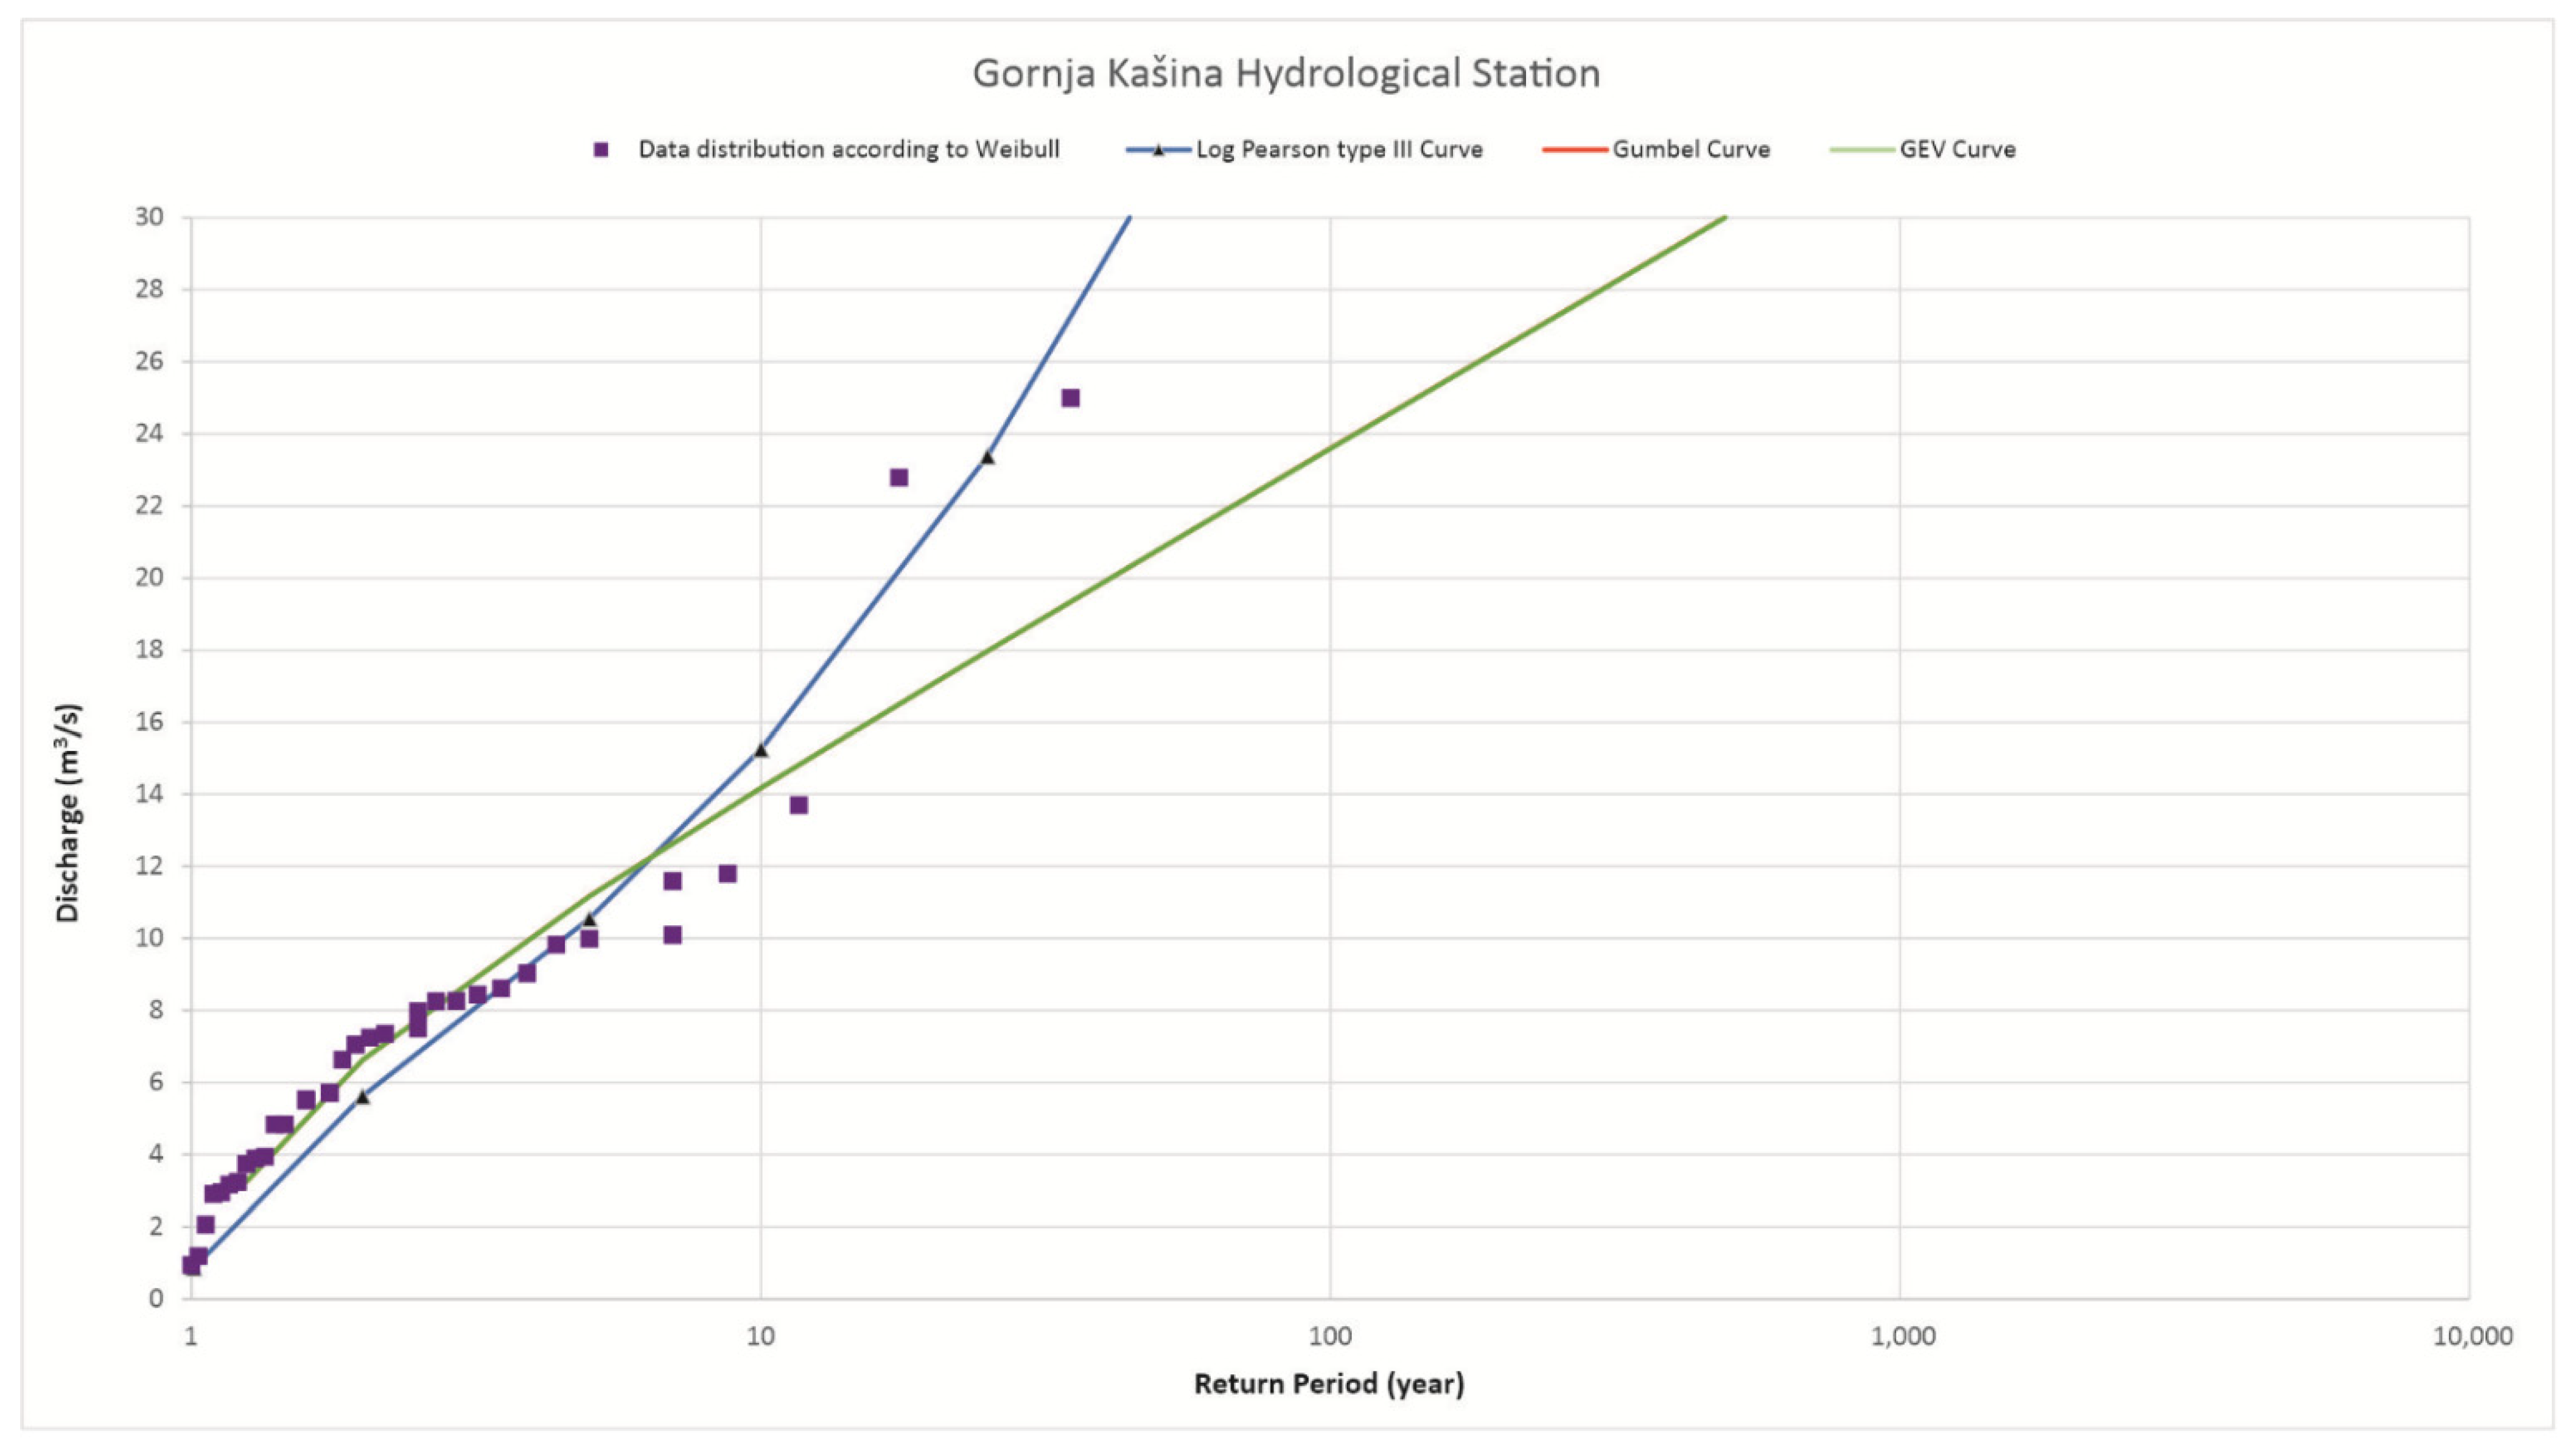
Figure 3), with an observed weak positive trend of discharge. Based on annual maximums, three distribution curves were calculated and could be applied as return period (RP) sources for maximal discharges (see
Figure 4). All three successfully approximated smaller discharges of lower RP, but we selected the Log Pearson type III curve as the most appropriate due to its good approximation of discharges with longer RP also. Consequently, the discharge of 10-year RP (Q
10) is 15.26 m
3/s, and the discharge of 100-year RP (Q
100) is 41.39 m
3/s.
The vertical section of the “Gornja Kašina” stream gauge (see
Figure 5) shows the marginal relative water-level just before start of overflowing—118 cm, with a corresponding bankfull discharge of 15.44 m
3/s.
Figure 5 also shows marginal levels of high and medium water levels.
3.3. Soil Types and Texture Classes
As previously mentioned, the basin included four types of soils, dominantly automorphic. Systematic soil units were described in [
16] including texture class and ecological depth (descriptive). Different, but also quantitative, depths are given by [
31]. The applied depths in this paper are shown in
Table 2.
3.4. Description of Categories
Malvić and Velić [
23] determined 5 geological categories with accompanied probabilities, as 5 independent statistical events. Based on such an approach, here 4 hydrological categories are outlined that could describe flooding from components of total flow [
2]. The categories shown in
Table 3 “Total precipitation” and “Water Flow” are defined from 35-year long input data. The categories “Basement” and “Maximum water capacity in soil” are determined from the cited references.
3.4.1. Category “Basement”
This category described one of the most important geological–pedological factors for flow/drain conditions. Here, it is considered that the basement is defined as a rocky base for water flow (see
Figure 6). Moreover, this category are included two subcategories—“Porosity” and “Soil depth” as shown in
Table 4.
The subcategory “Porosity” was defined according to [
33] as soils evaluated in four types according to this variable. The event with
p = 1.0 corresponds to the very low porosity soil basement (<30%). The
p = 0.75 corresponds to the low value 30–45%,
p = 0.5 to the medium value 45–60%,
p = 0.25 to the high value of >60%. If porosity is unknown
p is set at 0.05.
The subcategory “Soil depth” is defined according to [
31], where soil depths are divided into four sections. Consequently,
p = 1.0 corresponds to (very shallow) basement depths <25 cm,
p = 0.5 to (shallow) 25–50 cm depths,
p = 0.5 to (deep) 50–75 cm depths,
p = 0.25 to (very deep) >75 cm depths, and
p = 0.05 for events with no data.
3.4.2. Category “Maximum Water Capacity in Soil”
The category “Maximum Water Capacity in Soil” is introduced with the purpose of representing the marginal quantity of precipitations that could be infiltrated (saturated) into soil before the subsurface and surface flows have been activated. After [
34] infiltration, it depends on constants like soil texture and variables such as soil moisture. The second is expressed as the water quantity (i.e., height of the water column in mm) that exists in the soil in a 1 m deep column. If the soil is completely saturated with water, it has reached maximal water capacity. Saturation can change over the time and this is why it can hardly be predicted. Consequently, in this model, the saturation at the beginning was set on zero, i.e., the soil was considered as dry.
Ranges of [
35] maximal water capacity in soil based on textures are given in
Table 5 and
Table 6. The value
p = 1.0 is valid for a capacity of 21–42 mm/m, when precipitations are sporadically infiltrated and mostly go (through the subsurface or over the surface) towards flow as shown in
Table 5. The value
p = 0.75 is appended to the interval 43–83 mm/m and
p = 0.5 is appended to the interval 84–125 mm/m.
p of 0.25 is appended to the interval 125–167 mm/m and if the capacity value is unknown, then
p = 0.05.
3.4.3. Category “Total Precipitation”
This category is defined as part of total outflow/runoff created from effective precipitation. It is divided in two subcategories—“Quantity” and “Duration”. All the presented equations are empirical.
“Quantity” is the total precipitation measured on the ”Zagreb–Maksimir” and “RC Puntijarka” meteorological stations. The marginal value
p = 1 is determined by the value of precipitation needed for a discharge of 15.44 m
3/s to occur. It is calculated by Equation (2) (Srebrenović’s equations) taken from [
1]:
where:
Pe—effective precipitation in basin (mm);
α—flow coefficient.
Effective precipitation in the basin is calculated using Equation (3) [
1]:
where:
V—volume of water wave (m3);
A—basin area (m2).
The volume of water wave is defined according to Srebrenović Equation (4) [
1]:
where:
Qm—maximal flow of the water wave (m3/s);
τ—period of surface water collecting, i.e., time of water wave creation (h);
ψ—function ratio between base and maximum flow φ.
The baseflow is not accounted for. Consequently, the variable ψ is set to 3744 [
1]. The time of surface collecting is calculated after Equation (6) and, using the maximal flow (15.44 m
3/s), time of surface collecting (3.11 h) and ψ (3744.0) in Equation (4), the wave volume is 179,780.89 m
3. Applying that value in Equation (3), the effective precipitation quantity (P
e) is 0.0105 m (10.5 mm). The runoff coefficient (α) can be calculated using Srebrenović’s Equation (5) [
1]:
where:
p—back-period (years);
β—factor depending on permeability, afforestation, etc. (values ranging 1–3).
The factor β for low-permeability and low-vegetation soils is about 1, while for permeable and rich-vegetation it is 3. As the Kašina Stream basin is weakly populated, and located in forested parts of Medvednica Mt., the applied factor is β = 2. The RP of 15.44 m
3/s, according to the log Pearson III curve (see
Figure 4), is 10.2 years. If the values of β = 2 and 10.2 years are input into Equation (5), the flow coefficient (α) is 0.74. After [
36,
37], such a value corresponds to flow from clayey soil and non-flat areas, but this is not like the researched terrain. Therefore, the value 0.30 is accepted, honoring the gentle surface dip and basement represented with medium textured soil (loam, silty-clay loam). Using such a runoff coefficient and effective precipitation (10.5 mm) as in Equation (2) the “Total precipitation” is 35 mm.
Consequently, the precipitation quantity of 35 mm, fallen during 3.11 h, was enough for a flow of 15.44 m3/s, with a back-period of 10.2 years on the “Gornja Kašina” hydrological station. Therefore, the border value for p = 1 is 35 mm, and smaller probabilities are defined dividing the interval 0–35 into quartiles, i.e., p = 0.75 is valid for 26.25–34.99 mm, p = 0.5 17.5–26.24, p = 0.25 8.75–17.49, p = 0.05 for less than 8.75 or an unknown value.
The subcategory “Duration” is defined from the activity of total precipitation. The
p = 1 is evaluated as necessary when the precipitation fallen inside the Kašina Stream basin flows through the vertical section of the “Gornja Kašina” hydrological station. According to [
1], the precipitation duration for small basins is very similar to the time necessary for water collection and the creation of a water wave. The water collection time can be calculated from Picking’s Equation (6) [
1]:
where:
L—the longest path of water flow (m),
I
max—the basin dip that can be calculated after Equation (7).
where:
ΔH—the elevation difference between the highest basin point and runoff section (m).
In the observed basin ΔH = 430 m and L = 26,087 m, which are determined using GIS. According to Equation (7), the basin dip I = 0.02, i.e., 2%. According to Equation (6) time of concentration is 186.36 min (3.11 h). Such a value is a boundary for
p = 1 (subcategory “Duration”, 3.11 h) which is again divided into quartiles as shown in
Table 7. Therefore,
p = 0.75 is appended to the interval 3.10–2.33 h and
p = 0.5 to the interval 2.32–1.55 h.
p of 0.25 is appended to the interval 1.54–0.78 and
p = 0.05 for less than 0.78 or unknown.
3.4.4. Category “Water Flow”
The hydrological category “Water flow” represents the total water quantity flowing through the section (see
Figure 5) and just before the observed precipitation. The boundary condition for this category is defined from this section (see
Figure 5) and the water-level (see
Section 3.2). The flooding value, i.e., the value when outpouring from the bed starts is 118 cm, with a flow of 15.44 m
3/s. It is the lower boundary for
p = 1. The minimal probability
p = 0.05 is defined for less than 0.04 m
3/s and a stage of 4 cm. Other values are calculated as one-third of the interval 0.04–15.44 m
3/s shown in
Table 8. Consequently,
p = 0.75 is appended to the interval 15.44–10.31 m
3/s and
p = 0.5 to 10.30–5.18 m
3/s.
p of 0.25 is appended to the interval 5.17–0.04 m
3/s.
4. Results
The Kašina Stream basin, upstream from the “Gornja Kašina” stream gauge, mostly is covered by rendzina on marl or soft limestone [
16,
17,
19]. Since most precipitation reaches such soils, they were chosen as representative soils for the study area. According to [
16], such soils have a silty–clayey to clayey loam texture.
Direct porosity data were not available. With the presumption that sandy soil contains more pores than clayey, i.e., more than rendzina on marl/flysch or soft limestone, the soil is considered as low-porosity with a range of 30–45%. According to
Table 3,
p = 0.75. Ecological soil depth [
16] of the chosen soils is defined as medium, suggesting that in the interval 50–75 cm a probability value of
p = 0.50 occurs. Multiplication of subcategories’
p values results in a
p value of the category “Basement”
p = 0.375.
The texture class of soil rendzina on marl or soft limestone has a range of maximum capacity for water between 125 and 167 mm/m. The probability value of that event according to
Table 3 is
p = 0.25.
The quantity of total precipitation in the night of 24–25 July 2020 on the “Zagreb-Maksimir” station was 64.9 mm and 57.3 mm on the “RC Puntijarka” station. The mean value of 61.1 mm was used as input for the subcategory “Quantity”. Duration, i.e., subcategory “Duration” was set to 3 h (as a mean of 2.67 h on the “Zagreb-Maksimir” and 3.33 h on the “RC Puntijarka”). The multiplication of the
p values of subcategories according to
Table 3 “Quantity” (
p = 1.0) and “Duration” (
p = 0.75) gave
p = 0.75 as a probability value of the category “Total precipitation”.
Just before the observed event on the “Gornja Kašina” hydrological station, the discharge was 0.15 m
3/s, which is the input value for the category “Water flow”. According to
Table 3, the
p-value of this category is
p = 0.25.
According to Equation (1), for the Kašina Stream basin, the probability value p = 0.0176. This result is interpreted as the probability of flooding during the event in the night of 24–25 July 2020 (1.76%). In reality, a flood did not happen, but rather the flow was slightly above the medium water level threshold (27 cm/1.19 m3/s), which corresponds to the calculated probability. A flood could happen if the duration of precipitation or the amount of precipitation were higher.
5. Discussion
Each analytical method has a range of uncertainties, coming from different sources. It is valid for measurements as well as the calculation-based method. One simple, but robust, probability calculation method is presented here, built around hydrological categories. Such inputs are of mixed types, partially based on measurements, partially on the expert selection of data and data ranges. Therefore, two main uncertainties come from measurement and/or equipment errors, but also from the expert selection of the appropriate intervals described in the researched hydrological region. This second source is even more variable and sensitive, stressing the role of expert knowledge. The presented model is highly bounded for climate, relief, and population in the Medvednica Mt. area, Northern Croatia. Some other research groups could estimate the category events and ranges, probably in slightly different intervals, but the main estimation idea would be kept and comparable with the given results.
The basement porosity/soil depths, soil water capacity and total precipitation are clearly spatial and random variables. It means that they can be estimated as average or median from the total measured points, with no regard to their spatial location, but also firstly interpolated and later estimated from interpolated grid cells, where interpolated values are also considered as “hard data” as well as the original measurements. This means that uncertainties in sampling from interpolated maps also included uncertainties of interpolation methods. Consequently, they highly depend on the number of original “hard data” as the main factor in the selection of interpolation (e.g., inverse distance weighting, nearest neighborhood, Kriging, and even simulation). Such uncertainties must be estimated in each particular case, and a decision must be made regarding the use of only original measurements (like in this research) or interpolated values. A recommendation can be given that for highly dense hard datasets (n > 50 points); interpolation is the preferred option for obtaining values applied for a histogram, descriptive statistics, and cumulative distribution curves.
Regarding topography and climate, this model should be firstly confirmed several times in a similar climate and relief (in a broad sense, in Central Europe, excluding the Alps and Carpathians) and the success rate of such a calculation in the prediction of risky and extreme hydrological events should be determined. Only after such models prove their applicability in the entire Northern Croatian and the adjacent regions of Central Europe, could they be tested in other topographies and, especially, climate zones.
Other sources of uncertainties could not be in the spatial distribution of data or expert opinions about interval values, not even in the selected categories, but within the hydrological variables themselves. If, e.g., the runoff coefficient (Rc) and recession time (Tc) are observed as critical ones that control event runoff characteristics at a small catchment scale [
38], the results (obtained in Lower Austria) showed that the Rc and their variability tend to be largest for the tile drainages and the main outlet, with larger values in January/February than in July/August. Tc variability was not oversized, but the largest at the main outlet and the smallest for the tile drainages. Therefore, the authors [
38] explained changes in groundwater levels (due to shallow flows) as the main factors that influenced Rc and Tc, more important than soil moisture or precipitation. In our work, such additional subsurface flows were not considered for hydrological systems on Medvednica Mt., although they could exist, but they are not significant in the context of their contribution to the analyzed waterflow. Yet, similarly, in the system of the Gornja Kašina Stream, a critical variable event of extreme precipitation occurred, also in late July.
Moreover, in the same area (Lower Austria) another research study was performed to conclude the variability of the event runoff characteristics as a result of climate and hydro–geological conditions (for four “small” catchments with different hydro–geological settings mapped during field work [
39]). A connection between the larger event runoff coefficients and flow peaks in catchments with high mean annual precipitation was observed. Interestingly, a weak poor relation between the previous precipitation and event runoff was proven, but the initial flow is the main factor defining the runoff coefficient and event peaks in all analyzed catchments. Those two examples pointed out the very local behavior of hydrological variables even in the catchments belonging to a very similar climate and covering comparable catchment areas.
6. Conclusions
In this article, definition and application of a model for flood prediction is presented. The model is developed for the “Gornja Kašina” hydrological station and its corresponding drainage area. It consists of geological–hydrological categories, compiled in a standard probability of success calculation procedure.
That approach was tested on the data collected during the most recent hydrometeorological extreme event on 24–25 July 2020 During that night, the city of Zagreb had localized urban floods in some of its parts, but the event did not register as a flood at the Gornja Kašina stream gauge. Such a scenario has been described with a probability calculation of p = 1.76% at the station. The obtained probability value proved the applicability of the methodology for the prediction of future possible flooding in the area of Medvednica Mt. The given methodology would also improve flood control mechanisms as to better define micro zones for flood defenses contrary to many hydrological models for broader areas. In the mentioned models, the catchment area of Kašina Stream would be just one cell on a flood risk map and unsuitable for individual observation. With this model, catchment risk assessment is independent and avoids interpolation algorithm errors.
The procedure, as its biggest advantage, can be easily adapted for similar catchments in Croatia, fed by data from other hydrological stations or meteorological prognoses. In such cases, defined categories, and their boundary values for “Basement” and “Maximal capacity” can be valid for any hydrological area. However, its application in other basins demands the modification of boundary values in categories “Precipitations” and “Water flow”. The defined categories do not depend on climate zone, and therefore could be used in areas with different precipitations. The disadvantage of the given model is that it is not highly sensitive to all hydrological factors. Due to its resistance to various dynamic hydrological conditions, the model can be considered as robust.


