
Disastrous Flash Floods Triggered by Moderate to Minor Rainfall Events. Recent Cases in Coastal Benguela (Angola)


Abstract
1. Introduction
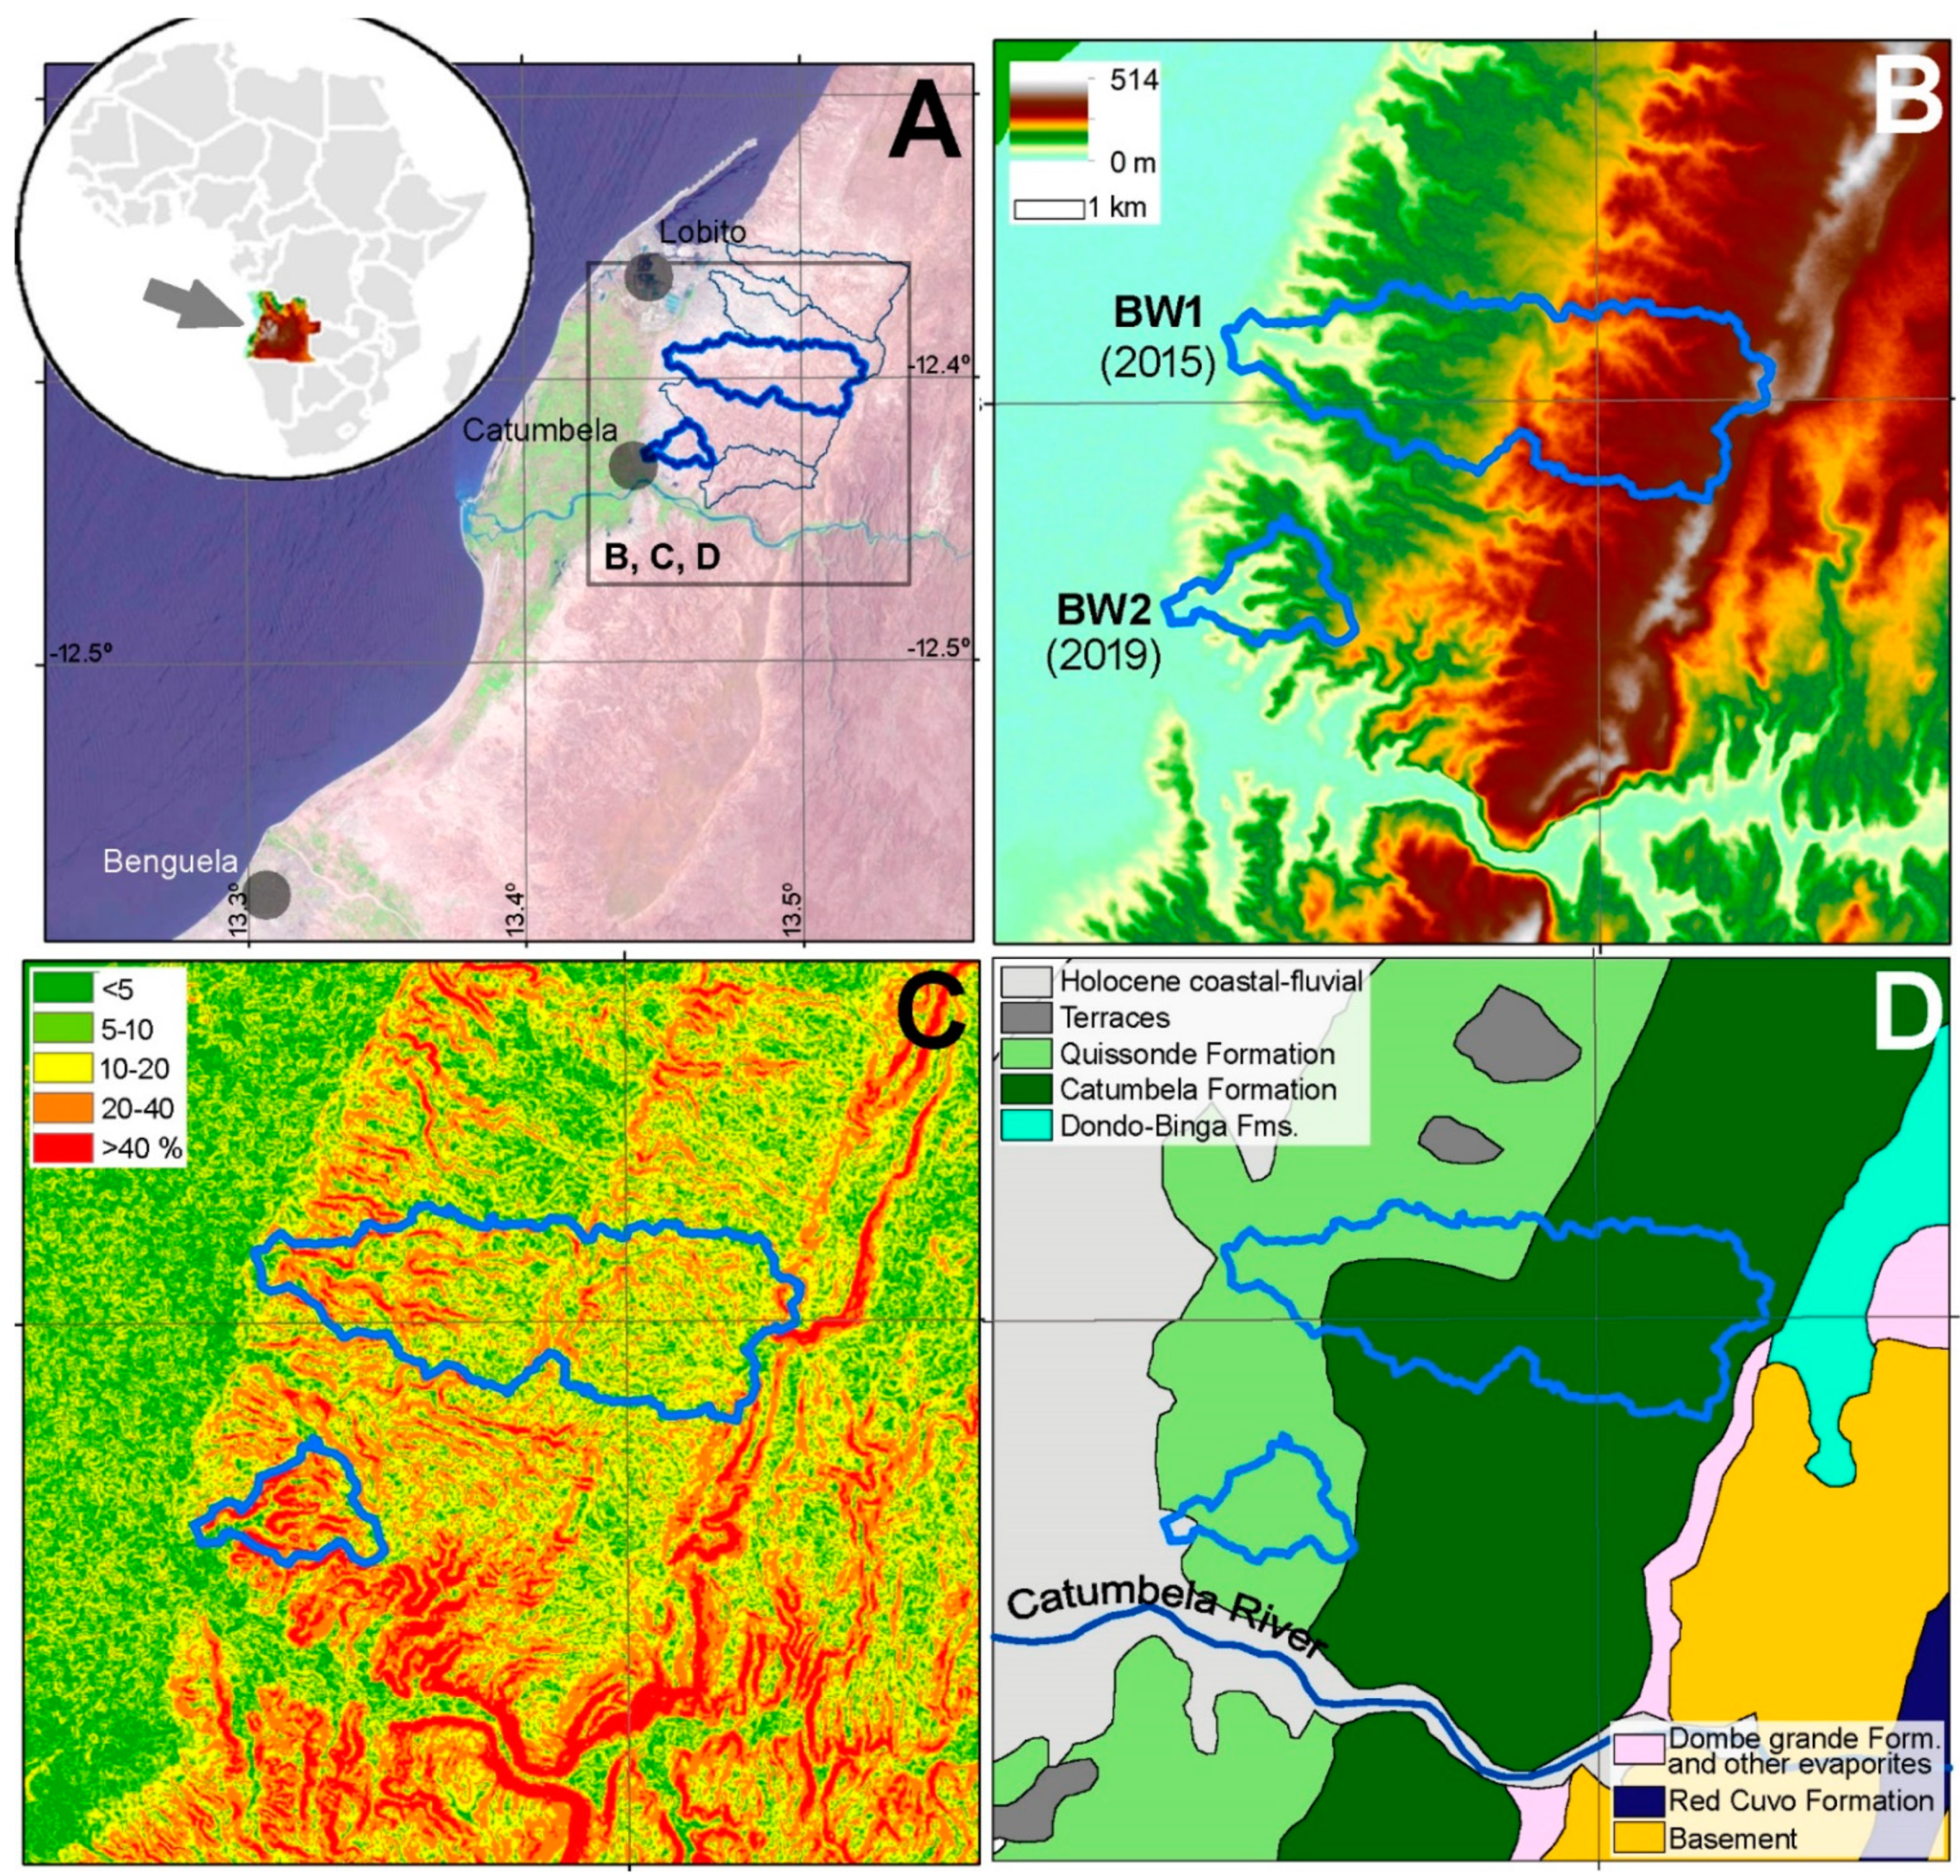
2. Regional Setting
2.1. Geological and Orographic Features
2.2. Climate Conditions
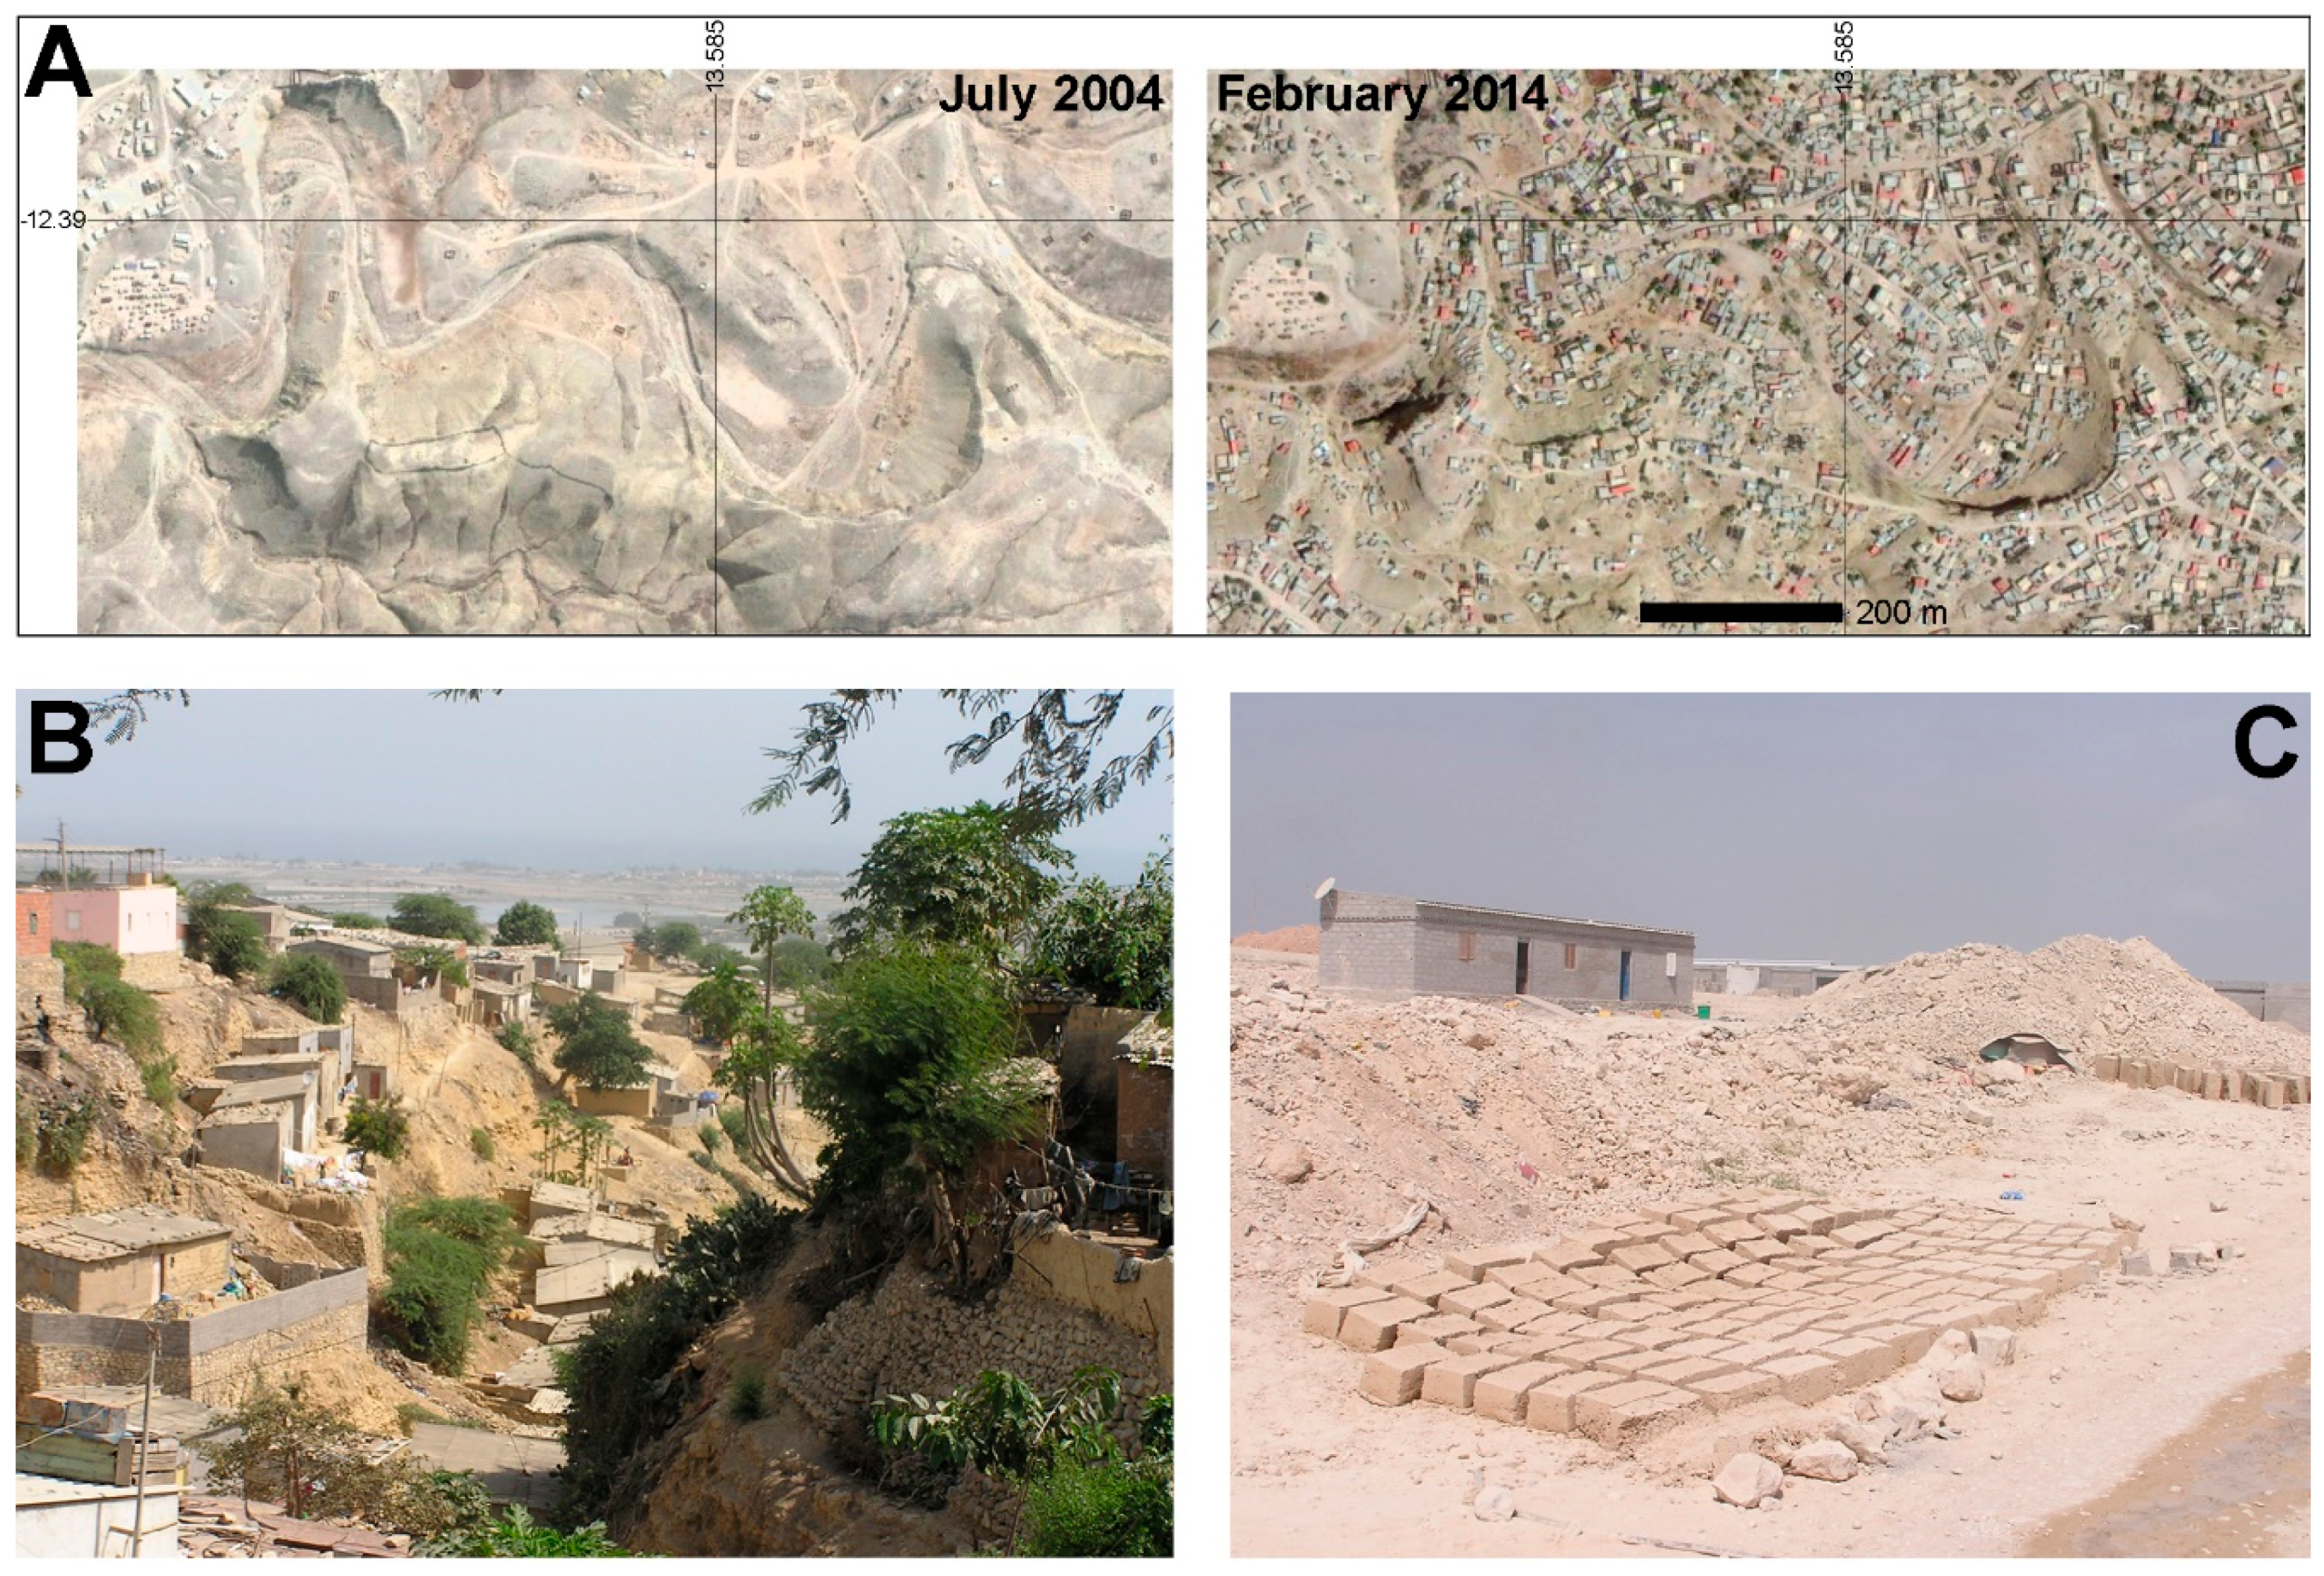
2.3. Human Occupation
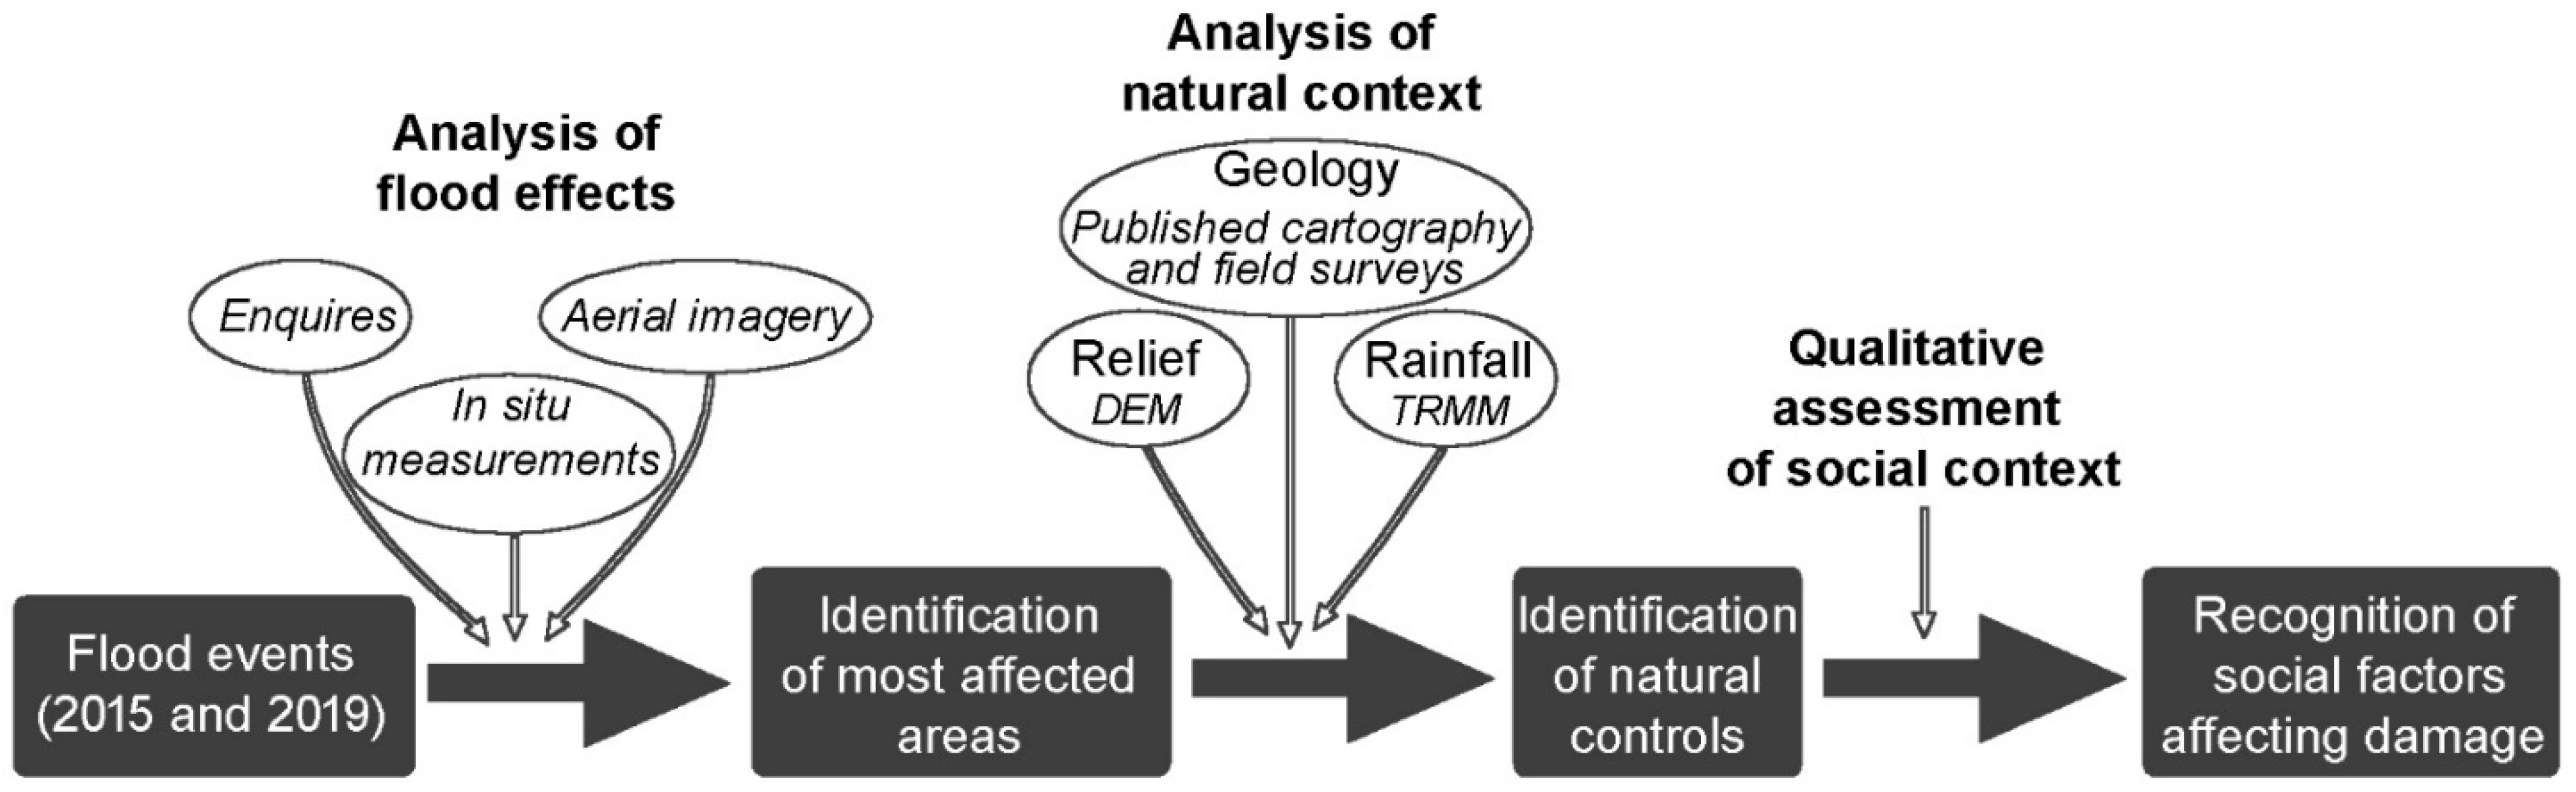
3. Methods
4. Results
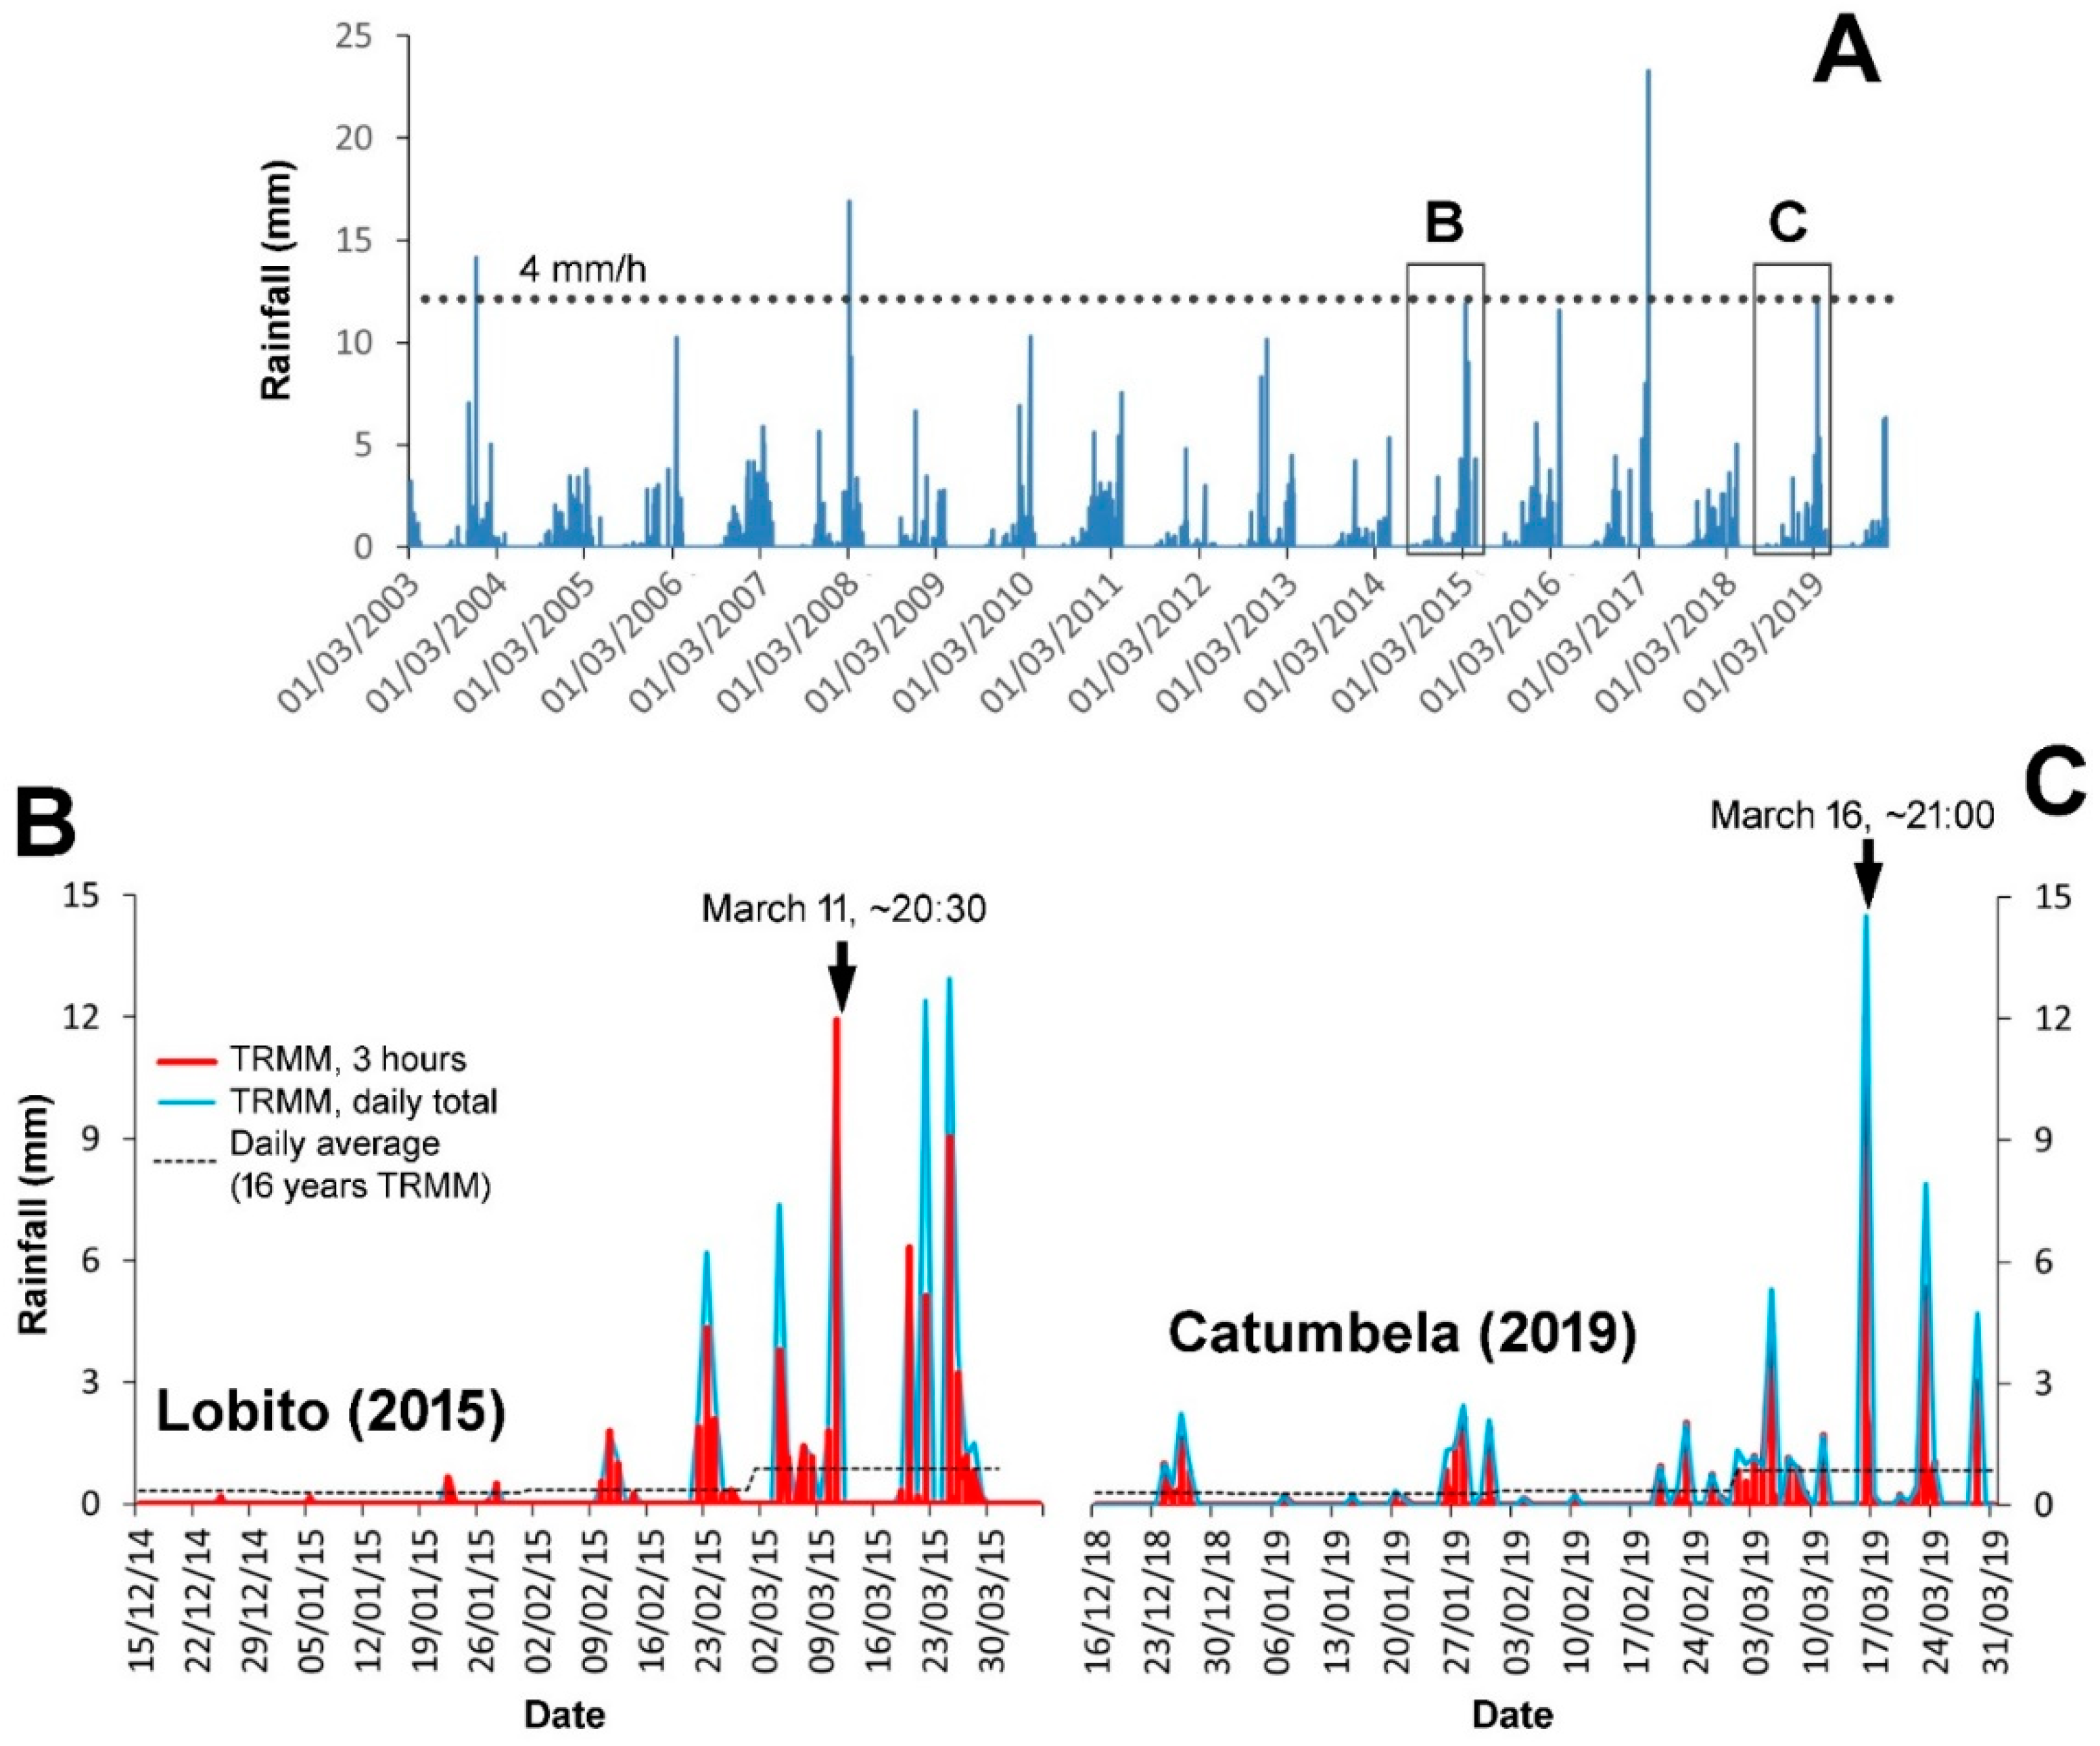
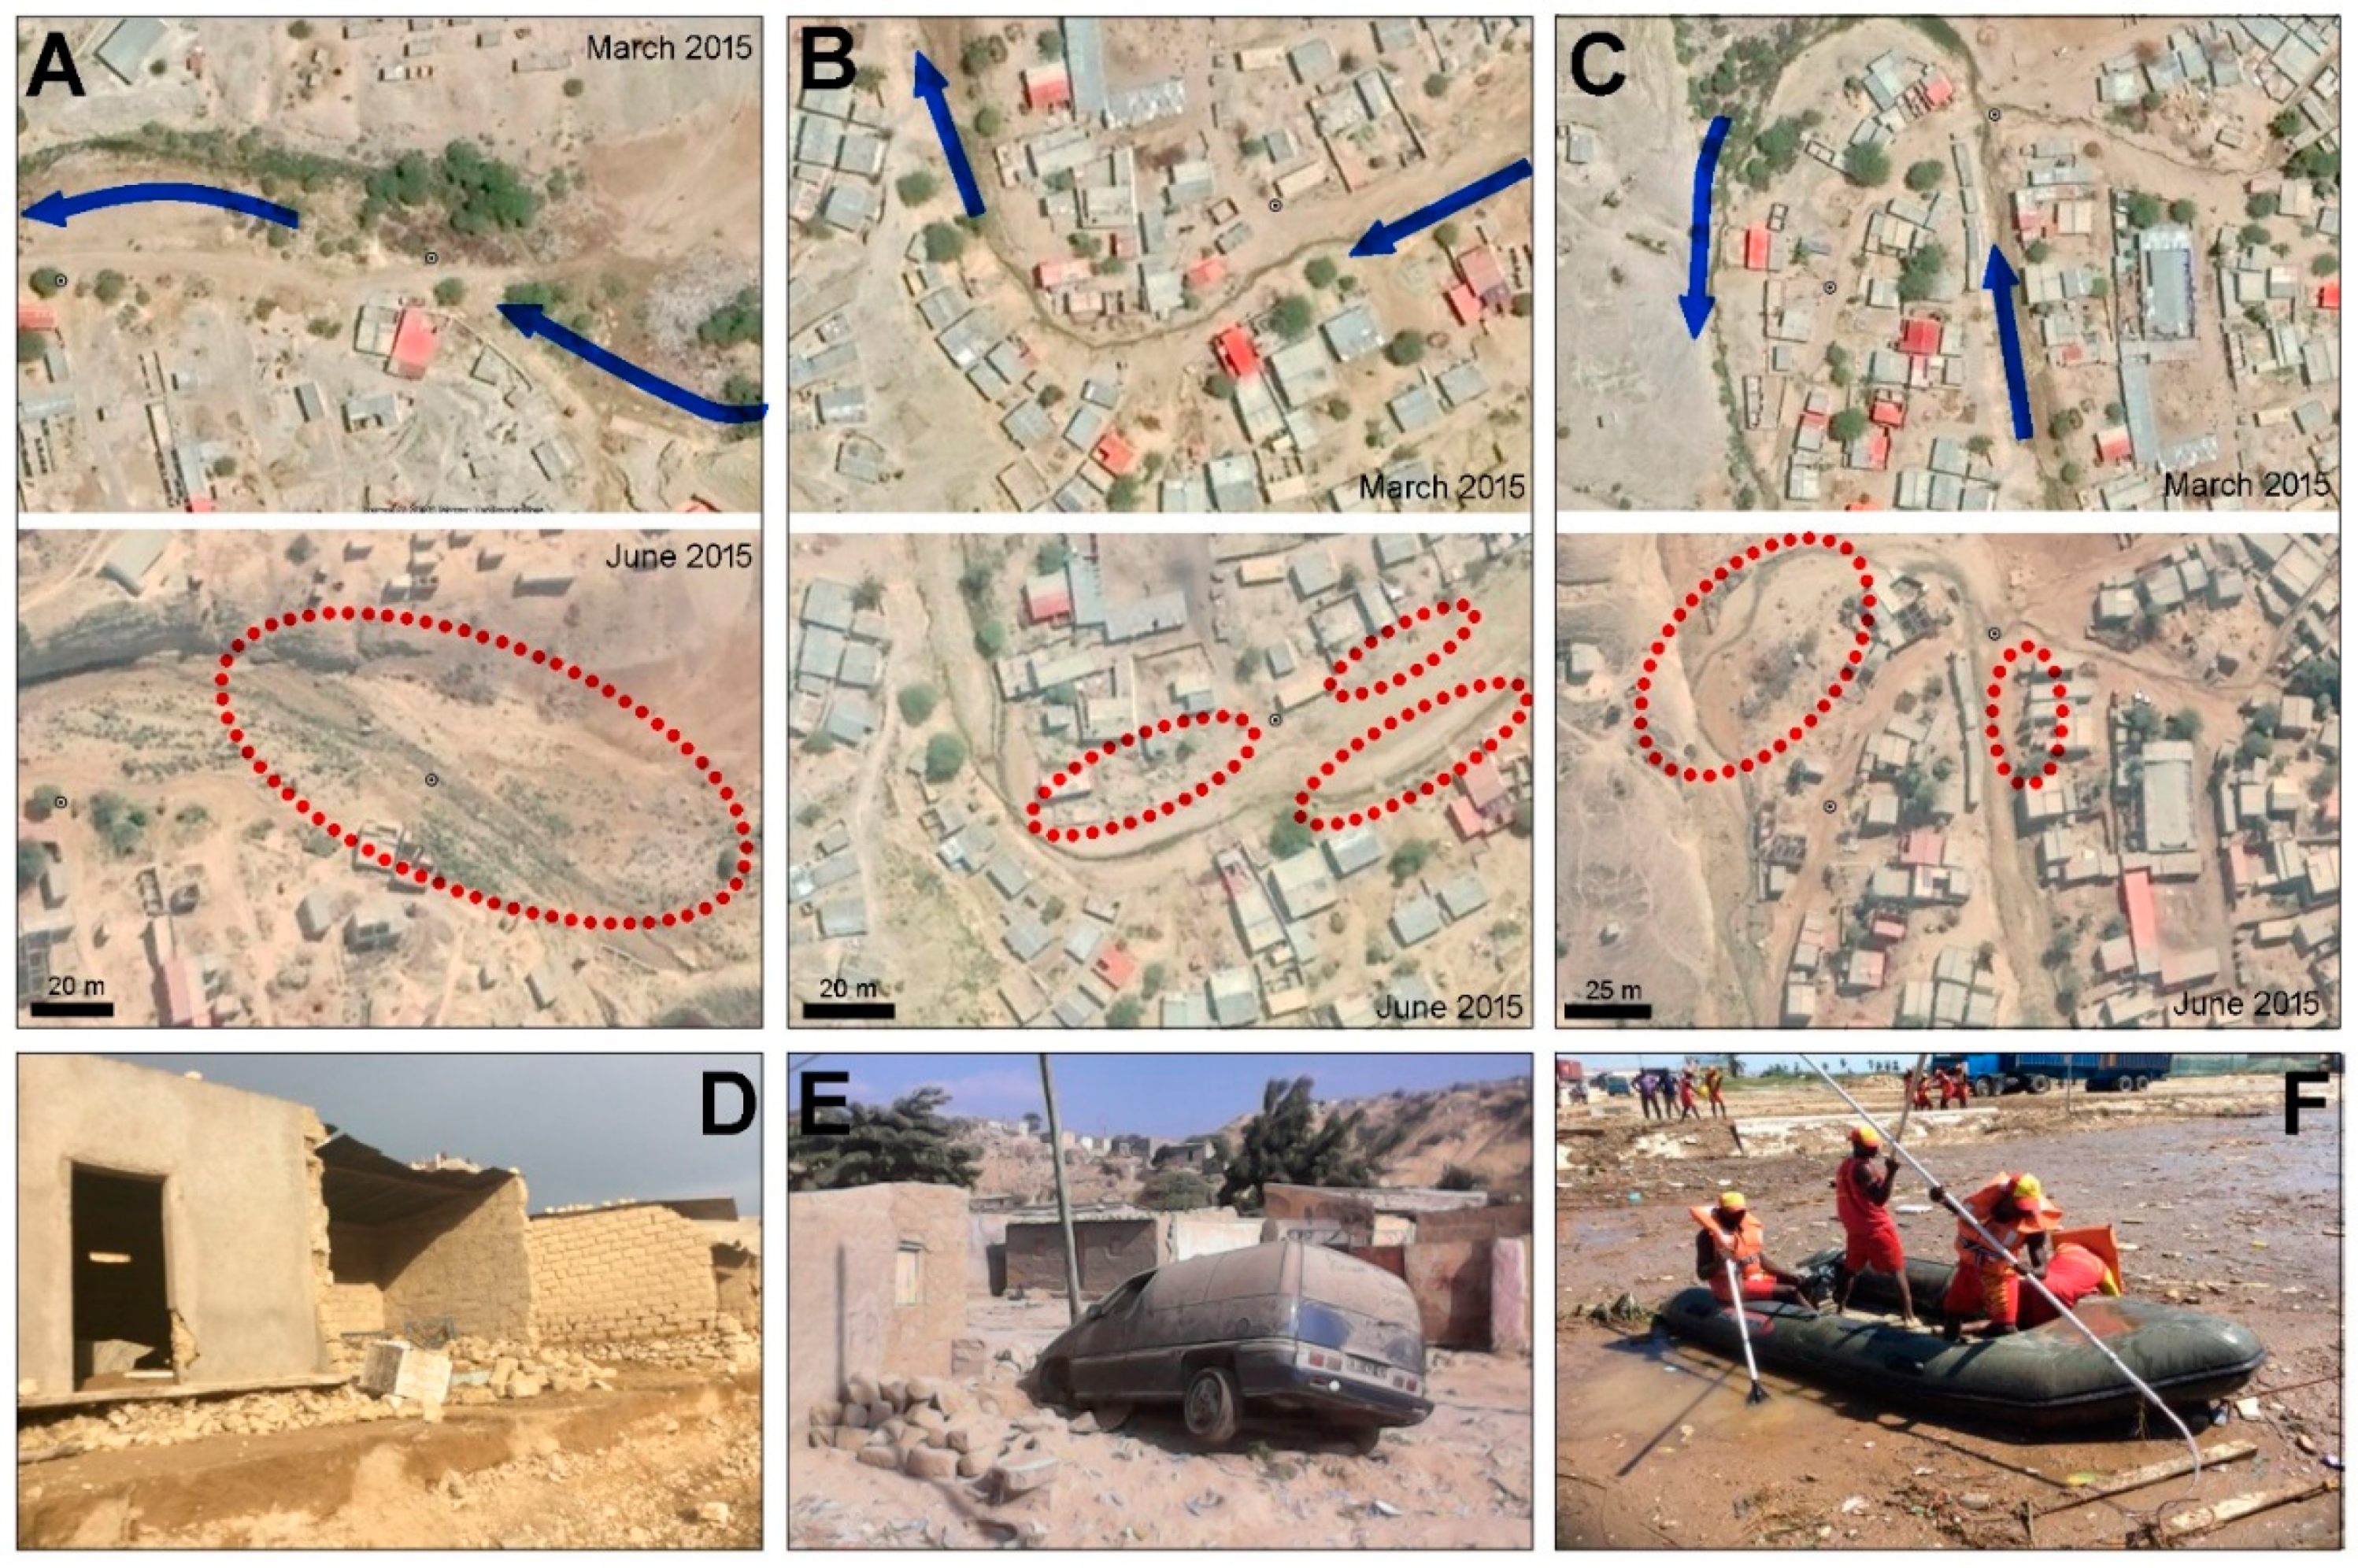
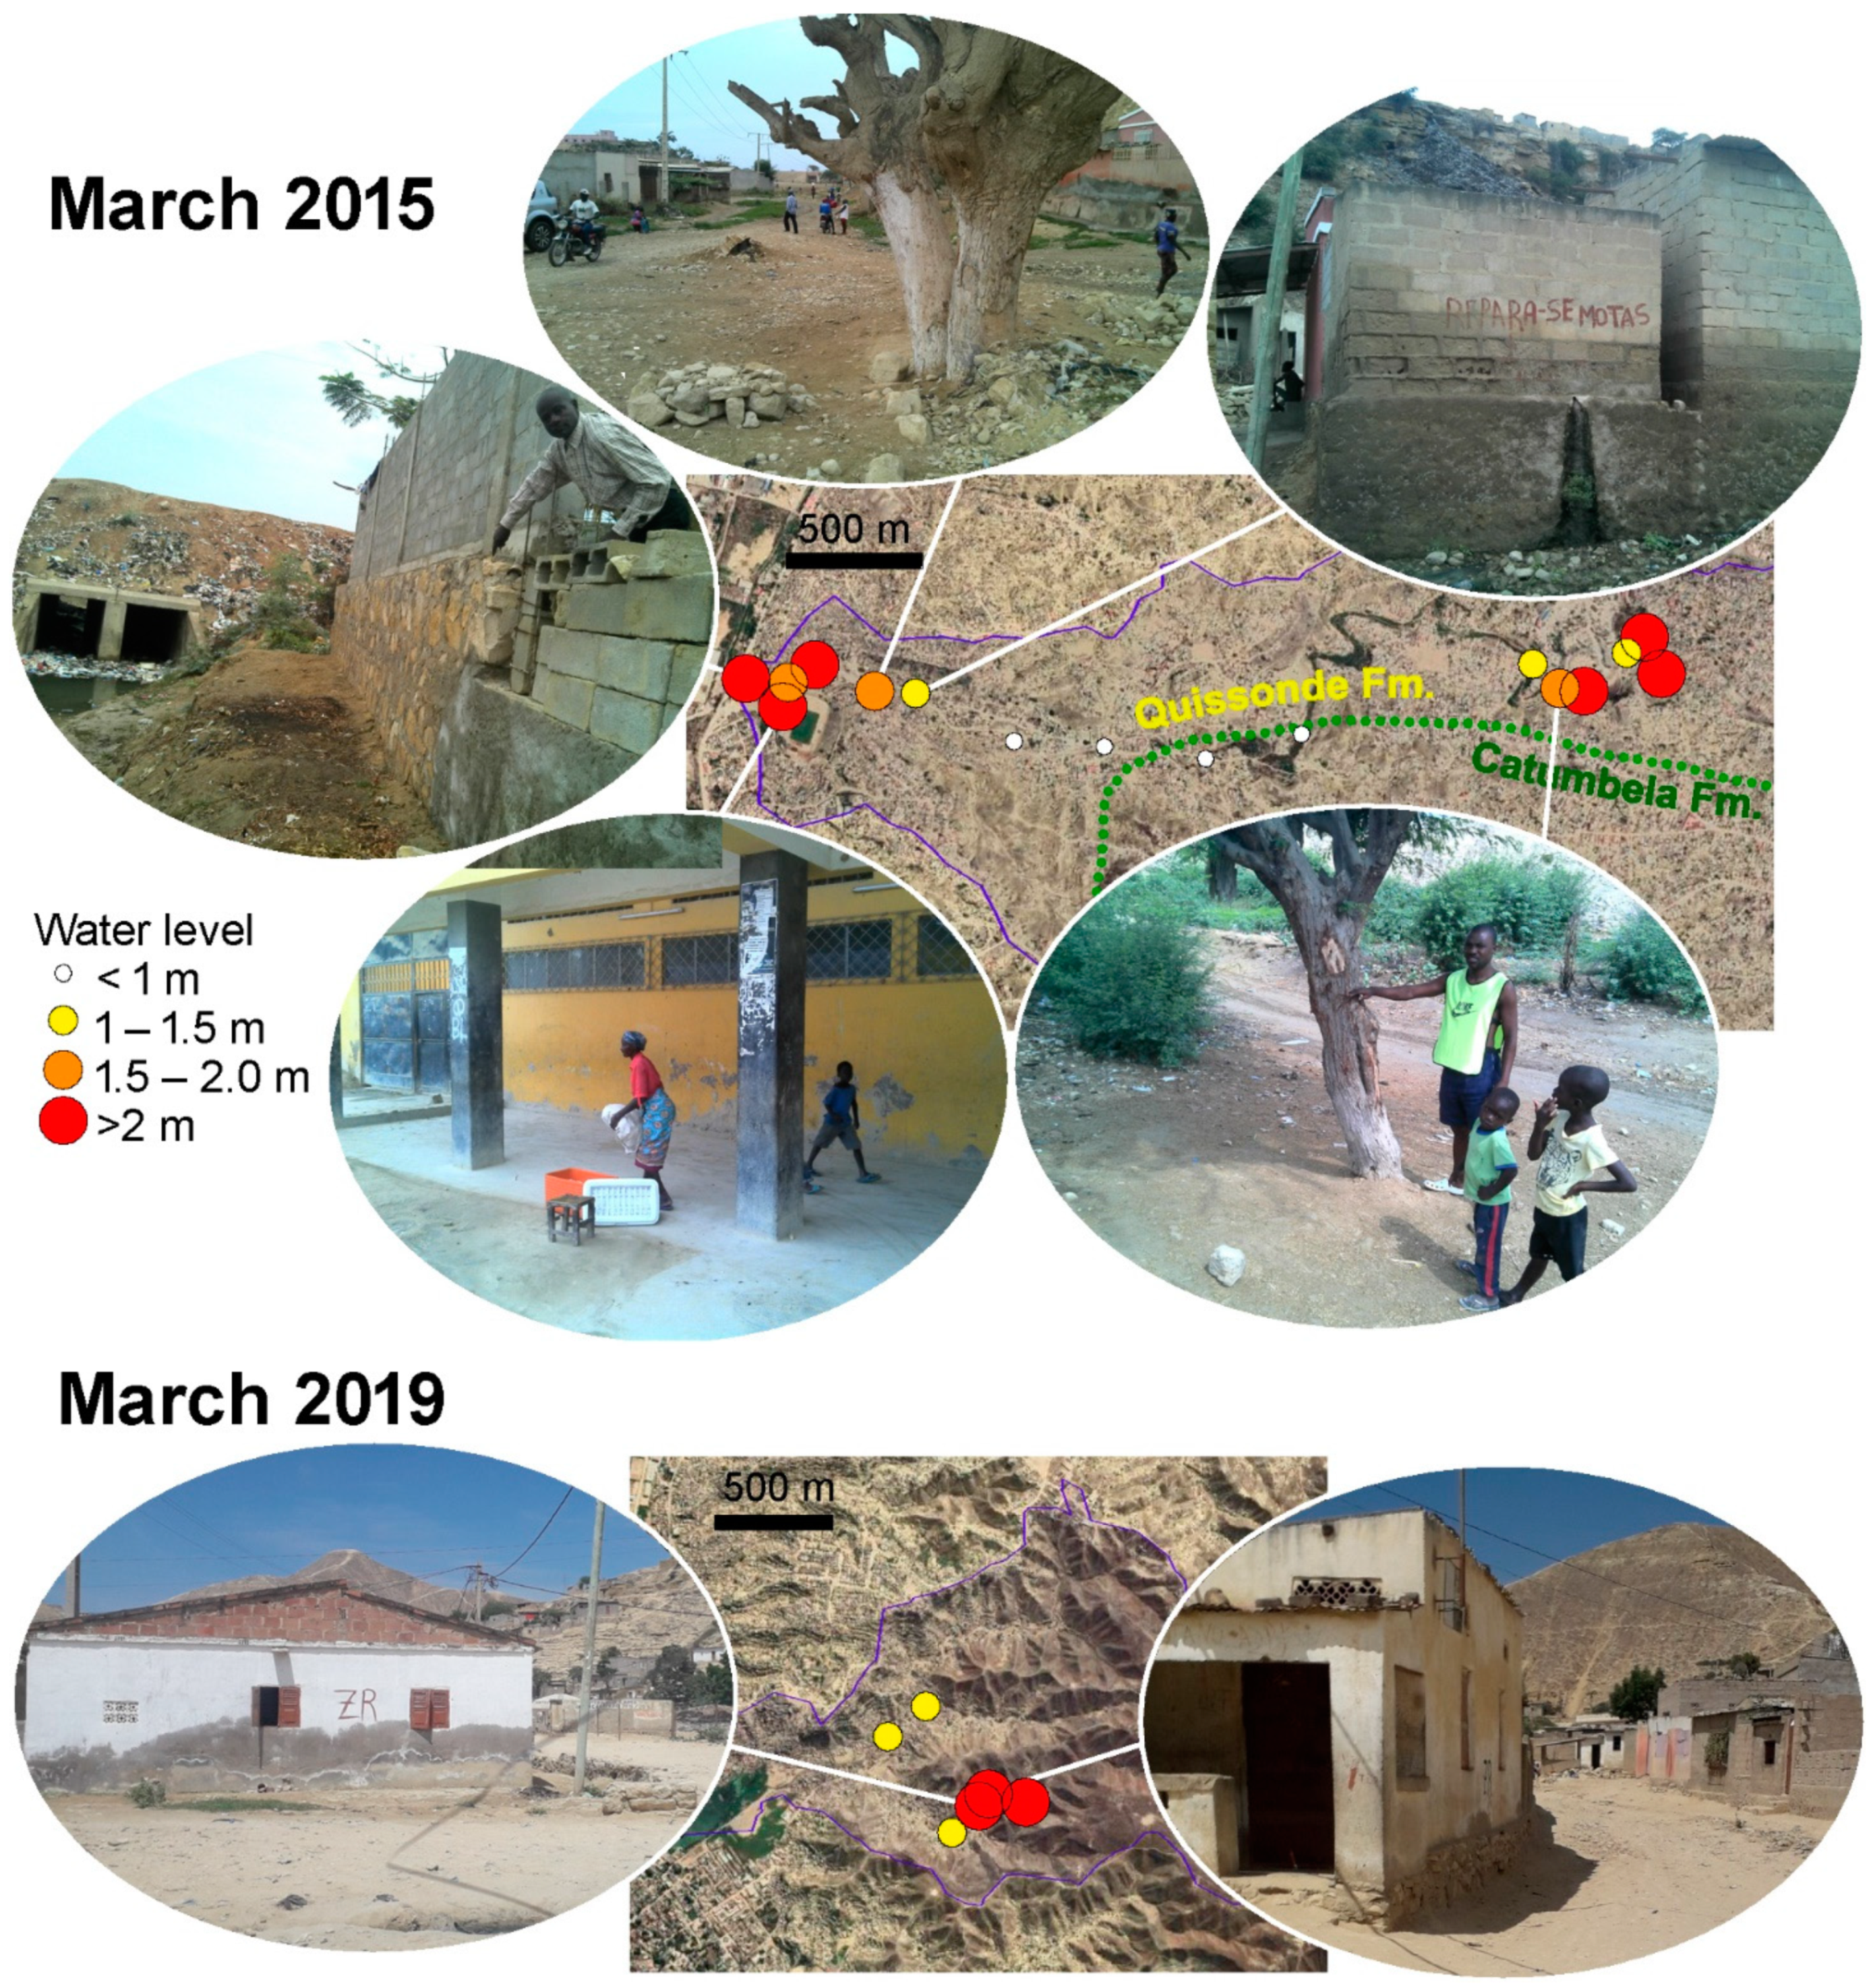
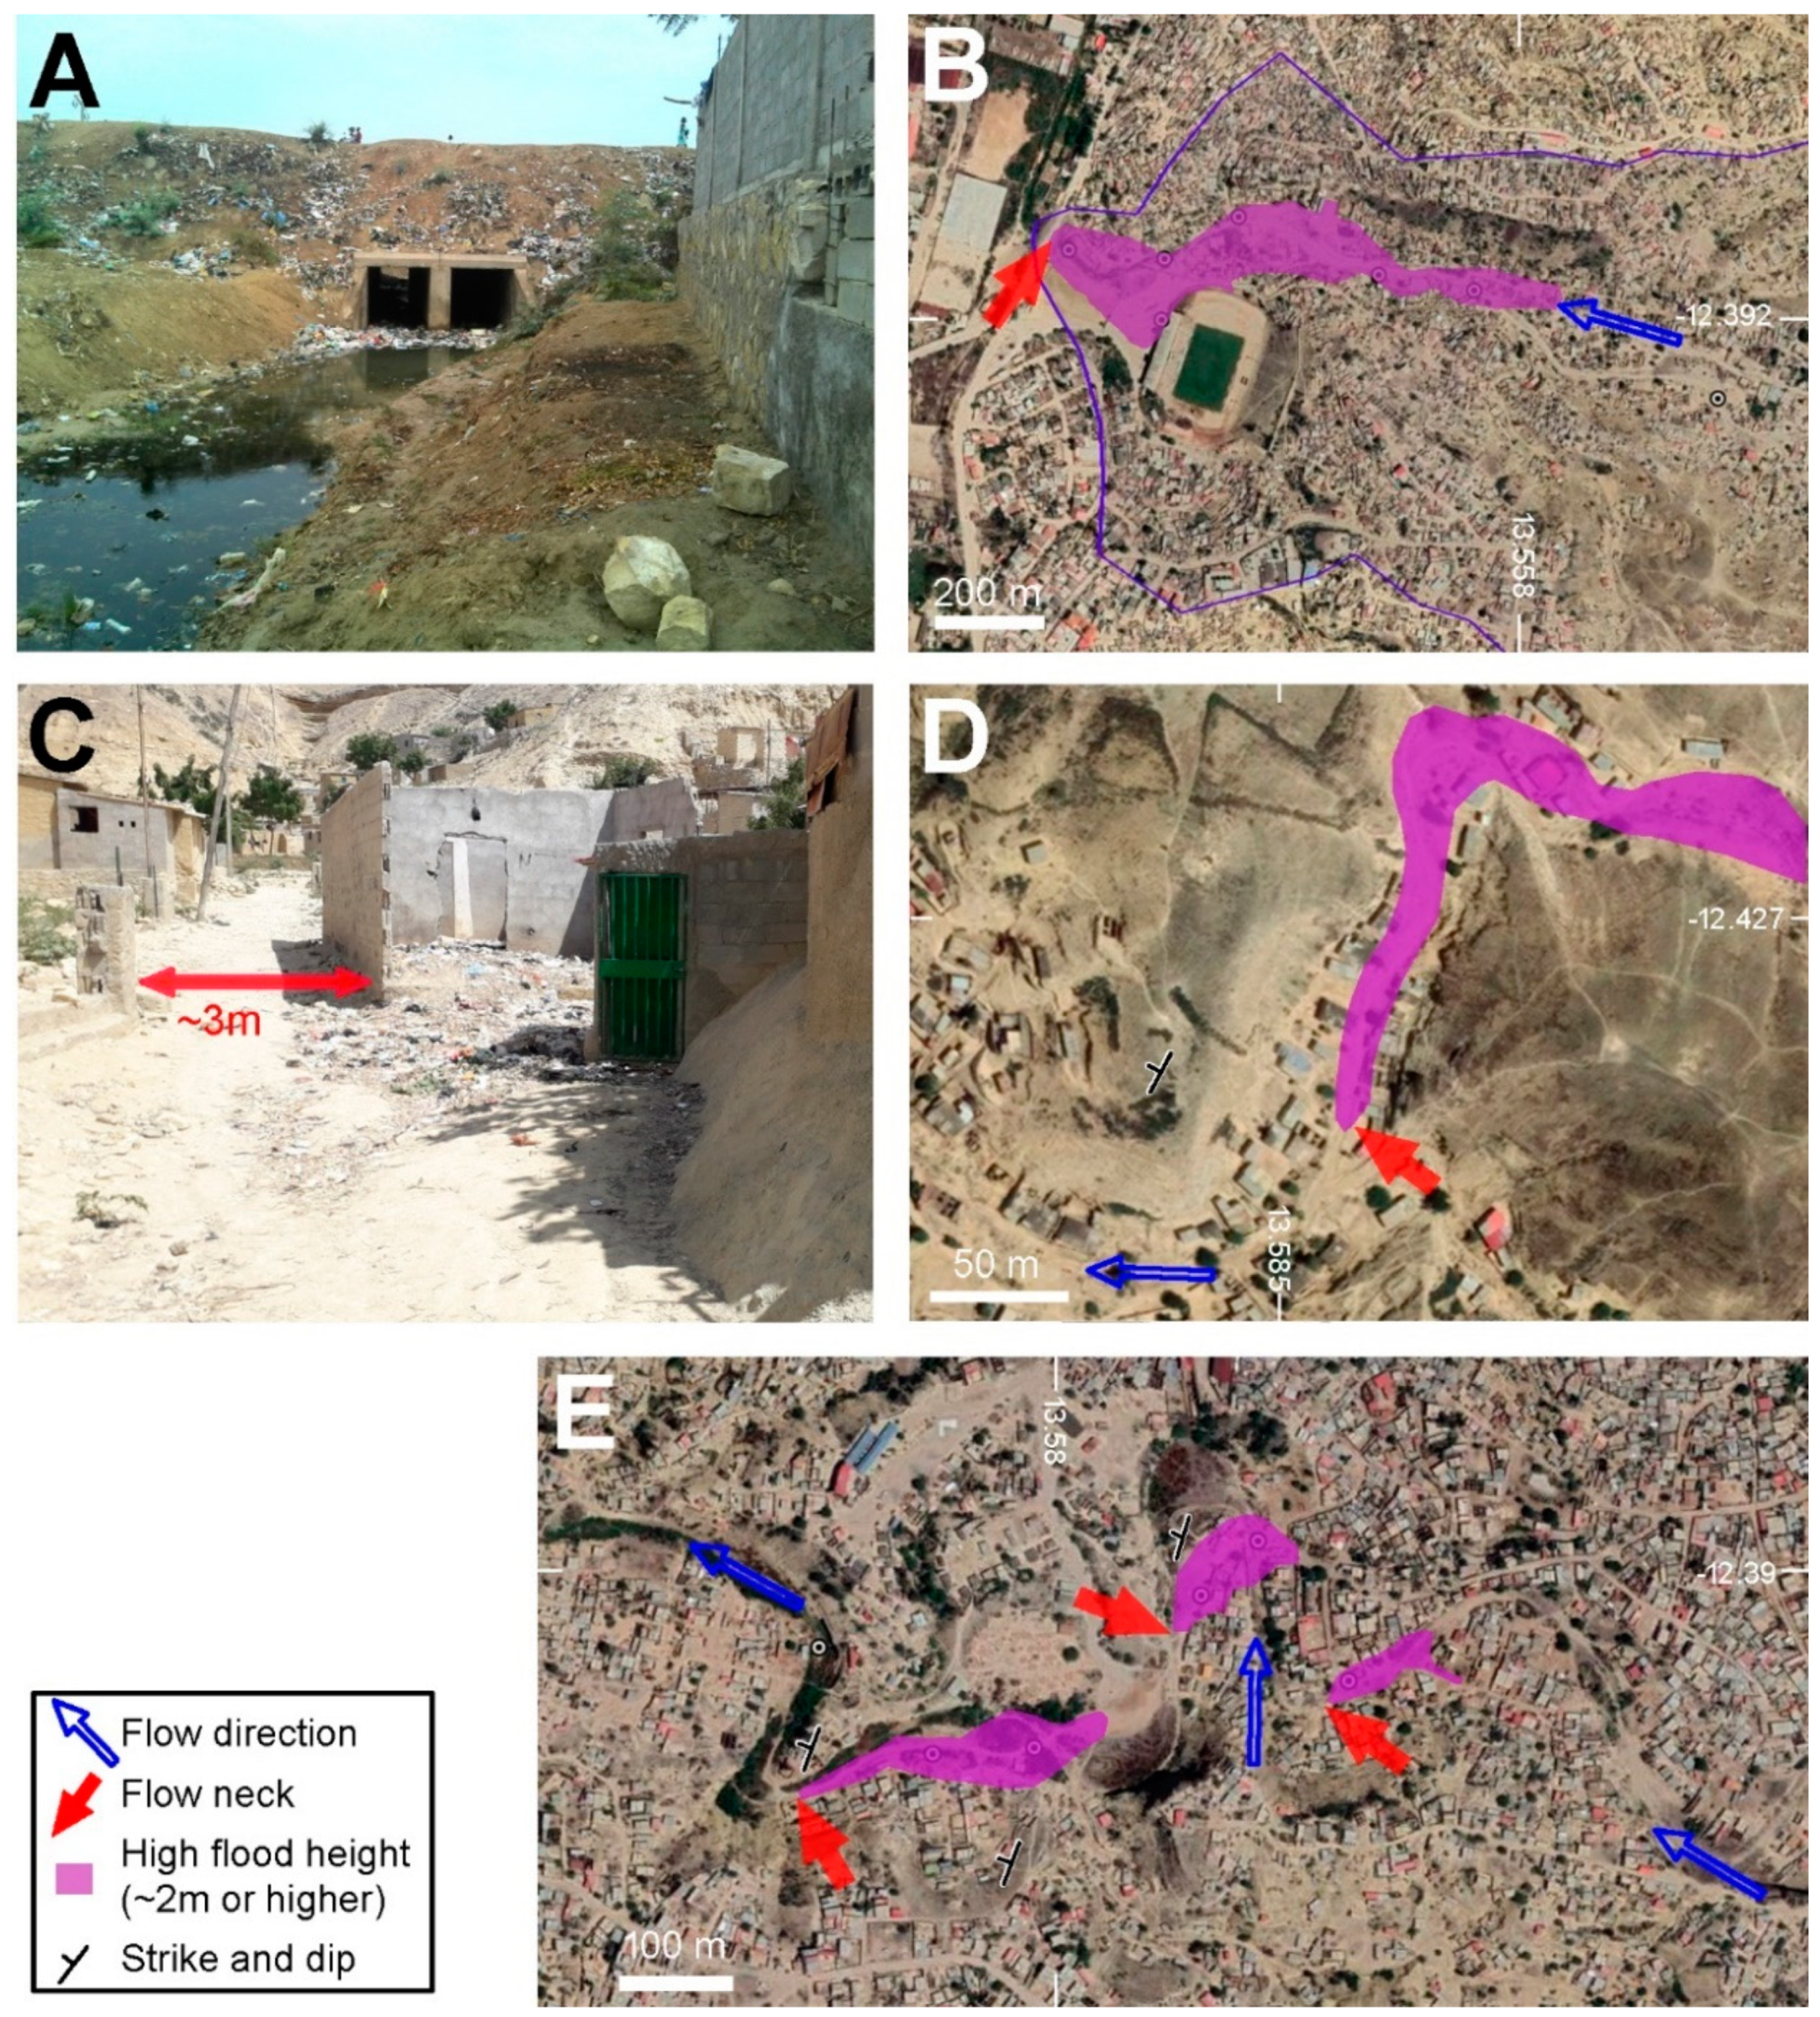
4.1. Flash Flood of March 2015 (Lobito)
4.2. Flash Flood of March 2019 (Catumbela)
5. Discussion
5.1. Natural Features Promoting Flash Floods
5.2. Socio-Economic Factors Enhancing Flood Risk
6. Concluding Remarks
Author Contributions
Funding
Data Availability Statement
Acknowledgments
Conflicts of Interest
References
- United Nations. The Human Cost of Weather-Related Disaters. 1995–2015; United Nations Office for Disaster Risk Reduction: Genève, Switzerland, 2015. [Google Scholar]
- Smith, K.; Ward, R. Floods: Physical Processes and Human Impacts; Wiley: Chichester, UK, 1998. [Google Scholar]
- Montz, B.E.; Gruntfest, E. Flash flood mitigation: Recommendations for research and applications. Glob. Environ. Chang. Part B 2002, 4, 15–22. [Google Scholar] [CrossRef]
- Bubeck, P.; Botzen, W.J.W.; Aerts, J.C. A review of risk perceptions and other factors that influence flood mitigation behavior. Risk Anal. 2012, 32, 1481–1495. [Google Scholar] [CrossRef]
- Drobot, S.; Parker, D.J. Advances and challenges in flash flood warnings. Environ. Hazards 2007, 7, 173–178. [Google Scholar] [CrossRef]
- Ramos Filho, G.M.; Coelho, V.H.R.; da Silva Freitas, E.; Xuan, Y.; das Neves Almeida, C. An improved rainfall-threshold approach for robust prediction and warning of flood and flash flood hazards. Nat. Hazards 2020, 105, 2409–2429. [Google Scholar] [CrossRef]
- Zaman, M.A.; Rahman, A.; Haddad, K. Regional flood frequency analysis in arid regions: A case study for Australia. J. Hydrol. 2012, 475, 74–83. [Google Scholar] [CrossRef]
- Bajabaa, S.; Masoud, M.; Al-Amri, N. Flash flood hazard mapping based on quantitative hydrology, geomorphology and GIS techniques (case study of Wadi Al Lith, Saudi Arabia). Arab. J. Geosci. 2014, 7, 2469–2481. [Google Scholar] [CrossRef]
- Zhang, J.; Yu, Z.; Yu, T.; Si, J.; Feng, Q.; Cao, S. Transforming flash floods into resources in arid China. Land Use Policy 2018, 76, 746–753. [Google Scholar] [CrossRef]
- Hadihardaja, I.K.; Vadiya, R. Identification of flash flood hazard zones in mountainous small watershed of Aceh Besar Regency, Aceh Province, Indonesia. Egyp. J. Remote Sens. Space Sci. 2016, 19, 143–160. [Google Scholar]
- Bui, D.T.; Hoang, N.D.; Pham, T.D.; Ngo, P.T.T.; Hoa, P.V.; Minh, N.Q.; Tran, X.-T.; Samui, P. A new intelligence approach based on GIS-based multivariate adaptive regression splines and metaheuristic optimization for predicting flash flood susceptible areas at high-frequency tropical typhoon area. J. Hydrol. 2019, 575, 314–326. [Google Scholar]
- Howard, A.D. Role of hypsometry and planform in basin hydrologic response. Hydrol. Process. 1990, 4, 373–385. [Google Scholar] [CrossRef]
- Youssef, A.M.; Pradhan, B.; Hassan, A.M. Flash flood risk estimation along the St. Katherine road, southern Sinai, Egypt using GIS based morphometry and satellite imagery. Environ. Earth Sci. 2011, 62, 611–623. [Google Scholar] [CrossRef]
- Nicolau, J.M.; Solé-Benet, A.; Puigdefábregas, J.; Gutiérrez, L. Effects of soil and vegetation on runoff along a catena in semi-arid Spain. Geomorphology 1996, 14, 297–309. [Google Scholar] [CrossRef]
- Cras, A.; Marc, V.; Travi, Y. Hydrological behaviour of sub-Mediterranean alpine headwater streams in a badlands environment. J. Hydrol. 2007, 339, 130–144. [Google Scholar] [CrossRef]
- Yang, J.L.; Zhang, G.L. Water infiltration in urban soils and its effects on the quantity and quality of runoff. J. Soils Sediments 2011, 11, 751–761. [Google Scholar] [CrossRef]
- Kang, I.S.; Park, J.I.; Singh, V.P. Effect of urbanization on runoff characteristics of the On-Cheon Stream watershed in Pusan, Korea. Hydrol. Process. 1998, 12, 351–363. [Google Scholar] [CrossRef]
- Booth, D.B.; Hartley, D.; Jackson, R. Forest cover, impervious-surface area, and the mitigation of stormwater impacts. J. Am. Water Resour. Assoc. 2002, 38, 835–845. [Google Scholar] [CrossRef]
- Smith, J.A.; Baeck, M.L.; Meierdiercks, K.L.; Nelson, P.A.; Miller, A.J.; Holland, E.J. Field studies of the storm event hydrologic response in an urbanizing watershed. Water Resour. Res. 2005, 41. [Google Scholar] [CrossRef]
- Todeschini, S. Hydrologic and environmental impacts of imperviousness in an industrial catchment of northern Italy. J. Hydrol. Eng. 2016, 21. [Google Scholar] [CrossRef]
- Sanderson, D. Cities, disasters and livelihoods. Risk Manag. 2000, 2, 49–58. [Google Scholar] [CrossRef]
- Di Baldassarre, G.; Montanari, A.; Lins, H.; Koutsoyiannis, D.; Brandimarte, L.; Blöschl, G. Flood fatalities in Africa: From diagnosis to mitigation. Geophys. Res. Lett. 2010, 37. [Google Scholar] [CrossRef]
- Gupta, A.K.; Nair, S.S. Flood risk and context of land-uses: Chennai city case. J. Geogr. Reg. Plan. 2010, 3, 365–372. [Google Scholar]
- De Risi, R.; Jalayer, F.; De Paola, F.; Iervolino, I.; Giugni, M.; Topa, M.E.; Gasparini, P. Flood risk assessment for informal settlements. Nat. Hazards 2013, 69, 1003–1032. [Google Scholar] [CrossRef]
- Hoedjes, J.C.; Kooiman, A.; Maathuis, B.H.; Said, M.Y.; Becht, R.; Limo, A.; Mumo, M.; Nduhiu-Mathenge, J.; Shaka, A.; Su, B. A conceptual flash flood early warning system for Africa, based on terrestrial microwave links and flash flood guidance. ISPRS Int. J. Geo Inf. 2014, 3, 584–598. [Google Scholar] [CrossRef]
- Jubach, R.; Tokar, A.S. International severe weather and flash flood hazard early warning systems—Leveraging coordination, cooperation, and partnerships through a hydrometeorological project in Southern Africa. Water 2016, 8, 258. [Google Scholar] [CrossRef]
- Clark, R.A.; Flamig, Z.L.; Vergara, H.; Hong, Y.; Gourley, J.J.; Mandl, D.J.; Frye, S.; Handy, M.; Patterson, M. Hydrological modeling and capacity building in the Republic of Namibia. Bull. Am. Meteorol. Soc. 2017, 98, 1697–1715. [Google Scholar] [CrossRef]
- De Coning, E. Optimizing satellite-based precipitation estimation for nowcasting of rainfall and flash flood events over the South African domain. Remote Sens. 2013, 5, 5702–5724. [Google Scholar] [CrossRef]
- Dinis, P.A.; Mantas, V.; Andrade, P.S.; Tonecas, J.; Kapula, E.; Pereira, A.; Carvalho, F.S. Contribution of TRMM rainfall data to the study of natural systems and risk assessment. Cases of application in SW Angola. Quat. Stud. 2013, 9, 33–43. [Google Scholar] [CrossRef]
- Bangira, T.; Maathuis, B.H.; Dube, T.; Gara, T.W. Investigating flash floods potential areas using ASCAT and TRMM satellites in the Western Cape Province, South Africa. Geocarto Int. 2015, 30, 737–754. [Google Scholar] [CrossRef]
- AML. Relatório Sobre as Calamidades de 11 a 25 de Março; Unpublished Report; Administração Municipal do Lobito: Lobito, Angola, 2015. [Google Scholar]
- Guiraud, M.; Buta-Neto, A.; Quesne, D. Segmentation and differential post-rift uplift at the Angola margin as recorded by the transform–rifted Benguela and oblique-to-orthogonal-rifted Kwanza basins. Mar. Pet. Geol. 2010, 27, 1040–1068. [Google Scholar] [CrossRef]
- Neto, M.G.M. O sedimentar costeiro de Angola. Algumas notas sobre o estado actual do seu conhecimento. Junta Investig. Ultramar 1970, 2, 193–232. [Google Scholar]
- Buta-Neto, A.; Tavares, T.S.; Quesne, D.; Guiraud, M.; Meister, C.; David, B.; Duarte-Morais, M.L. Synthèse préliminaire des travaux menés sur le bassin de Benguela (Sud Angola): Implications sédimentologiques, paléontologiques et structurales. Afr. Geosci. Rev. 2006, 13, 239–250. [Google Scholar]
- Dinis, P.A.; Huvi, J.; Callapez, P.M. The Catumbela delta (SW Angola). Processes determining a history of changing asymmetry. J. Afr. Earth Sci. 2018, 145, 68–79. [Google Scholar] [CrossRef]
- Nicholson, S.E.; Entekhabi, D. Rainfall variability in equatorial and southern Africa: Relationships with sea surface temperatures along the southwestern coast of Africa. Bull. Am. Meteorol. Soc. 1987, 26, 561–578. [Google Scholar] [CrossRef][Green Version]
- Leroux, M. Dynamic Analysis of Weather and Climate: Atmospheric Circulation, Perturbations, Climatic Evolution; John Wiley & Sons: Hoboken, NJ, USA, 1998. [Google Scholar]
- Lancaster, N. How dry was dry?—Late Pleistocene palaeoclimates in the Namib Desert. Quat. Sci. Rev. 2002, 21, 769–782. [Google Scholar] [CrossRef]
- Shannon, L.V.; Boyd, A.J.; Brundrit, G.B.; Taunton-Clark, J. On the existence of an El Niño-type phenomenon in the Benguela system. J. Mar. Res. 1986, 44, 495–520. [Google Scholar] [CrossRef]
- Florenchie, P.; Lutjeharms, J.R.E.; Reason, C.J.C.; Masson, S.; Rouault, M. The source of Benguela Ninos in the South Atlantic Ocean. Geophys. Res. Lett. 2003, 30, 1505. [Google Scholar] [CrossRef]
- Rouault, M.; Illig, S.; Bartholomae, C.; Reason, C.J.C.; Bentamy, A. Propagation and origin of warm anomalies in the Angola Benguela upwelling system in 2001. J. Mar. Syst. 2007, 68, 473–488. [Google Scholar] [CrossRef]
- Imbol Koungue, R.A.; Rouault, M.; Illig, S.; Brandt, P.; Jouanno, J. Benguela Niños and Benguela Niñas in forced ocean simulation from 1958 to 2015. J. Geophys. Res. Ocean. 2019, 124, 5923–5951. [Google Scholar] [CrossRef]
- Dinis, P.A.; Huvi, J.; Cascalho, J.; Garzanti, E.; Vermeesch, P.; Callapez, P. Sand-spits systems from Benguela region (SW Angola). An analysis of sediment sources and dispersal from textural and compositional data. J. Afr. Earth Sci. 2016, 117, 171–182. [Google Scholar] [CrossRef][Green Version]
- INE. Resultados Definitivos, Recenseamento Geral da População e Habitação-2014, Província de Benguela; Instituto Nacional de Estatística: Luanda, Angola, 2016. [Google Scholar]
- INE. Projeção da População da Província de Benguela; Instituto Nacional de Estatística: Luanda, Angola, 2016. [Google Scholar]
- Horton, R.E. Drainage-basin characteristics. EOS Trans. Am. Geophys. Union 1932, 13, 350–361. [Google Scholar] [CrossRef]
- Miller, V.C. A Quantitative Geomorphic Study of Drainage Basin Characteristics in the Clinch Mountain Area Virginia and Tennessee; Columbia University: New York, NY, USA, 1953. [Google Scholar]
- Liu, Z.; Ostrenga, D.; Teng, W.; Kempler, S. Tropical Rainfall Measuring Mission (TRMM) Precipitation Data and Services for Research and Applications. Bull. Am. Meteorol. Soc. 2012, 99, 1317–1325. [Google Scholar] [CrossRef]
- Awange, J.L.; Ferreira, V.G.; Forootan, E.; Andam-Akorful, S.A.; Agutu, N.O.; He, X.F. Uncertainties in remotely sensed precipitation data over Africa. Int. J. Clim. 2016, 36, 303–323. [Google Scholar] [CrossRef]
- Mason, S.J.; Joubert, A.M. Simulated changes in extreme rainfall over southern Africa. Int. J. Climatol. 1997, 17, 291–301. [Google Scholar] [CrossRef]
- Bronstert, A. Floods and climate change: Interactions and impacts. Risk Anal. 2003, 23, 545–557. [Google Scholar] [CrossRef]
- Mirza, M.M.Q.; Warrick, R.A.; Ericksen, N.J. The implications of climate change on floods of the Ganges, Brahmaputra and Meghna rivers in Bangladesh. Clim. Chang. 2003, 57, 287–318. [Google Scholar] [CrossRef]
- Kundzewicz, Z.W.; Kanae, S.; Seneviratne, S.I.; Handmer, J.; Nicholls, N.; Peduzzi, P.; Mechler, R.; Bouwer, L.M.; Arnell, N.; Mach, K.; et al. Flood risk and climate change: Global and regional perspectives. HSJ 2014, 59, 1–28. [Google Scholar] [CrossRef]
- Billi, P.; Alemu, Y.T.; Ciampalini, R. Increased frequency of flash floods in Dire Dawa, Ethiopia: Change in rainfall intensity or human impact? Nat. Hazards 2015, 76, 1373–1394. [Google Scholar] [CrossRef]
- Arnell, N.W.; Gosling, S.N. The impacts of climate change on river flood risk at the global scale. Clim. Chang. 2016, 134, 387–401. [Google Scholar] [CrossRef]
- Sylla, M.B.; Nikiema, P.M.; Gibba, P.; Kebe, I.; Klutse, N.A.B. Climate change over West Africa: Recent trends and future projections. In Adaptation to Climate Change and Variability in Rural West Africa; Yaro, J.A., Hesselberg, J., Eds.; Springer International Publishing: Cham, Switzerland, 2016; pp. 25–40. [Google Scholar]
- Zhang, Y.; Wang, Y.; Chen, Y.; Liang, F.; Liu, H. Assessment of future flash flood inundations in coastal regions under climate change scenarios—A case study of Hadahe River basin in northeastern China. Sci. Total Environ. 2019, 693, 133550. [Google Scholar] [CrossRef]
- Borga, M.; Stoffel, M.; Marchi, L.; Marra, F.; Jakob, M. Hydrogeomorphic response to extreme rainfall in headwater systems: Flash floods and debris flows. J. Hydrol. 2014, 518, 194–205. [Google Scholar] [CrossRef]
- Duan, W.; He, B.; Takara, K.; Luo, P.; Nover, D.; Yamashiki, Y.; Huang, W. Anomalous atmospheric events leading to Kyushu’s flash floods. Nat. Hazards 2014, 73, 1255–1267. [Google Scholar] [CrossRef]
- Bryndal, T.; Franczak, P.; Kroczak, R.; Cabaj, W.; Kołodziej, A. The impact of extreme rainfall and floods on the flood risk management process and geomorphological changes in small Carpathian catchments: A case study of the Kasiniczanka river (Outer Carpathians, Poland). Nat. Hazards 2017, 88, 95–120. [Google Scholar] [CrossRef]
- Pohl, B.; Macron, C.; Monerie, P.A. Fewer rainy days and more extreme rainfall by the end of the century in Southern Africa. Sci. Rep. 2017, 7, 1–7. [Google Scholar] [CrossRef] [PubMed]
- Li, N.; Wang, Z.; Chen, X.; Austin, G. Studies of general precipitation features with TRMM PR data: An extensive overview. Remote Sens. 2019, 11, 80. [Google Scholar] [CrossRef]
- Moazami, S.; Golian, S.; Kavianpour, M.R.; Hong, Y. Comparison of PERSIANN and V7 TRMM Multi-satellite Precipitation Analysis (TMPA) products with rain gauge data over Iran. Int. J. Remote Sens. 2013, 34, 8156–8171. [Google Scholar] [CrossRef]
- Chen, S.; Hong, Y.; Gourley, J.J.; Huffman, G.J.; Tian, Y.; Cao, Q.; Xue, X. Evaluation of the successive V6 and V7 TRMM multisatellite precipitation analysis over the Continental United States. Water Resour. Res. 2013, 49, 8174–8186. [Google Scholar] [CrossRef]
- Chen, C.; Chen, Q.; Duan, Z.; Zhang, J.; Mo, K.; Li, Z.; Tang, G. Multiscale comparative evaluation of the GPM IMERG v5 and TRMM 3B42 v7 precipitation products from 2015 to 2017 over a climate transition area of China. Remote Sens. 2018, 10, 944. [Google Scholar] [CrossRef]
- Njeru, J. The urban political ecology of plastic bag waste problem in Nairobi, Kenya. Geoforum 2006, 37, 1046–1058. [Google Scholar] [CrossRef]
- Lamond, J.; Bhattacharya, N.; Bloch, R. The role of solid waste management as a response to urban flood risk in developing countries, a case study analysis. WIT Trans. Ecol. Environ. 2012, 159, 193–204. [Google Scholar]
- Lebreton, L.; Andrady, A. Future scenarios of global plastic waste generation and disposal. Palgrave Commun. 2019, 5, 6. [Google Scholar] [CrossRef]
- Honingh, D.; van Emmerik, T.; Uijttewaal, W.; Kardhana, H.; Hoes, O.; van de, N. Urban river water level increase through plastic waste accumulation at a rack structure. Front. Earth Sci. 2020, 8, 28. [Google Scholar] [CrossRef]
- van Emmerik, T.; Schwarz, A. Plastic debris in rivers. Wiley Interdiscip. Rev. Water 2020, 7, e1398. [Google Scholar] [CrossRef]
- Fordham, M.; Tunstall, S.; Penning-Rowsell, E.C. Choice and preference in the Thames Floodplain: The beginnings of a participatory approach? Landsc. Urban Plan. 1991, 20, 183–187. [Google Scholar]


| Parameter | Formula | BW1 | BW2 | Regional Range |
|---|---|---|---|---|
| Rh | H/Lb | 0.045 | 0.078 | 0.045–0.111 |
| Rf | A/Lb2 | 0.24 | 0.43 | 0.15–0.64 |
| Rc | 4*pi × A/P2 | 0.37 | 0.45 | 0.24–0.45 |
| Aver. Slope (%) | 14.7 | 25.8 | 13.7–24.4 | |
| Max. slope (%) | 93.9 | 103.5 | 93.9–120.3 | |
| Length (km) | 7.76 | 2.39 | 2.39–7.76 | |
| Area (ha) | 1563 | 244 | 244–1563 |
Publisher’s Note: MDPI stays neutral with regard to jurisdictional claims in published maps and institutional affiliations. |
© 2021 by the authors. Licensee MDPI, Basel, Switzerland. This article is an open access article distributed under the terms and conditions of the Creative Commons Attribution (CC BY) license (https://creativecommons.org/licenses/by/4.0/).
Share and Cite
Dinis, P.A.; Huvi, J.; Cabral Pinto, M.; Carvalho, J. Disastrous Flash Floods Triggered by Moderate to Minor Rainfall Events. Recent Cases in Coastal Benguela (Angola). Hydrology 2021, 8, 73. https://doi.org/10.3390/hydrology8020073
Dinis PA, Huvi J, Cabral Pinto M, Carvalho J. Disastrous Flash Floods Triggered by Moderate to Minor Rainfall Events. Recent Cases in Coastal Benguela (Angola). Hydrology. 2021; 8(2):73. https://doi.org/10.3390/hydrology8020073
Chicago/Turabian StyleDinis, Pedro A., João Huvi, Marina Cabral Pinto, and Joel Carvalho. 2021. "Disastrous Flash Floods Triggered by Moderate to Minor Rainfall Events. Recent Cases in Coastal Benguela (Angola)" Hydrology 8, no. 2: 73. https://doi.org/10.3390/hydrology8020073
APA StyleDinis, P. A., Huvi, J., Cabral Pinto, M., & Carvalho, J. (2021). Disastrous Flash Floods Triggered by Moderate to Minor Rainfall Events. Recent Cases in Coastal Benguela (Angola). Hydrology, 8(2), 73. https://doi.org/10.3390/hydrology8020073