Abstract
This paper concerns the design of a geographic location system to identify urban road sections susceptible to runoff accumulation through the analysis of the efficiency of surface drainage networks. To this end, a combination of Geographic Information Systems (GISs) and stormwater models was proposed. First, GIS hydrology tools were employed to generate all the information required to characterise urban catchments geometrically. Then, a synthetic storm was created from precipitation data obtained through spatial interpolation for a given return period. Finally, the three main hydrological processes occurring in catchments (precipitation loss, transformation and routing) were simulated using the Hydrologic Modeling System (HEC-HMS). The system was tested through a case study of an urban catchment located in the city of Santander (Spain). The results demonstrate its usefulness in detecting critical points in terms of runoff accumulation, according to the efficiency of the existing surface drainage network.
1. Introduction
Urban growth during the second half of the twentieth century heightened the deficiencies of urban infrastructures in terms of rainwater drainage, favouring the occurrence of floods and diffuse pollution [1]. These phenomena are the result of urbanization of catchments, which entails three main changes with respect to their original condition: (1) increased percentage of impervious surface, (2) existence of barriers to water flow (e.g., buildings) and (3) modification of natural water patterns (drainage networks) [2]. Urban development upstream of a catchment causes an alteration in its inflow hydrograph, which increases its runoff volume and resulting flow, whilst the time elapsed from the onset of rainfall until the maximum flow rate is reached (i.e., the time of concentration) decreases [3]. As a result, the likelihood of flooding downstream of the catchment increases.
This scenario highlighted the need for adapting classical hydraulic and hydrologic-related concepts to the urban environment, focusing on the particular rainfall-runoff dynamics of these areas and the assessment of the hydraulic capacity of built-up drainage systems. As a result, the complexity of urban drainage has led to a breakthrough in the development of computer models to facilitate stormwater analysis over the past three decades [4]. In this vein, the most sophisticated advances in the field of stormwater computing concern 2D hydrologic models such as InfoWorks ICM [5], XPSWMM [6] or MIKE+ [7].
However, these tools are not open-source software, which limits their extrapolation potential. An alternative to these models can be found in the combination of a Geographic Information System (GIS) and 1D stormwater tools [8]. GIS enables creating the spatial information related to the geometry of the hydrological elements present in urban areas, whilst stormwater models use this information as inputs to simulate the processes occurring in them. Although some efforts have been made in recent years to integrate both components for runoff determination [9,10,11,12,13], this approach considered them separately to make its potential application as flexible as possible.
The choice of how to choose these tools depends on their compatibility and computing power. Under these premises, the location system proposed in this paper was based on the integration of ArcGIS [14] and the Hydrologic Modeling System (HEC-HMS) [15], linked via HEC-GeoHMS [16]. ArcGIS includes Arc Hydro [17], which provides ad-hoc tools for the discretization of catchments, whilst HEC-HMS contains a variety of methods to model water quantity in urban catchments. The latter has been found to outperform other urban stormwater programs such as SWMM, MIKE 11 NAM or WEC-FLOOD because of its low complexity and computation effort, as well as its friendly user interface and prediction accuracy [18]. HEC- HMS was also preferred over empirical approaches like the Rational Method since the omission of routing processes in its formulation hinders its use for lumped hydrological modelling [19].
Urban drainage is commonly addressed through the modelling of sewer networks, assuming that catchment delineation can be undertaken from a network topology consisting of manholes and pipes. However, catchment areas are actually limited by the location of surface drainage inlets, which are the elements intercepting water in origin [20]. Therefore, the geometric characterization of catchments from these inlets and the analysis of their rainfall-induced water flow discharge capacity should be the first concern when addressing flood risk in urban areas. In this context, the objective of this paper was to develop a new method combining open access data with free hydrologic models in a geographic location system for the detection of urban road sections sensitive to flooding. This method focused on the evaluation of the efficiency of surface drainage networks to mitigate runoff accumulation, which differentiated it from former approaches oriented to the modelling of underground drainage systems.
2. Materials and Methods
The proposed location system consisted of the design of three interrelated components, namely catchment discretization, precipitation and hydrology modules. The latter was simulated in HEC-HMS from the data generated in the first two modules, which were mainly developed in ArcGIS. Figure 1 summarises the tasks carried out to develop each module.
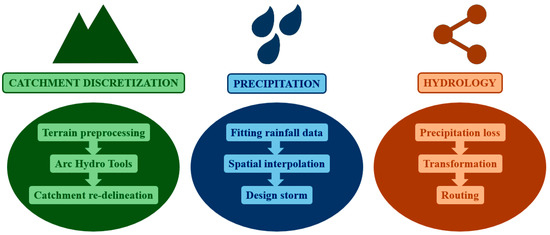
Figure 1.
Breakdown of the proposed methodology into catchment discretization, precipitation and hydrology modules.
2.1. Catchment Discretization Module
One of the most important steps in the development of the proposed location system was the generation of geometric information to characterise the hydrological elements forming urban catchments. Hence, the goal of this stage was the delineation of subcatchments from a predefined stream network through a series of tasks carried out in ArcGIS using its add-on Arc Hydro.
2.1.1. Terrain Preprocessing
Since this research concerned the modelling of urban catchment, the representation of the terrain could not be approached using a model containing information about the ground surface, i.e., a Digital Elevation Model (DEM). Urban areas are characterised by the presence of diverse types of objects on their surface, which highlights the need for a Digital Surface Model (DSM) that captures both natural and built features. However, DSMs are not a widely available resource worldwide.
In the absence of this data and considering that most of the objects influencing water flow in urban areas concern buildings and roads, a DSM was manually created from the combination of a Digital Elevation Model (DEM) in raster format with two feature layers showing the location of buildings and roads. In a recent study, Wu et al. (2019) [21] highlighted the drawbacks of the “stream burning” algorithms commonly available in GIS, especially due to their allocation of constant elevation offsets. The abrupt jumps caused by this approach are not desirable when dealing with a theoretical stream network created from a flow accumulation map. However, this abruptness was sought in this case to represent built-up elements that perform as brusque artificial barriers for flow patterns.
For this purpose, the first step consisted of creating a buffer of a distance equal to the width of the lanes around the roads to represent the surface covered by these infrastructures. Then, a small negative elevation value was allocated to this layer, in order to force water to flow throughout roads once there, simulating the effect of curbs. Similarly, the layer containing the surface occupied by buildings was slightly elevated to make the water flow around these obstacles. Finally, both layers (roads and buildings) were superimposed on the DEM to create the DSM sought.
2.1.2. Arc Hydro Tools
The set of Arc Hydro tools [22] included in ArcGIS 10.2 enabled completing the process of catchment delineation. First, the DSM was refined by correcting inconsistencies in relation to neighbouring cells. Then, the flow accumulated in each cell forming the catchment was determined from a flow direction map obtained according to the eight-direction (D8) flow model. A threshold of flow accumulation was established to determine the cells with which to form the stream network. Finally, the catchment was delineated from the flow direction map and the stream network, whose sections were taken as the outlets from which to define the subcatchments.
2.1.3. Catchment Re-delineation
The process ended with a new division of the subcatchments according to the location of the inlets forming the surface drainage network. This task was accomplished by associating each drainage inlet with a batch point. Hence, the catchment was divided into subcatchments according to both the natural landform of the area and the artificial water interceptions represented by the surface drainage inlets.
This approach contrasts with the traditional and straightforward delineation of catchments based on the division of sewer networks according to the location of their manholes, providing a novel and necessary means for evaluating urban drainage at origin. The discretization of subcatchments according to the position of the manholes is a simplification of the real situation, in which water is first captured by surface inlets and then conveyed throughout the pipes of sewer networks.
2.2. Precipitation Module
The purpose of this module was to design a synthetic storm associated with a return period for the subcatchments using daily rainfall data measured over a period of at least 20 or 30 years, in order to obtain reliable conclusions from precipitation data [23]. Since these data are usually provided in point format, the Geostatistical Wizard tool of ArcGIS was used to carry out their conversion into a continuous surface with values of rainfall. The remaining tasks in this module were undertaken with the support of MS Excel spreadsheets.
2.2.1. Fitting Rainfall Data
Rainfall data consisted of a set of daily precipitation measurements with unknown patterns of distribution. The first task in this module was to obtain the maximum daily rainfall for a certain return period with which to assess the efficiency of the surface drainage network. In line with the recommendations found in specialised literature [24,25], a 10-year return period was selected for this purpose. This is consistent with the common magnitude of urban catchments, which have short times of concentration and high peak flow rates [26].
To find the best fit to the pattern of precipitation measures in each observation point, the Kolmogorov–Smirnov (K–S) and Anderson–Darling (A–D) goodness-of-fit tests were calculated for 64 different probability distributions. The accuracy of these distributions was appraised by checking whether their associated K–S and A–D statistics ( and ) were greater than their corresponding limit in the table of critical values or not.
2.2.2. Spatial Interpolation
Spatial interpolation was used to create a precipitation map from the point values of maximum daily rainfall calculated in the previous step. Interpolation techniques are usually divided into deterministic and geostatistical methods [27]. The former rely on mathematical functions to predict values at unknown locations based on their degree of similarity in relation with neighbouring data points (Burrough & McDonnell, 1998), whilst the latter incorporate statistical procedures to provide probabilistic estimates of the quality of the interpolation surface according to its spatial autocorrelation [28]. Table 1 summarises the main characteristics of the six methods used to interpolate precipitation.

Table 1.
Main features of the interpolation methods used.
The goodness of the predictions obtained through these interpolation methods was measured through cross-validation, which consists of the three following steps [29]: (1) removing a point from the set of measured points, (2) estimating the value at the removed point using the remaining points and (3) calculating the predicted error in the estimation by comparison with the measured value. The goodness-of-fit of the cross-validation process was measured through the Root Mean Square Error (RMSE) and the Pearson correlation coefficient, representing the sample standard deviation of the differences between measured and predicted values and their linear relationship, respectively.
The prediction map obtained from spatial interpolation provided information on the maximum daily rainfall at each pixel within the workspace. From these values, the average precipitation of each subcatchment was calculated using zonal statistical techniques.
2.2.3. Design Storm
Témez (1987) [30] developed a regionalization study in Spain that enabled obtaining rainfall intensity from values of precipitation and storm duration. Hence, in relation to the IDF (Intensity–Duration–Frequency) curves, this formulation omits the frequency and becomes the Intensity–Duration (ID) law expressed in Equation (1). These curves stem from the union of ID points representing average intensities at intervals with different duration, such that they all correspond to the same frequency or return period.
where is the average precipitation in each subcatchment (mm), is the storm duration (min) and is the regional factor, which denotes the variation produced in precipitation due to location and can be consulted in the Highway Design Manual for Spain [31].
Since the design of these storms was oriented to urban areas, a storm duration equal to the time of concentration in the catchment was assumed [32]. In turn, this time of concentration was determined as the longest flow path in the catchment using ArcGIS, based on the filled DSM and flow direction map.
With rainfall intensity and storm duration as inputs, the Alternating Block method [33] was applied to design synthetic storms. It consisted of calculating values of precipitation (blocks) for different duration intervals or blocks , such that . Then, these blocks were distributed alternately on each side around the highest value of precipitation in order to design the synthetic storms sought.
2.3. Hydrology Module
This module aimed at outlining the hydrological processes that take place in urban catchments, which were divided into precipitation loss, transformation and routing. These three steps were run in HEC-HMS, based on the information generated in the two previous modules. The hydrological response of urban catchments was simulated with and without considering their existing surface drainage systems in order to evaluate its efficiency to capture runoff.
2.3.1. Precipitation Loss
The first causes of precipitation losses are infiltration and surface retention. These losses were measured through the Runoff Curve Number (CN) method proposed by the Soil Conservation Service (SCS) [34]. The CN expresses direct runoff generated by rainfall according to Equation (2).
where is the runoff threshold expressed in mm, a coefficient indicating regional variation in soil moisture at the beginning of rainfall. The calculation of this coefficient was approached by correlating its categories with those of a land cover database, which is a very common source of data in GIS format.
The second factor affecting this process is the imperviousness of the surface. The delineation of the areas covered by buildings and roads was instantaneous from the layers prepared in the catchment discretization module. The contribution of other elements to increasing the degree of imperviousness of urban catchments, such as parking spaces, was calculated by measuring their areas with the support of aerial photography.
Finally, the presence of surface drainage networks involves flow diversions at the locations of their inlets. According to Subramanya (1982) [35], the flow over a drain grate () can be assimilated to a spatially variable flow discharged through an orifice. Consequently, this was expressed using the one-dimensional formula shown in Equation (3).
where is the discharge coefficient of the grate, is its opening area (cm2), is the standard acceleration of gravity and is the water depth at that point (cm). The discharge coefficient varies depending on the geometry of the grate. The Flumen Institute [20] carried out a study of the interception capacity of several different grate configurations, resulting in the discharge coefficients compiled in Table 2.
Table 2.
Characteristics of the grates considered.
2.3.2. Transformation
Synthetic hydrographs provide an empiric representation of the response of small catchments to short and uniform rainfall events. Among them, the SCS hydrograph is one of the most widely used and cited models in specialised literature related to surface hydrology [36]. It is triangular and provides the basic hydrological parameters of a hydrograph. Based on the observation of a series of hydrographs caused by short and uniform rainfall events, Equation (4) was developed to relate duration of the net precipitation (), peak time (), lag time () and time of concentration (). The relationship between the last two terms, by which was expressed as 60% of , was empirically defined by the SCS [37].
Since this triangular approximation is too simple, the SCS technicians proposed a conversion of the pair of values flow-time from the analysis and study of many real hydrographs, such that the peak values for all of them were equal to 1. The application of this transformation was found to result in a much more realistic representation of what can really happen in a catchment.
2.3.3. Routing
This process consists of determining a hydrograph at a certain point from another hydrograph located upstream of that point [38]. The Muskingum method is one of the most widely used approaches to characterise routing, due to its simplicity and ease of application [39]. Routing storage () over a reach was divided into prism storage, which is proportional to the outflow (), and wedge storage, which depends on the difference between inflow () and outflow (see Equation (5)).
where is a dimensionless constant allocating more or less importance to prism or wedge storage, whose value ranges between 0 and 0.5, depending on the slope of the reach. can be assimilated to the travel time of the kinematic wave from one end of the reach to the other [38]. The simulation interval was checked to be greater than in all cases; otherwise, the reaches would have been segmented into several subreaches until that condition was accomplished.
3. Results and Discussion
The proposed method was applied to the city of Santander (Spain). For magnitude reasons, the results were limited to a specific catchment located in the Monte-Corbanera neighbourhood, in the north of Santander, since the hydrologic simulation of the whole city would be unapproachable in computational terms. The Santander City Council supplied the feature layers of the surface drainage network, roads and buildings at a scale of 1:5000. The DEM was acquired from the National Centre of Geographic Information (CNIG) in ASCII format with a cell size of 5 m. The Ministry of Environment and Territory of the Cantabrian Government supplied a Corine Land Cover (CLC) 2006 map at a scale of 1:100,000. Finally, daily rainfall data between 1954 and 2003 with a resolution of 1 km2 were obtained for the whole city from the Santander Meteorology Group [40]. Since these data were not integrated in ArcGIS but exported separately to HEC-HMS in the form of statistics per subcatchment, there was no need to resample them to the same cell size.
3.1. Catchment Discretization Module
Figure 2 shows the DSM obtained after applying the terrain preprocessing to the original DEM. The visual inspection of this map demonstrates that buildings and roads were the most and least raised elements in each zone of the DSM, respectively. Thus, water was forced to flow alongside buildings and through roads, wherever appropriate. The DSM stemming from this process could be considered more rigorous than a LIDAR-based DSM since the latter is very susceptible to registering noisy data. In contrast, vector layers as those included in the proposed approach are much more reliable and easy to update.
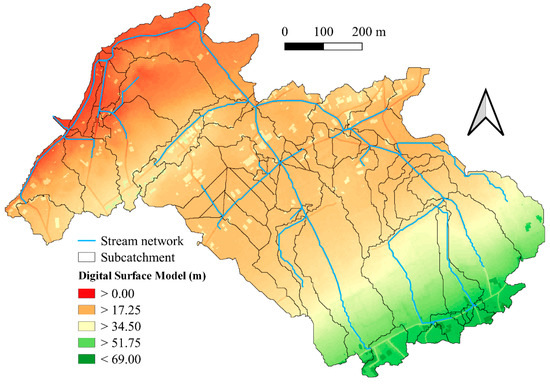
Figure 2.
Digital Surface Model (m) and delineation of the Monte-Corbanera catchment.
An accumulation threshold of 5000 cells was set to define the stream network after several tests with different values, which proved that the subsequent networks started to converge at that limit. The re-delineation process according to the surface drainage inlets resulted in a catchment formed by 67 subcatchments (see Figure 2). According to the total area of the workspace, this involved 1.02 subcatchments per hectare.
3.2. Precipitation Module
The Wakeby function was found to provide the best fit for most of the rainfall data series at the measured points according to the K–S and A–D statistics, followed by the Johnson SB distribution. This function has three shape parameters, which enables fitting a variety of different patterns. From the values obtained for a 10-year return period, six maps of maximum daily precipitation for the whole city of Santander were drawn using three deterministic (IDW, RBF and CPI) and three geostatistical methods (OK, SK and EBK). In general, the latter yielded more accurate and gradual interpolation surfaces than the former, since observed rainfall data fulfilled the assumptions of normality and stationarity, which enabled maximizing the potential and precision of geostatistical techniques. Among the latter, an RMSE of 1.073 and a Pearson correlation coefficient of 0.926 (significant at the 0.01 level) between measured and predicted values suggested that OK provided a slightly better interpolation surface (Figure 3a) for the catchment area than SK and EBK.
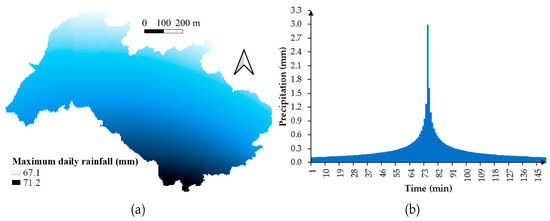
Figure 3.
(a) Maximum daily rainfall (mm) obtained through spatial interpolation. (b) Design hyetograph for the study catchment.
The application of zonal statistics to this map enabled obtaining the average intensity for the study catchment through Equation (1). According to the time of concentration of the catchment, the storm duration was 150 min (see Equation (4)). From these values and a regional factor of 8.75 [31], the hyetograph for the Monte-Corbanera catchment was calculated using the Alternating Block method. The values of precipitation thus obtained are depicted in Figure 3b.
3.3. Hydrology Module
The CN of each subcatchment was determined by relating land cover types to runoff threshold categories [31] according to the CLC map and applying Equation (2), as depicted in Figure 4. The percentage of imperviousness was directly measured using aerial photography of the catchment from the area covered by roads, buildings and parking spaces. Although these areas might not be 100% impervious, the coupled consideration of this variable and the CN sought to reproduce surface permeability across the catchment accurately.
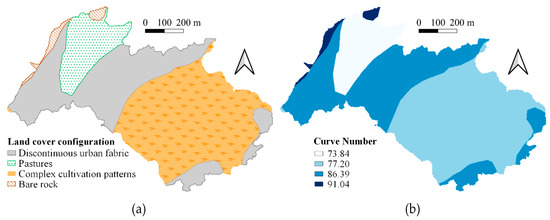
Figure 4.
(a) Land cover map of the Monte-Corbanera catchment. (b) Values of curve number associated with the types of surface in the study area.
The seventh of the types of grates listed in Table 2 was found to provide the best fit to the characteristics of the surface drainage network of the Monte-Corbanera catchment. All other inputs required to build the hydrology module were geometric features of the catchment, such as slope and lag time or length of individual reaches. The final scheme of the Monte-Corbanera catchment in HEC-HMS is depicted in Figure 5, which represents the 67 subcatchments connected by either junctions (Ji) or discharge points (Di). Junctions are nodes whose function is simply to join two subcatchments and give continuity to the stream network, whilst discharge points also reduce water flow, representing the stormwater inlets of the existing surface drainage network.
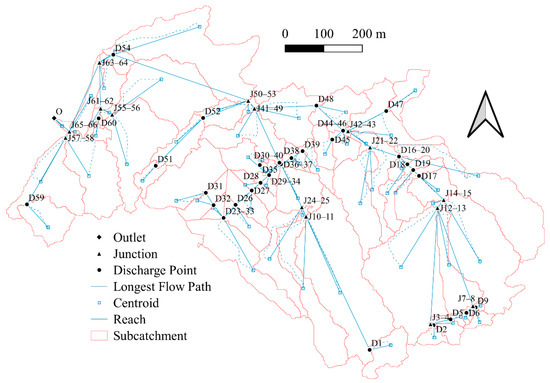
Figure 5.
Schematic representation of the nodes (junctions and discharge points) in the Monte-Corbanera catchment.
Although the storm lasted 150 min, the duration of the simulation was increased, since runoff continues after the end of the downpour until water is lost by infiltration, retention and diversion processes. Based on the influence of these processes on the Monte-Corbanera catchment, simulations were run for a period of 240 min. Furthermore, the simulation interval was set to the minimum value allowable by HEC-HMS (1 min) in order to minimise continuity errors in the network schematised in Figure 5. To quantify the efficiency of the existing surface drainage network in reducing runoff, the values of outflow volume for each node in the catchment were computed under two scenarios: with and without the existing surface drainage network (Figure 6).
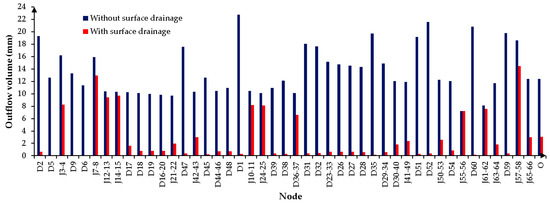
Figure 6.
Outflow volume (mm) in the nodes of the study catchment, with and without surface drainage network.
The results demonstrated the usefulness of the system in identifying critical points (peaks) in terms of drainage. Furthermore, the differences between the two simulated cases highlighted the effect of the existing surface drainage network, whose presence considerably attenuated both flow rate and volume. To verify the significance of these differences, statistical tests were conducted. An exploratory analysis revealed that the values of outflow under both scenarios were not normally distributed according to the Saphiro–Wilk test (p-values < 0.01). Consequently, the Mann–Whitney U nonparametric test was applied to compare both samples of data. Again, the p-value yielded by the test was below a significance level of 0.01, thereby providing statistical evidence of the significant impact of the existing surface drainage system in the hydrological response of the study catchment.
However, some elements (J3-4, J7-8, J10-11, J12-13, J14-15, J24-25, D36-37, J55-56, J57-58 or J61-62) still showed high values for both parameters. Most of these elements belonged to the group defined as junctions, i.e., they were in areas unconnected to the drainage network. This fact, coupled with the degree of surface imperviousness of upstream subcatchments, explained the accumulation of runoff volumes at these junctions. Regarding node D36-37, which was the only case in which the surface drainage network was unable to drain runoff, its high values were due to the upstream subcatchments draining into it. Their areas were not large enough to enable permeable surfaces infiltrating some of the runoff generated, which resulted in an excess of water volume that the existing surface drainage network was incapable to deal with.
This situation can lead to runoff accumulation in the road sections associated with these elements. As illustrated in Figure 2, the approach taken to build the DSM forced the stream network to coincide with the roads in the study area. Consequently, the parts of the stream network connected to these problematic junctions and discharge points served to identify which road sections were more sensitive to runoff accumulation. The presence of these high outflow volumes should lead to the design of rehabilitation strategies aimed at their reduction at such problematic sites. This plan should consist of either expanding the conventional surface drainage network or, preferably, implementing best management practices for attenuating runoff accumulation at strategic areas [41]. As proof of the validity and reliability of the results achieved, these drainage deficiencies have led the City Council to implement the first option for rehabilitating this specific neighbourhood through a two-step initiative [42,43].
4. Conclusions
This paper proposed a new method combining open access data with free hydrologic models in a geographic location system aimed at detecting urban road sections prone to accumulate large runoff volumes after a rainfall event, based on the analysis of the efficiency of surface drainage networks. The knowledge provided by this system, which was founded on the novel oriented combination of two tools such as ArcGIS and HEC-HMS, is destined to lead to an improvement in urban water management since it enables focusing on the rehabilitation of the most critical urban areas in terms of runoff accumulation.
The approach presented in this paper differed from the trend found in previous urban rainfall-runoff studies, since it focuses on the discharge capacity of the inlets forming surface drainage networks, instead of the common practice of analysing the behaviour of underground sewer systems. Drain inlets are the elements really defining catchment areas since they are responsible for intercepting water flow at origin. Therefore, any hydrologic calculation in urban areas should be developed based on both the natural elevation model of the region and the artificial flow interceptions caused by these surface drainage inlets. However, current models lack this level of detail and assume that catchment areas are delineated from the manholes of existing sewer networks.
Since this location system includes parameters related to the types of surface and their degree of imperviousness, its applicability is not restricted to urban areas but can also be extended to model rural catchments. More specific conclusions drawn from this study are provided below:
- In the absence of a DSM of the workspace, the overlay of a DEM and rasterised vector layers containing data about buildings and roads is a suitable alternative to produce this information.
- The common size of urban catchments discourages the discretization of the design storm for their subcatchments, as shown through the case study where the hyetographs of the 67 subcatchments were almost identical.
- The hydrological methods chosen to model precipitation loss, transformation and routing are fully compatible with a location system fed by spatial data, since they use inputs that can be easily obtained through GIS-based editing techniques and zonal statistic tools.
Although the results achieved through the study catchment in Santander were consistent with the actions taken by the City Council to improve its drainage systems, their accuracy should be appraised quantitatively by comparison with monitored data at specific drain inlets. Replacing the role of stormwater models by multi-attribute scoring methods implementable in GIS might be another future field of investigation to increase the applicability of this approach. Further research should also focus on testing this location system using different data resolutions in order to reduce potential sources of uncertainty related to the scale of the inputs and the size of urban catchments.
Author Contributions
Conceptualization, D.J.-E.; methodology, D.J.-E.; formal analysis, D.J.-E., S.P.; data curation, D.J.-E.; writing—original draft preparation, D.J.-E. and S.P.; writing—review and editing, D.J.-E. and S.P.; visualization, D.J.-E. All authors have read and agreed to the published version of the manuscript.
Funding
This research received no external funding.
Institutional Review Board Statement
Not applicable.
Informed Consent Statement
Not applicable.
Data Availability Statement
All the data used in this study are contained within the article.
Acknowledgments
The authors wish to express their gratitude to all the entities that provided the data necessary to develop this study: Santander City Council, CNIG, Santander Meteorology Group, the Ministry of Environment and Territory of the Government of Cantabria and the FLUMEN Research Group.
Conflicts of Interest
The authors declare no conflict of interest.
References
- Castro-Fresno, D.; Andrés-Valeri, V.C.; Sañudo-Fontaneda, L.A.; Rodriguez-Hernandez, J. Sustainable Drainage Practices in Spain, Specially Focused on Pervious Pavements. Water 2013, 5, 67–93. [Google Scholar] [CrossRef]
- Hameed, H.M. Estimating the Effect of Urban Growth on Annual Runoff Volume Using GIS in the Erbil Sub-Basin of the Kurdistan Region of Iraq. Hydrology 2017, 4, 12. [Google Scholar] [CrossRef]
- Hasan, H.H.; Razali, S.F.M.; Zaki, A.Z.I.A.; Hamzah, F.M. Integrated Hydrological-Hydraulic Model for Flood Simulation in Tropical Urban Catchment. Sustainability 2019, 11, 6700. [Google Scholar] [CrossRef]
- Raju, K.S.; Kumar, D.N. Hydrological Modeling. In Impact of Climate Change on Water Resources: With Modeling Techniques and Case Studies; Springer: Singapore, 2018; pp. 137–167. ISBN 978-981-10-6110-3. [Google Scholar]
- Innovyze Advanced Hydraulic and Hydrologic Modeling. InfoWorks ICM. Available online: https://www.innovyze.com/en-us/products/infoworks-icm (accessed on 19 April 2021).
- Innovyze Sanitary, Storm and Flood Modeling Software. XPSWMM. Available online: https://www.innovyze.com/en-us/products/xpswmm (accessed on 19 April 2021).
- MIKE. MIKE+ Flooding. Available online: https://www.mikepoweredbydhi.com/products/mikeplus/flooding/ (accessed on 19 April 2021).
- Doaemo, W.; Wuest, L.; Bajaj, S.; Jaafar, W.S.W.M.; Mohan, M. Analytical Protocol to Estimate the Relative Importance of Environmental and Anthropogenic Factors in Influencing Runoff Quality in the Bumbu Watershed, Papua New Guinea. Hydrology 2020, 7, 77. [Google Scholar] [CrossRef]
- Helmi, N.R.; Verbeiren, B.; Wirion, C.; Van Griensven, A.; Weerasinghe, I.; Bauwens, W. WetSpa-Urban: An Adapted Version of WetSpa-Python, A Suitable Tool for Detailed Runoff Calculation in Urban Areas. Water 2019, 11, 2460. [Google Scholar] [CrossRef]
- Hernández-Guzmán, R.; Ruiz-Luna, A.; Mendoza, E. Sara4r: An R graphical user interface (GUI) to estimate watershed surface runoff applying the NRCS—Curve number method. J. Hydroinform. 2021, 23, 76–87. [Google Scholar] [CrossRef]
- Yang, G.; Best, E.P. Spatial optimization of watershed management practices for nitrogen load reduction using a modeling-optimization framework. J. Environ. Manag. 2015, 161, 252–260. [Google Scholar] [CrossRef]
- Chen, C.-F.; Sheng, M.-Y.; Chang, C.-L.; Kang, S.-F.; Lin, J.-Y. Application of the SUSTAIN Model to a Watershed-Scale Case for Water Quality Management. Water 2014, 6, 3575–3589. [Google Scholar] [CrossRef]
- Akhter, M.S.; Hewa, G.A. The Use of PCSWMM for Assessing the Impacts of Land Use Changes on Hydrological Responses and Performance of WSUD in Managing the Impacts at Myponga Catchment, South Australia. Water 2016, 8, 511. [Google Scholar] [CrossRef]
- Esri ArcGIS Desktop. Desktop GIS Software Suite. Available online: https://www.esri.com/en-us/arcgis/products/arcgis-desktop/overview (accessed on 1 April 2021).
- US Army Corps of Engineers HEC-HMS. Available online: https://www.hec.usace.army.mil/software/hec-hms/ (accessed on 1 April 2021).
- US Army Corps of Engineers HEC-GeoHMS. Available online: https://www.hec.usace.army.mil/software/hec-geohms/ (accessed on 1 April 2021).
- Maidment, D.R.; Maidment, D.R.; Morehouse, S. Arc Hydro: GIS for Water Resources; Esri Press: Redlands, CA, USA, 2002; ISBN 9781589480346. [Google Scholar]
- Filianoti, P.; Gurnari, L.; Zema, D.; Bombino, G.; Sinagra, M.; Tucciarelli, T. An Evaluation Matrix to Compare Computer Hydrological Models for Flood Predictions. Hydrology 2020, 7, 42. [Google Scholar] [CrossRef]
- Michailidi, E.M.; Antoniadi, S.; Koukouvinos, A.; Bacchi, B.; Efstratiadis, A. Timing the time of concentration: Shedding light on a paradox. Hydrol. Sci. J. 2018, 63, 721–740. [Google Scholar] [CrossRef]
- Gómez Valentín, M. Análisis del comportamiento hidráulico de rejas y sumideros. In Hidrología Urbana; Flumen Institute: Barcelona, Spain, 2007; pp. 135–146. [Google Scholar]
- Wu, T.; Li, J.; Li, T.; Sivakumar, B.; Zhang, G.; Wang, G. High-efficient extraction of drainage networks from digital elevation models constrained by enhanced flow enforcement from known river maps. Geomorphology 2019, 340, 184–201. [Google Scholar] [CrossRef]
- Jenson, S.K.; Domingue, J.O. Extracting topographic structure from digital elevation data for geographic information system analysis. Photogramm. Eng. Remote Sens. 1988, 54, 1593–1600. [Google Scholar]
- Sánchez San Román, J. Cálculos Estadísticos en Hidrología; Universidad de Salamanca: Salamanca, Spain, 2013. [Google Scholar]
- Butler, D.; Digman, C.J.; Makropoulos, C.; Davies, J.W. Urban Drainage; Taylor & Francis: Abingdon, UK; CRC Press: Boca Raton, FL, USA, 2018; ISBN 9781498750608. [Google Scholar]
- Jato-Espino, D.; Charlesworth, S.M.; Bayon, J.R.; Warwick, F. Rainfall–Runoff Simulations to Assess the Potential of SuDS for Mitigating Flooding in Highly Urbanized Catchments. Int. J. Environ. Res. Public Health 2016, 13, 149. [Google Scholar] [CrossRef] [PubMed]
- Gwenzi, W.; Nyamadzawo, G. Hydrological Impacts of Urbanization and Urban Roof Water Harvesting in Water-limited Catchments: A Review. Environ. Process. 2014, 1, 573–593. [Google Scholar] [CrossRef]
- Eldrandaly, K.A.; Abu-Zaid, M.S. Comparison of six GIS-based spatial interpolation methods for estimating air temperature in western saudi arabia. J. Environ. Inform. 2011, 18, 38–45. [Google Scholar] [CrossRef]
- Manson, S.M.; Burrough, P.A.; McDonnell, R.A. Principles of Geographical Information Systems: Spatial Information Systems and Geostatistics. Econ. Geogr. 1999, 75, 422–423. [Google Scholar] [CrossRef]
- Greenberg, J.D.; Logsdon, M.G.; Franklin, J.F. Introduction to Geographic Information Systems (GIS). In Learning Landscape Ecology: A Practical Guide to Concepts and Techniques; Gergel, S.E., Turner, M.G., Eds.; Springer: New York, NY, USA, 2002; pp. 17–31. ISBN 978-0-387-21613-3. [Google Scholar]
- Témez, J.R. Cálculo Hidrometeorológico de Caudales Máximos en Peaueñas Cuencas Naturales; Centro de Estudios Hidrográficos: Madrid, Spain, 1987. [Google Scholar]
- BOE. Norma 5.2-IC. Drenaje Superficial; Official State Gazette: Madrid, Spain, 2016; p. 142. [Google Scholar]
- Andrzej, W.; Artur, R.-P.; Agnieszka, C.; Jon, H.; Michał, P. Influence of Changes of Catchment Permeability and Frequency of Rainfall on Critical Storm Duration in an Urbanized Catchment-A Case Study, Cracow, Poland. Water 2019, 11, 2557. [Google Scholar]
- Chow, V.; Maidment, D.; Mays, L. Applied Hydrology; McGraw-Hill: New York, NY, USA, 2013; ISBN 9780071743914. [Google Scholar]
- Mishra, S.K.; Singh, V.P. SCS-CN Method. In Climate Change Impacts on Water Resources; Springer: Berlin/Heidelberg, Germany, 2003; Volume 42, pp. 84–146. [Google Scholar]
- Subramanya, K. Flow in Open Channels; McGraw-Hill: New York, NY, USA, 2009; ISBN 9780070086951. [Google Scholar]
- Dan-Jumbo, N.G.; Metzger, M. Relative Effect of Location Alternatives on Urban Hydrology. The Case of Greater Port-Harcourt Watershed, Niger Delta. Hydrology 2019, 6, 82. [Google Scholar] [CrossRef]
- USDA Time of Concentration. In National Engineering Handbook. Section 4, Hydrology; U.S. Department of Agriculture, Soil Conservation Service, Engineering Division: Washington, DC, USA, 1972; p. 29.
- Sánchez San Román, J. Tránsito de Hidrogramas; Universidad de Salamanca: Salamanca, Spain, 2013. [Google Scholar]
- Montes, N.; Aranda, J. Ángel; García-Bartual, R. Real Time Flow Forecasting in a Mountain River Catchment Using Conceptual Models with Simple Error Correction Scheme. Water 2020, 12, 1484. [Google Scholar] [CrossRef]
- Gutiérrez, J.M.; Herrera, S.; San Martín, D.; Sordo, C.; Rodríguez, J.J.; Frochoso, M.; Ancell, R.; Fernández, J.; Cofiño, A.S.; Pons, M.R. Escenarios Regionales Probabilísticos de Cambio Climático en Cantabria: Termopluviometría; Gobierno de Cantabria; Consejería de Medio Ambiente y Universidad de Cantabria: Santander, Spain, 2010. [Google Scholar]
- Charlesworth, S.M. A review of the adaptation and mitigation of global climate change using sustainable drainage in cities. J. Water Clim. Chang. 2010, 1, 165–180. [Google Scholar] [CrossRef]
- Santander City Council El Ayuntamiento Invertirá más de 215.000 Euros en la Renovación de la Red de Alcantarillado Entre el Barrio de Monte, en Corbanera, y San Pedro del Mar. Available online: https://noticias-de-santander.com/el-ayuntamiento-invertira-mas-de-215-000-euros-en-la-renovacion-de-la-red-de-alcantarillado-entre-el-barrio-de-monte-en-corbanera-y-san-pedro-del-mar/ (accessed on 1 April 2021).
- Europapress El Ayuntamiento Acometerá un Nuevo Plan de Mejora de Vials. Available online: https://www.europapress.es/cantabria/noticia-ayuntamiento-pide-propuestas-aavv-nuevo-plan-mejora-viales-barrios-20150825130914.html (accessed on 1 April 2021).


Publisher’s Note: MDPI stays neutral with regard to jurisdictional claims in published maps and institutional affiliations. |
© 2021 by the authors. Licensee MDPI, Basel, Switzerland. This article is an open access article distributed under the terms and conditions of the Creative Commons Attribution (CC BY) license (https://creativecommons.org/licenses/by/4.0/).