Article

River Flow Alterations Caused by Intense Anthropogenic Uses and Future Climate Variability Implications in the Balkans

by
Christina Papadaki
* and
Elias Dimitriou
Hellenic Centre for Marine Research, Institute of Marine Biological Resources and Inland Waters, 19013 Anavyssos, Greece
*
Author to whom correspondence should be addressed.
Hydrology 2021, 8(1), 7; https://doi.org/10.3390/hydrology8010007
Submission received: 16 November 2020 / Revised: 31 December 2020 / Accepted: 5 January 2021 / Published: 10 January 2021

Abstract

:
River flow alterations, caused by climate variability/change and intense anthropogenic uses (e.g., flow regulation by dams) are considered among the main global challenges of which hydrologists should be dealing with. For the purpose of this study, environmental flow and potential hydrological alterations are made for the extended Drin river basin, with limited historical hydrological information available. To overcome this limitation environmental flow assessment is made using simulated streamflow data from a watershed hydrological model. Descriptive statistics applied to streamflow values indicate that median monthly flows with no anthropogenic uses are consistently greater than those with anthropogenic uses by 0–37.4 m3/s in all subbasins. Moreover, an investigation of potential climate variability/change impact on river flow regime is made using streamflow simulations from a global hydrological model. Results indicate that hydrologic alteration is intense between nonregulated and regulated streamflow conditions. More specifically, for all Global Circulation Models and Regional Climate Models combinations, and both regulated and unregulated streamflow conditions, the minimum discharge values had statistically significant decreasing trends, except one combination (RCP 4.5–RCA4/ECEARTH) for unregulated conditions. Finally, results from this preliminary analysis could enhance the necessary conversations among all relevant stakeholders to discuss and decide on sustainable water resources management issues for the development of a Drin Basin Management Plan in the future.

1. Introduction

Environmental flows represent the water required to sustain freshwater and estuarine ecosystems, and the human livelihoods that depend on these ecosystems [1,2]. River water designated for environmental outcomes can be either flow remaining in the river protected from abstraction, or actively released water from storages to achieve desired ecosystem outcomes [3].
All components of a flow regime influence the river ecosystems [4]. River flow alterations may be caused by numerous factors; including climate variability/change and flow regulation by dams [3,5]. Hydromorphological pressures may cause alteration to the natural flow regime of rivers [6]. Hence, there is an urgent need to develop sustainable environmental flow management guidelines [7], especially in areas where flow—ecology relationships have not been well established.
Most of the Balkan rivers are liable to flash floods and low flows during summer conditions. Large discharge reductions over the last decades have been attributed to decreases in precipitation and (mis)management. In the post−war Balkan context, interrelations between political destabilization, economic crises, administrative and structural constraints, poor environmental planning and inspection, and usually a lack of environmental awareness imposed significant pressures on rivers. Large wetland areas were drained in favor of widespread intensive agriculture [8]. Rivers’ ecosystem functions have been significantly influenced by the climate variability/change, irrational exploitation, and utilization of water resources such as irrigation and dam regulation in the extended Drin river basin.
Environmental flow requirements and flow alterations due to intense anthropogenic uses of water in the extended Drin river basin, located in the western Balkans, have not been adequately addressed and discussed in the past. Quantification of the environmental flows in this area is a challenging task. The area is characterized by complexity regarding the water management related issues [9,10,11,12,13]. Moreover, the amount of energy produced by hydropower, especially in Albania, has steadily increased over the years, representing approximately 70% of the total hydro and thermal installed capacity in the country nowadays [14]. Nevertheless, this anthropogenic activity is causing alteration to the hydrological characteristics of the rivers, disrupting the ecological continuity [15]. Furthermore, heavy precipitation events in the extended Drin river basin together with cascade dam−break floods, often cause extensive flooding, loss of human life, and economic loss including property damage, lifeline disruption, and environmental damage [16,17]. According to the Global Reservoir and Dam Database (GRanD) there are at least six dams greater than 15 m in height and with a reservoir of more than 0.1 km3 located in the extended Drin Basin [18]. However, existing discharge datasets are usually scarce, dispersed, heterogeneous, and difficult to access and most of the subbasins still remain ungauged. On the contrary, uncertainties associated with the impact of climate variability/change on streamflow could be due to General Circulation Models, Climate Change Scenarios, downscaling methods, and hydrological simulations [19,20].
Each environmental flow assessment method has certain advantages and limitations. Before selecting from the available methods, several factors need to be considered such as the resources available, the practical constraints, and data availability. In this case, only a few measured hydrological time series are available, and there is an absence of ecological data (fish, macroinvertebrates, etc.). To overcome this limitation, the simulated time series of required hydrological variables (discharge) are used for the assessment of environmental flows. The objectives of this study at two different scales are: (1) to estimate and compare environmental flows, using hydrological methods for streamflow conditions incorporating the anthropogenic uses (dam regulation, irrigation, water supply) and for streamflow conditions with no anthropogenic uses; (2) to investigate potential hydrological alterations and trends in streamflow, underregulated (anthropogenic uses) and unregulated (natural flow regime) conditions, influenced by climate change scenarios as described by Representative Concentration Pathways (RCP) models adopted by the Intergovernmental Panel on Climate Change (IPCC); more specifically, the stabilization scenario (RCP4.5) and the high greenhouse gas scenario (RCP8.5). Results of this study are expected to improve our knowledge of water uses in the area and help planners to establish effective water utilization and allocation policies.

2. Study Area and Data

2.1. Study Area

This study is focused on the extended Drin river basin which covers an area of about 18,884 km2 located in the southwestern Balkans. The transboundary river basin is shared between Albania, North Macedonia, Kosovo, and Montenegro (Figure 1). Subbasins are formed by the rivers Drin, Black Drin, White Drin, and Buna/Bojana, as well as Lake Ohrid (Figure 1). Drin and the Buna/Bojana Rivers meet approximately 30 km, before they discharge into the Adriatic Sea at the border of Albania and Montenegro [21].
The area of the Drin subbasin is approximately 14,173 km2 and the Buna/Bojana subbasin is 5187 km2 [21]. Land use is dominated by forests (69.3%), followed by agriculture (25%), water bodies (4%), and artificial surfaces (1.7%) (Copernicus Service Information 2018 CORINE Land Cover (CLC) 2018, version 20. Accessed: https://land.copernicus.eu/pan-european/corine-land-cover/clc2018).

2.2. Data

2.2.1. Streamflow Conditions Derived from the Hydrologic Catchment Model PANTA RHEI

Monthly simulated hydrological data derived from the hydrologic watershed model which was set up for the Drin-Bojana river basin on the basis of the distributed physically−based hydrologic modeling system PANTA RHEI [22,23,24] were used. The PANTA RHEI simulations cover a ten-year period (November 2001 to November 2010). Streamflow with no anthropogenic uses in terms of water consumptions (urban, reservoir/dam regulation, agricultural, and industrial use), as they were estimated by a Global Environment Facility (GEF) Drin Project (http://drincorda.iwlearn.org/gef-supported-drin-project), is established as the baseline in the outlet of each subbasin.

2.2.2. Streamflow Conditions Impacted by Climate Variability/Change

Projected future flows from 2011 to 2100, forced by future climate scenarios derived from climate ensembles and the “Europe—Hydrological Predictions for the Environment”; (E HYPE) (version 3.1.2) hydrological model [25,26], were selected to investigate future climatic projections on the hydrological regimes (for both regulated and unregulated conditions) of the study area. E HYPE is a well−established hydrological model [25] simulating flow to generate processes from meteorological input data, by considering snowmelt, evapotranspiration, soil moisture, groundwater fluctuations, routing in lakes, and streams. It also includes routines for simulating regulation in hydropower reservoirs. Regulated flow time series incorporate the influence of anthropogenic alterations (e.g., hydropower regulations, reservoir/dam regulation irrigation abstractions, etc.), while the opposite occurs for the unregulated conditions.
For this study purpose, a combination of Global Circulation Models (GCM) and Regional Climate Models (RCM) were selected: The Max−Planck−Institute Earth system model (MPI−ESM) modified by dynamic downscaling with the regional model REMO for Europe (combination name MPI−ESM−LR_REMO2009) [27] and the European Consortium Earth System Model (EC −EARTH) modified by the Rossby Center Regional atmospheric Model (RCA4) (combination name EC−EARTH/RCA4). Both aforementioned models are forced by two Representative Concentration Pathways (RCP), the stabilization scenario (RCP4.5), and the high greenhouse gas scenario (RCP8.5). Outputs of the future climate data from the two bias−corrected (i.e., REMO2009 and RCA4) models, are utilized to drive the E HYPE model (Table 1). E HYPE model results are delivered at the outlet of the Drin subbasins and are freely available (https://hypeweb.smhi.se/explore−water/climate-change-data/europe-climate-change/).

3. Methodology

In this study, two different temporal−scales (monthly and daily) were adopted for evaluating the extended Drin River regime alteration under anthropogenic uses and climate change/variability. The framework of this study is presented in Figure 2. It consists of two steps: (1) environmental flow assessment using the Tennant method and the Environmental Management Classes (EMCs) derived from the Global Environmental Flow Calculator (GEFC) using simulated monthly streamflow without (baseline) and with (post−baseline) anthropogenic water uses in terms of water consumptions (urban, agricultural and industrial use), during 2001 to 2010 by using the PANTA RHEI hydrological model; (2) environmental flow assessment using projected future flows from 2011 to 2100, forced by future climate scenarios derived from climate ensembles and the E HYPE (version 3.1.2) hydrological model, using the Indicators of Hydrologic Alteration (IHA).

3.1. Hydrological Methods for Environmental Flow Assessment

Environmental flow assessment was carried out implementing two hydrological methods (Tennant and EMCs) using simulated streamflow conditions from the PANTA RHEI hydrological model. The environmental flow assessment is made by considering the degree of deviation between streamflow conditions with no anthropogenic uses and streamflow conditions with anthropogenic uses [23].
Tennant method [28] and Environmental Management Classes (EMCs) are used to evaluates environmental flows in the extended Drin river basin. The Tennant Method [28] is the most frequently used hydrological method [29,30,31] for environmental flow estimations. The year is distinguished into two periods of six months and various levels of minimum flows are identified according to specified proportions of the average streamflow that are related to aquatic ecosystems and instream organisms (fish fauna, invertebrates, etc.) recreation. Specifically, 10% of the minimum annual runoff (MAR) is considered to be the lowest instantaneous flow to sustain short−term survival of aquatic life, 30% of MAR is considered to provide flows where the biological integrity of the river ecosystem as a whole is sustained, while flows higher than 60% of the MAR provide excellent to outstanding habitat conditions [32].
Environmental Management Classes (EMCs) were derived from the Global Environmental Flow Calculator (GEFC). EMCs define the proportion of time that certain flow threshold levels are equaled or exceeded in the particular river [33]. These flow threshold levels are required to support biotic integrity. Specifically, Flow Duration Curves (FDCs) are developed for a number of flows corresponding to 17 fixed percentage points: 0.01, 0.1, 1, 5, 10, 20, 30, 40, 50, 60, 70, 80, 90, 95, 99, 99.9, and 99.99%. These points are considered representatives of the entire flow range, and the basis for the establishment of the EMCs. GEFC was used to estimate Environmental Management Classes (EMCs) for the extended Drin river basin. The higher the EMC (Table 2), the more water is needed for ecosystem maintenance and more flow variability needs to be preserved [34]. Placing a river into a certain EMC is often accomplished by expert judgment using a scoring system [35]. The FDCs were converted into an actual environmental monthly flow time series using a spatial interpolation procedure described in detail by Hughes and Smakhtin [36]. Among the EMCs, flow regimes that fall into the category of the D, E, and F fail to meet the WFD requirements for Good Ecological Status (GES) and cannot support healthy ecosystems, so they have been excluded for further analysis.

3.2. Climate Variability/Change Impact on Flow Regime

Investigation of future climate variability/change impact on river flow is implemented using daily simulated time series derived from the hydrologic model Europe—Hydrological Predictions for the Environment (E HYPE), for climate change projections. Trend analysis is implemented using the Exploration and Graphics for RivEr Trends (EGRET) to evaluating long−term changes in the river conditions (discharge). The EGRET package has components oriented towards the description of long−term changes in streamflow statistics (high flow, average flow, and low flow) [37]. Solid curves as a smoothed representation of those data are developed and their slopes are computed using the Thiel−Sen slope estimator [38]. The Mann−Kendall test p−value is computed using the adjustment for serial correlation [39]. R package version 0.10–1. (https://CRAN.R-project.org/package=zyp) [38]. The median day is computed for each year in the record (as the middle day, e.g., 182 values with discharges lower than it and 182 values with discharges greater than it (for a leap year it is the average of the 183rd and 184th ranked values)).
Moreover, to analyze the changes between regulated and unregulated streamflow conditions, for two combinations of General Circulation Models (GCM) and Regional Climate Models (RCM), the stabilization scenario (RCP4.5), and the high greenhouse gas scenario (RCP8.5), the Nature Conservancy’s software Indicators of Hydrologic Alteration (IHA) was used: (https://www.conservationgateway.org/ConservationPractices/Freshwater/EnvironmentalFlows/MethodsandTools/IndicatorsofHydrologicAlteration/Pages/IHA-Software-Download.aspx).
More specifically, thirty−three Indicators of Hydrologic Alteration (IHA) parameters were calculated using nonparametric statistics [40]. Finally, Range of Variability Approach (RVA) described in [41] (available through the IHA software), was implemented to analyze the change between all the combinations of RCP−GCM−RCM (Table 1) and between regulated conditions (as post−impact) and unregulated (as pre−impact) conditions. In the RVA analysis, the full range of pre−impact data for each parameter is divided into three different categories. The lowest category contains all values less than or equal to the 33rd percentile; the middle category contains all values falling in the range of the 34th to 67th percentiles; the highest category contains all values greater than the 67th percentile. The Positive Hydrologic Alteration values indicate that the frequency of values in the additional category has increased from the unregulated conditions to the regulated conditions (with a maximum value of infinity), while a negative value means that the frequency of values has decreased (with a minimum value of −1).

4. Results

4.1. Descriptive Statistics of the Simulated Monthly Time Series from the PANTA RHEI Hydrological Model

Descriptive statistics for baseline (no anthropogenic uses in terms of water consumptions) and post−baseline (with anthropogenic uses such as urban, reservoir/dam regulation, agricultural and industrial use) streamflow conditions derived from simulated monthly time series from the PANTA RHEI hydrological model are presented in Table 3. Differences in mean and median flow magnitude statistics are relatively higher in the post−baseline conditions especially for the White Drin and Black Drin subbasins (Table 3, Figure 3). Maximum flow conditions in the Ohrid subbasin have evident differences between baseline and post−baseline streamflow indicating a possible overexploitation of instream flows by anthropogenic uses. Figure 3 shows that baseline median monthly streamflow values are consistently greater than post−baseline flows by 0–37.4 m3/s in all subbasins (data derived from simulated monthly time series from the PANTA RHEI model). These results indicate increased water uses (due to land−use changes, irrigation, dam constructions, etc.) in the study area. The differences in maximum flows between the two flow scenarios are relatively small for all subbasins, excluding Ohrid which implies that the winter anthropogenic abstractions are not significant in relation to the discharge outflow. On the contrary, during summer the minimum flows vary significantly between the baseline and post−baseline scenario with the exception of Buna/Bojana, Drin, and Ohrid subbasins. Buna/Bojana represents the lower part of the river close to the Adriatic Sea and, therefore, its discharge values are very high compared to the anthropogenic water abstractions. Drin and Ohrid subbasins are strongly regulated by dams and weirs and, therefore, the relevant management authorities can support the low flow periods by increasing discharge to counterbalance the abstractions.

4.2. Environmental Flow Assessment and Hydrologic Alteration Based on the Simulated Monthly Time Series from the PANTA RHEI Hydrological Model

Environmental flow assessment was carried out in the Drin river basin using two hydrological methods, the Environmental Management Classes (EMCs) derived from the Global Environmental Flow Calculator (GEFC) and the Tennant method. In order to estimate flow regime alterations due to anthropogenic uses, simulated monthly streamflow data (November 2001 to November 2010) were used as the baseline flow scenario, while streamflow data from the same period with the water consumptions were used as post−baseline streamflow.
The Tennant method’s results are presented in Table 4. Flow conditions to sustain short−term survival of aquatic life (10% of MAR) ranges, during the low flow period, from 6.8 m3/s in White Drin to 130 m3/s in Buna/Bojana. Regarding optimal conditions (survival habitat) where the biological integrity of the river ecosystem as a whole is sustained (30% of MAR), values fluctuate in low flow periods from 20.4 in White Drin to 130 m3/s in Buna/Bojana (Table 4). The estimated low flows that provide excellent to outstanding habitat conditions during summer (60% of MAR) vary from 13.1 m3/s in Ohrid to 260 m3/s in Buna/Bojana (Table 4).
Additionally, the Tennant method results are comparable with A and C EMCs for three subbasins White Drin, Drin, and Black Drin (Figure 3). The corresponding environmental flow in each Environmental Management Class clearly decreases progressively as ecosystem protection decreases. White Drin, Drin, and Black Drin subbasins are more vulnerable to ecological degradation due to reduced flow conditions (post−baseline) especially for the summer months. Increasing water extractions are more evident in the low−flow period particularly from April to September.
Comparative results among all subbasins are presented in Figure 4. C Environmental Management Class oscillates below the survival habitat threshold of the Tennant method for baseline flow conditions where no anthropogenic uses are considered as is described in the data Section 2.2.1. Black Drin subbasin results (Figure 4f) indicate that C EMC has a significant discharge reduction that reaches but does not exceed Tennant’s short−term habitat limit.
Comparison of descriptive statistics between hydrological projections for the period 1971 to 2100, derived from the E HYPE hydrological model for the assessment of the impact of climate variability/change on the streamflow of the extended Drin Basin, among unregulated (excluding anthropogenic abstractions) and regulated (e.g., hydropower regulations, reservoir/dam regulation irrigation abstractions, etc.) conditions is presented in Table 5.
Based on the E−hype data statistical analysis the regulated discharge values are significantly lower than the unregulated ones, especially on the minimum flows (Table 5). Moreover, in RCP 4.5 the minimum flow is estimated to be 0.8 m3/s in both GCMs while the unregulated respective value is 12.7 m3/s in REMO2009 and 15.2 m3/s in the RCA4 model.

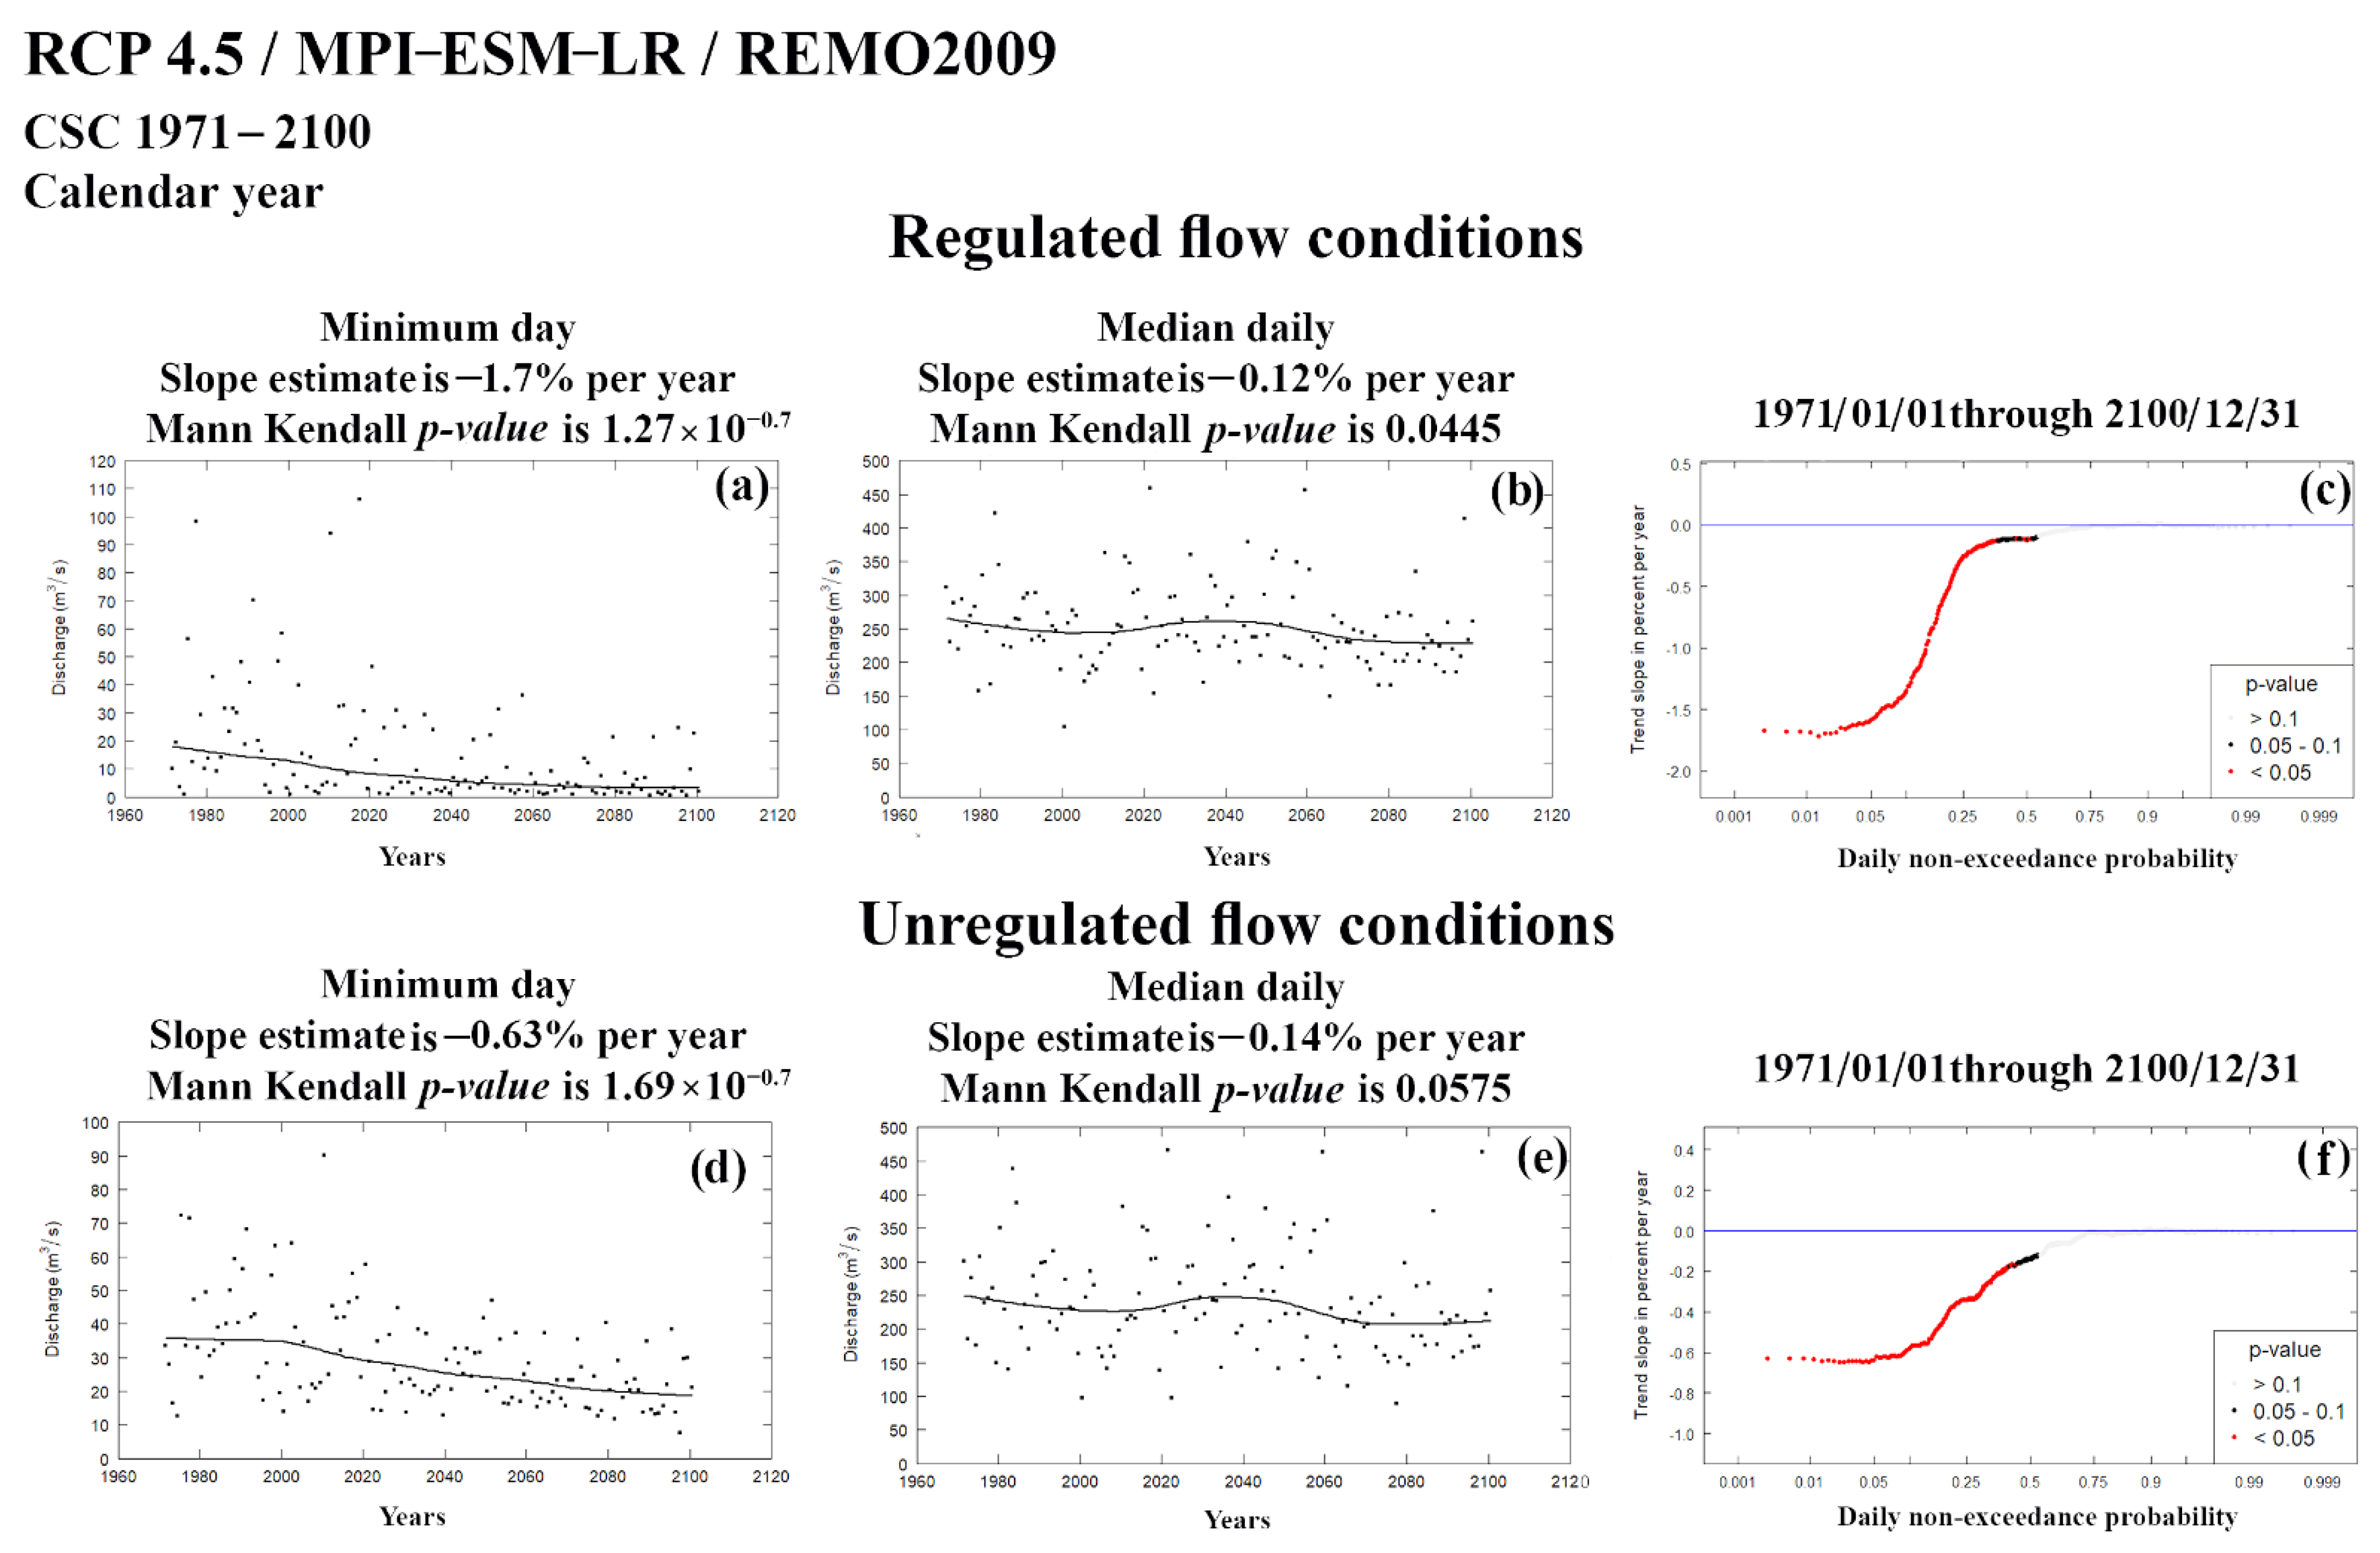
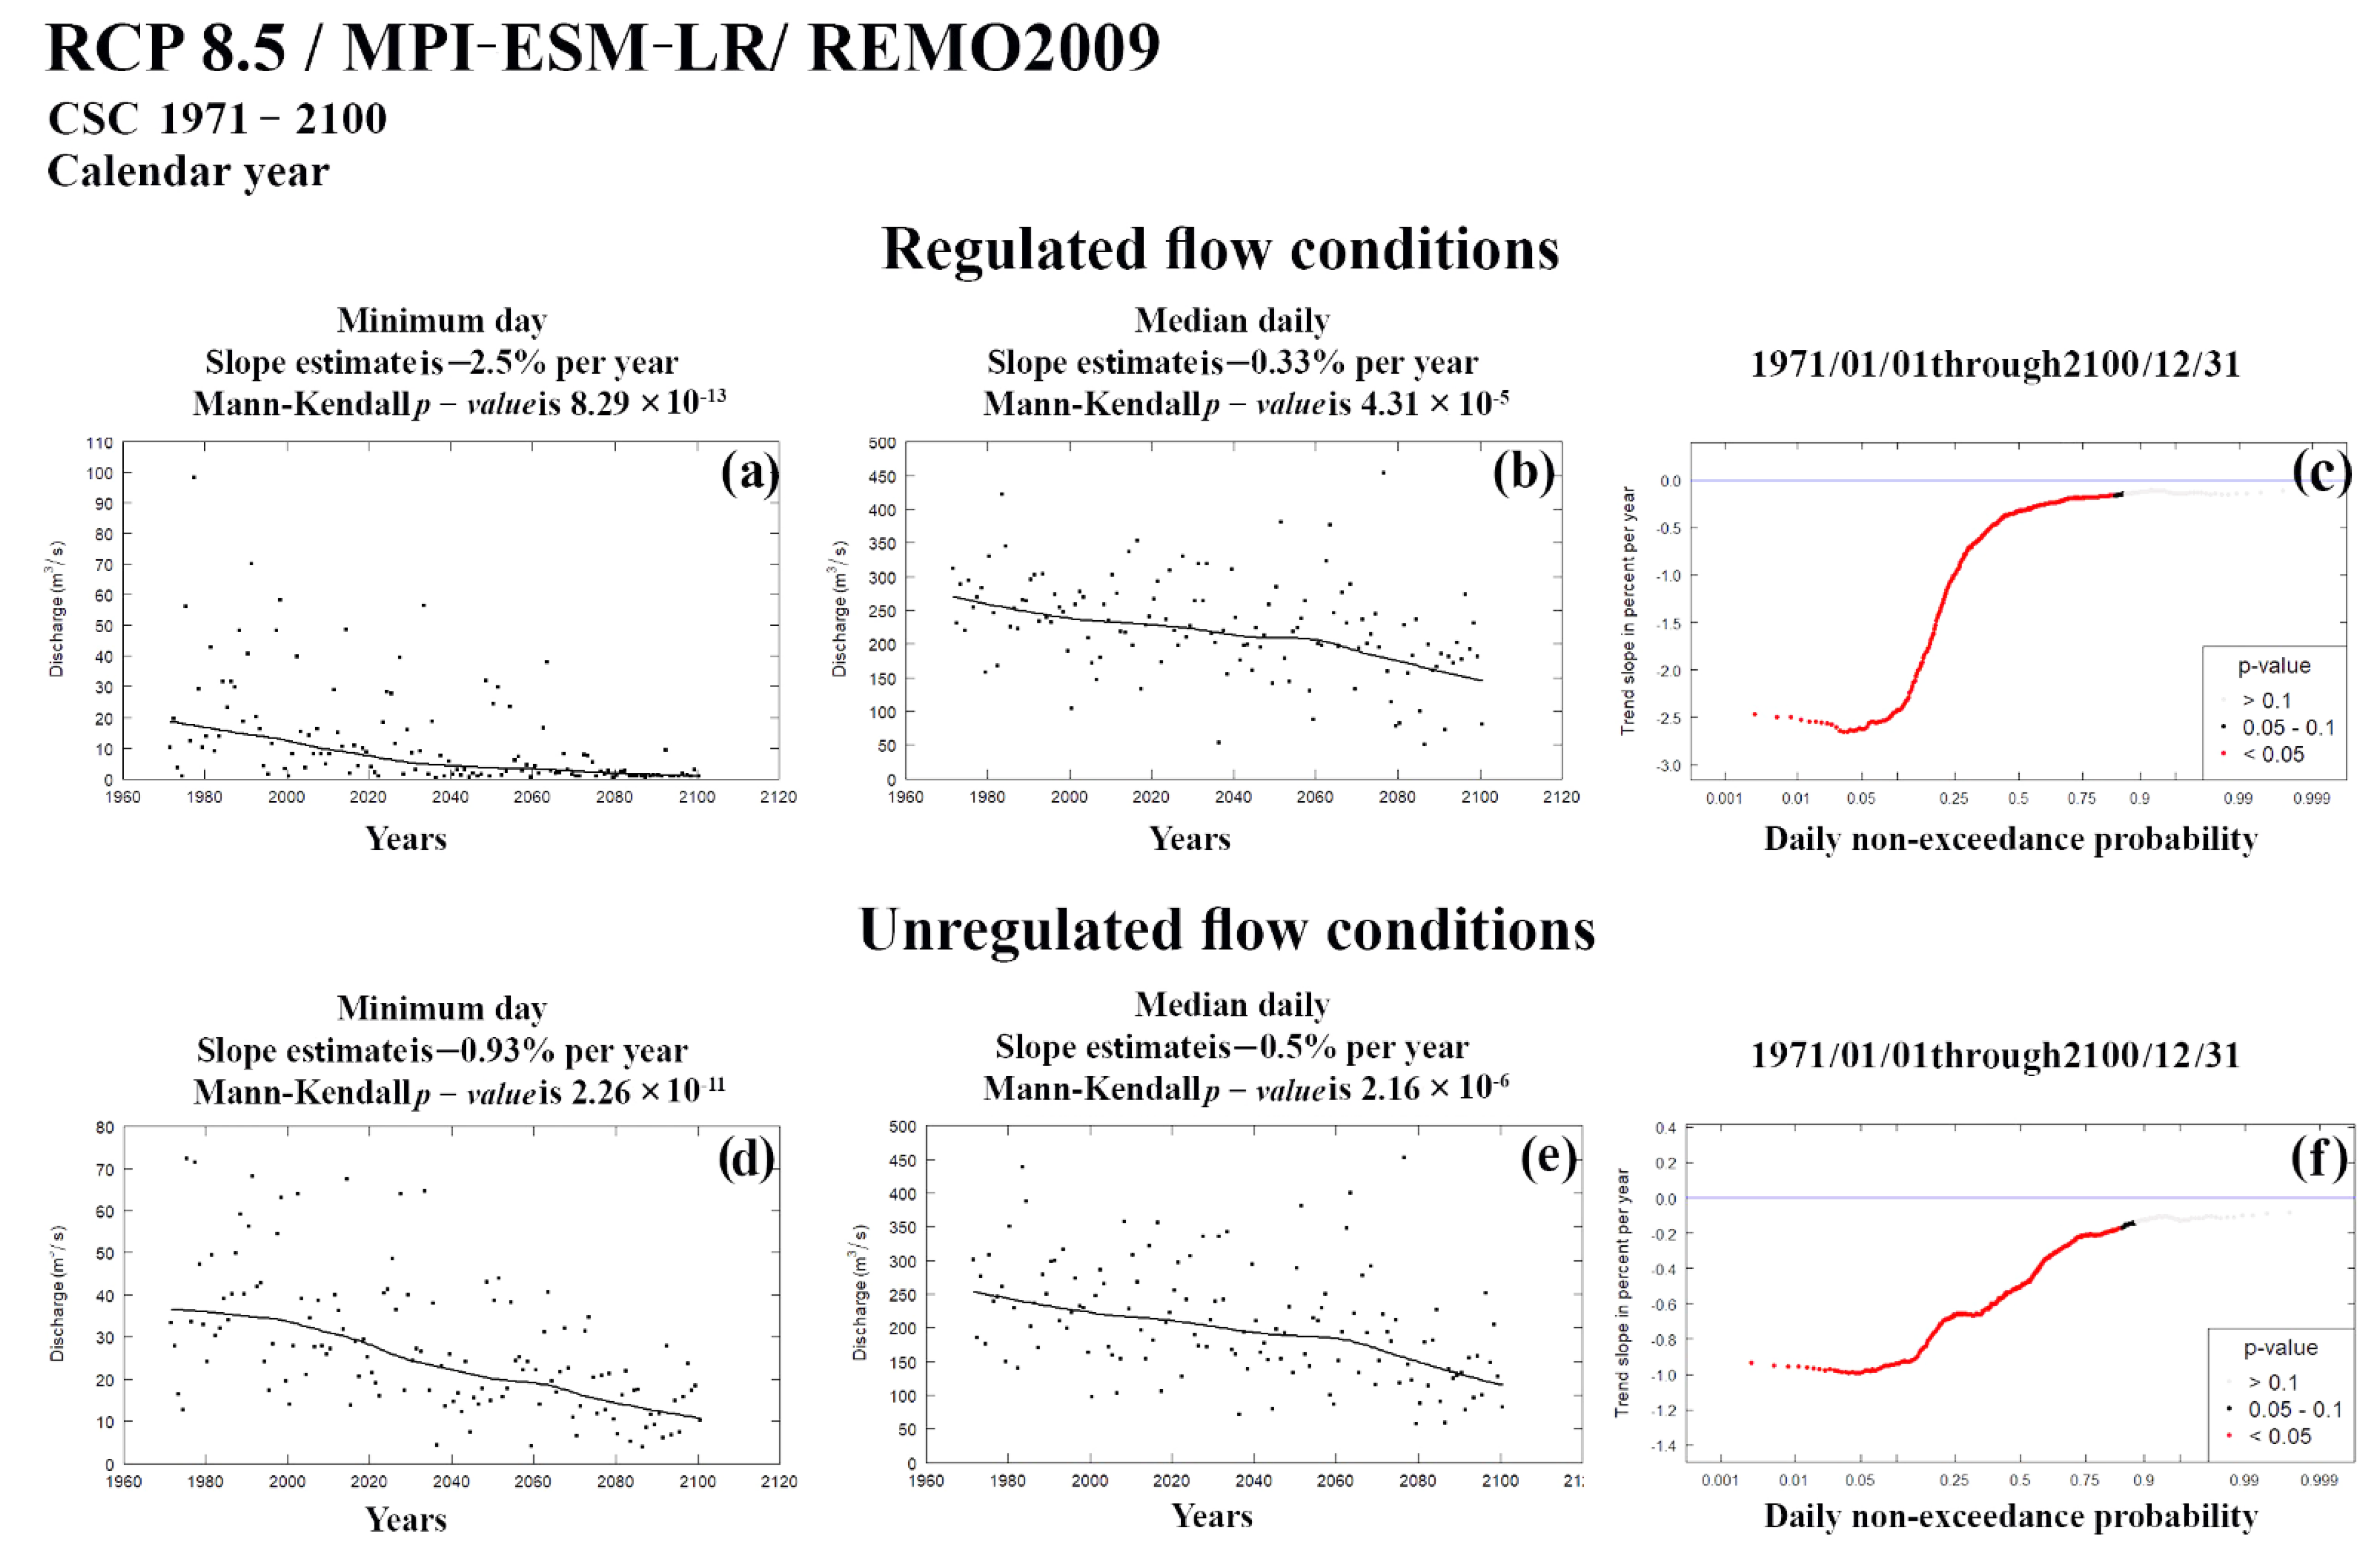
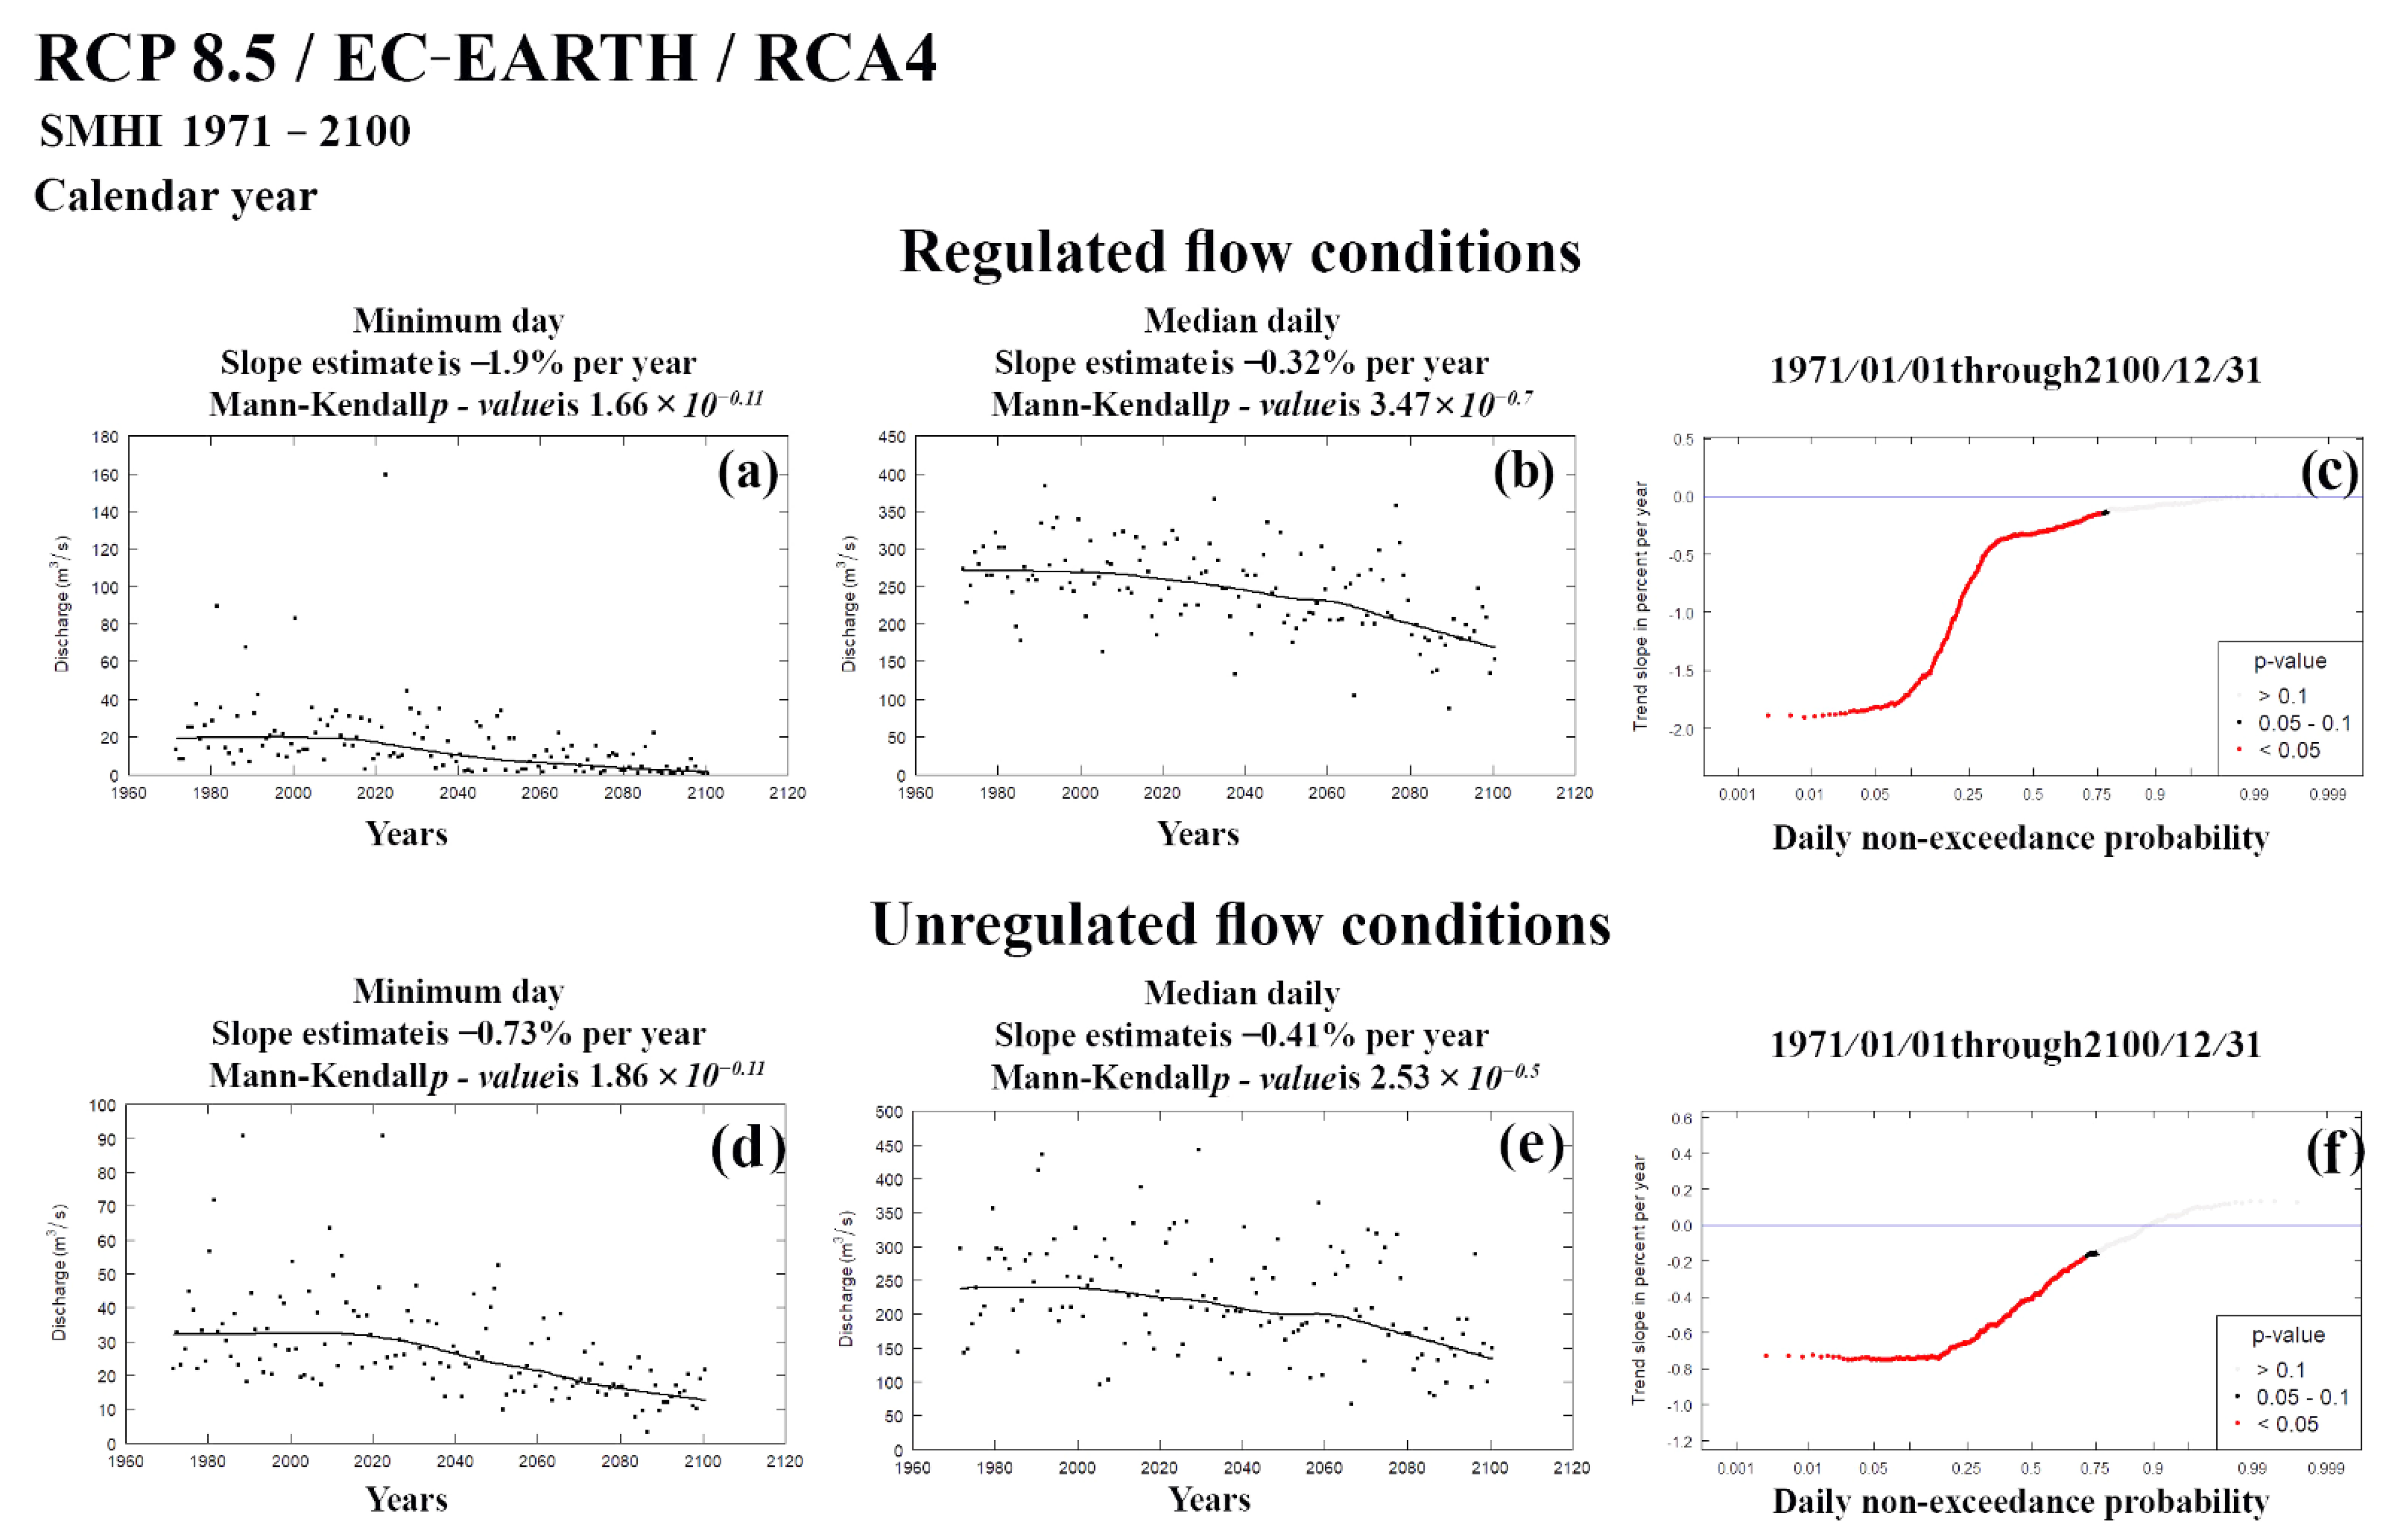
4.3. Trend Analysis of the Simulated Daily Time Series from the E HYPE Hydrological Model

Trend analysis is produced for all streamflow conditions (simulated streamflow data from the combinations of RCP−GCM−RCM derived from the E HYPE for both regulated and unregulated conditions) and additionally, results are presented in the following figures. The dots indicate the discharge on the minimum day (Figure 5a,d, Figure 6a,d, Figure 7a,d and Figure 8a,d) and median daily (Figure 5b,e, Figure 6b,e, Figure 7b,e and Figure 8b,e) on a calendar year basis for the period of records. The solid curves are a smoothed representation of those data. At the top of the sub−figures, a trend slope expressed in percent per year and a p−value for the Mann−Kendall trend test of the data is presented. Quantile−Kendall plots are presented in Figure 5c,f, Figure 6c,f, Figure 7c,f and Figure 8c,f. Each plotted point on the figures is a trend slope. More specifically, Quantile−Kendall plots (Figure 5c,f, Figure 6c,f, Figure 7c,f and Figure 8c,f) indicate negative trends for all combinations of RCP−GCM−RCM except RCP4.5/EC−EARTH/RCA4 (Figure 6) and the unregulated conditions of the RCP8.5/EC−EARTH/RCA4 (Figure 8) where the higher discharges and even small positive trends have been identified. Minimum day trends in unregulated conditions indicate higher levels and lower decreasing slopes in relation to the respective trends in regulated conditions for most models and RCP scenarios. Median daily trends of the discharge distribution of the RCP 4.5 scenarios are near to zero slope while the RCP 8.5 presents significant negative slopes.
The overall results of trend analysis for the aforementioned variables are presented in Table 6. RCP/GCM−RCM combinations with statistically significant trends, significant trend at least at the alpha level of 0.1 and no statistical significance are indicated in Table 6. More specifically, for all RCP−GCM−RCM combinations and both regulated and unregulated streamflow conditions, the minimum discharge values had statistically significant decreasing trends (Table 6), except the RCP 4.5–RCA4/ECEARTH combination (unregulated conditions). Regarding median discharge values, there is no statistically significant trend for the RCP 4.5–RCA4/ECEARTH combination.

4.4. Assessment of the Flow Regime Alteration

Thirty−three Indicators of Hydrologic Alteration (IHA) parameters were calculated using nonparametric statistics and the IHA software available online Implementation of Range of Variability Approach (RVA) to analyze the change between all the combinations of RCP−GCM−RCM used in this study (Table 1) and particularly between unregulated (as pre−impact) and regulated conditions (as post−impact) is presented in Figure 9. In general, positive hydrologic alteration values for almost all of the IHA parameters, except a few occasions (e.g., May and July median flows; where the hydrologic alteration value is below zero in Figure 9) indicate that the flow conditions are strongly impacted by hydrologic alteration which could be due to intense anthropogenic uses and/or climate change/variability. More specifically, the integrated evaluation on hydrological alteration in this study indicates that the low flows of the unregulated conditions of the extended Drin river basin face relatively high hydrologic alteration. An increase in the magnitude and duration of low flows (1−day minimum to 30−day minimum flow parameters) in the regulated streamflow conditions indicate intense hydrologic alteration. Furthermore, hydrologic alteration is evident in the high discharges in June and July (high RVA category), whereas high discharges may occur in the regulated conditions for the RCP 4.5/MPI−ESM−LR/REMO2009 and RCP4.5/EC−EARTH/RCA4.

5. Discussion

Environmental flow estimation methods can be grouped into four categories: hydrological, hydraulic rating, habitat simulation, and holistic methods. Details of these methods are presented in the literature [4,29,42]. Hydrological environmental flow methods focus on discharge rates and flow management in regulated streams and rivers [43] to balance environmental (instream) and out−of−stream uses of water. Although more complex methods (e.g., habitat modeling) have been applied in numerous projects, simpler methods (e.g., hydrologically based methods) are still widely used [29,44].
In this study, due to limited access and availability of discharge observational data in the study area, simulated time series were mandatory to use since there was no other option for the estimation of environmental flows and the flow alteration assessment. Additionally, hydrological methods are considered adequate for environmental flow assessment in the study area where there is a lack of ecological information. More specifically, environmental flow estimations were carried out using streamflow data with and without anthropogenic uses in terms of water consumptions (urban, agricultural, and industrial use) derived from the hydrologic catchment model PANTA RHEI. Additionally, investigation of future climatic projections was carried out, on the hydrological regimes (for both regulated and unregulated conditions) of the study area forced by future climate scenarios derived from climate ensembles and the E HYPE (version 3.1.2) hydrological model. According to Donnelly et al., [25] E HYPE captures the spatial variability of flow and is therefore suitable for predictions in ungauged basins such as the ones used in this study. However, there are several uncertainties due to the resolution of precipitation patterns, aquifer exchanges, water extractions, and regulation. These identified shortcomings together with previous studies results [45,46], impede progress towards environmental water use in the study area.
The control of water has been traditionally regarded as a noble activity and has been proven beneficial for mankind. Nevertheless, manipulating the flow of water is a form of disturbance of the natural continuity of the rivers. Biological corridors that facilitate migration are interrupted, creating significant pressures on biodiversity [9]. Many researchers worldwide have indicated that the natural dynamic of the rivers is the most important asset, however, more than half of the rivers in Europe are often fragmented by barriers to free flow [16]. The extended Drin river basin is a transboundary river basin. Several efforts have been carried out in the past towards an efficient and sustainable water management of the area [9,10,11,12] as an important step towards the right direction but not adequate enough.
Low flows may fall under the carrying capacity of riverine ecosystems as they often present ecological bottlenecks [47,48]. Low flows influence the river habitats and the instream fauna related to them. Indications of hydrologic alteration related to these types of flows should act as a warning in the extended Drin river basin, since low flows are commonly related to stress conditions for aquatic instream organisms and their habitats [49,50,51,52].
A great majority of water supply planners worldwide have already begun to address the water needs of river ecosystems proactively by reserving some portion of river flows for ecosystem support [53]. The extended Drin river basin hosts important biodiversity [54]. The goods and services sustained by environmental flows enhance the natural dynamic of the rivers which is the most important asset for achieving the Millennium Development Goals (MDG) [55]. Results outlined from this study are in accordance with previous work related to the study area [45], indicating that several water management related issues have not yet been resolved. Nevertheless, establishing environmental flow guidelines are a central element to maintain the ecological integrity of the rivers [56,57]. The trade–off between environmental protection and water resources availability could be explicitly quantified, providing a more transparent basis for defining environmental flow rules [3]. Additionally, climate variability is expected to negatively impact the river flow. Flow alterations by human modifications and climate change/variability will affect not only the ecological importance of biodiversity but also will negatively affect hydroelectricity production of the study area which is very important for the western Balkan area. These changes are expected to occur over a longer period of time, typically over decades or longer leading to climate crisis [58]. Thus, being aware of the consequences on a regional level and improved transboundary water cooperation are essential for the protection from the potential negative effects of climate variability/change. These restorative and protective actions require the development of scientifically credible estimates of environmental flow needs. Priority should be given to better address over−abstraction of water [59], the second most common pressure on the European Union’s water ecological status, and to recognize that water quality and quantity are intimately related within the concept of “good status” [7]. Integration of environmental flows within a transnational framework involving all relevant stakeholders to tackle the negative consequences of these anthropogenic activities enhances the transition towards sustainability and prevention of overexploitation of natural resources [60].

6. Conclusions

Evaluation of environmental flows and changes in hydrological regime at different time scales (monthly and daily) is challenging, nevertheless unavoidable in almost ungauged basins with limited accurate hydrologic information. Watershed scale models such as PANTA RHEI usually incorporate sufficient information, to produce accurate simulations, while global models such as E HYPE are able to provide streamflow series driven by different RCPs, nevertheless, hydrological models’ evaluation is beyond the scope of this study.
Environmental flow requirements of the extended Drin Basin have not been previously adequately addressed. Currently, there is limited understanding of the ecological needs for water and there are limited biological data to understand and quantify the water ecological needs in the basin. Over the long term, this is likely to pose risks to ecological health in the basin. Data statistical analysis shows that the regulated discharge values are significantly lower than the unregulated ones, especially on the minimum flows.
This preliminary analysis may provide the necessary information to all relevant stakeholders to discuss and decide on sustainable water resources management issues for the development of a Drin Basin Management Plan in the future. Multiple elements of the natural annual hydrograph are necessary to maintain the ecological integrity of riverine ecosystems and their related components (river, floodplain, groundwater). The relationships between discharge and ecosystems need to be further investigated in the extended Drin river basin. Holistic methodologies are considered as the most suitable and should be integrated in the future for effective planning and management of the Drin river basin.

Author Contributions

Conceptualization, C.P., E.D.; methodology, C.P., E.D.; software, C.P.; investigation, C.P., E.D.; resources, E.D.; data curation, C.P., E.D.; writing—original draft preparation, C.P., E.D.; writing—review and editing, C.P., E.D.; visualization, C.P.; supervision, C.P.; GIS, C.P.; Trend Analysis, C.P., E.D. Both authors have read and agreed to the published version of the manuscript.

Funding

This research is co-financed by Greece and the European Union (European Social Fund−ESF) through the Operational Programme «Human Resources Development, Education and Lifelong Learning» in the context of the project “Reinforcement of Postdoctoral Researchers–2nd Cycle” (MIS−5033021), implemented by the State Scholarships Foundation (ΙΚΥ).

Acknowledgments

Christina Papadaki is grateful to the Greek State Scholarships Foundation (IKY) for funding this work.

Conflicts of Interest

The authors declare no conflict of interest.

References

  1. Arthington, A.H.; Bhaduri, A.; Bunn, S.E.; Jackson, S.E.; Tharme, R.E.; Tickner, D.; Young, B.; Acreman, M.; Baker, N.; Capon, S.; et al. The Brisbane Declaration and Global Action Agenda on Environmental Flows (2018). Front. Environ. Sci. 2018, 6, 1–15. [Google Scholar] [CrossRef] [Green Version]
  2. Papadaki, C.; Soulis, K.; Muñoz-Mas, R.; Martinez-Capel, F.; Zogaris, S.; Ntoanidis, L.; Dimitriou, E. Potential impacts of climate change on flow regime and fish habitat in mountain rivers of the south-western Balkans. Sci. Total Environ. 2016, 540. [Google Scholar] [CrossRef] [PubMed] [Green Version]
  3. Papadaki, C.; Soulis, K.; Bellos, V.; Ntoanidis, L.; Dimitriou, E. Estimation of a Suitable Range of Discharges for the Development of Instream Flow Recommendations. Environ. Process. 2020. [Google Scholar] [CrossRef]
  4. Acreman, M.C.; Dunbar, M.J. Defining environmental river flow requirements—A review. Hydrol. Earth Syst. Sci. 2004, 8, 861–876. [Google Scholar] [CrossRef]
  5. Theodoropoulos, C.; Papadaki, C.; Vardakas, L.; Dimitriou, E.; Kalogianni, E.; Skoulikidis, N. Conceptualization and pilot application of a model-based environmental flow assessment adapted for intermittent rivers. Aquat. Sci. 2019. [Google Scholar] [CrossRef] [Green Version]
  6. János, F.; Austnes, K.; Globevnik, L.; Kirn, T.; Peterlin, M.; Stein, U.; Spiteri, C.; Prins, T.; Laukkonen, E.; Heiskanen, A.-S.; et al. Hydromorphological Alterations and Pressures in European Rivers, Lakes, Transitional and Coastal Waters; ETC/ICM Technical Report 2/2012; European Topic Centre on Inland, Coastal and Marine Waters (ETC/ICM): Prague, Czech Republic, 2012; ISBN 9788578110796. [Google Scholar]
  7. Publications Office of the EU. Ecological Flows in the Implementation of the Water Framework Directive: Guidance Document n°31; Office for Official Publications of the European Communities: Luxembourg, 2015; ISBN 978-92-79-45758-6. [Google Scholar]
  8. Skoulikidis, N.T. The environmental state of rivers in the Balkans—A review within the DPSIR framework. Sci. Total Environ. 2009, 407, 2501–2516. [Google Scholar] [CrossRef]
  9. Negm, A.M.; Zelenakova, M. Water Resources Management in Balkan Countries; Negm, A.M., Romanescu, G., Zelenakova, M., Eds.; Springer: Cham, Switzerland, 2020; ISBN 9783030224684. [Google Scholar]
  10. Cairns, M.R.; Cox, C.E.; Zambrana, J.; Flotemersch, J.; Lan, A.; Phillips, A.; Kozhuharova, G.; Qirjo, M.; Szigeti Bonifert, M.; Kadeli, L. Building multi-country collaboration on watershed management: Lessons on linking environment and public health from the Western Balkans. Rev. Environ. Health 2017, 32, 15–22. [Google Scholar] [CrossRef]
  11. Scoullos, M. Transboundary IWRM Attempts in the Mediterranean Emphasis on the Drin River Case and the Involvement of Stakeholders; Choukr-Allah, R., Rodriguez-Clemente, R., Ragab, R., Eds.; Springer: Dordrecht, The Netherlands, 2012; Volume 4, ISBN 978-94-007-4756-2. [Google Scholar]
  12. UNEP-DHI; UNEP. Transboundary River Basins: Status and Trends, Summary for Policy Makers; United Nations Environment Programme (UNEP): Nairobi, Kenya, 2016; Volume 3. [Google Scholar]
  13. Vejnovic, I. The Impacts of European-Financed Small Hydropower Plants on Pristine Balkan Landscapes. 2017. Available online: https://bankwatch.org/publication/broken-rivers-impacts-european-financed-small-hydropower-plants-pristine-balkan-landscapes (accessed on 7 January 2021).
  14. Pressures, Status, Transboundary Impacts & Responses—DRIN CORDA. Available online: http://drincorda.iwlearn.org/drin-river-basin/pressures-status-transboundary-impacts-responses (accessed on 23 December 2020).
  15. Baxter, R.M. Environmental Effects of Dams and Impoundments. Annu. Rev. Ecol. Syst. 1977, 8, 255–283. [Google Scholar] [CrossRef]
  16. Kuka, S.; Begu, E.; Myftiu, T.; Abazi, E. Digital Terrain Modeling of the Buna River System and of the Northwestern Flood Plain in Albania. Int. J. Sci. Technol. Res. 2014, 3, 84–88. [Google Scholar]
  17. Kovaçi, S.; Ifti, M. Analysis of distributions and dynamics for water side inflows in the Drin River basin, Albania. Int. J. Eng. Tech. Res. 2015, 156–161. [Google Scholar]
  18. Lehner, B. High resolution mapping of the world’s reservoirs and dams for sustainable river flow management. Front. Ecol. Environ. 2011, 9, 494–502. [Google Scholar] [CrossRef] [Green Version]
  19. Saddique, N.; Usman, M.; Bernhofer, C. Simulating the impact of climate change on the hydrological regimes of a sparsely gauged mountainous basin, Northern Pakistan. Water 2019, 11, 2141. [Google Scholar] [CrossRef] [Green Version]
  20. Teutschbein, C.; Wetterhall, F.; Seibert, J. Evaluation of different downscaling techniques for hydrological climate-change impact studies at the catchment scale. Clim. Dyn. 2011, 37, 2087–2105. [Google Scholar] [CrossRef]
  21. ENI Consulting. Ashta Hydropower Plant Project Environmental Impact Assessment Report; ENI Consulting: Tirana, Albania, 2011; Available online: https://www.miga.org/sites/default/files/archive/Documents/Albania_Ashata_EIA.pdf (accessed on 7 January 2021).
  22. Deutsche Gesellschaft für Internationale Zusammenarbeit (GIZ) GmbH Drin/Drim–Buna/Bojana Basin Flow and Flood Forecasting System. Available online: https://www.giz.de/en/downloads/Report%20%E2%80%93%20DrinDrim%20%E2%80%93%20BunaBojana%20Basin%20Flow%20and%20Flood%20Forecasting%20System%20(2019).pdf (accessed on 7 January 2021).
  23. Bodenbender, G.; Meksi, M.; Sinojmeri, F.; Medenica, B.; Bogatinovska, N. 2018 Preliminary Flood Risk Assessment for the Drin/Drim–Buna/Bojana River Basin. Available online: https://www.giz.de/en/downloads/Report%20%E2%80%93%20Preliminary%20Flood%20Risk%20Assessment%20for%20the%20DrinDrim%20%E2%80%93%20BunaBojana%20River%20Basin%20(2018).pdf (accessed on 12 December 2020).
  24. Förster, K.; Gelleszun, M.; Meon, G. A weather dependent approach to estimate the annual course of vegetation parameters for water balance simulations on the meso-and macroscale. Adv. Geosci. 2012, 32, 15–21. [Google Scholar] [CrossRef] [Green Version]
  25. Donnelly, C.; Andersson, J.C.M.M.; Arheimer, B.; Koutosyiannis, D.; Efstratiadis, A. Using flow signatures and catchment similarities to evaluate the E-HYPE multi-basin model across Europe. Hydrol. Sci. J. 2016, 61, 255–273. [Google Scholar] [CrossRef]
  26. Rivers and Lakes [HYPE Model Documentation]. Available online: http://www.smhi.net/hype/wiki/doku.php?id=start:hype_model_description:hype_routing (accessed on 28 December 2020).
  27. Teichmann, C.; Eggert, B.; Elizalde, A.; Haensler, A.; Jacob, D.; Kumar, P.; Moseley, C.; Pfeifer, S.; Rechid, D.; Remedio, A.R.; et al. How does a regional climate model modify the projected climate change signal of the driving GCM: A study over different CORDEX regions using REMO. Atmosphere 2013, 4, 214–236. [Google Scholar] [CrossRef] [Green Version]
  28. Tennant, D.L. Instream Flow Regimens for Fish, Wildlife, Recreation and Related Environmental Resources. Fisheries 1976, 1, 6–10. [Google Scholar] [CrossRef]
  29. Tharme, R.E. A global perspective on environmental flow assessment: Emerging trends in the development and application of environmental flow methodologies for rivers. River Res. Appl. 2003, 19, 397–441. [Google Scholar] [CrossRef]
  30. Gudmestad, O.T. Cold region hydrology. Handb. Eng. Hydrol. Fundam. Appl. 2014, 23–40. [Google Scholar] [CrossRef]
  31. Sedighkia, M.; Ayyoubzadeh, S.A.; Hajiesmaeli, M. Modification of Tennant and Wetted Perimeter Methods in Simindasht Basin, Tehran Province. Civ. Eng. Infrastruct. J. 2017, 50, 221–231. [Google Scholar] [CrossRef]
  32. Arthington, A.H.; Zalucki, J.M. Comparative Evaluation of Environmental Flow Assessment Techniques: Review of Methods; Land and Water Resources Research and Development Corporation: Canberra, Australia, 1998; Volume 27/98, p. 141. [Google Scholar]
  33. Smakhtin, V.; Anputhas, M. An Assessment of Environmental Flow Requirements of Indian River Basins; International Water Management Institute: Colombo, Sri Lanka, 2006; Volume 107. [Google Scholar]
  34. Smakhtin, V.U.; Eriyagama, N. Developing a software package for global desktop assessment of environmental flows. Environ. Model. Softw. 2008, 23, 1396–1406. [Google Scholar] [CrossRef]
  35. South Africa, Department of Water Affairs and Forestry (DWAF). White Paper on a National Water Policy for South Africa; South Africa, Department of Water Affairs and Forestry: Pretoria, South Africa, 1997; i, 37 p. ill; ISBN 062117707527. Available online: https://www.ircwash.org/resources/white-paper-national-water-policy-south-africa (accessed on 12 December 2020).
  36. Hughes, D.A.; Smakhtin, V. Daily Flow Time Series Patching Or Extension: A Spatial Interpolation Approach Based on Flow Duration Curves. Hydrol. Sci. J. 1996, 41, 851–871. [Google Scholar] [CrossRef] [Green Version]
  37. Robert, M.H.; De Cicco Laura, A. User Guide to Exploration and Graphics for RivEr Trends (EGRET) and dataRetrieval: R Packages for Hydrologic Data. Available online: https://www.researchgate.net/publication/272165529_User_Guide_to_Exploration_and_Graphics_for_RivEr_Trends_EGRET_and_dataRetrieval_R_Packages_for_Hydrologic_Data (accessed on 12 December 2020).
  38. Helsel, D.R.; Hirsch, R.M. Statistical methods in water resources. Stat. Methods Water Resour. 1992. [Google Scholar] [CrossRef]
  39. Bronaugh, D.; Werner, A. R Package “zyp”. 2015. Available online: https://mran.microsoft.com/snapshot/2017-01-11/web/packages/zyp/zyp.pdf (accessed on 7 January 2021).
  40. Manual, U. Indicators of Hydrologic Alteration (IHA). Encycl. Hydrol. Sci. 2005. [Google Scholar] [CrossRef]
  41. Richter, B.D. How much water does a river need? Freshwater Biol. 1997, 37, 231–249. [Google Scholar] [CrossRef] [Green Version]
  42. Jowett, I.G. Instream flow methods: A comparasion of approaches. Regul. Rivers Res. Manag. 1997, 13, 115–127. [Google Scholar] [CrossRef]
  43. Caissie, D.; El-Jabi, N.; Hébert, C. Comparison of hydrologically based instream flow methods using a resampling technique. Can. J. Civ. Eng. 2007, 34, 66–74. [Google Scholar] [CrossRef]
  44. Reiser, D.W.; Ramey, M.P.; Beck, S.; Lambert, T.R.; Geary, R.E. Flushing flow recommendations for maintenance of salmonid spawning gravels in a steep, regulated stream. Regul. Rivers Res. Manag. 1989, 3, 267–275. [Google Scholar] [CrossRef]
  45. De Strasser, L. Nexus Assessment of the Drin River Basin-Phases I and II; Pristina, 2019; Available online: https://www.gwp.org/globalassets/global/gwp-med-files/list-of-programmes/see-nexus/drin-nexus-policy-dialogue/steering-committee-meetings/17th-drin-core-group-2nd-steering-committee-meeting/de-strasser_pristina_ewgdcg-may-2019.pdf (accessed on 12 December 2020).
  46. Phase II of Nexus Assessment–GWP. Available online: https://www.gwp.org/en/GWP-Mediterranean/WE-ACT/News-List-Page/phase-2-of-nexus-assessment/ (accessed on 29 December 2020).
  47. Jowett, I.G.; Richardson, J.; Bonnett, M.L. Relationship between flow regime and fish abundances in a gravel-bed river, New Zealand. J. Fish Biol. 2005, 66, 1419–1436. [Google Scholar] [CrossRef]
  48. Rolls, R.J.; Bond, N.R. Environmental and Ecological Effects of Flow Alteration in Surface Water Ecosystems. Water Environ. Policy Sci. Implement. Manag. 2017, 65–82. [Google Scholar] [CrossRef]
  49. Pletterbauer, F.; Melcher, A.; Graf, W. Climate Change Impacts in Riverine Ecosystems. In Riverine Ecosystem Management; Springer International Publishing: Cham, Switzerland, 2018; pp. 203–223. [Google Scholar]
  50. Hering, D.; Carvalho, L.; Argillier, C.; Beklioglu, M.; Borja, A.; Cardoso, A.C.; Duel, H.; Ferreira, T.; Globevnik, L.; Hanganu, J.; et al. Managing aquatic ecosystems and water resources under multiple stress—An introduction to the MARS project. Sci. Total Environ. 2015, 503–504, 10–21. [Google Scholar] [CrossRef]
  51. Ramos, V.; Maia, R.; Formigo, N.; Oliveira, B. Assessment of Ecological Risk Based on Projected Hydrological Alteration. Environ. Process. 2016, 569–587. [Google Scholar] [CrossRef]
  52. van Oorschot, M.; Kleinhans, M.; Buijse, T.; Geerling, G.; Middelkoop, H. Combined effects of climate change and dam construction on riverine ecosystems. Ecol. Eng. 2018, 120, 329–344. [Google Scholar] [CrossRef]
  53. Linnansaari, T.; Monk, W.A.; Baird, D.J.; Curry, R.A. Review of approaches and methods to assess Environmental Flows across Canada Canada and internationally. DFO Can. Sci. Advis. Sec. Res. Doc. 2013, 3848. viii+74p. [Google Scholar]
  54. Zmelik, K.; Schindler, S.; Wrbka, T. The European Green Belt: International Collaboration in Biodiversity Research and Nature Conservation along the Former Iron Curtain. Innovation 2011, 24, 273–294. [Google Scholar] [CrossRef]
  55. Jägermeyr, J.; Pastor, A.; Biemans, H.; Gerten, D. Reconciling irrigated food production with environmental flows for Sustainable Development Goals implementation. Nat. Commun. 2017, 8, 1–9. [Google Scholar] [CrossRef] [Green Version]
  56. Seliger, C.; Zeiringer, B. River Connectivity, Habitat Fragmentation and Related Restoration Measures in Riverine Ecosystem Management Science for Governing Towards a Sustainable Future; Schmutz, S., Sendzimir, J., Eds.; Springer International Publishing AG part of Springer Nature: Cham, Switzerland, 2018; Volume 8, ISBN 9783319732497. [Google Scholar]
  57. Lloyd, N.; Quinn, G.; Thoms, M.; Arthington, P.A.; Humphries, P.; Walker, K. Does flow modification cause geomorphological and ecological response in rivers? A literature review from an Australian perspective. Ecology 2004, 57. Available online: https://www.researchgate.net/publication/282662393_Does_Flow_Modification_cause_Geomorphological_and_Ecological_Response_in_Rivers_A_Literature_Review_from_an_Australian_Perspective (accessed on 12 December 2020).
  58. Thornton, P.K.; Ericksen, P.J.; Herrero, M.; Challinor, A.J. Climate variability and vulnerability to climate change: A review. Glob. Chang. Biol. 2014, 20, 3313–3328. [Google Scholar] [CrossRef]
  59. Arheimer, B.; Donnelly, C.; Lindström, G. Regulation of snow-fed rivers affects flow regimes more than climate change. Nat. Commun. 2017, 8, 1–8. [Google Scholar] [CrossRef] [Green Version]
  60. Anderson, E.P.; Jackson, S.; Tharme, R.E.; Douglas, M.; Flotemersch, J.E.; Zwarteveen, M.; Lokgariwar, C.; Montoya, M.; Wali, A.; Tipa, G.T.; et al. Understanding rivers and their social relations: A critical step to advance environmental water management. WIREs Water 2019, 6, 1–21. [Google Scholar] [CrossRef] [Green Version]
Figure 1. Extended Drin river basin.
Hydrology 08 00007 g001
Figure 2. Overall procedures for environmental flow assessment in this study.
Hydrology 08 00007 g002
Figure 3. Baseline, post−baseline streamflow, and additional median values for six subbasins ((a); White Drin, (b); Drin, (c); Black Drin, (d); Buna/Bojana, (e); Ohrid, and (f); Shkodër/Skadar) of the Drin Basin.
Hydrology 08 00007 g003
Figure 4. Baseline and post−baseline streamflow, EMCs (A and C), and Tennant method’s thresholds (excellent to outstanding habitat, survival habitat, and short−term habitat) for the three most impacted subbasins of the extended Drin basin (White Drin; (a,b), Drin; (c,d), and Black Drin; (e,f)). Descriptive statistics of the simulated daily time series from the E HYPE hydrological model.
Hydrology 08 00007 g004
Figure 5. FlowTrend plots from the combination RCP 4.5/MPI−ESM−LR/REMO2009 for annual simulated daily streamflow for regulated conditions: (a) minimum day; (b) median day; (c) Quantile−Kendall plot, and for unregulated conditions: (d) minimum day; (e) median day; (f) Quantile−Kendall plot. Red color indicates a trend that is significant at alpha = 0.05. Black indicates an attained significance between 0.05 and 0.1. Grey dots are trends that are not significant at the alpha level of 0.1.
Hydrology 08 00007 g005
Figure 6. FlowTrend plots from the combination RCP4.5/EC−EARTH/RCA4 for annual simulated daily streamflow for regulated conditions: (a) minimum day; (b) median day; (c) Quantile−Kendall plot, and for unregulated conditions: (d) minimum day; (e) median day; (f) Quantile−Kendall plot.
Hydrology 08 00007 g006
Figure 7. FlowTrend Plots from the combination RCP 8.5/MPI−ESM−LR/REMO2009 for annual simulated daily streamflow for regulated conditions: (a) minimum day, (b) median day, (c) Quantile−Kendall plot, and for unregulated conditions: (d) minimum day, (e) median day, (f) Quantile−Kendall plot.
Hydrology 08 00007 g007
Figure 8. FlowTrend plots from the combination RCP8.5/EC−EARTH/RCA4 for annual simulated daily streamflow for regulated conditions: (a) minimum day; (b) median day; (c) Quantile−Kendall plot, and for unregulated conditions: (d) minimum day; (e) median day; (f) Quantile−Kendall plot.
Hydrology 08 00007 g008
Figure 9. Unregulated conditions as pre−hydrologic alteration and regulated conditions as post−hydrologic alteration for (a) RCP 4.5/MPI−ESM−LR/REMO2009, (b) RCP4.5/EC−EARTH/RCA4, (c) RCP 8.5/MPI−ESM−LR/REMO2009, (d) RCP4.5/EC−EARTH/RCA4.
Hydrology 08 00007 g009
Table 1. Representative Concentration Pathways (RCP), General Circulation Models (GCM), and Regional Climate Models (RCM) were used in this study
Hydrological ModelRCPGCMRCMPeriodInstitute
E HYPE
version 3.1.2
4.5MPI−ESM−LRREMO20091971–2100CSC
EC−EARTHRCA41971–2100SMHI
8.5MPI−ESM−LRREMO20091971–2100CSC
EC−EARTHRCA41971–2100SMHI
Table 2. Environmental Management Classes derived from the GEFC software.
EMCMost Likely Ecological ConditionManagement Perspective
A
(natural)
Natural rivers with minor modification of instream and riparian habitat.Protected rivers and basins; reserves and national parks; no new water projects (dams, diversions) allowed.
B
(slightly modified)
Slightly modified and/or ecologically important rivers with largely intact biodiversity and habitats despite water resources development and/or basin modifications.Water supply schemes or irrigation development present and/or allowed.
C
(moderately modified)
The habitats and dynamics of the biota have been disturbed, but basic ecosystem functions are still intact; some sensitive species are lost and/or reduced in extent; alien species presentMultiple disturbances (e.g., dams, diversions, habitat modification, and reduced water quality) associated with the need for socioeconomic development.
D
(largely modified)
Large changes in natural habitat, biota, and basic ecosystem functions have occurred; species richness is clearly lower than expected; much−lowered presence of intolerant species; alien species prevail.Significant and clearly visible disturbances (including dams, diversions, transfers, habitat modification, and water quality degradation) associated with basin and water resources development.
E
(seriously modified)
Habitat diversity and availability have declined; species richness is strikingly lower than expected; only tolerant species remain; indigenous species can no longer breed; alien species have invaded the ecosystem.High human population density and extensive water resources exploitation; generally, this status should not be acceptable as a management goal; management interventions are necessary to restore flow pattern and to ‘‘move’’ a river to a higher management category.
F
(Critically modified)
Modifications have reached a critical level; the ecosystem has been completely modified with an almost total loss of natural habitat and biota; in the worst case, basic ecosystem functions have been destroyed and changes are irreversible.This status is not acceptable from the management perspective; management interventions are necessary to restore flow pattern and river habitats.
Table 3. Descriptive statistics for baseline (Bas) and post−baseline (Post−bas) streamflow conditions derived from simulated monthly time series from the PANTA RHEI model.
StatisticsWhite DrinDrinBlack DrinBuna/BojanaShkodër/SkadarOhrid
Flow
(m3/s)
BasPost−BasBasPost−BasBasPost−BasBasPost−BasBasPost−BasBasPost−Bas
Min11.010.060.059.733.028.9124.6122.441.539.212.212.0
Max272.8272.11047.51047.1265.8265.32158.32158.21063.81062.930.621.2
Mean84.668.8337.9332.697.593.0656.0653.6314.4306.619.617.2
Median79.141.7268.1265.176.366.6514.4514.4227.5206.719.217.0
CV0.70.90.70.70.60.70.70.70.70.80.20.1
STD56.260.7236.0238.859.561.3469.8471.1231.2236.04.02.4
(CV: coefficient of variation, STD: standard deviation).
Table 4. Environmental minimum flow thresholds according to the hydrological approach (Tennant method).
SubbasinDescription of FlowsOctober–MarchApril–September
High Flows (m3/s)Low Flows (m3/s)
White DrinShort−term habitat10.56.8
Survival habitat31.420.4
Excellent to outstanding habitat62.940.7
DrinShort−term habitat43.524.0
Survival habitat130.572.0
Excellent to outstanding habitat261.0144.0
Black DrinShort−term habitat11.08.5
Survival habitat33.125.4
Excellent to outstanding habitat66.250.8
Buna/BojanaShort−term habitat87.743.3
Survival habitat263.0130.0
Excellent to outstanding habitat526.1260.0
OhridShort−term habitat1.72.2
Survival habitat5.26.6
Excellent to outstanding habitat10.413.1
Shkodër/SkadarShort−term habitat42.919.9
Survival habitat128.659.8
Excellent to outstanding habitat257.2119.6
Table 5. Comparison of descriptive statistics between unregulated and regulated streamflow conditions, forced by future climate scenarios derived from climate ensembles and the E HYPE hydrological model. P: percentile, Med: median, CV: coefficient of variation, STD: standard deviation, Zer: number of zero flow days.
RegulatedUnregulated
RCP 4.5REMO2009/RCA4/REMO2009/RCA4/
MPIESMLRECEARTHMPIESMLRECEARTH
Min0.80.812.715.2
Max2099.71428.82131.51643.6
P 1050.839.357.148.4
P 90525.7525.7578.1588
Mean278283.8283.1288.4
Med249261231.4246.3
CV0.70.70.80.8
STD199.6197.2224.5223.3
Zer0000
RegulatedUnregulated
RCP 8.5REMO2009/RCA4/REMO2009/RCA4/
MPIESMLRECEARTHMPIESMLRECEARTH
Min0.82.712.717.1
Max2099.71937.52131.52311.7
P 1044.848.65250
P 90515.1499.5565.9574.1
Mean272.3277.5277.5281.9
Med244.3261.6227.6236.2
CV0.80.60.80.8
STD205.1176.8230.8222.8
Zer0000
Table 6. Overall results of trend analysis.
Combinations
RCP/GCM–RCM
RegulatedUnregulated
RCP 4.5REMO2009/MPIESMLRRCA4/ECEARTHREMO2009/MPIESMLRRCA4/ECEARTH
Min dailyStatistically significant trends (Decreasing)Statistically significant trends (Decreasing)Statistically significant trends (Decreasing)Significant trend at least at the alpha level of 0.1
Med dailyStatistically significant trends (Decreasing)no statistical significanceStatistically significant trends (Decreasing)Significant trend at least at the alpha level of 0.1
RegulatedUnregulated
RCP 8.5REMO2009/MPIESMLRRCA4/ECEARTHREMO2009/MPIESMLRRCA4/ECEARTH
Min dailyStatistically significant trends (Decreasing)Statistically significant trends (Decreasing)DecreasingStatistically significant trends (Decreasing)
Med dailyStatistically significant trends (Decreasing)Statistically significant trends (Decreasing)Statistically significant trends (Decreasing)Statistically significant trends (Decreasing)
Publisher’s Note: MDPI stays neutral with regard to jurisdictional claims in published maps and institutional affiliations.

