Article

Hydrological Modelling for Water Resource Management in a Semi-Arid Mountainous Region Using the Soil and Water Assessment Tool: A Case Study in Northern Afghanistan

by
Wahidullah Hussainzada
1,2 and
Han Soo Lee
3,*
1
Department of Development Technology, Graduate School for International Development and Cooperation (IDEC), Hiroshima University, 1-5-1 Kagamiyama, Higashi-Hiroshima, Hiroshima 739-8529, Japan
2
Water and Environment Engineering Department, Mining and Environment Engineering Faculty, Balkh University, Mazari Sharif 1701, Afghanistan
3
Transdisciplinary Science and Engineering Program, Graduate School of Advanced Science and Engineering, Hiroshima University, 1-5-1 Kagamiyama, Higashi-Hiroshima, Hiroshima 739-8529, Japan
*
Author to whom correspondence should be addressed.
Hydrology 2021, 8(1), 16; https://doi.org/10.3390/hydrology8010016
Submission received: 11 December 2020 / Revised: 11 January 2021 / Accepted: 20 January 2021 / Published: 22 January 2021

Abstract

:
To address the issues of water shortages and the loss of agricultural products at harvest in northern Afghanistan, the Soil and Water Assessment Tool (SWAT) was applied for agricultural water resource management by simulating surface runoff in the Balkhab River basin (BRB) on a monthly basis from 2013 to 2018. Elevation, slope, land cover data, soil maps, and climate data such as temperature, precipitation, relative humidity, wind speed, and solar radiation were used as inputs in the SWAT modelling. During the dry season from July to September, the water resources downstream were basically attributed to baseflow from groundwater. In the calibration, the groundwater baseflow was estimated by analyzing station-recorded discharges for 190 springs. With the estimated baseflow, the SWAT results were markedly improved, with R2 values of 0.70, 0.86, 0.67, and 0.80, Nash-Sutcliff efficiency (NSE) values of 0.52, 0.83, 0.40, and 0.57, and percent bias (PBIAS) values of 23.4, −8.5, 23.4, and 17.5 in the four different subbasins. In the validation, the statistics also indicated satisfactory results. The output of this study can be used in agricultural water resource management with irrigation practices and further in the assessment of climate change effects on the water resources in the BRB.

Graphical Abstract

1. Introduction

Water resource management has had an inevitable link to economic development and human activities throughout history. Every continent has experienced water scarcity, and global water use has increased two times faster than the population increase in the last century [1]. Water scarcity, especially in arid and semiarid regions, highlights the importance of water resource management worldwide. Mekonnen andand Hoekstra (2016) [2] reported that 0.50 billion people faced severe water scarcity for the entire year from 1996 to 2005, while 3.97 billion people face severe water scarcity for at least one month each year. Approximately 80% of the population in Central Asia is experiencing difficulty associated with water stress, and approximately 50% of the population suffers from water shortages [3]. Studies report an increase in drought severity in Afghanistan and its neighboring countries in Central Asia [4,5,6,7]. Water resource management during severe drought, water scarcity, and shortages is essential to reduce the vulnerability of local people.
Afghanistan, with an arid to semiarid climate, receives most precipitation in the form of snow during winter and a smaller amount in spring as rainfall [8,9,10]. According to Mahmoodi (2008) [9], the total annual potential discharge in the five major basins of Afghanistan exceeds 7.5 × 10 10   m 3 . The Afghanistan economy strongly depends on the agricultural sector, and according to reports of the Afghanistan National Statistics and Information Authority, the agricultural sector contributed 18.6% of the country’s total gross domestic product (GDP) in 2018 [11]. Despite the GDP, approximately 80% of the population lives in rural areas, and their livelihood is strongly related to agricultural activities [9]. The country owns 7.9 × 10 6   ha of arable land, and in 1980, 3.3 × 10 6   ha were under cultivation [9]. Several decades of war and severe drought have reduced arable land to the current value of 1.8 × 10 6   ha . Therefore, proper water resource management in Afghanistan can lead to economic development and the improvement of residential living standards.
The meltwater from glaciers and the snowpack in the high mountains of Afghanistan generates high amounts of surface water flow in the country. Officially, the country is divided into five major river basins; four of the river basins are transboundary basins flowing to neighboring countries except the northern basin, which uses all the water inside the basin. The Northern River basin has the smallest annual flow contribution, with only 2% of the total, while it covers 12.26% of the total country area, with 9.51% of the country’s population settled in the basin [12,13]. The water resources in this river basin are the lowest among the four basins, while land coverage and the population are considerably higher. The high population and limited water resources make the area vulnerable to water scarcity and drought. Therefore, proper management practices and policy considerations are essential for the water resources in northern Afghanistan.
As described by Wheater et al. (2007) [14], a model is a simplified depiction of a real-world system consisting of a series of contemporary equations or a logical set of operations within a computer program. Hydrological models are important tools for water resource management and its impact on the environment. The models can be used for depicting the input-output properties in an existing basin (e.g., expanding the data array for flood design in water resource assessment, water resource management, or operational flood prediction), estimating runoff for ungauged catchments, predicting impacts of changes in the basin (e.g., land use change or climate change), coupling the hydrology with geochemistry (e.g., nutrients and acid rain), or coupling the hydrology and meteorology (e.g., a global climate model) [14]. A suitable model can predict results close to reality with the fewest parameters and lowest model complexity [15]. Hydrological models can be classified as (1) empirical models, (2) conceptual models, and (3) physical-based models [14].
The Soil and Water Assessment Tool (SWAT) [16] is a physical-based model that is widely used for predicting water and sediment circulation, agricultural production and chemical yield, climate change impact on water resources, and policy testing. The SWAT model output can also be used to solve real-world problems. The following examples outline the worldwide SWAT applications. In Guiamel and Lee, (2020a) [17], the SWAT output was used to calculate the potential hydropower capacity in the Mindanao River Basin, Philippines. The SWAT was applied for 7 days of low flow each year with a 10-year return period (7Q10) to analyze drought in the Muskingum watershed of eastern Ohio, USA, by Shrestha et al. (2017) [18]. In Maghsood et al. (2019) [19], SWAT was utilized to study the flood frequency in the Talar River basin, northern Iran, considering the impact of climate change with the Coupled Model Intercomparison Project phase 5 (CMIP5) general circulation model (GCM) dataset. In Xie and Cui, (2011) [20], SWAT was used to study paddy rice field irrigation and crop yield management in Zhanghe, China.
The Afghanistan water and irrigation infrastructure almost collapsed during the four decades of war and conflict. In addition, the water consumed by residents and industries for irrigation and water supply purposes is rapidly increasing. The rapid increase in the water consumption requires more accurate and scientific studies before any actions can be undertaken. In the last few years, few studies have been conducted to address hydrological modelling and water-related issues in Afghanistan. In Aawar and Khare, (2020) [21], a watershed model of the Kabul subbasin was developed using the SWAT model from 2003 to 2010, and model calibration and validation were conducted at a single gauging station. In Hajihosseini et al. (2016) [22], the SWAT model was utilized in the Helmand River basin from 1969 to 1979, and the model output was used to assess the 1973 treaty of the transboundary water of the Helmand River in southern Afghanistan. The Salma Dam located on the Harirod River is a newly constructed multipurpose dam in western Afghanistan. The SWAT model was used to estimate the surface runoff and sediment downstream from the Salma Dam [23]. The snowmelt runoff model (SRM) was used to estimate the daily river discharge in the Salang River basin and upper Kabul River basin by utilizing the MODIS 7-day snow cover product and metrological data from 2009 to 2011 [24,25]. Few studies have been conducted in the Afghanistan and no studies using the hydrological in the northern Afghanistan has been conducted to date. On the other hand, previous studies performed calibrations using single station discharge data for the calibration and validation of models while the current study used multiple stations, from upstream to downstream, for model verification in the study region. The result of the current study will be used for irrigation water management and as a solution for the current challenges.
The main objective for this study is to develop the hydrological model of the BRB for the sustainable water resource management practices in irrigation water management. The results of current study will be used for the evaluation of current irrigation water shortages and challenges, as well as for testing the possible policies and solutions for the proper distribution of water resources in future studies. In this study, a watershed model of the Balkhab River basin (BRB) in northern Afghanistan was developed using the SWAT, and model calibration was performed using multiple site calibration. In the mountainous watershed with arid and semiarid climates, lateral flows and springs are the main sources of surface water during the non-rainynon-rainy season. In this study, the authors used analysis of the historical discharge data at the different stations to address the issue of 190 spring discharges to the streamflow where no record of their discharge is available. In this study, the hydrological process of surface runoff within the study area was simulated using SWAT. The results of the current study can provide the core component for future work on irrigation practices and water resource management in watersheds by testing different possible scenarios. The results can also be used for studies on the impact of climate change on the water resources in northern Afghanistan.

2. Study Area and Materials

2.1. Study Area

Afghanistan, with a semiarid to arid climate, has been divided into five major basins: The Northern, Kabul, Helmand, Harirod Murghab, and Amu Darya river basins. The study area is situated in the Northern River basin (Figure 1b), which is further divided into four river basins, namely, the Balkhab, Khulm, Sari Pul, and Shirin Tagab river basins. This study focused on the BRB with a minimum elevation of 202 m, maximum elevation of 4616 m, and an area of 28,835.2 km2 (Figure 1c). The Balkhab River starts from a series of six lakes in the high mountains in the south and flows through the north, and 190 springs join the stream along this river. The largest portion of water in the river is used for the irrigation of 296,774 ha of agricultural land through 3 small regulator dams and 101 traditional and engineering irrigation canals along the river. The average annual precipitation in Afghanistan is 270 mm and it ranges from 1270 mm in the high mountains to 75 mm in the southwestern area [26]. The BRB climate is semiarid with an average annual precipitation of 247 mm. Notably, there is no precipitation during the summer season. The water source for the rest of the year is the snowmelt water coming from the snow accumulated in the highland area during the winter and groundwater flow. In the northern water basin, glaciers originated in the Hindu Kush mountains in northwestern Afghanistan, and there are no glaciers located in the BRB region [27]. Snowmelt and underground water significantly contribute to the stream flow in the late spring, summer, and early autumn seasons, when precipitation is almost zero. Five hydrometeorological stations (Figure 1c) are located in the BRB, recording the minimum and maximum temperatures, relative humidity, precipitation, and stream discharge with a daily temporal resolution and monthly average. In the current study, the daily metrological data were used for simulations of surface runoff on a monthly basis. The annual average temperature varies from 7.56 °C in the highlands of the south to 18.93 °C in the flat lands of the north based on the data from 2010 to 2018 provided by the Ministry of Energy and Water, Islamic Republic of Afghanistan. The BRB dominated land cover is dominated by range land and grasses, encompassing 62.25% of the total area.

2.2. Materials

2.2.1. Dataset

The SWAT inputs are temperature, precipitation, relative humidity, wind speed, solar radiation, a digital elevation model (DEM), land cover map, soil-type map, slope map, and water input and outflow from the river.
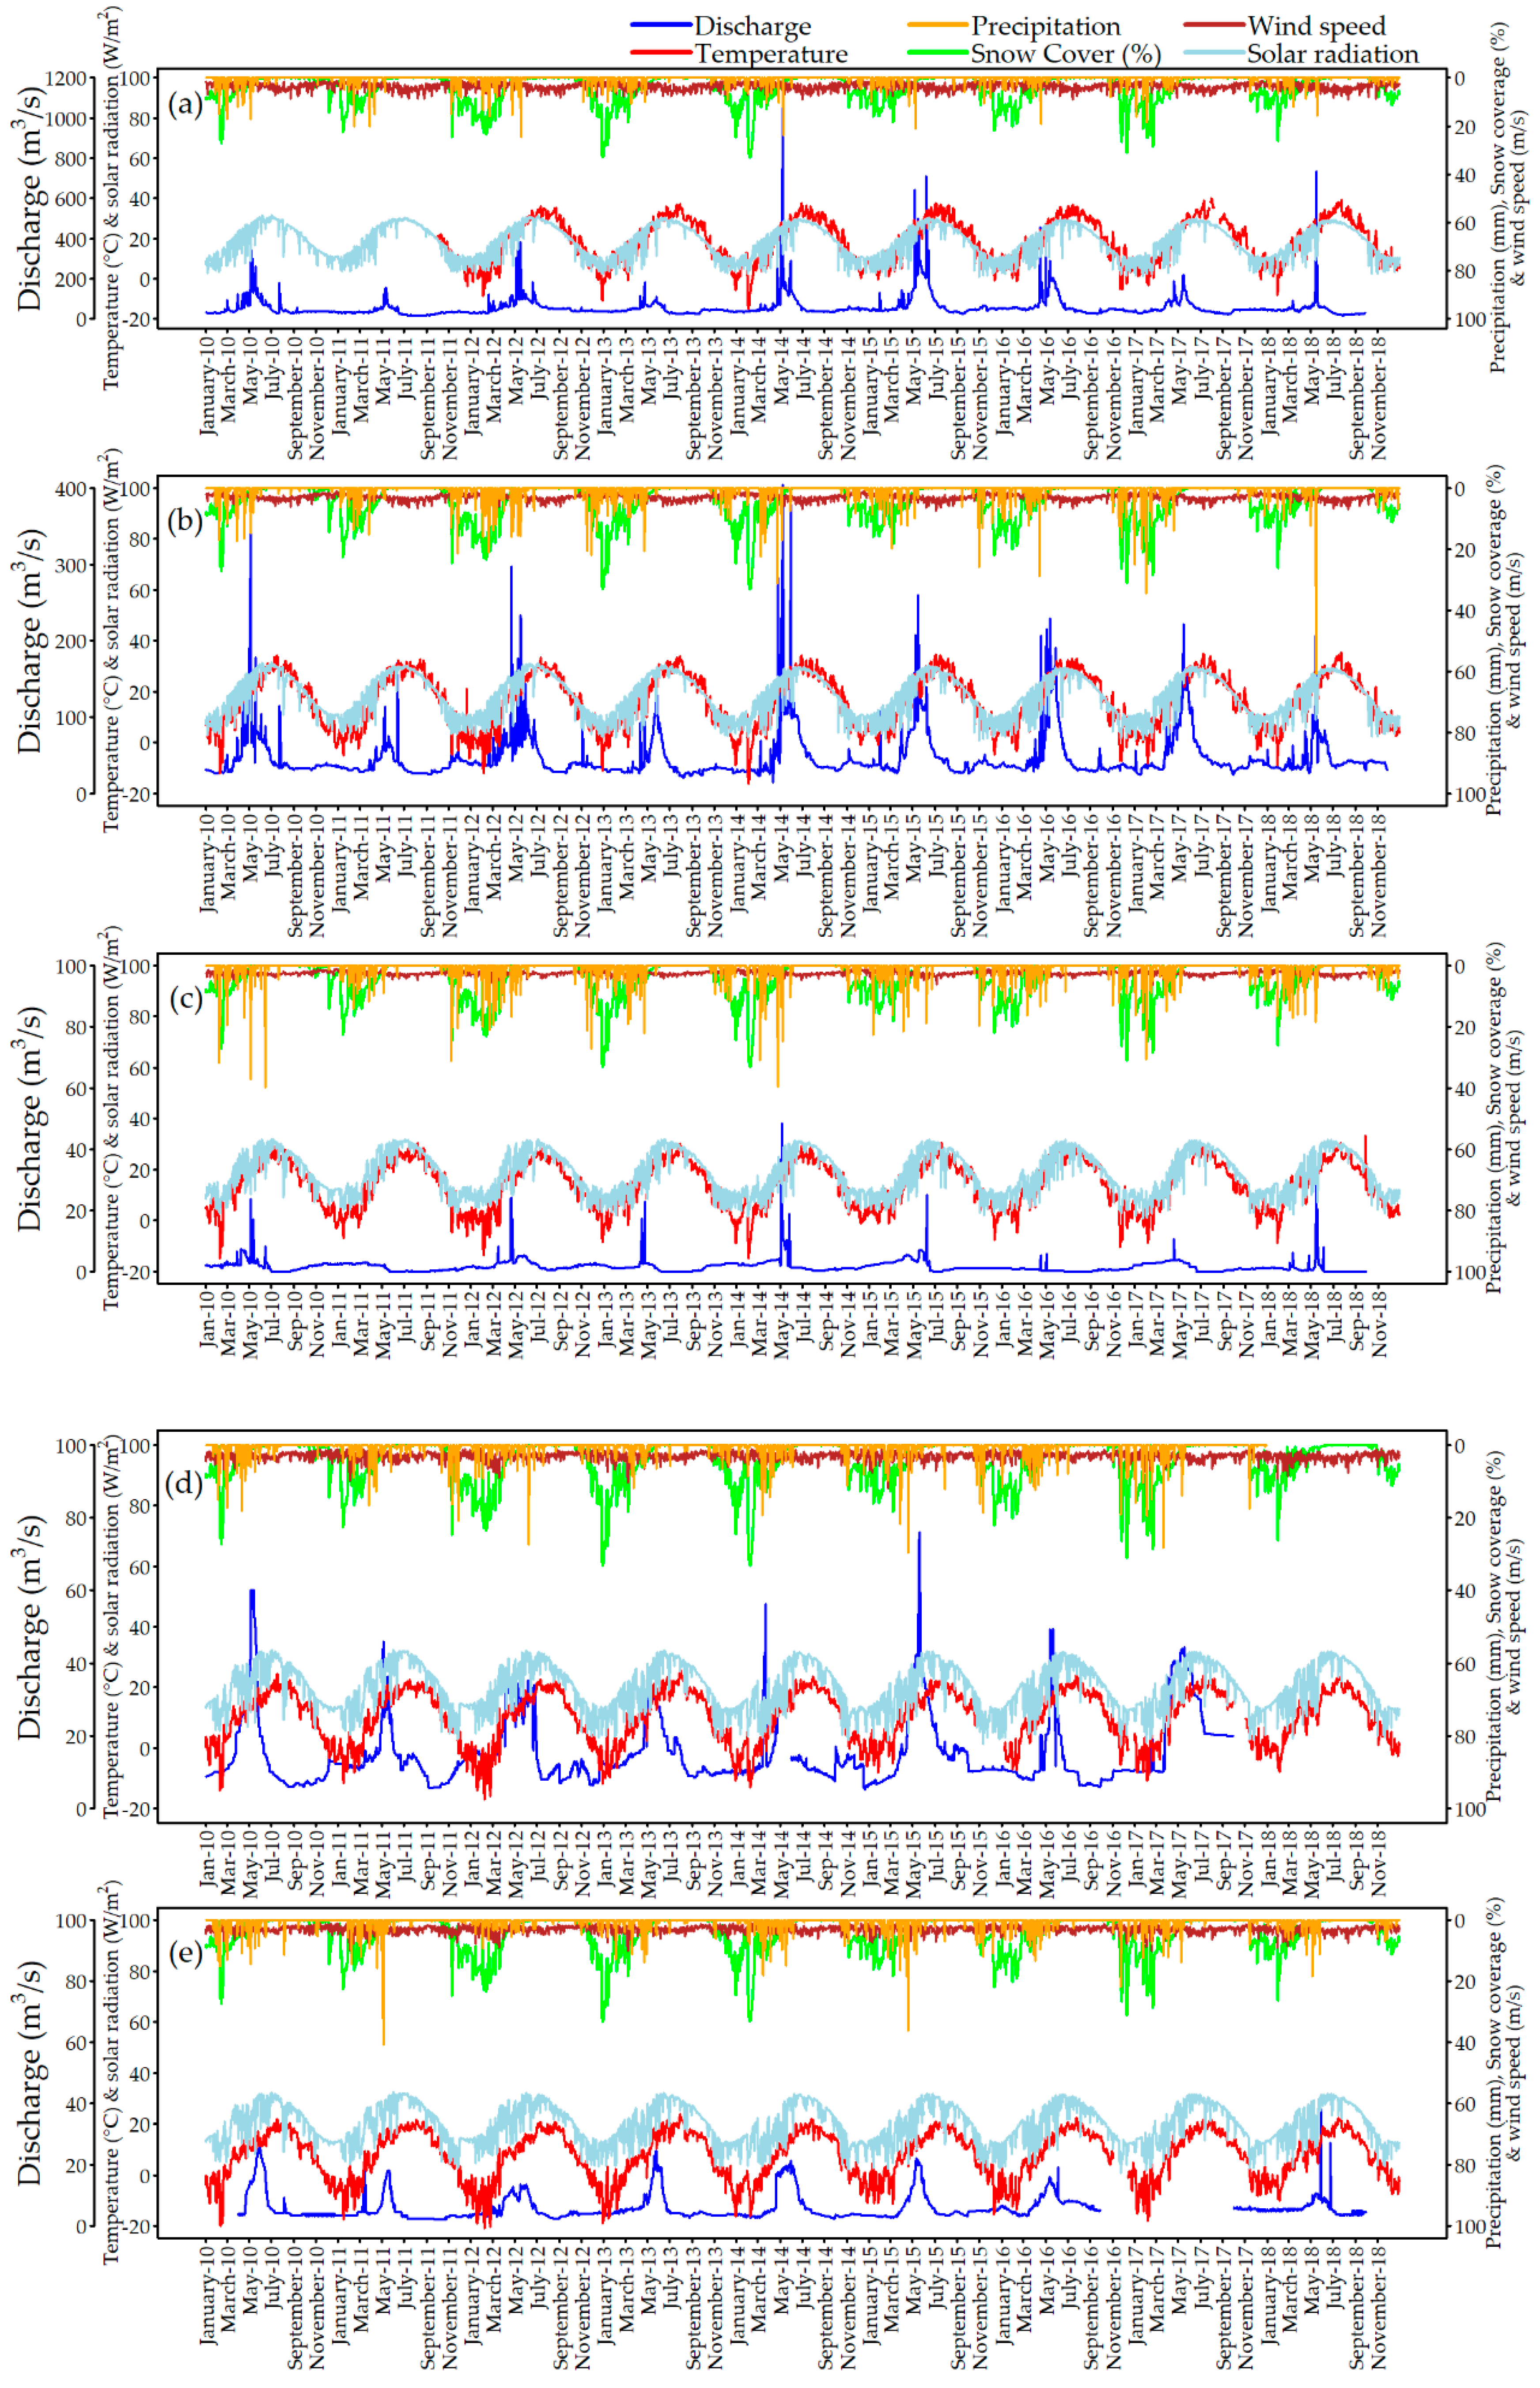
The recorded daily maximum and minimum temperatures, relative humidity, and precipitation from five hydrometeorological stations from 2010 to 2018 were used as the weather input data for the SWAT model setup on a monthly time scale (Figure 1c). The wind speed and solar radiation were retrieved from the NASA Prediction of Worldwide Energy Resources (RWER) at the same geographical location as those five stations since the stations did not collect these data. Monthly recorded discharge is available for all five stations, and four stations located on the mainstream were used for calibration and validation purposes. A summary of the climate data and river discharge at the five hydrometeorological stations is presented in Figure A1a–e in the Appendix A for the ground observations and data retrieved from global sources.
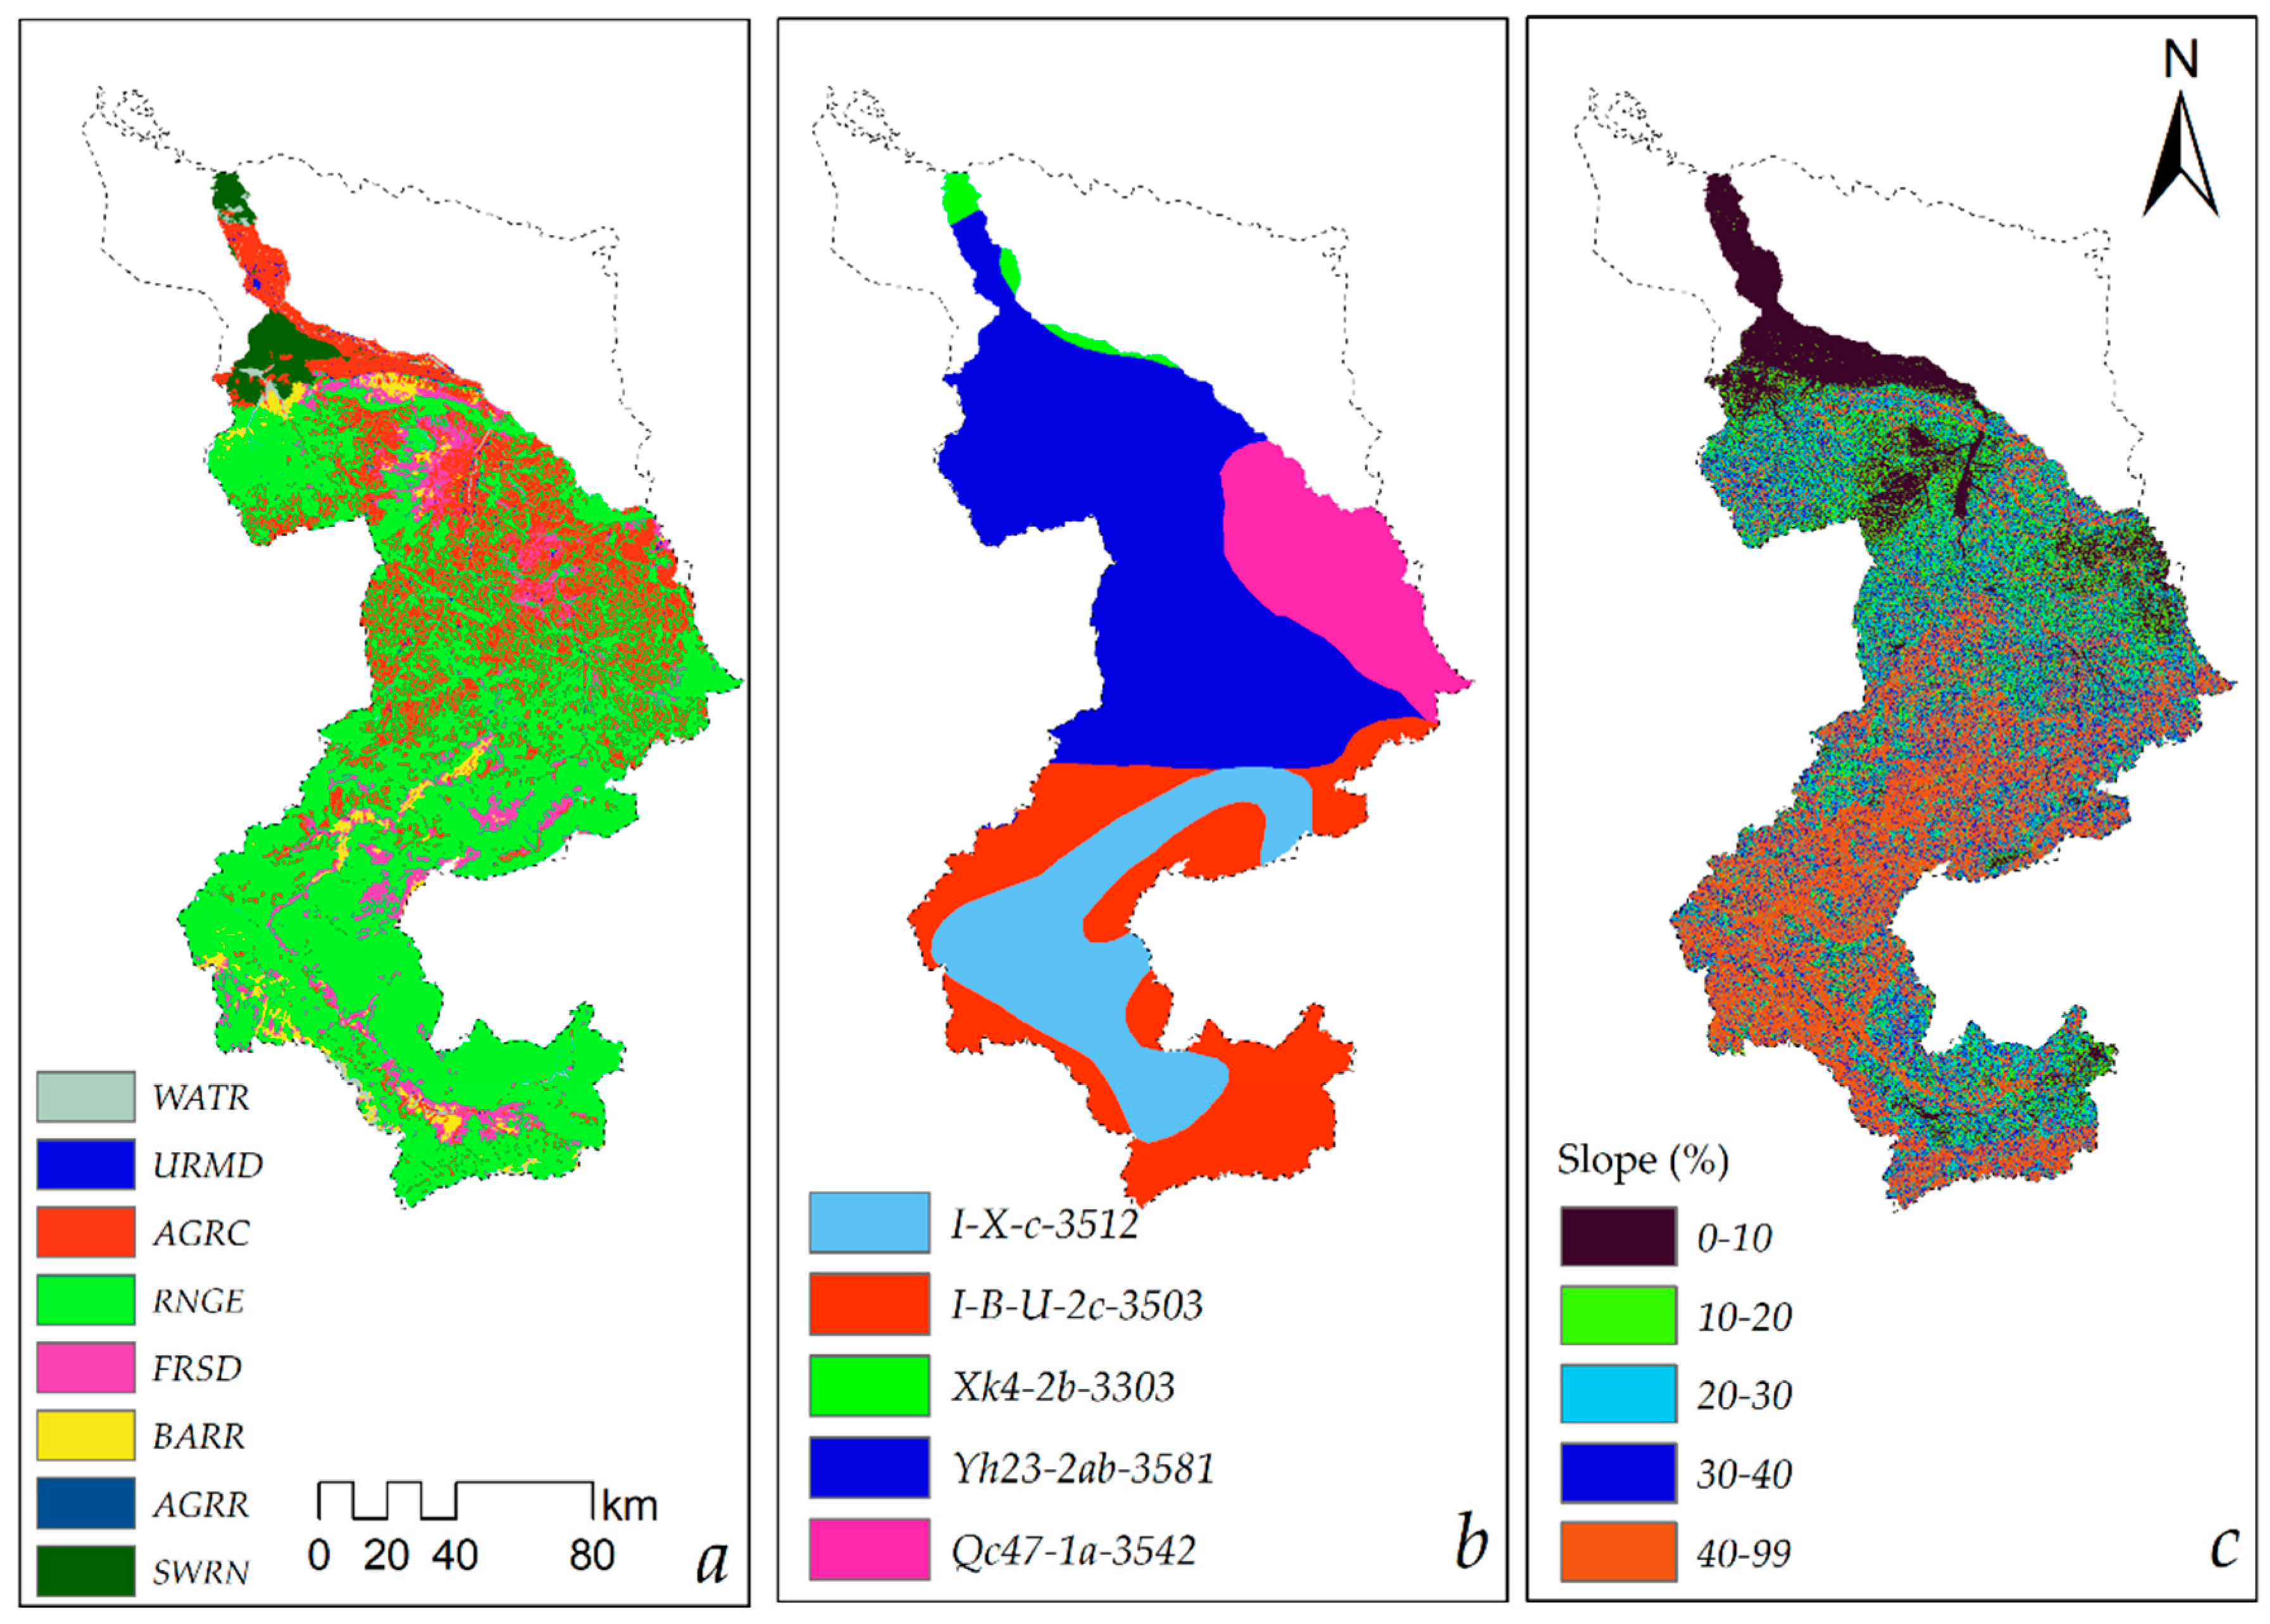
The ALOS PALSAR Radiometric terrain corrected (RT1) images (Figure 1c) were downloaded from the Alaska Satellite Facility Distributed Archive Data Center (ASF DAAC) website with a spatial resolution of 12.5 m and used as the DEM in the SWAT watershed model. RT1 products are generated from high-resolution and mid-resolution DEMs [28]. The slope map for the BRB was created using this DEM in the SWAT model (Figure 2c). In the Figure 2a, the acronyms are defined as follows: water (WATR), residential-medium density (URMD), agricultural land-close-grown (AGRC), range-grasses (RNGE), forest-deciduous (FRSD), barren (BARR), agricultural land-generic (AGRR), and barren sand (SWRN). In Figure 2b the acronyms are based on the FAO/UNESCO soil type name designations and are defined as follows: Lithosols and Xerosols, strongly dissected to mountainous (I-X-c-3512); Lithosols, Cambisols and Rankers, strongly dissected to mountainous (I-B-U-2c-3503); Calcic Yermosols, rolling to hilly (Xk4-2b-3303); Haplic Yermosols, Calcaric Regosols, Calcic Yermosols, and Orthic Solonchaks, level to hilly (Yh23-2ab-3581); and Cambic Arenosols, Calcaric Regosols, Calcic Yermosols, and Solonchaks, level to gentle undulation (Qc47-1a-3542).
The Land Cover Atlas of the Islamic Republic of Afghanistan for 2010 was prepared through the cooperation of the FAO and Ministry of Agriculture, Irrigation, and Livestock (MAIL), Islamic Republic of Afghanistan, under the “Strengthening Agricultural Economic, Market Information and Statistics Services”, using medium resolution satellite imagery from SPOT-4 with a 10 m spatial resolution and the Global Land Survey (GLS) Landsat Thematic Mapper, high-resolution satellite imagery and aerial photographs as well as ancillary data [29]. The land cover map for the BRB is shown in Figure 2a. There is a lack of reliable soil-type maps in many parts of the world, for which two commonly used global soil-type maps, the FAO/UNESCO soil map of the world and the Harmonized World Soil Database (HWSD_v121), are adopted [30]. The FAO/UNESCO soil map of the world (Figure 2b) was used as the soil-type map in this watershed modelling. The FAO/UNESCO soil map of the world was prepared using topographic map series of the American Geographical Society of New York at a scale of 1:5,000,000 with a topsoil layer of 30 cm and a subsoil layer of 70 cm [30].

2.2.2. Point Source Data

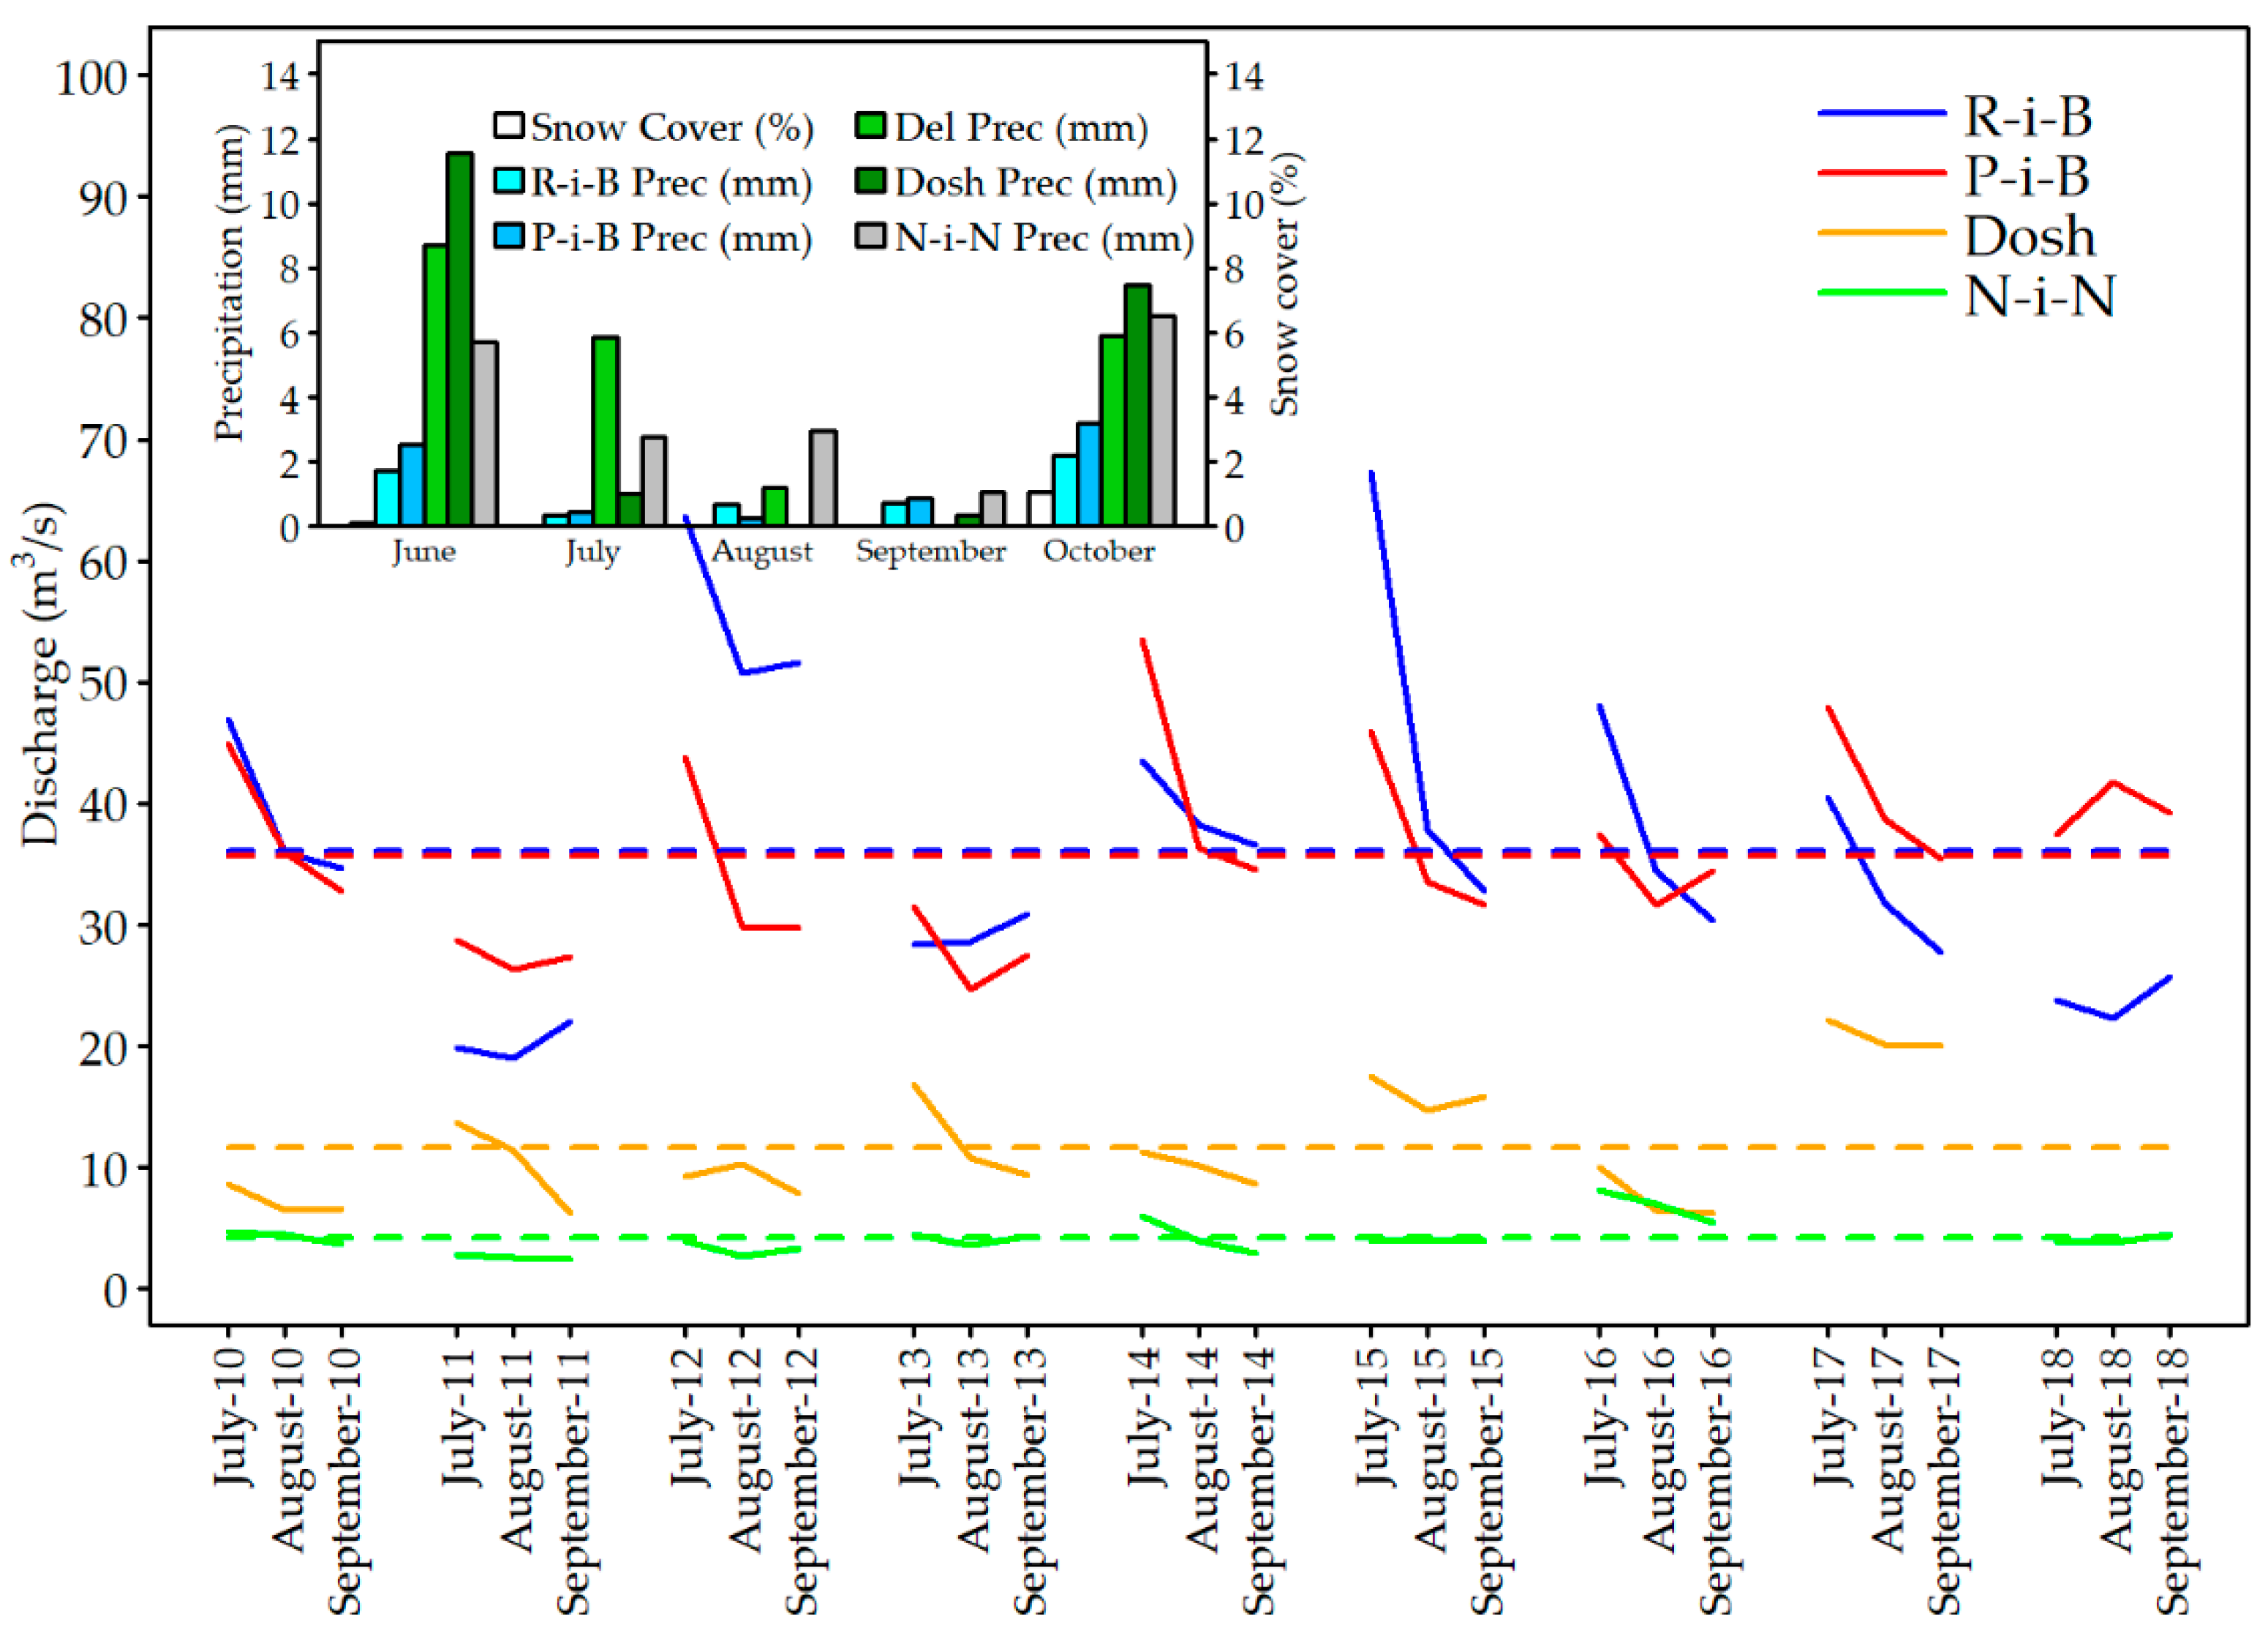
The BRB is located in a mountainous region with 190 springs along the steam, where no records of their exact location and water yield are available. Historical discharge during the non-rainy season was used to overcome the groundwater data scarcity issue. We assumed that the precipitation and snowmelt contributions to the stream flow during July, August, and September is negligible. The monthly average precipitation at the five stations in the BRB is shown in Figure 3, where the precipitation is almost zero during July, August, and September. In the same bar plot, the snow cover area percentage was plotted as per Hussainzada, (2020) [31]. In this study, monthly snow cover percentages for the BRB were retrieved from the spatiotemporally combined MODIS Aqua and Terra daily snow cover products. The recorded monthly average discharge of the four stations Rabat-i-Bala, Pul-i-Baraq, Doshqadam, and Nazdik-i-Nayak stations in subbasins 7, 10, 28, and 30 (Figure 1c) respectively, is shown in Figure 3 for these three dry months. The dotted lines in Figure 3 show the average flow from 2010 to 2018. The Balkhab river starts from a series of six lakes with a perennial discharge of 4.22 m3/s, and for subbasins 7, 10, and 28, the groundwater contribution is equal to the difference in the amount of discharge between the upper station and lower station during the non-rainy months. The groundwater contribution in the subbasins is replicated in Table 1.

2.2.3. Irrigation Canals

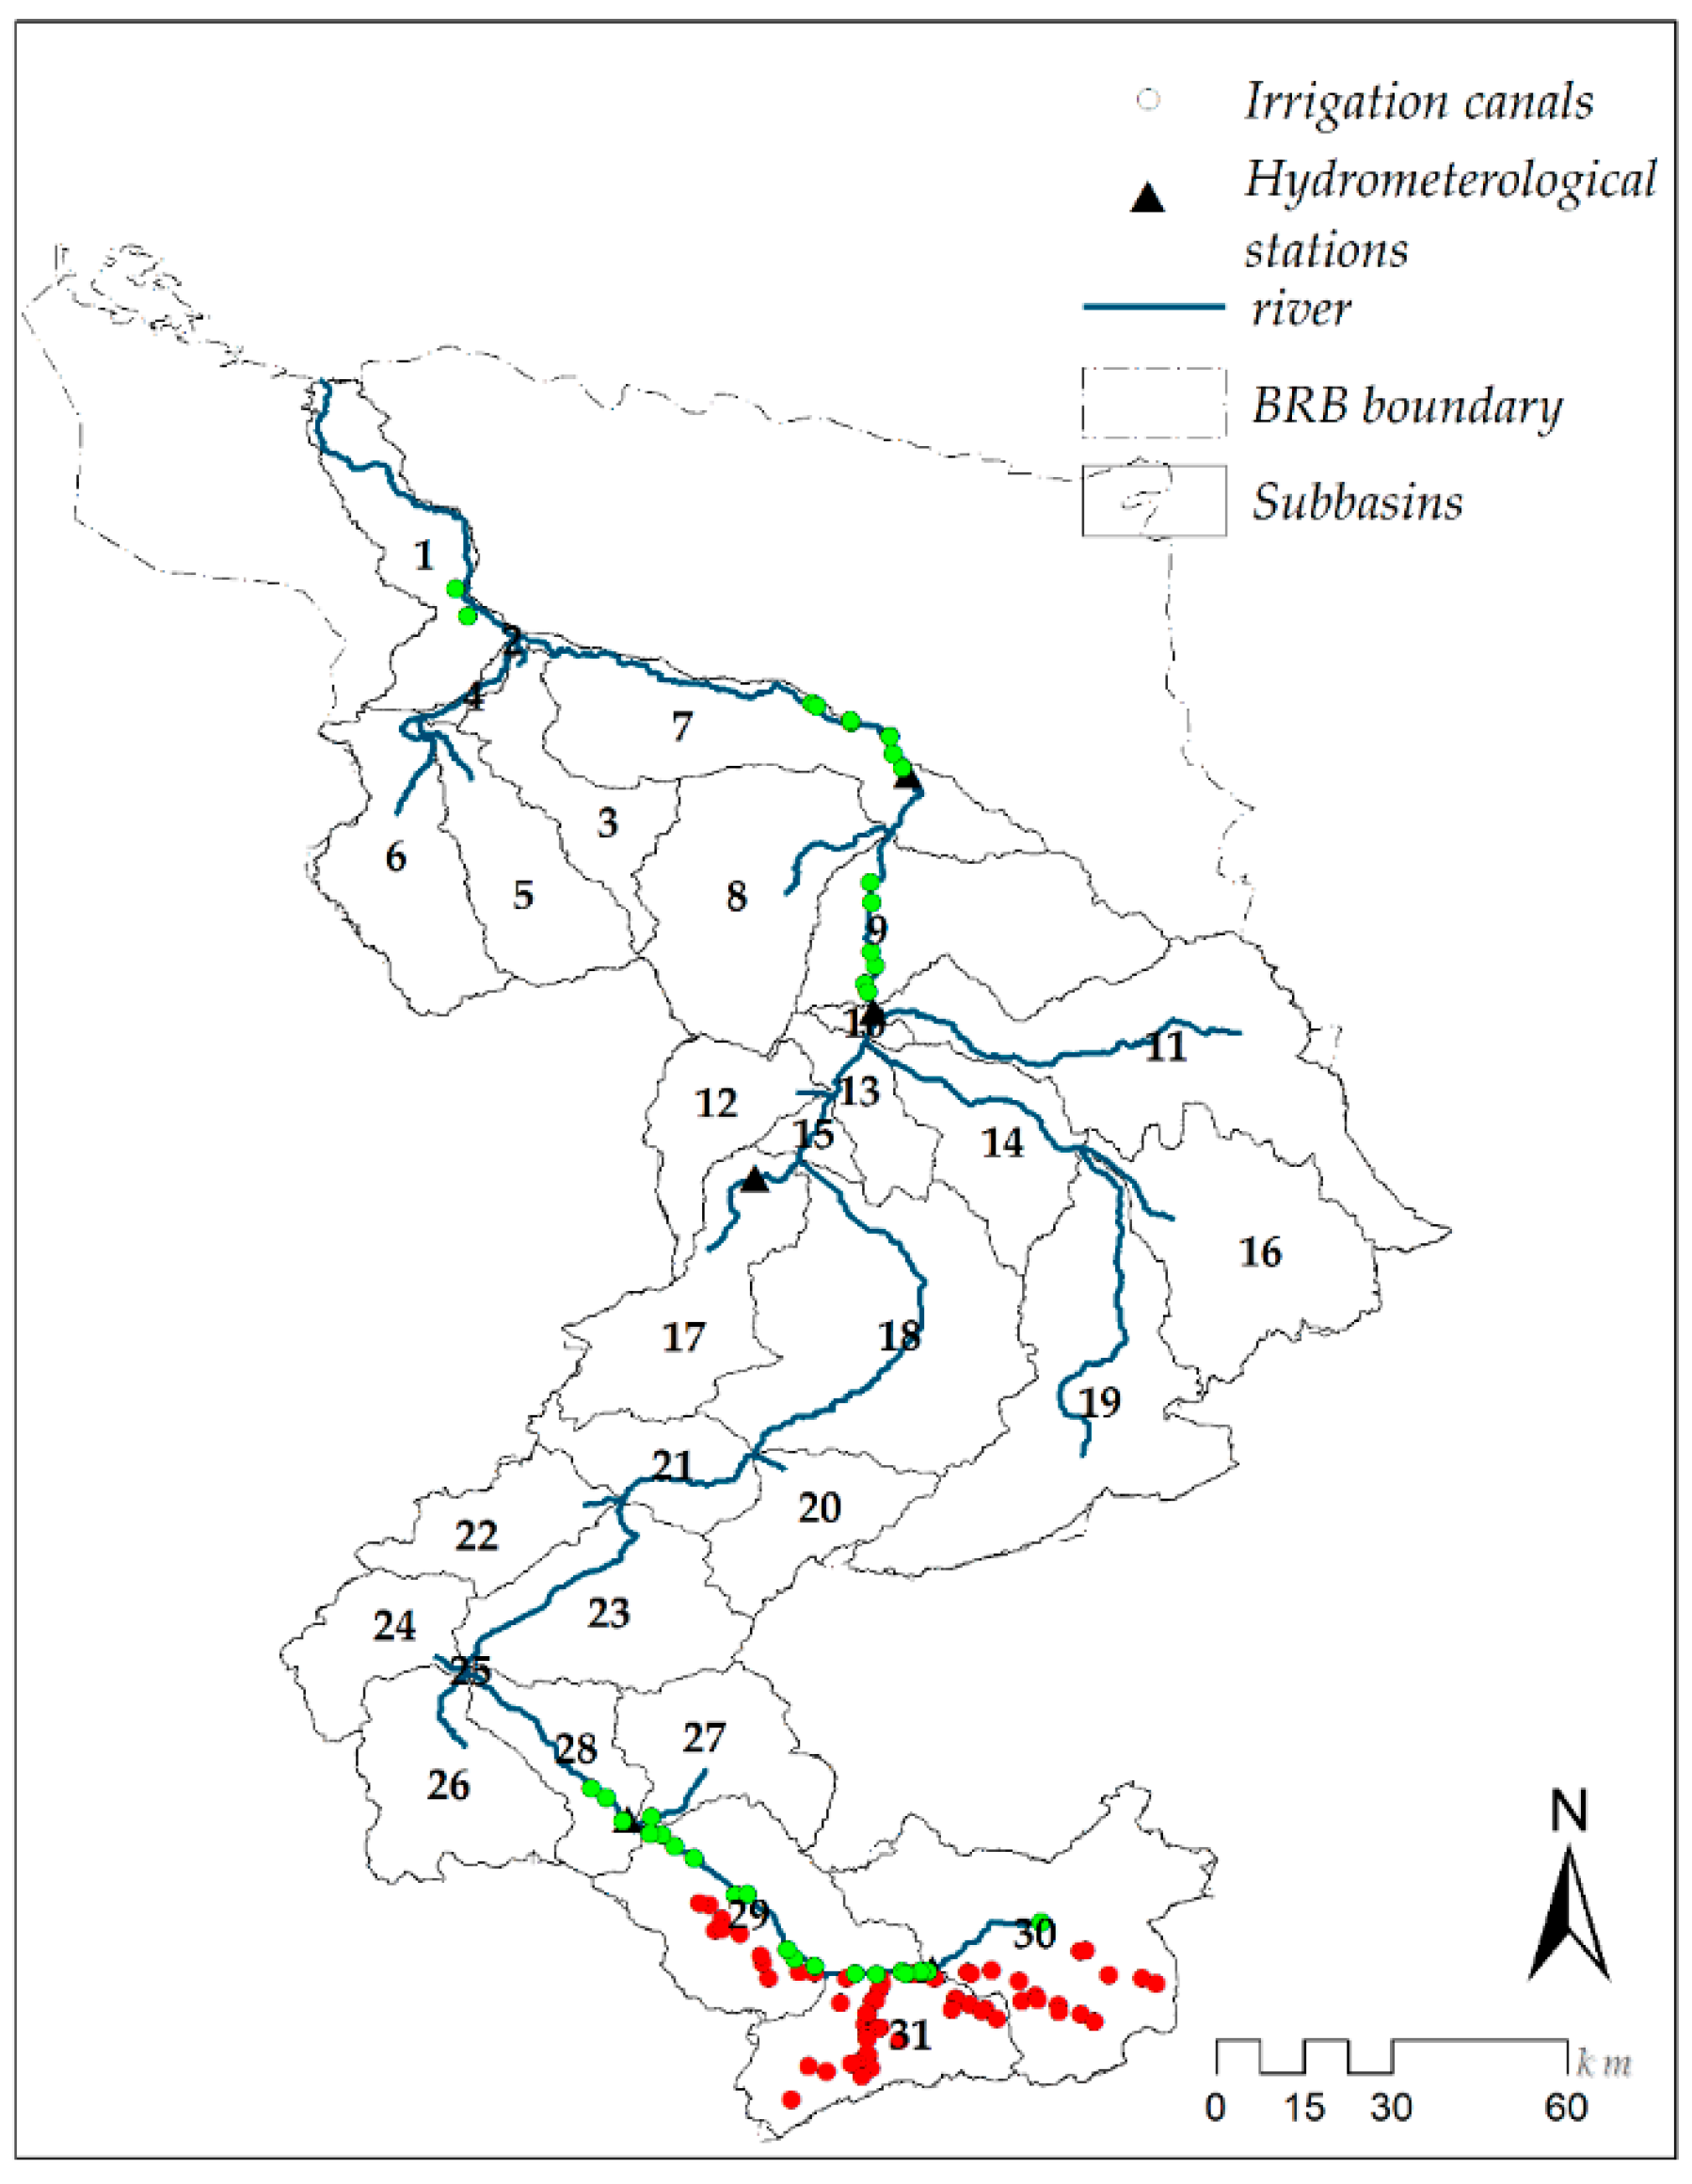
Information on irrigation canals is used as the seasonal irrigation practice for crop cultivation in watershed modelling. The agricultural sector in the BRB extracts water through 101 irrigation canals and 3 regulator dams in the downstream region, extracting water from the river. Three regulator dam functions distribute the water to the irrigation canals, and there is no storage behind the dam. Therefore, the dam downstream discharge is equal to the dam upstream discharge minus the water withdrawn by irrigation canals. Data on the locations of the irrigation canal intakes and their discharge are provided by the Northern River Basin Authority Report [32]. Figure 4 depicts the irrigation canal intake along the Balkhab River. Thirty-four canals out of hundred and one canal in the BRB originate from the main Balkhab River and are designated by the green color in Figure 4; these canals irrigate 258,305.5 ha of agricultural land, and other canals are small canals that feed from springs or small temporary streams mostly located upstream in the southern part of the study area. The sources of water for the other sixty-seven canals designated by the red color in Figure 4 are springs or temporary small rivers. In this study, thirty-four canals and their effect on river discharge were considered negligible.

3. Methods

3.1. SWAT Model

The SWAT model is a physical-based semi-distributed hydrological model developed to predict the impact of water management, sediment, and agricultural chemical yield in a large watershed at a daily time step [16,33,34]. Based on the daily precipitation, air temperature, relative humidity, solar radiation, and wind speed, the SWAT simulates the daily, monthly, and yearly hydrological processes in a watershed.
The SWAT estimates the surface runoff based on two different methods: (1) the soil conservation service (SCS) runoff curve number and (2) the Green-Ampt infiltration method [34]. In this study, the SCS curve number method was used for modelling purposes. The SWAT divides the basin into subbasins that are composed of smaller components called hydrological response units (HRUs). HRUs are divided based on homogenous land use, soil type, and topography. First, the surface runoff was estimated for the HRUs and then the total runoff for the entire watershed was obtained using the hydrological model [16,35]. The model predicts the surface runoff based on the water balance equation (Equation (1)).
S W t = S W + t = 1 t ( R i Q i E T i P i Q R i )
where S W t and S W are the respective final and initial soil water contents at time t ; R , Q , E T , P , and Q R are the daily amounts of precipitation, runoff, evapotranspiration, percolation, and return flow, respectively; all units are mm of H2O.
The model estimates potential evapotranspiration (PET) based on three functions: Hargreaves, Penman-Monteith, and Priestley-Taylor. The Hargreaves method estimates PET as a function of extraterrestrial radiation and air temperature [16]. In this study, the Hargreaves method was utilized for PET calculations by estimating the PET as a function of extraterrestrial radiation and air temperature [16]. The Hargreaves temperature-based method is the most commonly used method for the estimation of PET when weather data are unavailable [36]. The Hargreaves method has been modified for SWAT by replacing the extraterrestrial radiation with RAMX (maximum possible solar radiation at the Earth’s surface) and through the use of temperature exponents from 0.5 to 0.6 [16].
E o = 0.0032 ( R A M X H V ) ( T + 17.8 ) ( T m x T m n ) 0.6
where T m x , T m n , and T are the daily maximum, minimum, and average air temperatures in °C, respectively, and H V is the lateral heat of vaporization (J g−1).
Snow present in the watershed will melt when the second soil layer temperature exceeds 0 °C, and snowmelt will account for the same amount of rainfall during the day to estimate runoff and percolation [16]. The model uses the degree-day method for estimation as a linear function of air temperature by setting the snowmelt threshold [34].

3.2. Model Setup

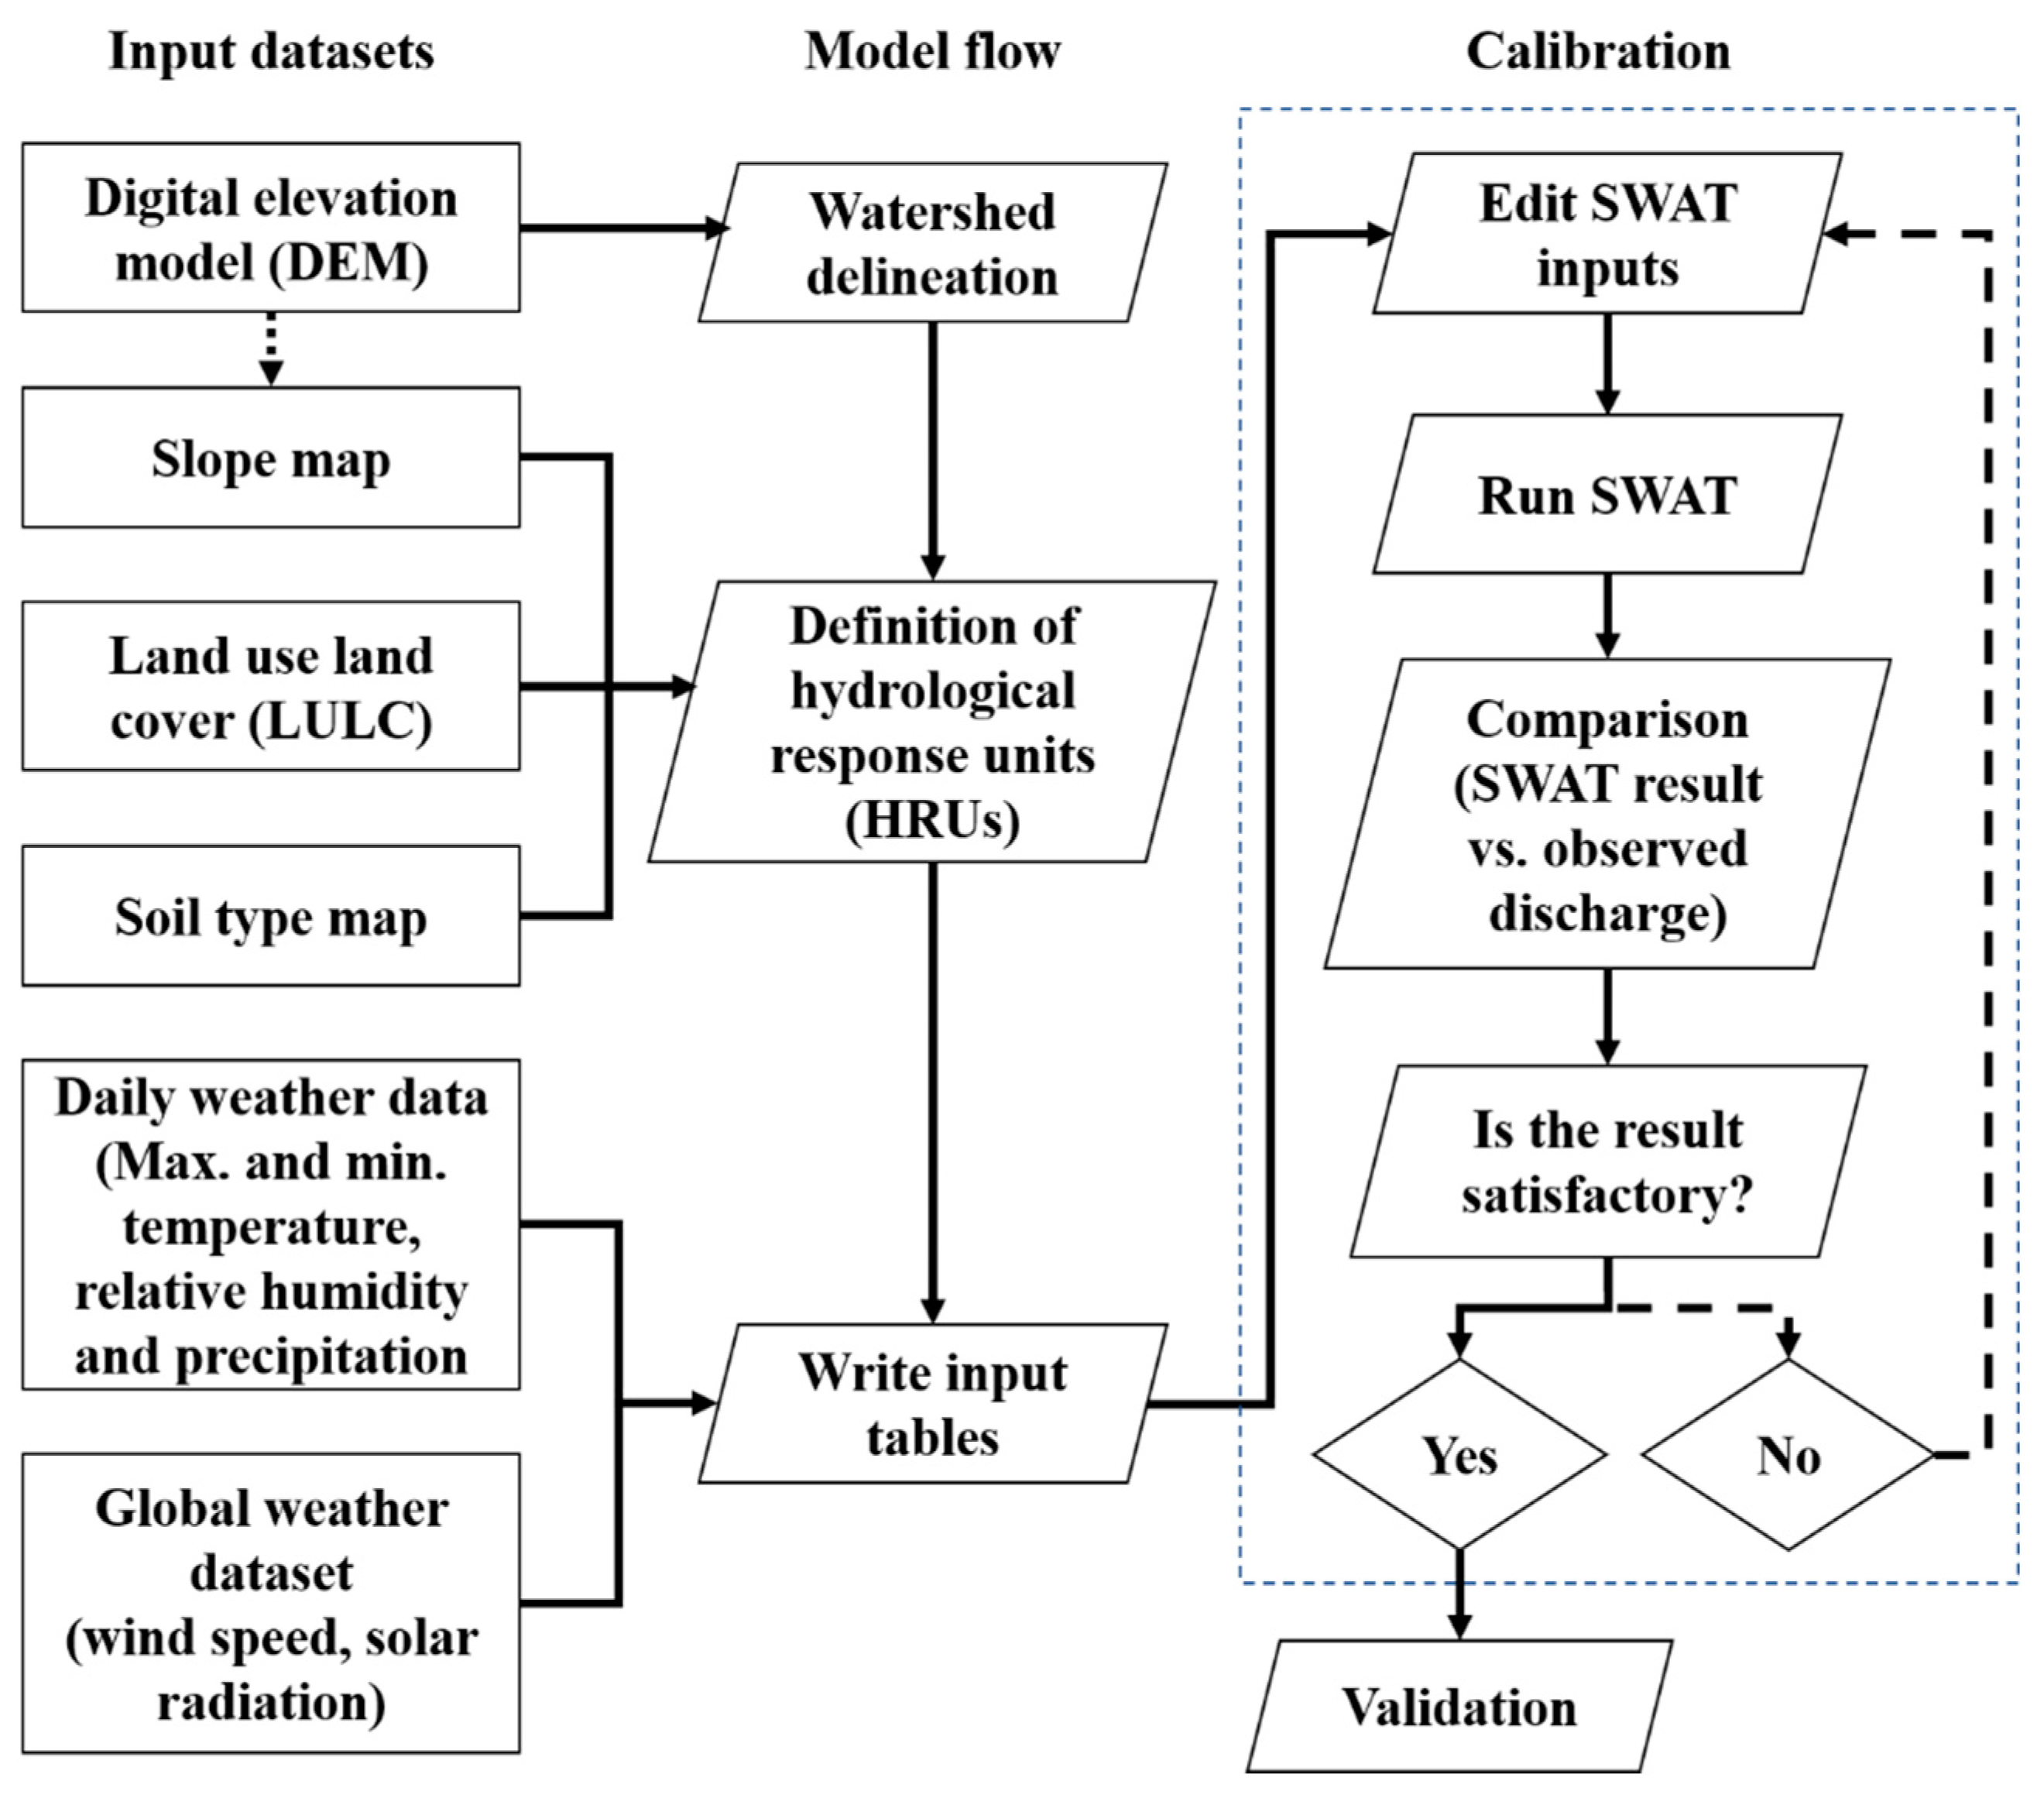
ArcSWAT 2012 with the ArcGIS interface was used for BRB watershed model development. In the first step of the modelling, watershed delineation using ALOS PALSAR DEM with 12.5 m spatial resolution for simulating the streamflow and subbasins was conducted. In the watershed delineation step, SWAT divided the BRB into 31 subbasins based on the flow accumulation and DEM file (Figure 4). The watershed delineation does not cover all low land areas in the northern BRB because those area slopes are far away from the Balkhab River, and their surface runoff does not contribute to the stream flow of the Balkhab River. Second, the HRU definition was manipulated using the FAO/UNESCO soil map of the world, land cover map of the study site, and slope of the site using the DEM (Figure 2). The study area was divided into 1532 HRUs for all 31 subbasins based on the input dataset. Then, the weather records at five hydrometeorological stations from 2010 to 2018 were defined as the input weather data for the model. The SWAT model was run for the BRB with a three-year warm-up period from 2010 to 2012, and outputs were generated from 2013 to 2018 on a monthly basis. In the current study, the calendar year was adopted for model simulation starting in January and ending in December because the data are available from January 2010, even though the hydrological years in the northern hemisphere start in October and end in September. The model simulation output was divided into two periods for calibration and validation. The simulation results from 2013 to 2015 were used for calibration purposes, and the simulation results from 2016 to September 2018 were selected as the validation period. The major working procedure for the model setup and model calibration is summarized in the workflow diagram (Figure 5).
The BRB starts from six lakes upstream with a perennial flow from the reservoir of these lakes, while 190 springs along the river also contribute to the baseflow of the river, especially during the dry season with almost zero precipitation. On the other hand, the irrigation canals along the river withdraw a considerable amount of water during the entire year from the Balkhab River. All these water contributions and water withdrawals for thirty-four canals were included in the model as point sources to develop a reliable hydrological model for the BRB.

3.3. Calibration and Validation

Successful hydrological modelling is highly dependent on model calibration and parameter sensitivity analysis [37,38]. In this study, the SWAT Calibration and Uncertainty Procedure (SWAT-CUP) v5.2.1 [38] Sequential Uncertainty Fitting Algorithms (SUFI2) were adopted for the model calibration and uncertainty analysis. The SUFI2 details are presented in Homan, et al., (2011) [39] and Karim C Abbaspour, (2007) [38].
The model was calibrated for the period from January 2013 to December 2015 based on the monthly discharge recorded at four stations, Rabat-i-Bala, Pul-i-Baraq, Doshqadam, and Nazdik-i-Nayak, which are located in subbasins 7, 10, 28, and 30, respectively. Then, the model was validated for the period from January 2016 to September 2018 with the remaining data.
The parameter optimization was conducted using SWAT-CUP (SUFI2) at multiple sites for the parameters listed in Table 2. The monthly average discharges at four stations in subbasins 7, 10, 28, and 30 were included in the calibration process. In the model parameterization, a careful combination of the parameters should be considered before starting the calibration. The rainfall parameters as driving parameters or snow parameters (SFTMP, SMTMP, SMFMX, SMFMN, TIMP), which introduce water into the system, should not be calibrated with other parameters [40].
Non-uniqueness drives more than one solution for the SWAT model, which means that the model can generate the same discharge signal with two completely different sets of parameters, as described in Karim C. Abbaspour et al., (2017) [40]. The non-uniqueness issue can be reduced by increasing the number of variables and using multiple outlets for calibration purposes. An increase in the number of observation stations during the calibration can lead to a more reliable model after the calibration process. However, the use of more variables (i.e., discharge, ET, sediments, or crop yield) in the calibration process can ensure a better model representation of the original site condition. In this study, we could not access datasets other than discharge, and other datasets must be included in future studies.
The variability of the temperature and precipitation with elevation in the mountainous basin is an important phenomenon that can affect the model performance. Five elevation bands were used to adjust the temperature and precipitation variation to the elevation in each subbasin. Then, the temperature and precipitation lapse rate were calibrated, and the fitted values were replaced in the model. Snow and its contribution to the streamflow in mountainous basins is the second most important process and should be calibrated before the model parameters are tuned. The calibration process was continued with optimization of the seven snow parameters in the model. SWAT-CUP was run for the snow parameters with 200 simulations, and the fitted parameters were replaced in the model.
The model calibration requires knowledge of hydrology, while a correct understanding of the site and its hydrological condition is also necessary to choose the appropriate parameters. The model parameters were chosen based on a literature review of previous studies and the output of the calibrated model for the temperature lapse rate, precipitation lapse rate, and snow parameters. The chosen parameters were subjected to a sensitivity test using the SWAT-CUP platform to determine their sensitivity and changes on the hydrograph. Then, seven more parameters in Table 2 were used for the final model calibration with 1000 simulations.
The model performance for the calibration and validation was computed separately for the Rabat-i-Bala, Pul-i-Baraq, Doshqadam, and Nazdik-i-Nayak stations in the subbasins 7, 10, 28, and 30, respectively. The simulated runoff from the SWAT with monthly observed discharge based on the data availability were used for model verification. The Nash-Sutcliffe efficiency (NSE) [41], coefficient of determination (R2), r-factor [42], p-factor, and percent bias (PBIAS) [43] were used as statistical indicators to determine the model goodness-of-fit for both the calibration and validation periods and are shown in Equations (3)–(5), respectively. The p-factor (percentage of measured data bracketed by 95% prediction boundary), often referred to 95PPU is used to quantify the model uncertainty of the SWAT. The p-factor ranges from 0–1, and values closer to 1 show a higher model performance and efficiency. The r-factor is the average width of the 95PPU band divided by the standard deviation of the measured variable.
N S E = 1 i = 1 n ( Q i P i ) 2 i = 1 n ( Q i Q ¯ ) 2
R 2 = ( i = 1 n ( Q i Q ¯ ) ( P i P ¯ ) i = 1 n ( Q i Q ¯ ) 2 i = 1 n ( P i P ¯ ) 2 ) 2
P B I A S =   i = 1 n ( Q i P i ) ( 100 ) i = 1 n Q i
r f a c t o r =   1 n t i = 1 n ( y t i , 97.5 % M y t i , 2.5 % M ) σ o b s
where Q i is the measured discharge ( m 3 / s ), P i is the simulated discharge ( m 3 / s ), Q ¯ is the average observed discharge ( m 3 / s ), P ¯ is the average simulated discharge ( m 3 / s ), n is the number of months, y t i , 97.5 % M and y t i , 2.5 % M are the upper and lower boundaries of the 95PPU; and σ o b s is the standard deviation of the observed data. The model performance can be evaluated with the general criteria presented in Table 3 [44,45].

4. Results

4.1. Calibration

4.1.1. Baseflow

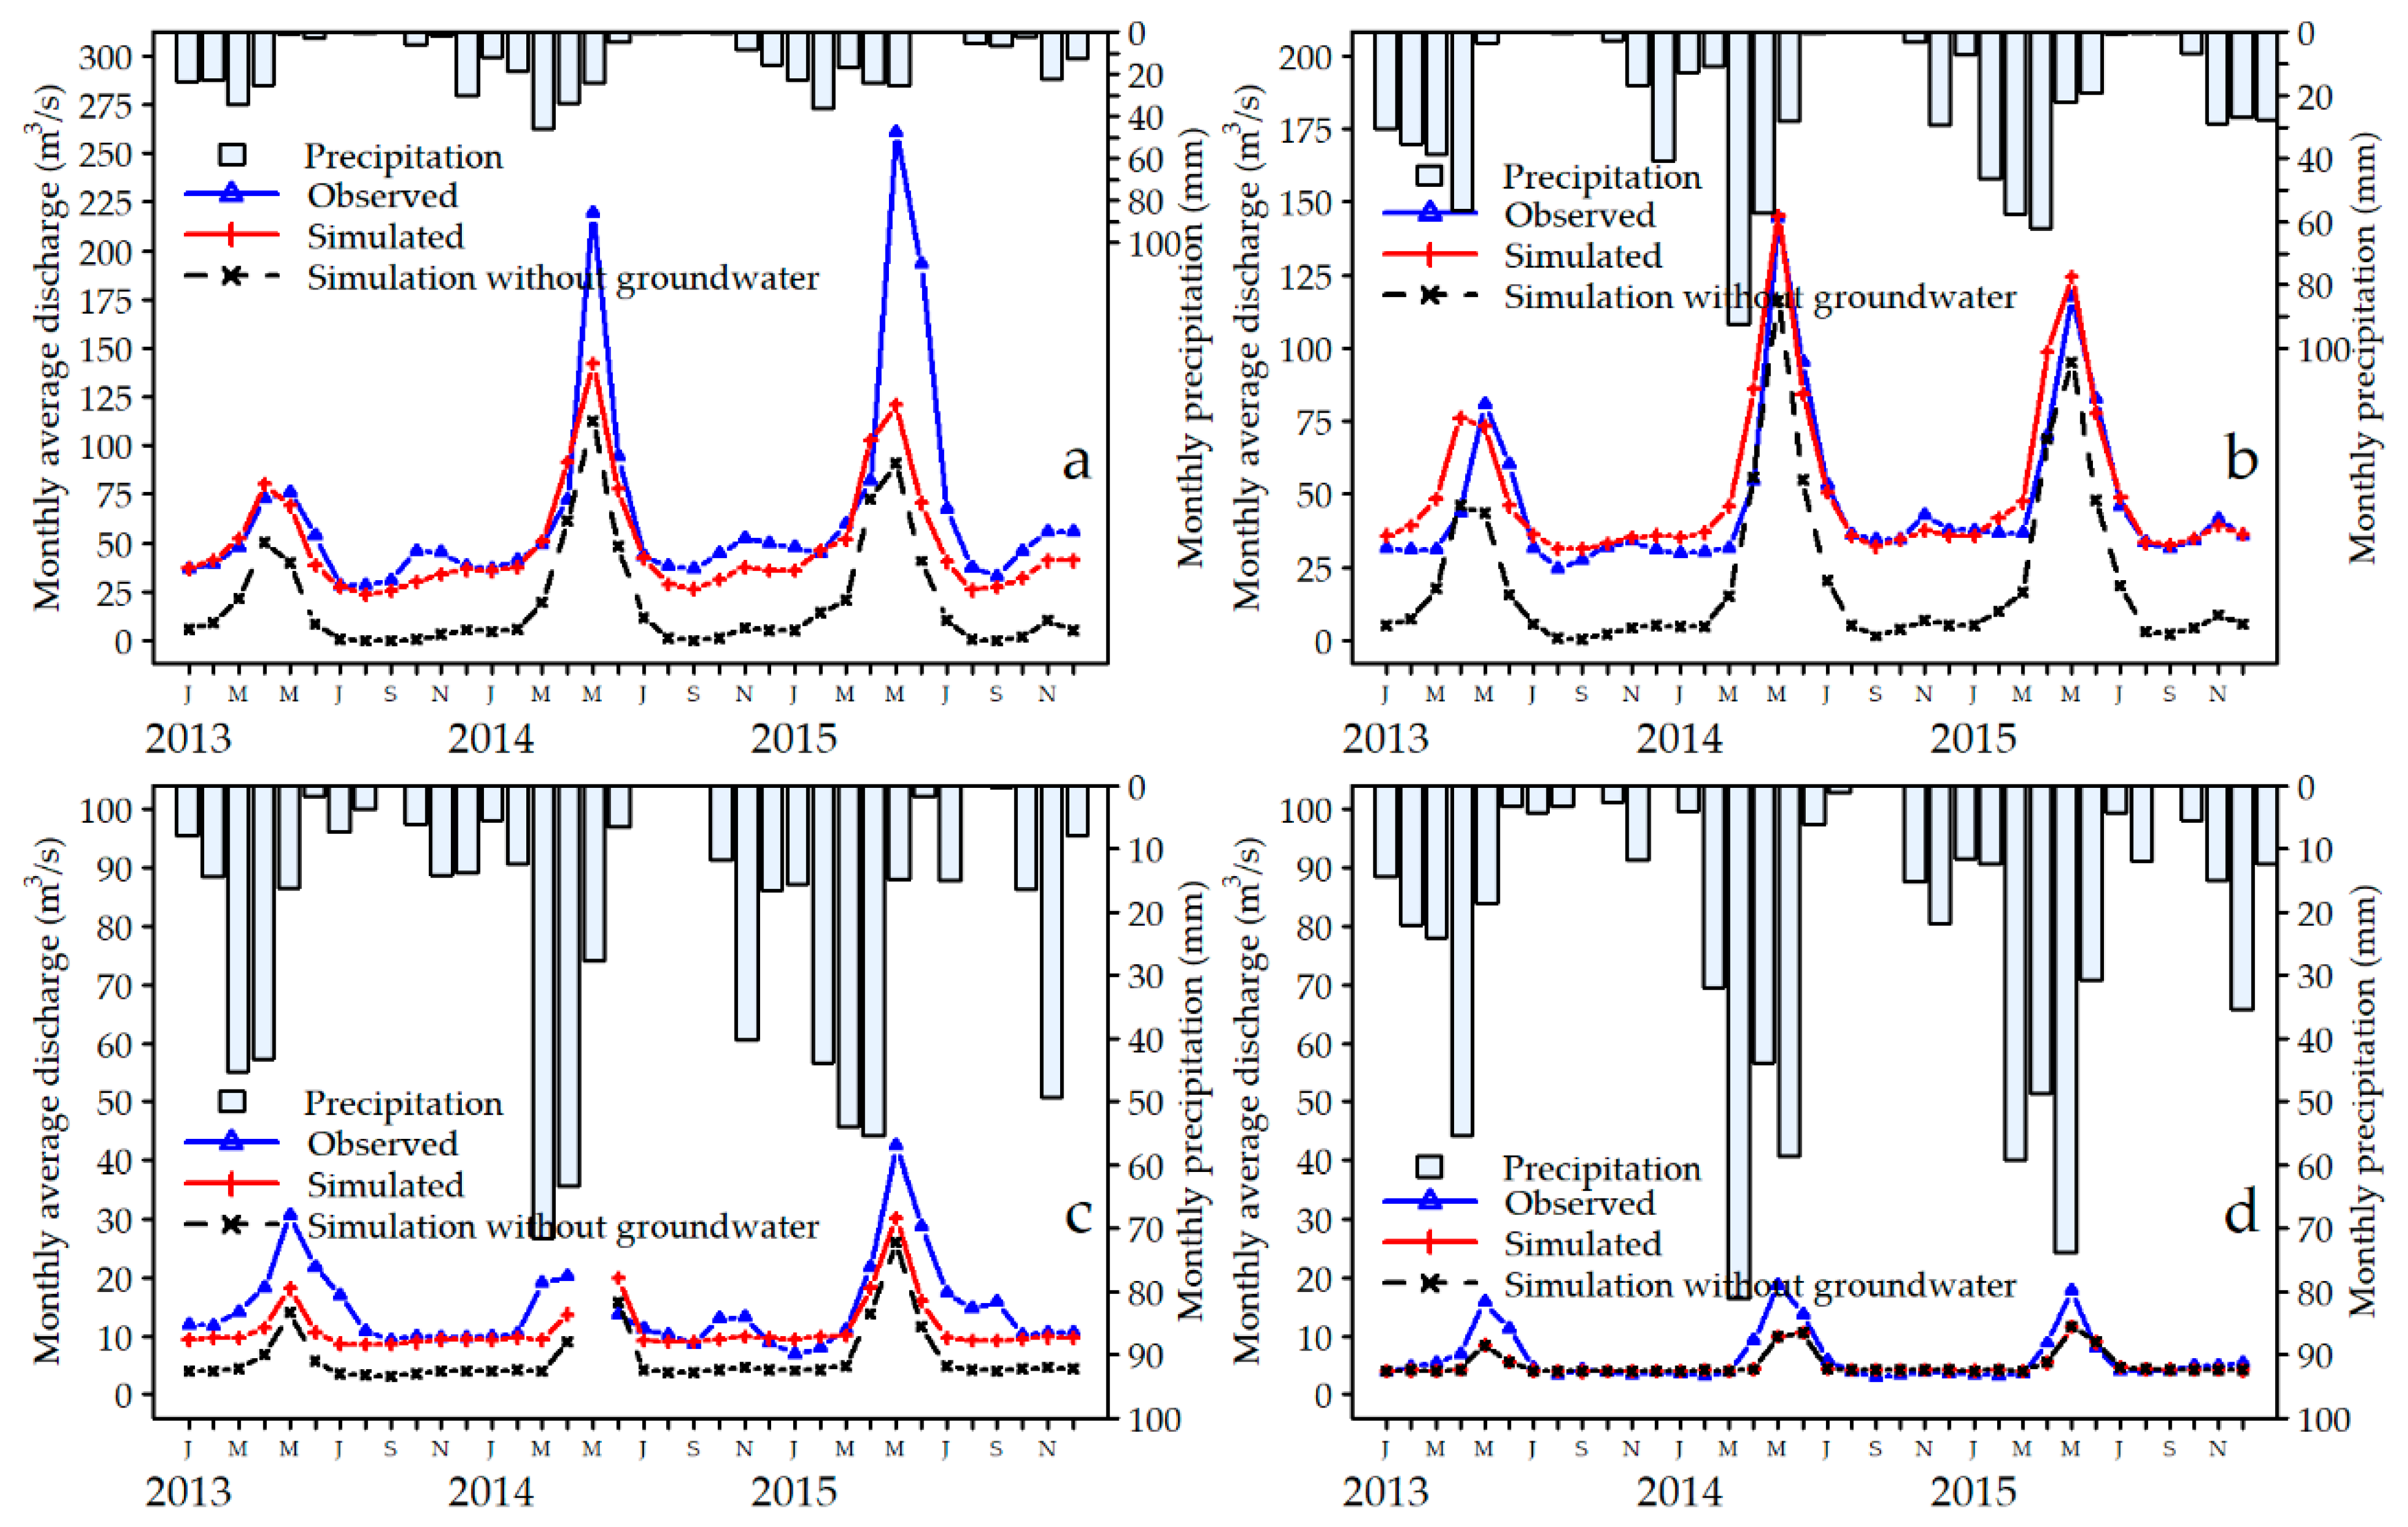
The relationship of groundwater contribution to stream flow is a poorly understood phenomenon in hydrology [47,48]. In the dry season, groundwater discharge is a principal source of water in the lowland valley [47,48,49]. Figure 6 illustrates the hydrographs of two different simulations with and without constant groundwater input to the model. As shown in Figure 6, the simulations after inclusion of the spring flow contribution, which were estimated from the historical discharge analysis in the gauging stations presented in Figure 3 and summarized in Table 1, show a significant improvement in the baseflow by eliminating underestimations. The hydrographs present a constant gap between the simulation without groundwater input to the observations and the simulation after groundwater contribution is included in the model. In this section, the simulation result before and after adding the ground water contribution using point source data explained in Section 2.2.2 is presented.
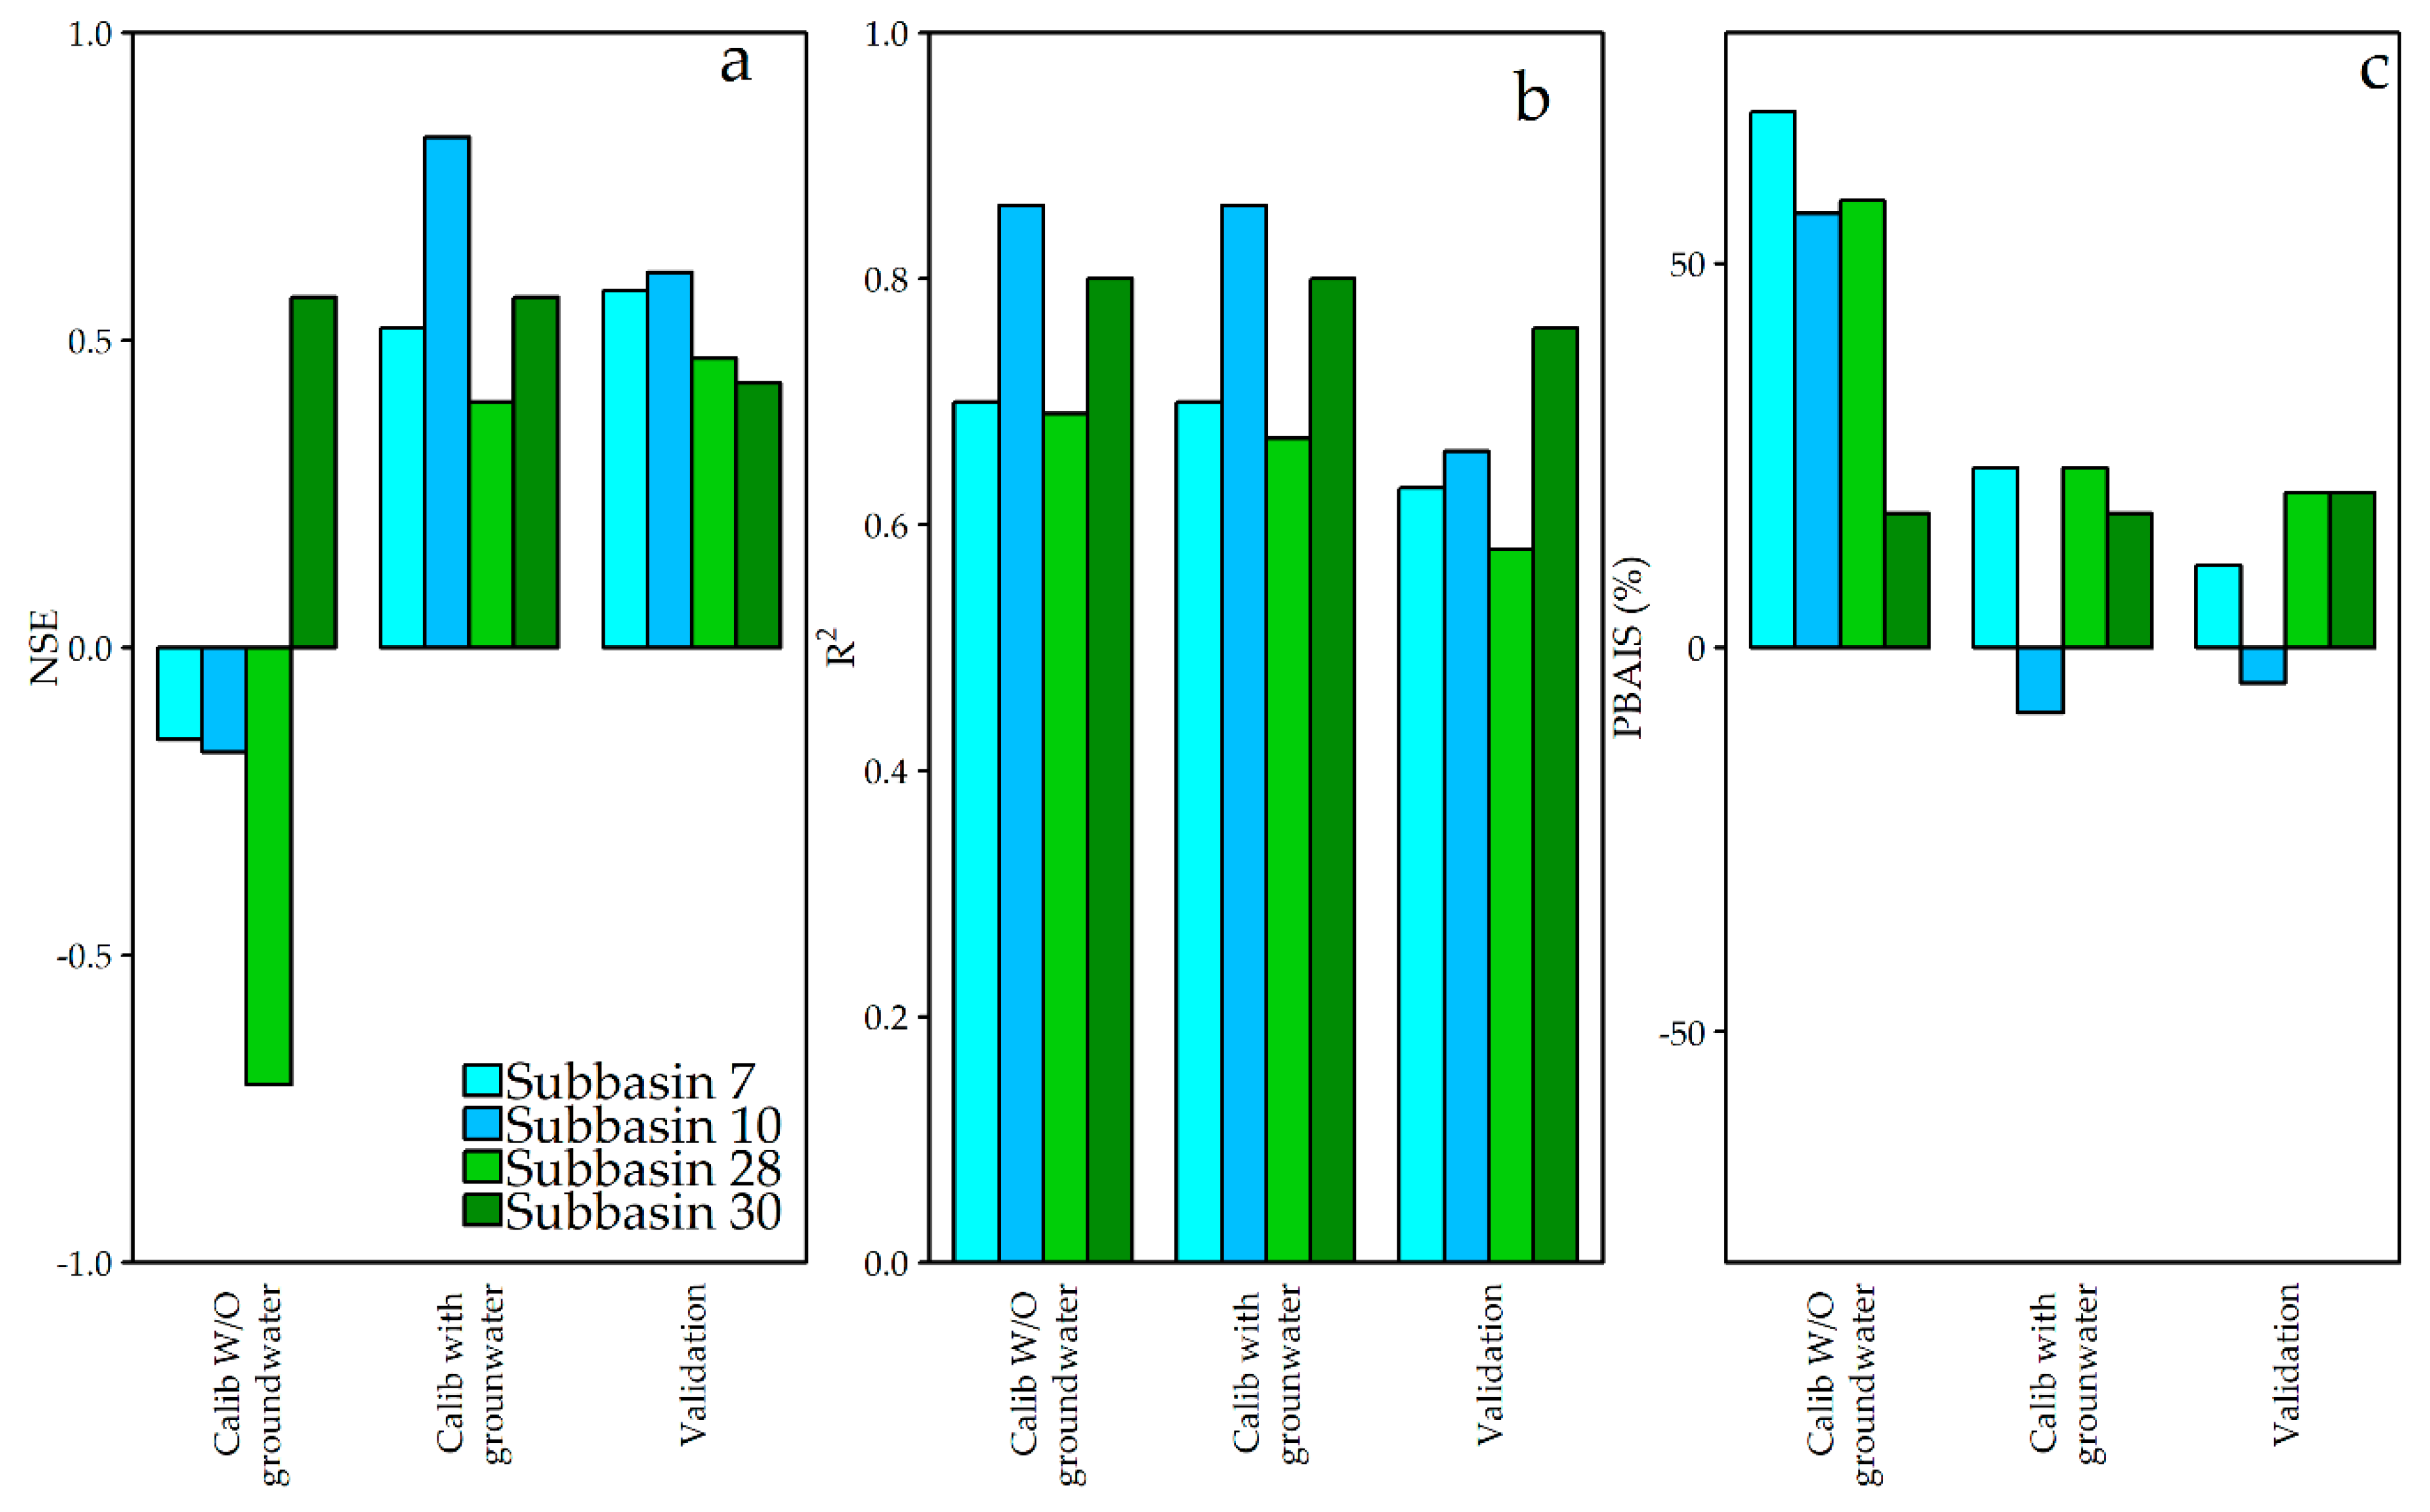
However, the model without groundwater consideration still captured the temporal variation and pattern of the observation, but the large underestimation makes the model unrealistic. In terms of the statistics for model performance, the model can be evaluated as satisfactory to very good with respect to the R2 values, while the NSE and PBAIS values were unsatisfactory in subbasins 7, 10, and 28, where high underestimation decreased the NSE range between −0.71 and −0.15 and the PBAIS range between 56.1% and 69.7%. In subbasin 30, the model did not differ with and without groundwater input since the subbasin is located far upstream, where six lakes feed a perennial discharge to the streamflow. The model statistical summary without the groundwater contribution case is presented in the validation section.

4.1.2. Calibration Result

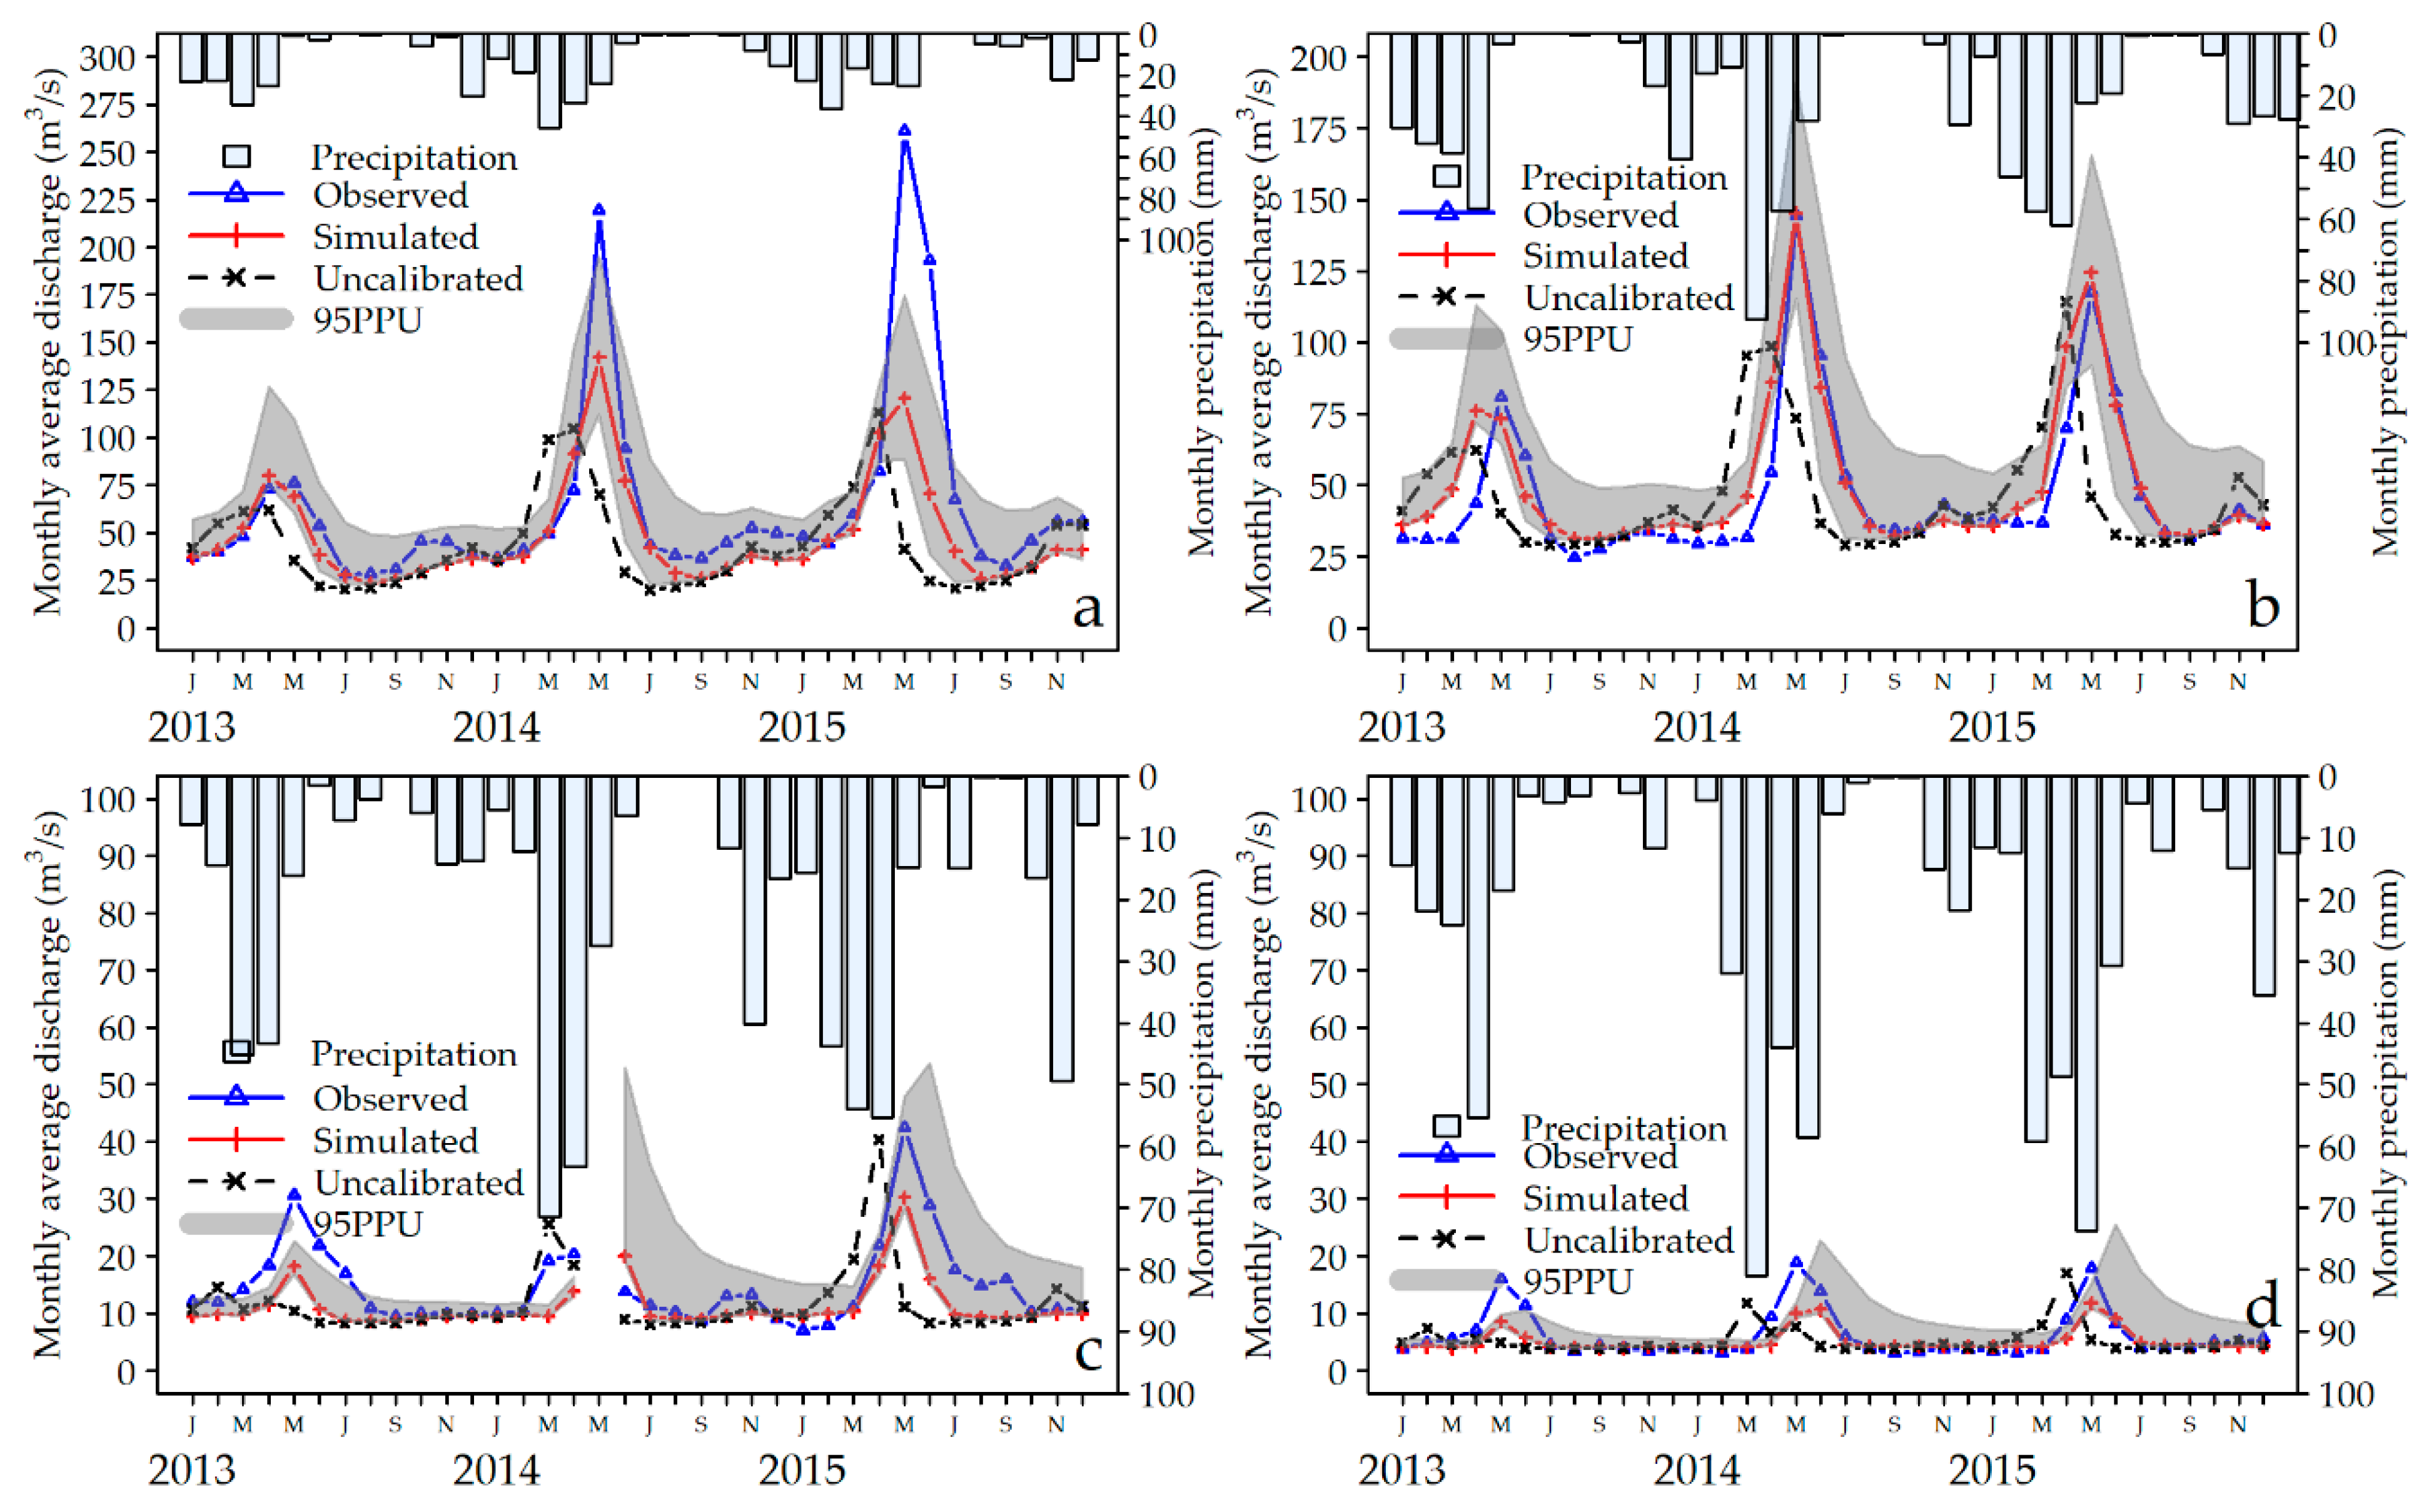
The simulated discharges from the model calibration were compared with the ground truth at the four gauging stations located in subbasins 7, 10, 28, and 30. Figure 7 demonstrates the calibration result between the observed and simulated monthly discharges at the four gauging stations in addition to monthly precipitation records at each site. Uncalibrated hydrographs show that the peak discharges appeared earlier in March and April than the observed peak in May. The uncalibrated peaks corresponded well with the peaks of observed precipitation. Thus, this shifting can be caused by faster snowmelt or misclassifying snow as rainfall in the model. Calibration of the temperature lapse rate, precipitation lapse rate, and snow parameters can improve the resulting hydrograph by considering the snowmelt conditions in the model.
The simulated discharges after calibration of those parameters showed good agreement with the observed discharges at the gauging stations. The model captured variations in the streamflow in all the subbasins during the steady-flow conditions in winter, summer, and autumn with an almost constant underestimation gap between the observed and simulated discharges in subbasin 7. However, the model could not reproduce the peak flows well during the spring in subbasins 7, 28, and 30 in 2014 and 2015, with underestimation of the peak flows.
The model uncertainty results also depicted acceptable output with p-factors of 0.89, 0.61, 0.71, and 0.56 for subbasins 7, 10, 28, and 30 and r-factors of 0.75, 1.27, 1.32, and 1.06, respectively. The P-factor and r-factor are the percentage of observations covered by the 95 PPU uncertainty range and the relative width of the 95% probability band, respectively [50]. The model performance can be evaluated satisfactorily to very well with respect to the R2 values as per the ranges described in Table 3. The NSE indicator classified the result as unsatisfactory for subbasin 28 and satisfactory to very good for the remaining sites. In addition, the PBIAS values classified the results as from satisfactory to good for all stations.

4.2. Validation

Then, model validation was conducted using the available observations of the monthly average discharge from January 2016 to September 2018 in subbasins 7, 10, 28 and 30. The validation results are presented in Figure 8 for the subbasins. There are missing data for the discharge observations in subbasin 28 from October 2017 to September 2018 and in subbasin 30 from October 2016 to September 2017. In the validation process the model runs in a single simulation with the same calibrated parameters.
The model performance for the validation period showed an acceptable resampling of the flow pattern for the entire year, and it represents the baseline discharge that was well attributed to the groundwater input. The simulated discharges from the model validation indicated underestimations in the peak discharges in subbasins 7 and 10 during 2016.
The statistics for model performance are shown in Figure 9. The statistical indicator (R2) exhibited satisfactory to good model performance for all four subbasins. The PBIAS showed that the model performance was satisfactory to very good. The NSE showed satisfactory results in the two downstream stations in subbasins 7 and 10 and relatively lower values for subbasins 28 and 30, with values of 0.47 and 0.43, respectively.
The comparison between the statistical indicators for the calibration and validation depicted a slight decrease in the validation with respect to the calibration except for subbasins 7 and 28, which had slightly higher NSE values with respect to their calibration period. These slight increases were achieved by the better simulation of the peak flows while minimizing the underestimation in the validation period.

5. Discussion

5.1. Effects of Ground Water Contribution to the SWAT Model Result

Creating a reliable model that can present the watershed condition largely depends on the input dataset and correct definition of the hydrological process within the watershed. Proper understanding of the hydrological process and water management activity of a study site can lead to a more accurate and decisive hydrological model, thereby obtaining more reliable modelling results. In a high mountainous basin with steep terrain, the main source of water comes from snowmelt from high altitude areas and water infiltration, which will join the streamflow elsewhere in the lower downstream area in the form of lateral flow or springs. In developing countries with a lack of observations and ground truth data, finding accurate and solid records of hydrological processes is difficult and sometimes impossible.
The SWAT divides underground storage into shallow and deep aquifers, while the water entering the deep aquifer is not accounted for in the water budget calculation since it would not get back to the water cycle [51]. In the study area, approximately 190 springs contribute to the baseflow. As described in Luo et al., (2012) [51], the inclusion of the deep aquifer contribution to the baseflow can improve the model output.
Considerable amounts of precipitation occurred in the BRB during the winter and spring seasons, while the summer and autumn seasons were relatively dry. The hydrograph in Figure 3 illustrates the streamflow during the dry months in July, August, and September, where the precipitation is very low and the snow cover area in the mountains of the BRB almost disappears. In such an environment, the contribution of the deep aquifer to the baseflow is very important.
Current estimation using the recorded average baseflow during the dry season where the contribution of rainfall, snowmelt, and shallow aquifers reaches the minimum can improve the modelling result by minimizing the underestimation. Since a systematic underestimation in Figure 6 is noticeable for subbasins 7, 10, and 28, this constant underestimation of the baseflow can come from a constant source of water, which is the deep aquifer water returning downstream as the springs.

5.2. Peaks in the Hydrograph

The model predicted the baseflow variation well, but the peaks were not simulated as well as the baseflow. The underestimation of the peak in the two upstream subbasins 28 and 30 was more noticeable. In spring, the increase in rainfall and snowmelt causes a considerable increase in streamflow. The snowmelt process accelerated by the increase in air temperature and rainfall also contributed to rapid melting on rainy days. Rapid melting and rainfall together with steep slopes in the mountainous area upstream may cause flooding during early spring. On the other hand, flash floods in mountainous regions are another cause of the peak flow during rainy days at high altitudes when high-intensity rainfall occurs during a short period of time.
The SWAT model snowmelt algorithms are based on the degree-day factor. In this method, the snowmelt estimates are based on the increase in the temperature above the snowmelt threshold temperature. The contribution of rainfall to rapid snowmelt is not considered in the model; this issue caused underestimation of the peak flow during the early spring season when most floods were recorded at the BRB stations. On the other hand, the coarse weather and sparse stations could not capture the high precipitation in the mountainous parts in the upstream area and can result in the underestimation of peak flows.

5.3. Effect of Snowmelt: Comparison of the SWAT Snowmelt and Monthly MODIS Snow Cover Area

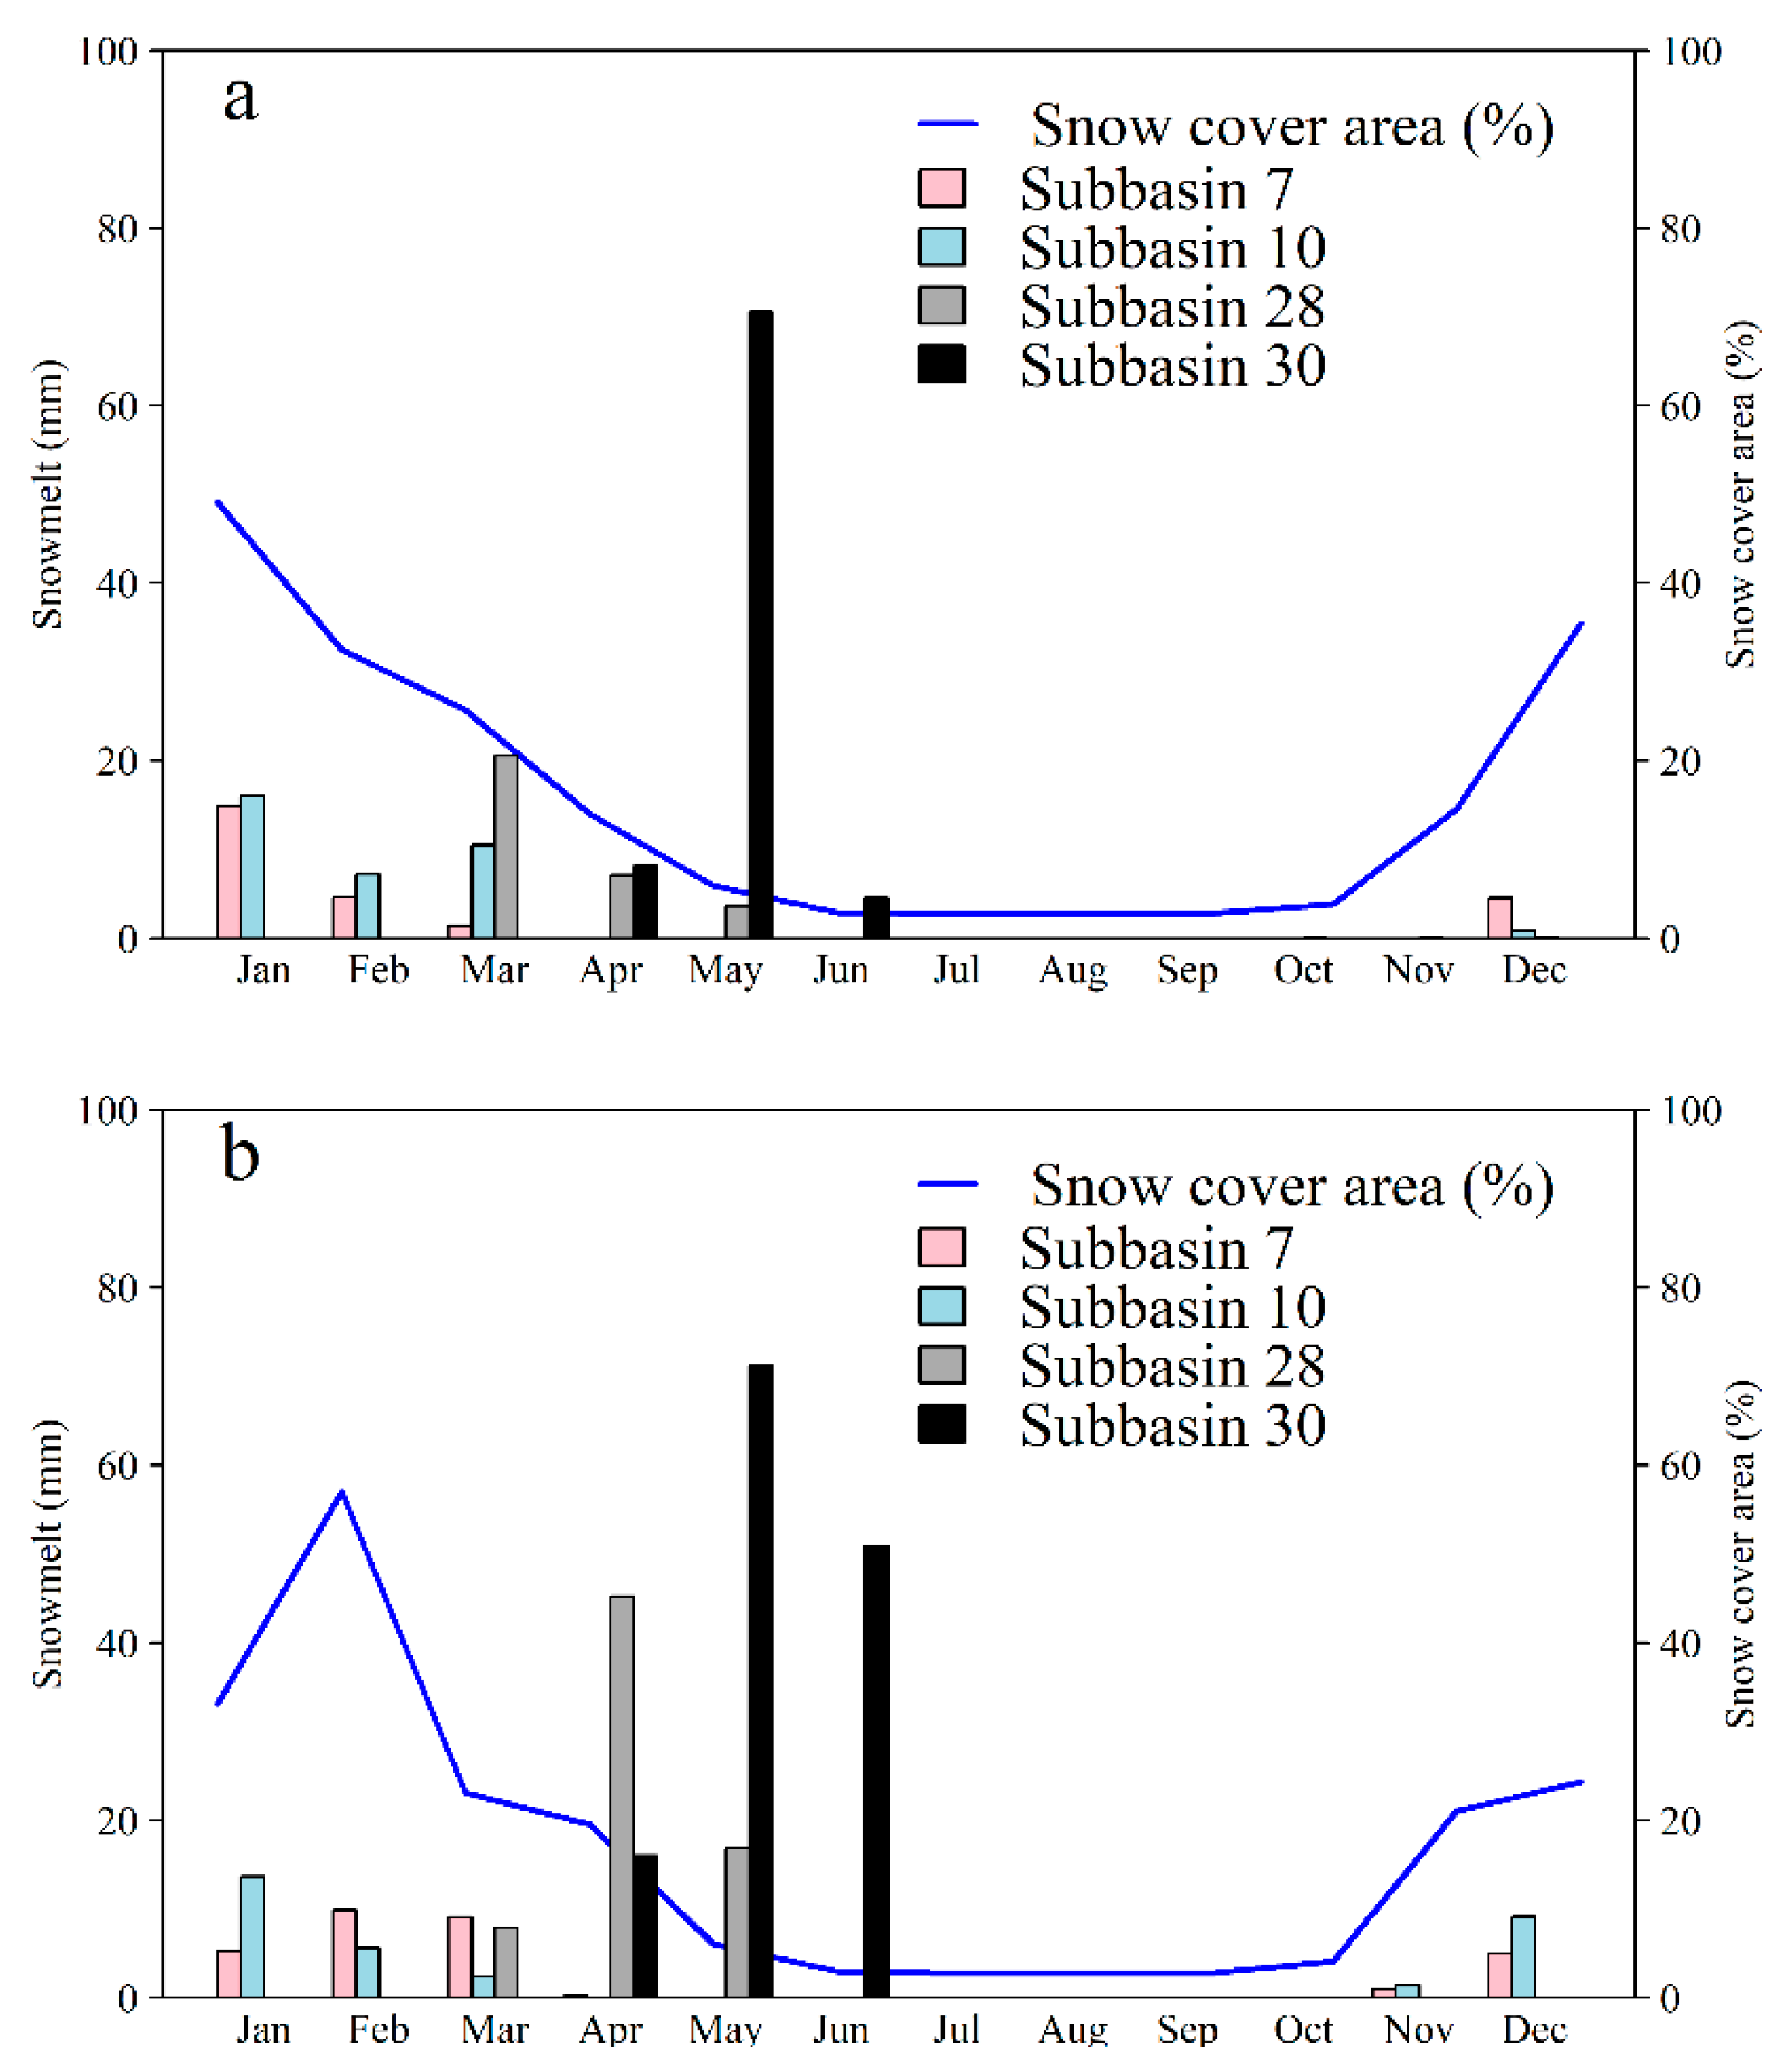
The SWAT calculates the snowmelt based on the degree-day factor method. Figure 10 presents a comparison between the snowmelt output from the SWAT model in the BRB and snow cover area (%) retrieved from the MODIS snow cover product C6. The snow cover area (%) is estimated based on the MODIS Aqua and Terra snow cover area after a spatial and temporal three step combination for reduction of the cloud obstruction. Figure 10a depicts the data for the year 2014 and Figure 10b is presenting the BRB snowmelt and snow cover area condition during 2014. The snow cover area (%) and the snowmelt show a good agreement with respect to the geographical location and seasonality. Subbasin 7 and 10 are located in the downstream lowland where the snowmelt occurs suddenly after the snowfall, and subbasins 28 and 30 are located in high altitudes where the snow accumulated during the low temperature in the winter season and melted later in the spring season. The snowmelt during November, December, January, February, and March is captured in subbasins 7 and 10. The snowmelt in subbasin 28 with a higher elevation starts in March and continues until May. The snow in subbasin 30 starts melting in April and reaches a maximum in May, where most of the floods are recorded in the Balkhab River. On the other hand, the snow cover area (%) is showing its highest values in the December, January, and February during the winter season. The reduction in the snow cover area (%) follows the snowmelt fluctuation during the year.

6. Conclusions

In the current study, the SWAT model successfully reconstructed the monthly discharges at the four stations along the BRB. The model statistics showed a satisfactory to very good result with respect to the coefficient of determination (R2) and PBIAS, while the evaluation showed an unsatisfactory to very good result based on the NSE value. The hydrologic regime in mountains with arid and semiarid climates can change seasonally, and BRB surface runoff is dominated by three different sources of water during the year. The hydrological regime is dominated by an increase in precipitation in the late autumn and winter seasons. The surface runoff during the spring and early summer seasons is strongly affected by snowmelt. During May especially, a spring peak will appear due to rapid snowmelt in addition to the contribution of rainfall to the snow melting process. In late summer and early autumn, the river discharge is dominated by groundwater flow through the springs where the water infiltrates upstream and joins the river in the flat lands downstream. In such cases, SWAT is highly capable of capturing hydrological processes that vary temporarily and spatially. However, SWAT model calibration is challenging in mountainous catchments with low annual precipitation. In mountainous catchments, the conditions can change spatially and temporarily, and calibration for accurate parameters is necessary to apply the model, which can represent the actual site conditions.
Hydrologic models are valuable for water resource management and water-related practices in Afghanistan and other data-scarce countries. The results of this study can be useful in decision-making processes for short- and long-term water resource planning and management in the BRB. Studies can expand further to investigate the effects and the role of irrigation practices under different scenarios, not only in the BRB, but also in Afghanistan.

Author Contributions

Conceptualization, method development, investigation, resources, writing, and visualization: W.H. and H.S.L.; supervision: H.S.L. All authors have read and agreed to the published version of the manuscript.

Funding

This research is partly supported by a Grant-in-Aid for Scientific Research (17K06577) from JSPS, Japan.

Institutional Review Board Statement

Not applicable.

Informed Consent Statement

Not applicable.

Data Availability Statement

The data presented in this study are available on request from the corresponding author.

Acknowledgments

The first author is supported by the Project for the Promotion and Enhancement of the Afghan Capacity for Effective Development (PEACE), JICA, Japan.

Conflicts of Interest

The authors declare no conflict of interest.

Appendix A

Figure A1. Time series of temperature, precipitation and discharge from gauging stations and snow cover area (%) based on the spatiotemporal combination of MODIS snow cover and NASA-PWER solar radiation and wind speed. (a) Rabat-i-Bala, (b) Pul-i-Baraq, (c) Delmarogh, (d) Doshqadam, and (e) Nazdik-i-Nayak stations.
Hydrology 08 00016 g0a1

References

  1. United Nation Water Scarcity. Available online: https://www.unwater.org/water-facts/scarcity/ (accessed on 10 December 2020).
  2. Mekonnen, M.M.; Hoekstra, A.Y. Sustainability: Four billion people facing severe water scarcity. Sci. Adv. 2016, 2, 1–7. [Google Scholar] [CrossRef] [PubMed] [Green Version]
  3. Porkka, M.; Kummu, M.; Siebert, S.; Flörke, M. The role of virtual water flows in physical water scarcity: The case of Central Asia. Int. J. Water Resour. Dev. 2012, 28, 453–474. [Google Scholar] [CrossRef]
  4. Li, Z.; Chen, Y.; Fang, G.; Li, Y. Multivariate assessment and attribution of droughts in Central Asia. Sci. Rep. 2017, 7, 1–12. [Google Scholar] [CrossRef] [PubMed]
  5. Ta, Z.; Yu, R.; Chen, X.; Mu, G.; Guo, Y. Analysis of the spatio-temporal patterns of dry and wet conditions in Central Asia. Atmosphere 2018, 9, 7. [Google Scholar] [CrossRef] [Green Version]
  6. Zoljoodi, M.; Didevarasl, A. Evaluation of spatial-temporal variability of drought events in Iran using palmer drought severity index and its principal factors (through 1951–2005). Atmos. Clim. Sci. 2013, 3, 193–207. [Google Scholar] [CrossRef] [Green Version]
  7. Qutbudin, I.; Shiru, M.S.; Sharafati, A.; Ahmed, K.; Al-Ansari, N.; Yaseen, Z.M.; Shahid, S.; Wang, X. Seasonal drought pattern changes due to climate variability: Case study in Afghanistan. Water 2019, 11, 1096. [Google Scholar] [CrossRef] [Green Version]
  8. Sediqi, M.N.; Shiru, M.S.; Nashwan, M.S.; Ali, R.; Abubaker, S.; Wang, X.; Ahmed, K.; Shahid, S.; Asaduzzaman, M.; Manawi, S.M.A. Spatio-temporal pattern in the changes in availability and sustainability ofwater resources in Afghanistan. Sustainability 2019, 11, 5836. [Google Scholar] [CrossRef] [Green Version]
  9. Mahmoodi, S. Integrated water resources management for rural development and environmental protection in Afghanistan. J. Dev. Sustain. Agric. 2008, 3, 9–19. [Google Scholar] [CrossRef]
  10. Mahmoodzada, A.B.; Varade, D.; Shimada, S. Estimation of snow depth in the Hindu Kush Himalayas of Afghanistan during peak winter and early melt season. Remote Sens. 2020, 12, 2788. [Google Scholar] [CrossRef]
  11. National Statistics and Information Authority. Afghanistan Statistical Yearbook; NSIA: Kabul, Afghanistan, 2019. [Google Scholar]
  12. MAIL (Ministry of Agriculture, Irrigation and Livestock). Atlas Part III Description of River Basins; MAIL: Kabul, Afghanistan, 2004. [Google Scholar]
  13. Alim, A.K. Sustainability of water resources in Afghanistan. J. Dev. Sustain. Agric. 2006, 1, 53–66. [Google Scholar] [CrossRef]
  14. Wheater, H.; Sorooshian, S.; Sharma, K.D. Hydrological Modelling in Arid and Semi-Arid Areas; Cambridge University Press: Cambridge, UK, 2007; ISBN 1139468081. [Google Scholar]
  15. Devia, G.K.; Ganasri, B.P.; Dwarakish, G.S. A review on hydrological models. Aquat. Procedia 2015, 4, 1001–1007. [Google Scholar] [CrossRef]
  16. Arnold, J.G.; Srinivasan, R.; Muttiah, R.S.; Williams, J.R. Large area hydrologic modeling and assessment part I: Model development’ basin scale model called SWAT (Soil and Water speed and storage, advanced software debugging policy to meet the needs, and the management to the tank model Sugawara et al., 1.). JAWRA J. Am. Water Resour. Assoc. 1998, 34, 73–89. [Google Scholar] [CrossRef]
  17. Guiamel, I.A.; Lee, H.S. Potential hydropower estimation for the Mindanao River Basin in the Philippines based on watershed modelling using the soil and water assessment tool. Energy Rep. 2020, 6, 1010–1028. [Google Scholar] [CrossRef]
  18. Shrestha, A.; Sharma, S.; McLean, C.E.; Kelly, B.A.; Martin, S.C. Scenario analysis for assessing the impact of hydraulic fracturing on stream low flows using the SWAT model. Hydrol. Sci. J. 2017, 62, 849–861. [Google Scholar] [CrossRef]
  19. Maghsood, F.F.; Moradi, H.; Bavani, A.R.M.; Panahi, M.; Berndtsson, R.; Hashemi, H. Climate change impact on flood frequency and source area in northern Iran under CMIP5 scenarios. Water 2019, 11, 273. [Google Scholar] [CrossRef] [Green Version]
  20. Xie, X.; Cui, Y. Development and test of SWAT for modeling hydrological processes in irrigation districts with paddy rice. J. Hydrol. 2011, 396, 61–71. [Google Scholar] [CrossRef]
  21. Aawar, T.; Khare, D. Assessment of climate change impacts on streamflow through hydrological model using SWAT model: A case study of Afghanistan. Modeling Earth Syst. Environ. 2020, 6, 1427–1437. [Google Scholar] [CrossRef]
  22. Hajihosseini, H.; Hajihosseini, M.; Morid, S.; Delavar, M.; Booij, M.J. Hydrological assessment of the 1973 treaty on the transboundary Helmand river, using the SWAT model and a global climate database. Water Resour. Manag. 2016, 30, 4681–4694. [Google Scholar] [CrossRef]
  23. Sadiqi, S.S. Application of SWAT to estimate runoff and sediment yield of Salma Dam watershed in Afghanistan. J. Korean Soc. Agric. Eng. 2019, 2019, 26. [Google Scholar]
  24. Rasouli, H.; Kayastha, R.B.; Bhattarai, B.C.; Shrestha, A.; Arian, H.; Armstrong, R. Estimation of discharge from upper Kabul river basin, Afghanistan using the snowmelt runoff model. J. Hydrol. Meteorol. 2016, 9, 85–94. [Google Scholar] [CrossRef] [Green Version]
  25. Arian, H.; Kayastha, R.B.; Bhattarai, B.C.; Shresta, A.; Rasouli, H.; Armstrong, R. Application of the snowmelt runoff model in the Salang river basin, Afghanistan using MODIS satellite data. J. Hydrol. Meteorol. 2015, 9, 109–118. [Google Scholar] [CrossRef]
  26. Habib, H. Water related problems in Afghanistan. Int. J. Educ. Stud. 2014, 1, 137–144. [Google Scholar]
  27. Frotan, M.S.; Nakaza, E.; Schaab, C.; Motoyashiki, R. Surface water resources of Afghanistan’s northern river basin and effects of climate change. J. Jpn. Soc. Civ. Eng. 2020, 8, 118–126. [Google Scholar] [CrossRef]
  28. Logan, T.A.; Nicoll, J.; Laurencelle, J.; Hogenson, K.; Gens, R.; Buechler, B.; Barton, B.; Shreve, W.; Stern, T.; Drew, L. Radiometrically terrain corrected ALOS PALSAR Data available from the Alaska Satellite Facility. AGUFM 2014, 2014, IN33B-3762. [Google Scholar]
  29. Food and Agriculture Organization of the United Nations. The Islamic Republic of Afghanistan Land Cover Atlas; FAO: Rome, Italy, 2016. [Google Scholar]
  30. Abbaspour, K.C.; Vaghefi, S.A.; Yang, H.; Srinivasan, R. Global soil, landuse, evapotranspiration, historical and future weather databases for SWAT Applications. Sci. Data 2019, 6, 263. [Google Scholar] [CrossRef] [Green Version]
  31. Hussainzada, W.; Lee, H.S.; Vinayak, B. Snow cover mapping for sustainable water resource management in the Balkhab river basin in Afghanistan using Modis sattellite normalized difference snow index (Ndsi). In Proceedings of the 22nd IAHR-APD Congress 2020, Sapporo, Japan, 15–16 September 2020; Volume 2010, pp. 1–7. [Google Scholar]
  32. Northern River Basin Authority. مدیریت آب حوزه دریایی شمال (Water Management of the Northern River Basins); NRB: Mazar-i-Sharif, Afghanistan, 2019. [Google Scholar]
  33. Grusson, Y.; Sun, X.; Gascoin, S.; Sauvage, S.; Raghavan, S.; Anctil, F.; Sáchez-Pérez, J.M. Assessing the capability of the SWAT model to simulate snow, snow melt and streamflow dynamics over an alpine watershed. J. Hydrol. 2015, 531, 574–588. [Google Scholar] [CrossRef]
  34. Duan, Y.; Liu, T.; Meng, F.; Luo, M.; Frankl, A.; de Maeyer, P.; Bao, A.; Kurban, A.; Feng, X. Inclusion of modified snow melting and flood processes in the SWAT model. Water 2018, 10, 1715. [Google Scholar] [CrossRef] [Green Version]
  35. Rostamian, R.; Jaleh, A.; Afyuni, M.; Mousavi, S.F.; Heidarpour, M.; Jalalian, A.; Abbaspour, K.C. Application of a SWAT model for estimating runoff and sediment in two mountainous basins in central Iran. Hydrol. Sci. J. 2008, 53, 977–988. [Google Scholar] [CrossRef]
  36. Li, Z.; Yang, Y.; Kan, G.; Hong, Y. Study on the applicability of the Hargreaves potential evapotranspiration estimation method in CREST distributed hydrological model (version 3.0) applications. Water 2018, 10, 1882. [Google Scholar] [CrossRef] [Green Version]
  37. Mengistu, A.G.; van Rensburg, L.D.; Woyessa, Y.E. Techniques for calibration and validation of SWAT model in data scarce arid and semi-arid catchments in South Africa. J. Hydrol. Reg. Stud. 2019, 25, 100621. [Google Scholar] [CrossRef]
  38. Abbaspour, K.C. User Manual for SWAT-CUP, SWAT Calibration and Uncertainty Analysis Programs; Swiss Federal Institute of Aquatic Science and Technology Eawag: Duebendorf, Switzerland, 2007; Volume 93. [Google Scholar]
  39. Homan, J.W.; Luce, C.H.; McNamara, J.P.; Glenn, N.F. Improvement of distributed snowmelt energy balance modeling with MODIS-based NDSI-derived fractional snow-covered area data. Hydrol. Process. 2011, 25, 650–660. [Google Scholar] [CrossRef]
  40. Abbaspour, K.C.; Vaghefi, S.A.; Srinivasan, R. A guideline for successful calibration and uncertainty analysis for soil and water assessment: A review of papers from the 2016 international SWAT conference. Water 2017, 10, 6. [Google Scholar] [CrossRef] [Green Version]
  41. Nash, J.E.; Sutcliffe, J.V. River flow forecasting through conceptual models part I—A discussion of principles. J. Hydrol. 1970, 10, 282–290. [Google Scholar] [CrossRef]
  42. Narsimlu, B.; Gosain, A.K.; Chahar, B.R.; Singh, S.K.; Srivastava, P.K. SWAT model calibration and uncertainty analysis for streamflow prediction in the Kunwari river basin, India, using sequential uncertainty fitting. Environ. Process. 2015, 2, 79–95. [Google Scholar] [CrossRef]
  43. Gupta, H.V.; Sorooshian, S.; Yapo, P.O. Status of automatic calibration for hydrologic models: Comparison with multilevel expert calibration. J. Hydrol. Eng. 1999, 4, 135–143. [Google Scholar] [CrossRef]
  44. Aqnouy, M.; El Messari, J.E.S.; Ismail, H.; Bouadila, A.; Navarro, J.G.M.; Loubna, B.; Mansour, M.R.A. Assessment of the SWAT model and the parameters affecting the flow simulation in the watershed of Oued Laou (Northern Morocco). J. Ecol. Eng. 2019, 20, 104–113. [Google Scholar] [CrossRef]
  45. Guiamel, I.A.; Lee, H.S. Watershed modelling of the Mindanao river basin in the Philippines using the SWAT for water resource management. Civ. Eng. J. 2020, 6, 626–648. [Google Scholar] [CrossRef] [Green Version]
  46. Moriasi, D.N.; Gitau, M.W.; Pai, N.; Daggupati, P. Hydrologic and water quality models: Performance measures and evaluation criteria. Trans. ASABE 2015, 58, 1763–1785. [Google Scholar]
  47. Foster, S.B.; Allen, D.M. Groundwater—Surface water interactions in a mountain-to-coast watershed: Effects of climate change and human stressors. Adv. Meteorol. 2015, 2015. [Google Scholar] [CrossRef] [Green Version]
  48. Welch, L.A.; Allen, D.M. Consistency of groundwater flow patterns in mountainous topography: Implications for valley bottom water replenishment and for defining groundwater flow boundaries. Water Resour. Res. 2012, 48, 1–17. [Google Scholar] [CrossRef] [Green Version]
  49. Evans, S.G.; Ge, S.; Liang, S. Analysis of groundwater flow in mountainous, headwater catchments with permafrost. Water Resour. Res. 2015, 51, 9564–9576. [Google Scholar] [CrossRef]
  50. Yang, J.; Reichert, P.; Abbaspour, K.C.; Xia, J.; Yang, H. Comparing uncertainty analysis techniques for a SWAT application to the Chaohe basin in China. J. Hydrol. 2008, 358, 1–23. [Google Scholar] [CrossRef]
  51. Luo, Y.; Arnold, J.; Allen, P.; Chen, X. Baseflow simulation using SWAT model in an inland river basin in Tianshan Mountains, Northwest China. Hydrol. Earth Syst. Sci. 2012, 16, 1259–1267. [Google Scholar] [CrossRef] [Green Version]
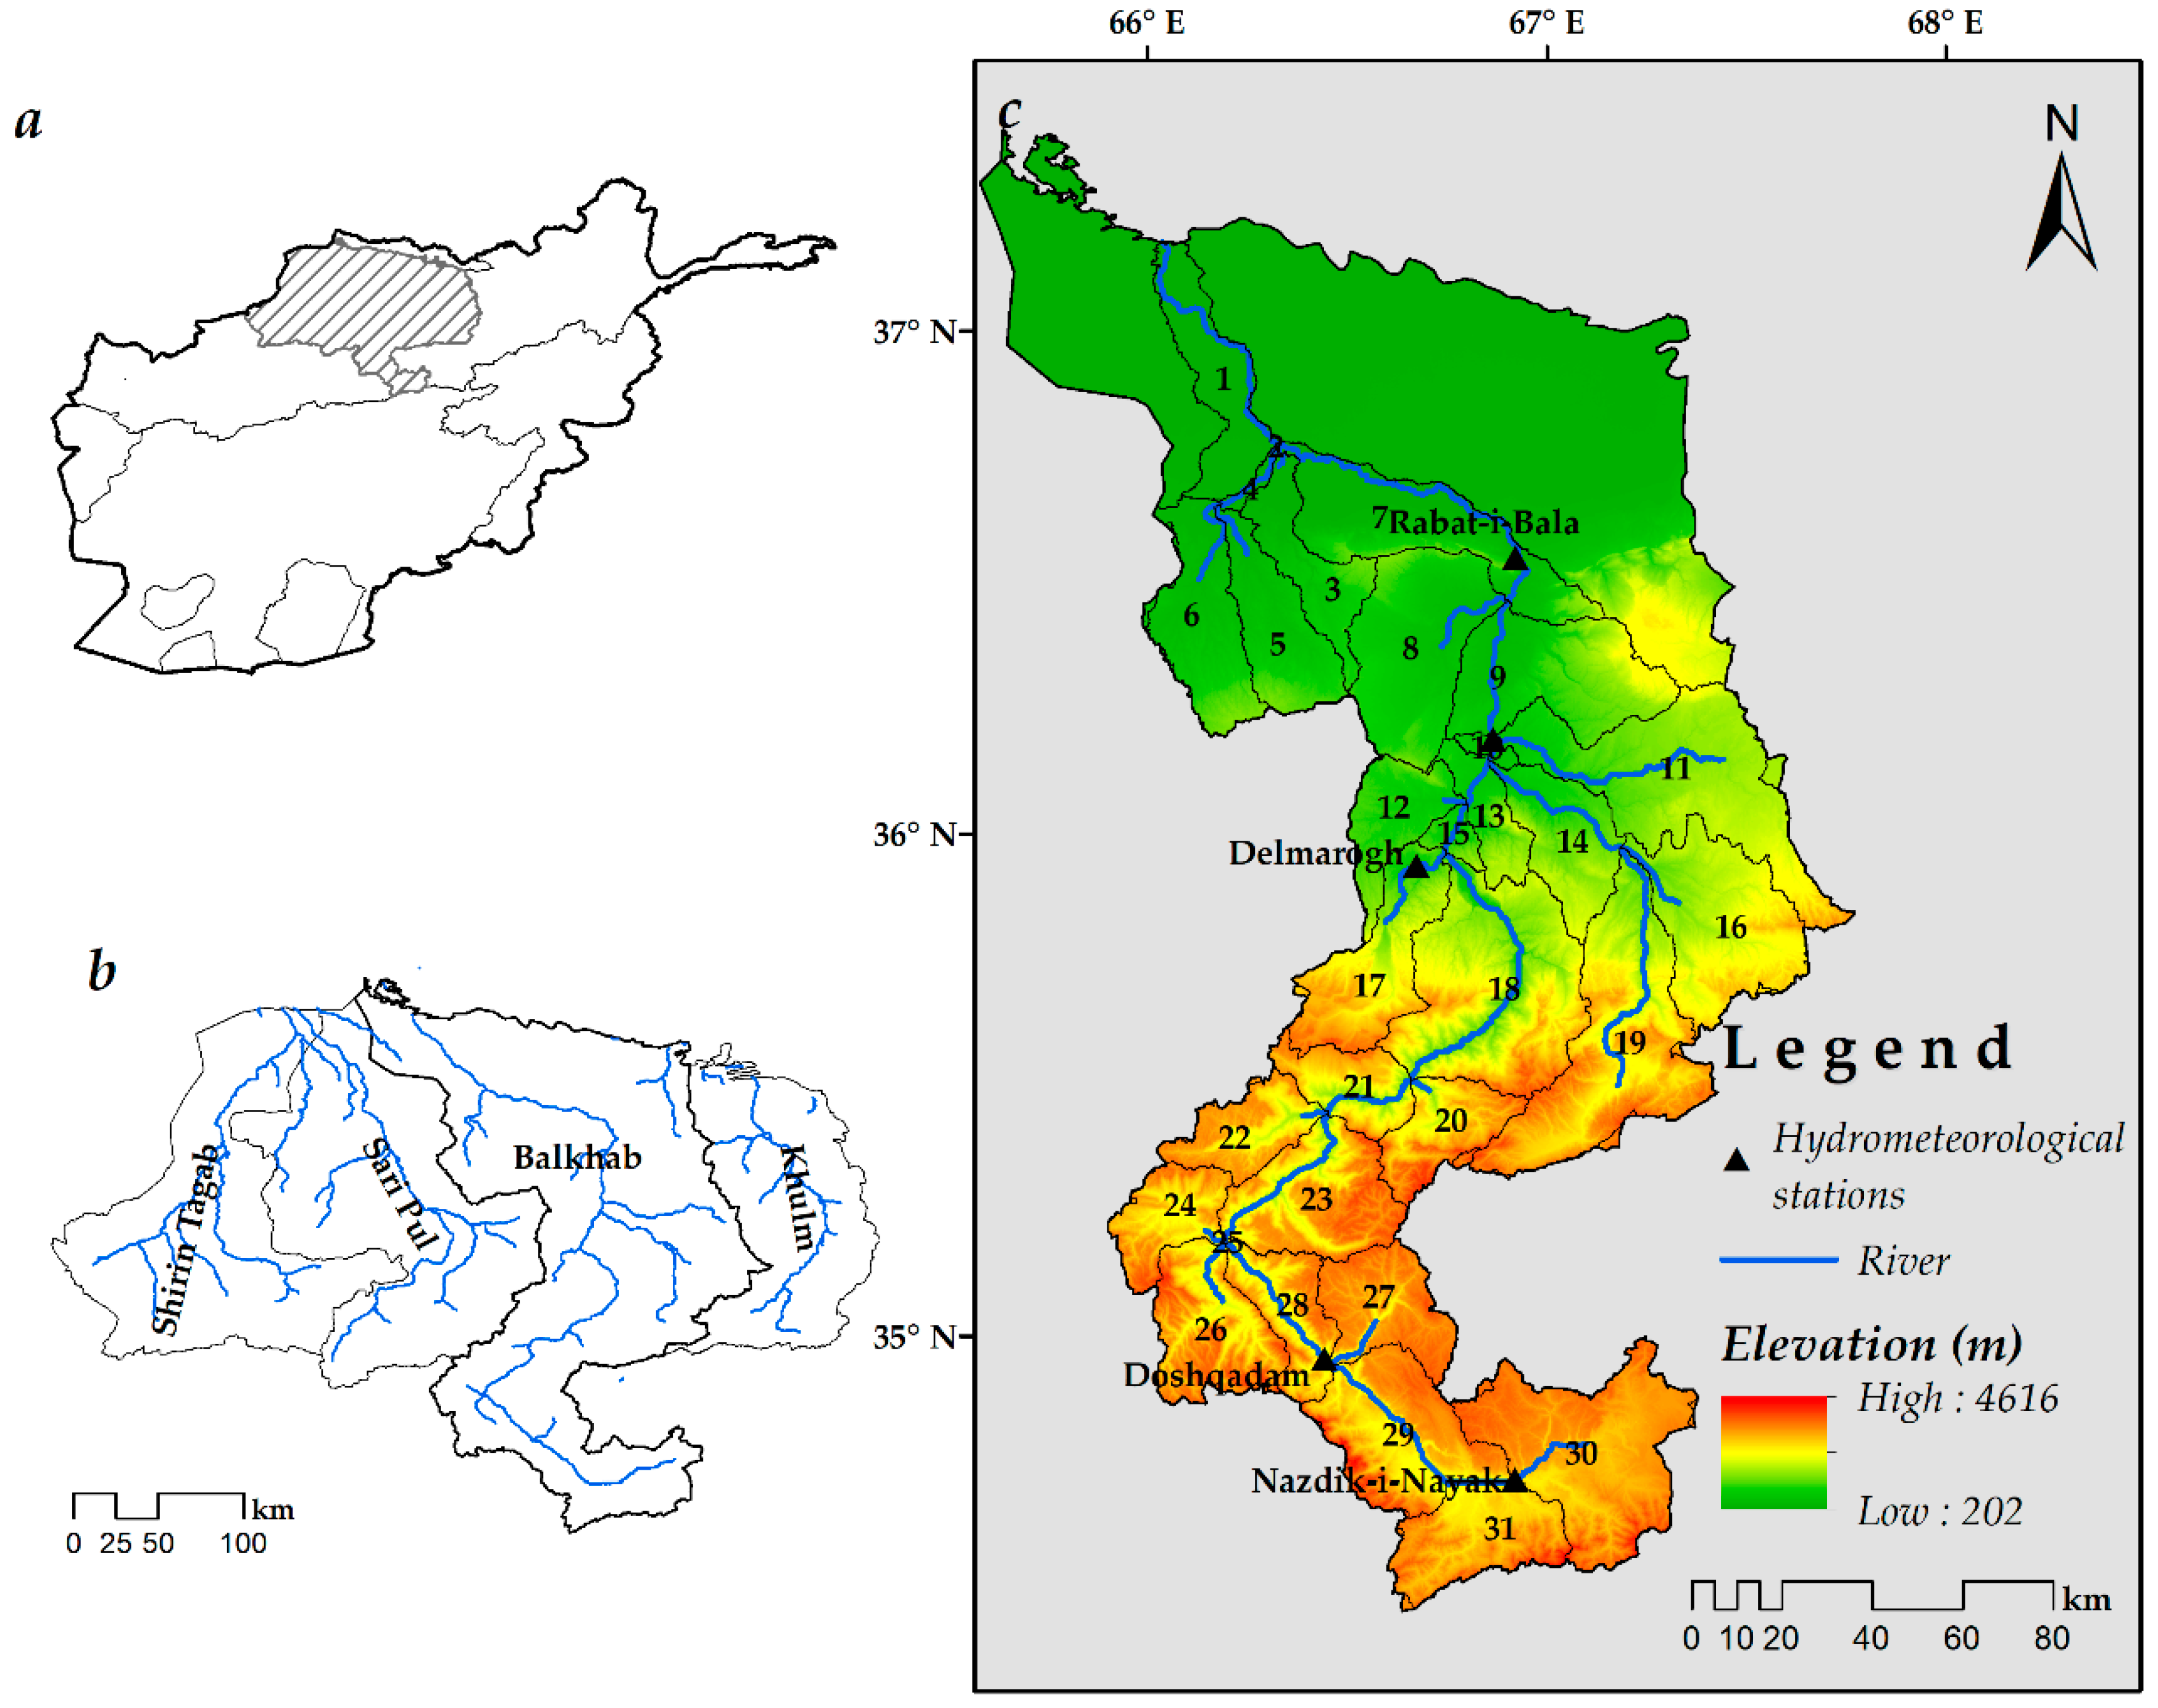
Figure 1. Study area map of the northern river basin, Afghanistan: (a) Afghanistan map and its division into 5 major basins; (b) Northern river basin with four subbasins: Khulm, Balkhab, Sari Pul, and Shirin Tagab; (c) Balkhab river basin, elevation map, and subbasins divisions.
Hydrology 08 00016 g001
Figure 2. The input for the HRU definition. (a) Land cover map of the BRB, (b) the soil-type map from the FAO/UNESCO soil map of the world, (c) the slope map of the BRB created from the DEM.
Hydrology 08 00016 g002
Figure 3. Historical monthly recorded discharge and precipitation in the BRB for hydrometeorological stations Rabat-i-Bala (R-i-B0, Pul-i-Baraq (P-i-B), Delmarogh (Del), Doshqadam (Dosh), and Nazdik-i-Nayak (N-i-N). The dotted line shows the average discharge. The monthly average snow cover over the BRB from MODIS snow cover product collection 6.
Hydrology 08 00016 g003
Figure 4. The irrigation canal locations along the BRB were based on their geographical locations according to the data provided by the Northern River Basin Authority of the Islamic Republic of Afghanistan. The irrigation canals with green colors are fed by the Balkhab River, whereas the red colours indicate the canals fed by springs or temporary flows.
Hydrology 08 00016 g004
Figure 5. Flowchart for SWAT hydrological modelling in this study.
Hydrology 08 00016 g005
Figure 6. Comparisons between the observed and simulated monthly average discharges with and without groundwater contribution and monthly precipitation in the calibration from 2013 to 2015. (a) subbasin 7, (b) subbasin 10, (c) subbasin 28, and (d) subbasin 30.
Hydrology 08 00016 g006
Figure 7. Comparisons among the observed and simulated monthly average discharges before and after calibration in addition to the 95 PPU uncertainty range from the calibration and monthly precipitation from 2013 to 2015. (a) subbasin 7, (b) subbasin 10, (c) subbasin 28, and (d) subbasin 30.
Hydrology 08 00016 g007
Figure 8. Comparison of the observed monthly average discharges with the simulated discharges for the model validation, in addition to the observed monthly precipitation for the validation period from 2016 to September 2018. (a) subbasin 7, (b) subbasin 10, (c) subbasin 28, and (d) subbasin 30.
Hydrology 08 00016 g008
Figure 9. Summary of statistical analysis of the observed and the simulated monthly discharges at the Rabat-i-Bala (subbasin 7), Pul-i-Baraq (Subbasin 10), Doshqadam (subbasin 28), and Nazdik-i-Nayak (subbasin 30) stations. (a) Nash-Sutcliff efficiency (NSE), (b) coefficient of determination (R2), and (c) percent bias (PBAIS).
Hydrology 08 00016 g009
Figure 10. Comparison of the SWAT snowmelt and MODIS snow cover area over the BRB, (a) snowmelt and snow cover area (%) for 2013, and (b) snowmelt and snow cover area (%) for 2014. The snow cover area (%) data is adopted from the previous study in the BRB [31].
Hydrology 08 00016 g010
Table 1. The recorded average discharge at the stations during the non-rainy months and an estimation of the groundwater contribution based on the difference between records in the non-rainy seasons.
Hydrometeorological StationsSub-BasinsStation Elevation (m)Average Monthly Discharge (m3/s)Ground Water Contribution (m3/s)
Rabat-i-Bala743436.050.39
Pul-i-Baraq1064735.6625.38
Delmarogh171152--
Doshqadam28224111.727.50
Nazdik-i-Nayak3026134.224.22
Table 2. Parameter ranges and fitted values for the model calibration in the SWAT-CUP.
NoParameterDescriptionRangeFitted ValuesMethod
Min.Max.
Elevation band
1TLAPSTemperature lapse rate−8−4−5.26v 1
2PLAPSPrecipitation lapse rate01001.5v
Snowmelt parameters
3SFTMPSnowfall temperature−554.65v
4SMTMPSnow melt base temperature−55−3.55v
5SMFMXMaximum melt rate for snow during the year (occurs on the summer solstice)050.325v
6SMFMNMinimum melt rate for snow during the year (occurs on the winter solstice)050.475v
7TIMPSnowpack temperature lag factor010.645v
8SNOCOVMXMinimum snow water content that corresponds to 100% snow cover045020.25v
9SNO50COVSnow water equivalent that corresponds to 50% snow cover00.850.59925v
Model parameters calibration
10GWQMNThreshold depth of water in the shallow aquifer required for return flow to occur (mm)025001523.75v
11GW_REVAPGroundwater “revap” coefficient00.10.00355v
12GW_DELAYGroundwater delay (days)050027.75v
13SOL_AWC()Available water capacity of the soil layer−0.30−0.12915r 2
14CN2SCS runoff curve number f−0.400.3334r
15ESCOSoil evaporation compensation factor00.50.14375v
16SOL_K()Saturated hydraulic conductivity00.30.14625r
1 v refers to the substitution of a parameter by a value from the given range. 2 r refers to the relative change in the parameter, the current parameter multiplied by 1 plus a value in the given range.
Table 3. General criteria for performance evaluation in a statistical test at the watershed scale [46].
Performance RatingR2NSEPBIAS
Not Satisfactory≤0.50≤0.50≥±25%
Satisfactory0.50–0.700.50–0.65±15–±25
Good0.70–0.800.65–0.75±10–±15
Very good≥0.80≥0.75<±10
Publisher’s Note: MDPI stays neutral with regard to jurisdictional claims in published maps and institutional affiliations.