Article

Integrated Surface Water and Groundwater Analysis under the Effects of Climate Change, Hydraulic Fracturing and its Associated Activities: A Case Study from Northwestern Alberta, Canada

by
Gopal Chandra Saha
1,2,* and
Michael Quinn
2
1
Global Water Futures Program, Wilfrid Laurier University, Waterloo, ON N2L 3C5, Canada
2
Institute for Environmental Sustainability, Mount Royal University, Calgary, AB T3E 6K6, Canada
*
Author to whom correspondence should be addressed.
Hydrology 2020, 7(4), 70; https://doi.org/10.3390/hydrology7040070
Submission received: 27 July 2020 / Revised: 20 September 2020 / Accepted: 21 September 2020 / Published: 23 September 2020
(This article belongs to the Special Issue Integrated Surface Water and Groundwater Analysis)

Abstract

:
This study assessed how hydraulic fracturing (HF) (water withdrawals from nearby river water source) and its associated activities (construction of well pads) would affect surface water and groundwater in 2021–2036 under changing climate (RCP4.5 and RCP8.5 scenarios of the CanESM2) in a shale gas and oil play area (23,984.9 km2) of northwestern Alberta, Canada. An integrated hydrologic model (MIKE-SHE and MIKE-11 models), and a cumulative effects landscape simulator (ALCES) were used for this assessment. The simulation results show an increase in stream flow and groundwater discharge in 2021–2036 under both RCP4.5 and RCP8.5 scenarios with respect to those under the base modeling period (2000–2012). This occurs because of the increased precipitation and temperature predicted in the study area under both RCP4.5 and RCP8.5 scenarios. The results found that HF has very small (less than 1%) subtractive impacts on stream flow in 2021–2036 because of the large size of the study area, although groundwater discharge would increase minimally (less than 1%) due to the increase in the gradient between groundwater and surface water systems. The simulation results also found that the construction of well pads related to HF have very small (less than 1%) additive impacts on stream flow and groundwater discharge due to the non-significant changes in land use. The obtained results from this study provide valuable information for effective long-term water resources decision making in terms of seasonal and annual water extractions from the river, and allocation of water to the oil and gas industries for HF in the study area to meet future energy demand considering future climate change.

1. Introduction

Surface water and groundwater are essential resources for the survival of human beings, livestock, wildlife, terrestrial and aquatic ecosystems. They are extensively used in agricultural, industrial, oil and gas exploration, household and recreation activities. Surface water and groundwater are closely connected components of the hydrologic system. Because of their close connectivity, the use of any one component can affect the other. As a result, it is necessary to conduct integrated surface water and groundwater analysis for developing sustainable water resources management. However, surface water (e.g., rivers, streams, lakes, wetlands, estuaries) and groundwater are extremely vulnerable to climate change [1]. The Intergovernmental Panel on Climate Change (IPCC) reported that the projection of global atmospheric concentrations of greenhouse gases (GHG) will continue to increase in the following decades, which will result in increased temperature and lead to continuing climate change [2]. Therefore, climate change might have significant effects on the temporal pattern of annual temperature as well as precipitation at the regional level, which in turn will affect the regional water resources (i.e., surface water and groundwater) and future water availability.
The extraction of oil and gas using hydraulic fracturing (HF) from vast shale reserves often requires large volumes of water from nearby water sources to be used as a fracturing fluid. The volume of water used by the oil and gas industries varies depending on geologic formations, type of well, number of hydraulic fracturing stages, length of the reach within the production zone and the type of hydraulic fracturing fluid (i.e., cross-linked gel or slick water) [3]. For example, in northeast British Columbia of the Western Canadian Sedimentary Basin, the water volume varies widely from less than 1000 m3 to more than 70,000 m3 per well [4]. In addition to water withdrawals, associated activities (i.e., construction of roads, well pads, pipelines, seismic lines, and power transmission lines) related to HF, change the natural soil lithology significantly by altering the upper soil layers. The alteration of soil layers results in different soil infiltration rates, which in turn affects groundwater recharge and discharge, surface runoff and stream flow significantly [5,6]. The use of HF has increased significantly in North America, and forecasts show continued growth and application of HF across the world [7]. For example, in the United States, natural gas production from shale resources increased from 0.1 to 3 Tcf (Trillion cubic feet) in the last decade [8]. By 2050, shale gas production is expected to account for 91% of the United States natural gas production [9]. The number of wells in North America that used HF for extracting oil and gas from shale reserves has changed over time to meet energy demand. For example, in the United States, about 278,000 wells were completed using HF from 2000 to 2010 [10]. However, there is considerable public concern regarding the sustainability of water withdrawals from nearby water sources for HF due to the potential negative impact on water resources (i.e., surface water and groundwater) especially during low flow period [11], as well as environmental (e.g., spills) [12] and health [13] related issues. Therefore, it is necessary to forecast climate change effects on water resources for developing future water resources management plan at regional level, so that HF and its associated activities meet future energy demand without causing significant negative effects to surface water and groundwater.
Due to the significance of water resources, the quantification of the effects of water withdrawal for HF on water resources has received increasing attention from a research point of view during the last 6 years. Although there are missing information (i.e., location of water withdrawal, type of water source, timing of water withdrawals, and whether any water was recycled), various assumptions were made related to these missing information for assessing the effects of water withdrawal for HF on water resources. Those research activities addressed daily stream flow [14,15,16], monthly stream flow [16,17], annual stream flow [18,19], stream low flow [20,21,22], environmental flow components (i.e., high flow, low flow and extremely low flow) of the stream [18,23], annual surface water and groundwater availability [24], and annual groundwater table [19,22]. In addition to water withdrawals, very few research activities have been conducted on associated activities related to HF on water resources. Those research activities highlighted annual stream flow [18,19], and annual groundwater table [19]. However, there is little knowledge regarding how HF and its associated activities would affect temporal patterns (i.e., monthly, seasonal and annual) of groundwater discharge under changing climate. This study attempted to fill up this gap.
The objective of this study was to quantify the effects of HF (i.e., water withdrawals from nearby river water source) and its associated activities on temporal patterns of stream flow and groundwater discharge under changing climate. The assessment of temporal variation of stream flow and groundwater discharge due to HF and its associated activities under changing climate will provide useful information for future planning of water uses to meet the industry’s water demand, and the natural hydrologic system. In this study, the effects of HF and its associated activities on mean monthly, seasonal and annual stream flow and groundwater discharge were evaluated for 2021–2036 under the Representative Concentration Pathways (RCP) 4.5 and 8.5 of the CanESM2 (Second Generation Earth System Model) from the Fifth Assessment Report (AR5) of the IPCC [25]. An Integrated Hydrologic Model (i.e., MIKE-SHE and MIKE-11 models [26]), and a cumulative effects landscape simulator (i.e., ALCES: A Landscape Cumulative Effects Simulator [27]) were used for the evaluation. A case study was used in a shale gas and oil play area of northwestern Alberta, Canada. Here, we define water withdrawal as the amount of water extracted from the river in a particular month to be used in HF.

2. Materials and Methods

2.1. Study Area

A study area (23,984.9 km2) was selected in a rich shale gas and oil region of the Upper Peace Region of northwestern Alberta, Canada based on data availability for a significant number of hydraulically fractured wells, coupled with a number of active surface water monitoring stations and groundwater monitoring wells (Figure 1). It contains parts of the Montney, the Duvernay and the Muskwa formations. Among those, the Montney and the Duvernay are the most productive shale gas and oil reserves in Alberta. Forest (34.4%) and agriculture (34.1%) dominate land use in the study area. Other land uses are perineal crops (forage) and pasture (18.2%), water (i.e., river, lake, and wetland) (6.7%), grassland (4.9%), shrub land (1.2%), road (0.4%) and clear cut area (0.1%), based on the land use/land cover map of the study area for year 2000 collected from Natural Resources Canada (www.nrcan.gc.ca). Surface water is mostly used to meet forestry and agriculture needs [28]. Clay loam, loam, silty loam, silty clay, paved area and sand cover 31.74%, 29.2%, 24.46%, 14.1%, 0.45% and 0.05% of the study area, respectively, based on the soil map of the study area collected from Alberta Environment and Parks (https://soil.agric.gov.ab.ca/agrasidviewer/).
The study area has an elevation ranging from 302 m to 1024 m, with an average slope of 2.1%. The hydrologic system in the study area is mainly rainfall dominated. The mean annual precipitation and temperature of the study area were 423 mm (312 mm of rain, and 111 mm of snow), and 1.9 °C, respectively, for the period of 1985–2014. The study area contains parts of three rivers: the Peace River, the Smoky River and the Little Smoky River. The Little Smoky River joins with the Smoky River, and then the Smoky River joins with the Peace River. There are three surface water monitoring stations in the study area maintained by Water Survey of Canada (https://wateroffice.ec.gc.ca/). One station is located in the Smoky River named as Smoky River at Watino (here it is named as SW3 for convenient results discussion). The others named as Peace River above Smoky River confluence (SW2) and Peace River at Peace River city (SW1) are situated in the Peace River. The SW1 station is the outlet of the study area. The SW1 and SW2 stations are approximately 76 and 54 km away from the SW3 station, respectively. The upstream parts of the Peace River, the Smoky River, and the Little Smoky River (which are outside of the study area) contributed 88%, 8.1% and 2.3% of the stream flow at the outlet (SW1) of the study area, respectively, based on the observed data at the monitoring stations of those areas in 2000–2012. There are 1235 active and inactive monitoring wells in the study area based on the information of Alberta provincial groundwater monitoring wells database (http://environment.alberta.ca/apps/GOWN/). In Figure 1a, only four groundwater wells (i.e., GW1 and GW2 are situated in lower elevation areas; GW3 and GW4 are located in higher elevation areas) are shown, which were used in the results and discussions section.

2.2. Integrated Hydrological Modeling

An integrated hydrological model was developed for the study area by using MIKE-SHE and MIKE-11 models. MIKE-SHE is a physically-based, distributed, and structured grid based hydrologic model. It simulates various hydrological processes for example, snowfall accumulation and melting, evapotranspiration, unsaturated flow, saturated groundwater flow, overland flow and infiltration in a watershed under given hydrometeorological inputs. In this study, snow melting was estimated by using the modified degree-day method [29]. Overland flow was computed by using the finite difference method by solving the diffusive wave approximation of the Saint Venant Equations [30]. Saturated groundwater flow was simulated with a finite difference representation of 3-D saturated groundwater flow equation. The saturated zone was divided into two layers: unconfined aquifer and bedrock (underlain by unconfined aquifer). Unsaturated flow was simulated by using the two-layer water balance method [31] because of the lack of detailed soil characteristics and geological layer data. On the other hand, MIKE-11 is a 1-D hydrodynamic model, and computes channel flow by using 1-D Saint Venant equations. In this study, channel flow was calculated by using the implicit finite difference scheme [32] to solve the dynamic wave version of the Saint Venant equations [33]. Then, the MIKE-11 model was coupled with the MIKE-SHE model to simulate stream flow as well stream water level along the channels, and groundwater level in the aquifer under given hydrometeorological inputs. Water flux between the stream and the saturated zone was estimated based on Darcy’s law. The details of MIKE-SHE and MIKE-11 models can be found in MIKE-SHE user manual [30] and MIKE-11 reference manual [33], respectively. The coupled MIKE-SHE/MIKE-11 model needs a number of inputs. These are watershed specific data (i.e., elevation, land use/land cover, channel geometry, and soil type), vegetation characteristic (i.e., rooting depth and leaf area index) data, climatic (i.e., precipitation, temperature and reference evapotranspiration) data, and hydrological (i.e., stream flow and level, and groundwater level) data. Table 1 provides the details of these data for this study.
The MIKE-SHE model domain was discretized into 284 m by 284 m grid cells. The initial potential head (i.e., groundwater table) maps in the aquifer (unconfined) and bedrock were prepared by using observed groundwater table data collected from 1235 active and inactive monitoring wells in the study area from Alberta provincial groundwater monitoring wells database (http://environment.alberta.ca/apps/GOWN/) and inverse distance weighted (IDW) interpolation method [34]. Aquifer and bedrock lower level maps were prepared by using bore log data of those wells in the study area and IDW interpolation method.
No-flow boundary condition was assumed around the perimeter of the study area for the developed MIKE-SHE model for model simplicity, and due to the lack of adequate information in the study area for setting appropriate boundary conditions (e.g., general head or specified head). Similarly, for MIKE-11 model, no-flow boundary condition was assumed for all unconnected ends (branches) of the river network except the Peace River, the Smoky River, and the Little Smoky River. Since the upstream parts of these large rivers (which are outside of the study area) contributed 98.4% of the flow at the outlet of the study area based on the observed stream flow data in 2000–2012, inflow boundary condition was chosen at the upstream parts of these three rivers. Water level boundary was selected at the downstream (the Peace River) of the model based on the relationship of stream flow vs. water level at the downstream location. A sensitivity analysis of the modeling parameters was performed before calibration to determine which parameters are sensitive to the model outputs (stream flow, river water and groundwater levels). The shuffled complex evolution method [38] was used for automated model calibration. The coupled model was calibrated and validated by using observed climate data (i.e., precipitation, temperature and reference evapotranspiration) at monitoring weather stations, and stream flow and stream water levels at three monitoring stations (SW1, SW2, and SW3), and groundwater levels at monitoring wells (only GW1 well is shown here). The coefficient of determination (R2), and coefficient of efficiency (NSE: Nash-Sutcliffe efficiency) were used for evaluation of the goodness-of-fit of this integrated hydrologic model. The model calibration was conducted from 1 January 2000 to 31 December 2006, and the validation was conducted from 1 January 2007 to 31 December 2012. The average inflow (98.4% of the flow at the outlet of the study area) of the 2000–2012 period was used in numerical simulation for future climate change, HF and its associated activities impacts on water resources in this study due to the lack of future stream flow data at those upstream parts of those rivers.

2.3. Climate Scenarios

Statistically downscaled daily temperature and precipitation for the period of 2021–2036 under the RCP4.5 and RCP8.5 scenarios from the AR5 of the IPCC were directly obtained from the Pacific Climate Impacts Consortium (PCIC) data portal [39]. Those RCP4.5 and RCP8.5 outputs were generated by using the Second Generation Earth System Model (CanESM2) outputs of the CCCma (Canadian Centre for Climate Modeling and Analysis), and Bias Correction/Constructed Analogues with Quantile mapping reordering (BCCAQv2) method. The CanESM2 was used in this study area because the CanESM2 historical simulations on precipitation and temperature in 2000–2012 mimic well with the corresponding historical observations of precipitation and temperature, respectively. The RCP4.5 and RCP8.5 outputs are of roughly 10 km grid resolution. In RCP4.5, GHG emissions peak around 2040 and then decline [40]. The RCP4.5 scenario was chosen here because it is the pathway of stabilized GHG emission, whereas, in RCP8.5 GHG, emissions rise continuously over time [41]. The RCP8.5 scenario was chosen because it is a high-emission scenario, which is frequently referred to as “business as usual”. This scenario will likely occur if the society does not make any efforts to cut GHG emissions. Future climate change scenarios assessed for two decades were used in a number of climate change impacts studies on water resources [42,43,44]. However, in order to be consistent with the forecast of future number of hydraulically fractured wells in Alberta until 2036, in the study conducted by Johnson et al. [45], the period of 2021–2036 (less than two decades) was used in this study.

2.4. Generation of Future HF Scenarios

HF data (i.e., number of wells and water use) for 2-year (2013–2014) were collected from the publicly available Frac Focus Chemical Disclosure Registry (www.fracfocus.ca). In Alberta, fracking data are publicly available according to the requirements of the Alberta provincial regulator since 19 December 2012 [46]. These data were collected for this study because HF activities occurred during this period when oil and gas prices were relatively high (e.g., oil at USD$100/barrel in 2013–2014) [47]. It represents the traditional HF scenario in Alberta, when oil price is good from a business point of view. The annual number of hydraulically fractured wells in 2013 and 2014 was 186 and 247, respectively. The monthly variation of those wells is presented in Table 2.
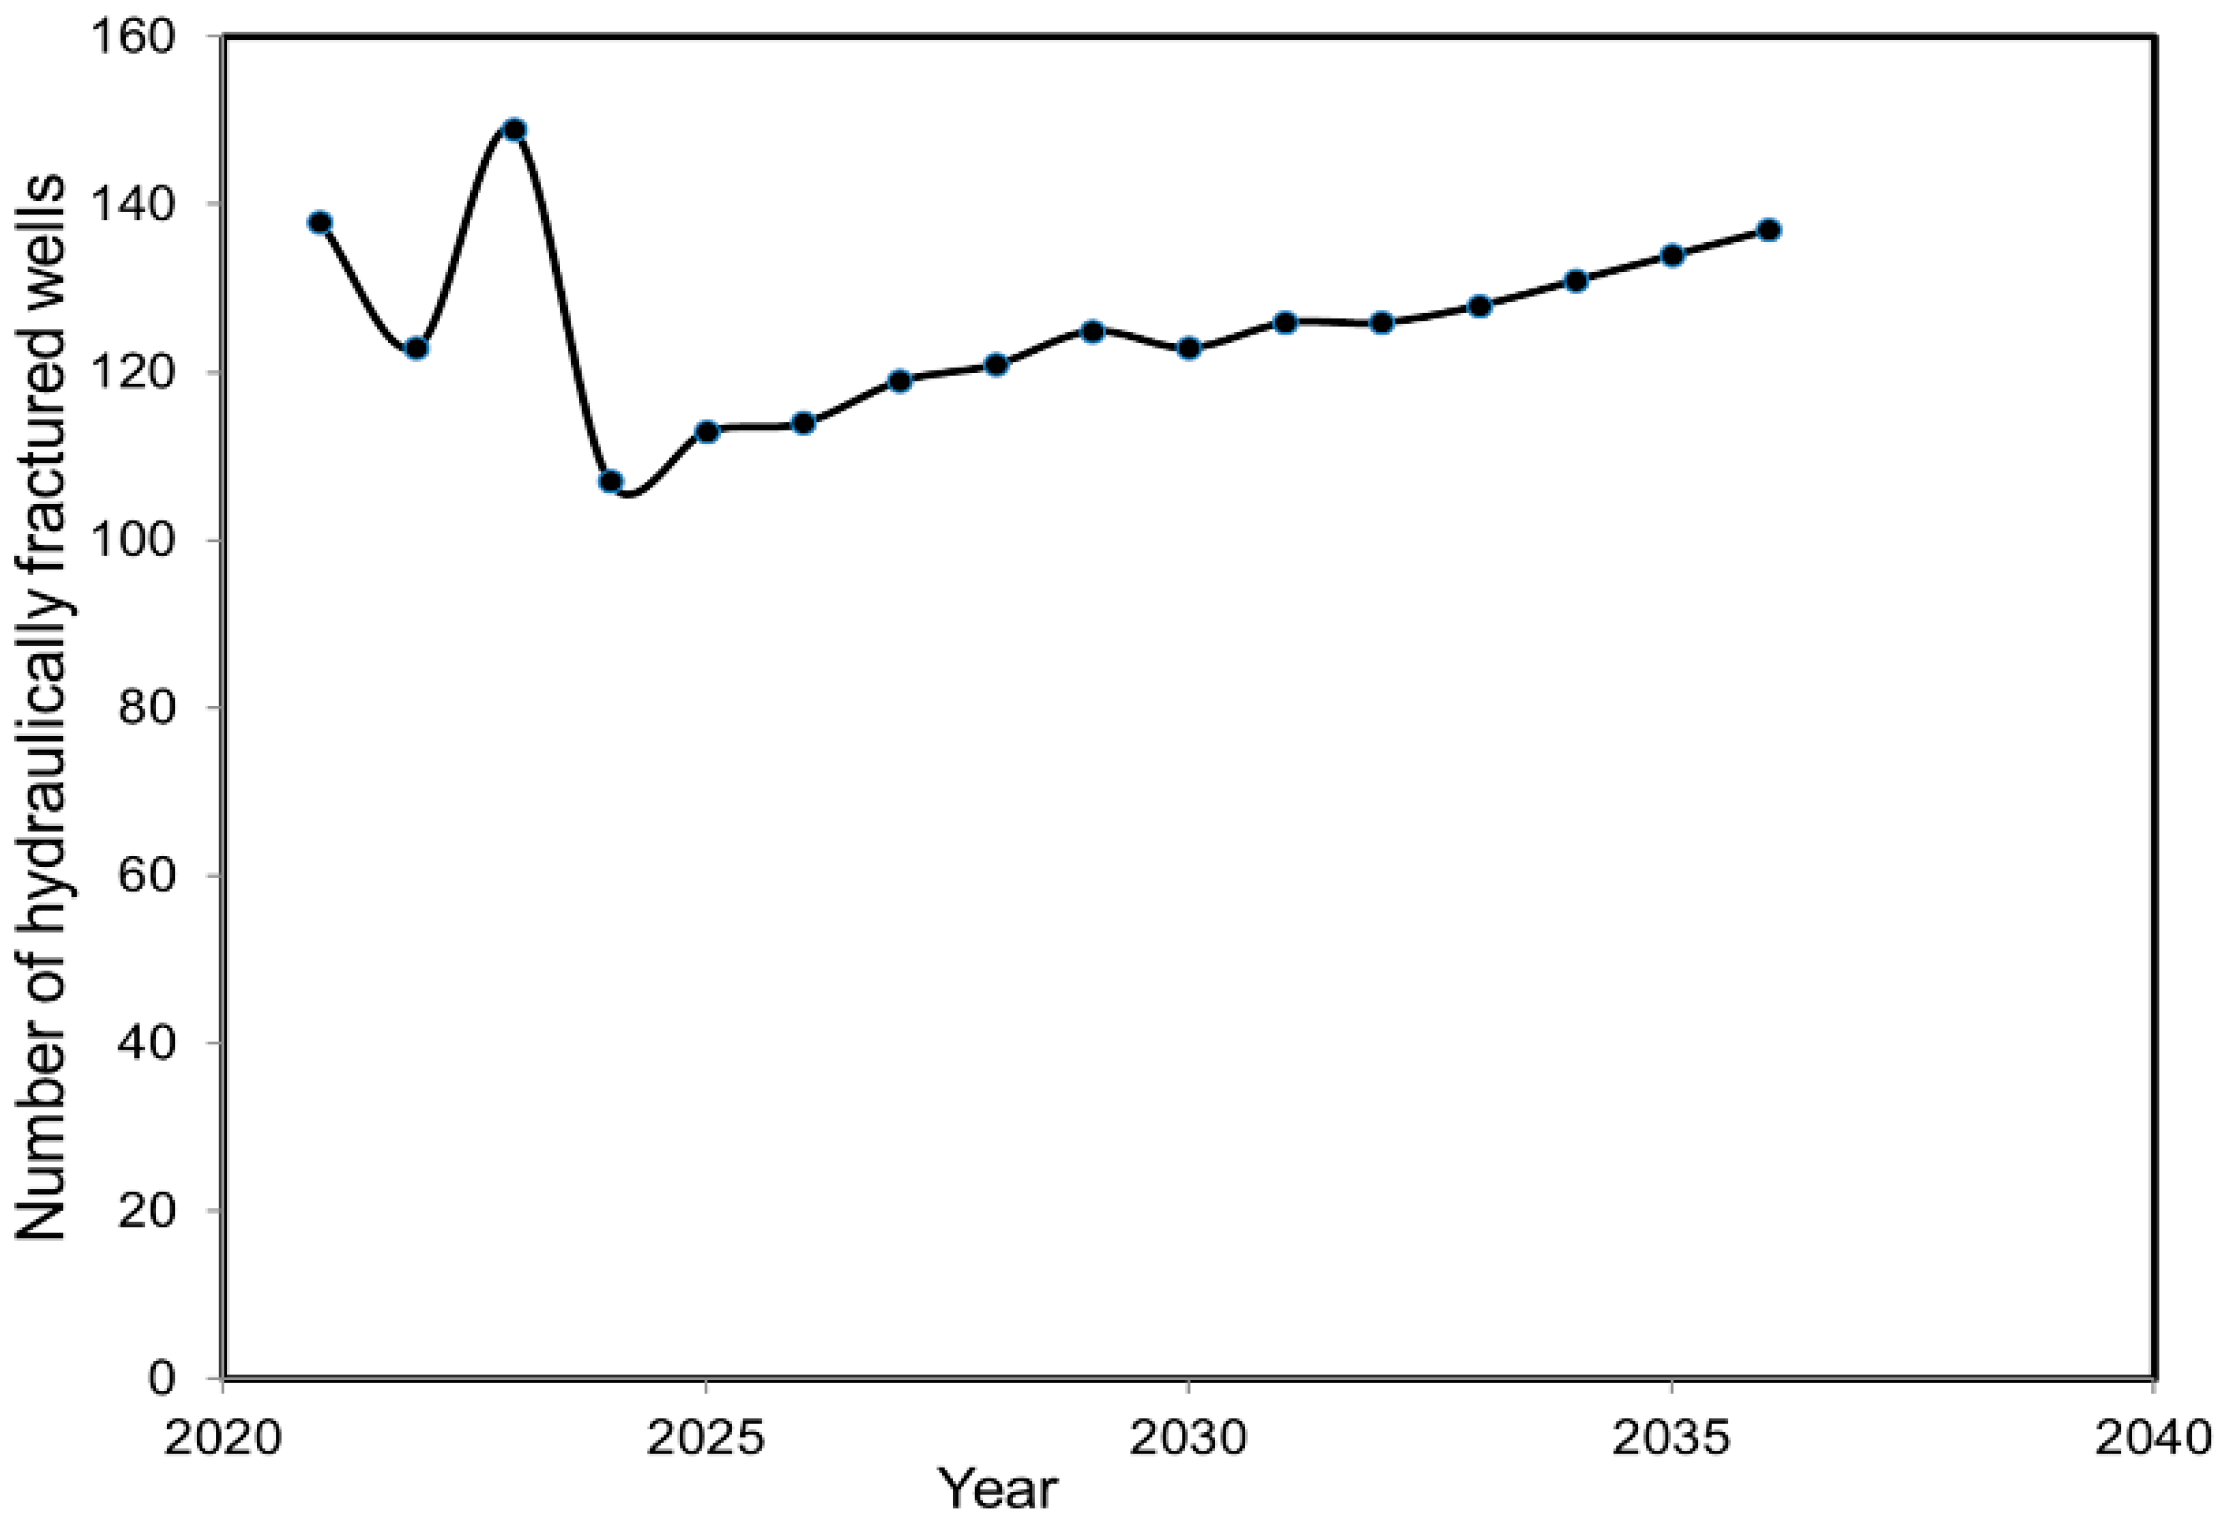
The future number of hydraulically fractured wells in the study area for 2021–2036 was projected based on the published report by Johnson et al. [45], which forecasted the number of hydraulically fractured wells in various provinces (i.e., Alberta, British Columbia, Saskatchewan, Manitoba, and Newfoundland and Labrador) of Canada from 2016 to 2036. In this study, the projection of wells in 2021–2036 was conducted based on the ratio of the total number of wells that was completed by HF in the study area in 2013 and 2014 to the total number of wells completed by HF in Alberta in 2013 and 2014 collected from Alberta Energy Regulator [48,49]. On average, that ratio was 5.3%. The annual variation in the number of hydraulically fractured wells from 2021 to 2036 is presented in Figure 2. The annual number of wells of each year from 2021 to 2036 was distributed monthly according to the monthly percentage of wells to the total annual number of wells in 2013 and 2014 (Table 2). This approach resulted in a prediction of 2014 wells being completed in the study area using HF.
The annual water use in HF in 2013 and 2014 was 997,291 m3 and 948,931 m3, respectively. The average water use for each well in the study area was approximately 5362 m3 in 2013 and 3842 m3 in 2014. On average, 4495 m3 of water was used for each well in 2013 and 2014. This average amount of water was considered for each well in every month in 2021–2036 due to limited available information during that time period. In total, 9,052,930 m3 of water would be used in 2021–2036. Assuming truck capacity of 25 m3, 362,117 large water tank truckloads would be needed in 2021–2036 for delivering water to drill these hydraulically fractured wells. Publicly available data (www.fracfocus.ca) only reports the date and quantity of water used in HF. It does not include the time of water withdrawal, how the water was transported to the site, the location of the source of water, the type of water source, and whether any water was recycled. Similar to other studies related to water withdrawal for HF on water resources, this constitutes a limitation in our study. In order to reduce these uncertainties, the following assumptions were made:
  • Monthly water use data in 2021–2036 were distributed equally among all days of the particular month for numerical simulations. Best and Lowry [19] distributed all water withdrawals uniformly over the entire year for numerical modeling.
  • Only surface water (i.e., river) was selected as a potential water source.
  • It was assumed that all water was extracted from one location near the time of the fracturing operations, and the location of water extraction was selected close to the water level and flow monitoring station (SW3 station) so that the maximum impacts on river water level could be estimated. The water extraction location was assumed 1 km upstream of the SW3 station in the Smoky River (Figure 1a). This location was selected because the SW3 station is located in the Montney and Duvernay formations, and water extraction from this location would have the maximum impacts on river water level fluctuations at the SW3 station. No recycling of water was considered.
One potential scenario of water use for HF was generated based on the above assumptions. This scenario does not provide exact prediction, however shows the trend and nature of prediction in order of magnitude by using the available data. This scenario was used in the developed model to compare the outputs (i.e., stream flow and groundwater discharge) in 2021–2036 under future climate change scenarios (i.e., RCP4.5 and RCP8.5) with those under sole future climate change scenarios in 2021–2036, and base modeling period (2000–2012), where no HF was used. In this study, the period of 2000–2012 was used as base modeling period because the calibration and validation of the model was done during that period. Albek et al. [50] used a similar approach to compare streamflow variation due to climate change with respect to the base model results (i.e., during 4 years model calibration and validation periods) in the Middle Seydi Suyu Watershed, Turkey. The results illustrate the maximum probable impacts on water resources under future climate change.

2.5. Generation of Future HF Associated Activities Scenarios

Future scenarios of HF associated activities (i.e., construction of roads, well pads, pipelines, seismic lines, and power transmission lines) were generated by using ALCES [27]. ALCES is a fast, user-friendly and powerful landscape simulator that creates a “what-if” modeling environment that allows stakeholders to explore the economic, ecological, land and social consequences of different land use changes on defined landscapes [51]. ALCES generates future scenarios of HF associated activities under a business as usual (BAU) management scenario. ALCES provides future outputs for every decade. However, this study assessed climate change impact for the period of 2021–2036, so that it would be consistent with the outputs of Johnson et al. [45]. Therefore, ALCES simulation was performed from 2010 to 2030. Future scenarios of ALCES outputs were generated for the decades of 2020 and 2030. In addition, we assumed 2020 ALCES BAU scenario for the hydrological simulation for the period of 2021–2029, and 2030 ALCES BAU scenario for the period of 2030–2036. These scenarios were included in year 2000 land use map to get 2021–2029 and 2030–2036 land use maps, which were not shown here because of small land use changes. Wijesekara et al. [52] also used one-year land use map for a 5-year hydrological simulation. In this way, we attained average impacts of HF associated activities on water resources.
Typically, shale gas multi-well pads require 2 acres (8093.71 m2) to 5 acres (20,234.3 m2) of land [53]. However, in this study one grid cell size of the developed model was 284 m by 284 m, which is equivalent to an area of 80,656 m2. Therefore, in this study, 284 m by 284 m was assumed for each well pad size. Six wells were considered for each well pad as per other studies in HF [53,54]. The density of well pad was considered as one well pad per 2.56 km2 [54].

2.6. Limitations and Uncertainties of the Results

There are a number of limitations and uncertainties in the results generated from HF and its associated activities under changing climate. First, uncertainties always exist in future climate change scenarios [55]. Therefore, uncertainty analysis of climate change should be considered in further studies to assess the average impact of climate change scenarios on water resources in the study area. Second, internal variability, which was not considered in this study because climate data was directly downloaded from the PCIC data portal, could affect the patterns of climate change scenarios. Third, different climate models will provide different patterns of future precipitation and temperature trends under the RCP4.5 and the RCP8.5 scenarios. Therefore, other climate models predicted precipitation and temperature should be used to compare the obtained results of this study. Fourth, because of the lack of proper information no-flow boundary condition was used for the MIKE-SHE model domain, which would affect the outputs of this study. Fifth, future HF and its associated activities scenarios were generated based on certain current assumptions and are likely to fluctuate with global energy demand, prices, extraction techniques, etc. Thus, the outputs of this study will not characterize exact prediction, but show the trend and nature of prediction in order of magnitude.

3. Results and Discussion

3.1. Results of Model Calibration and Validation

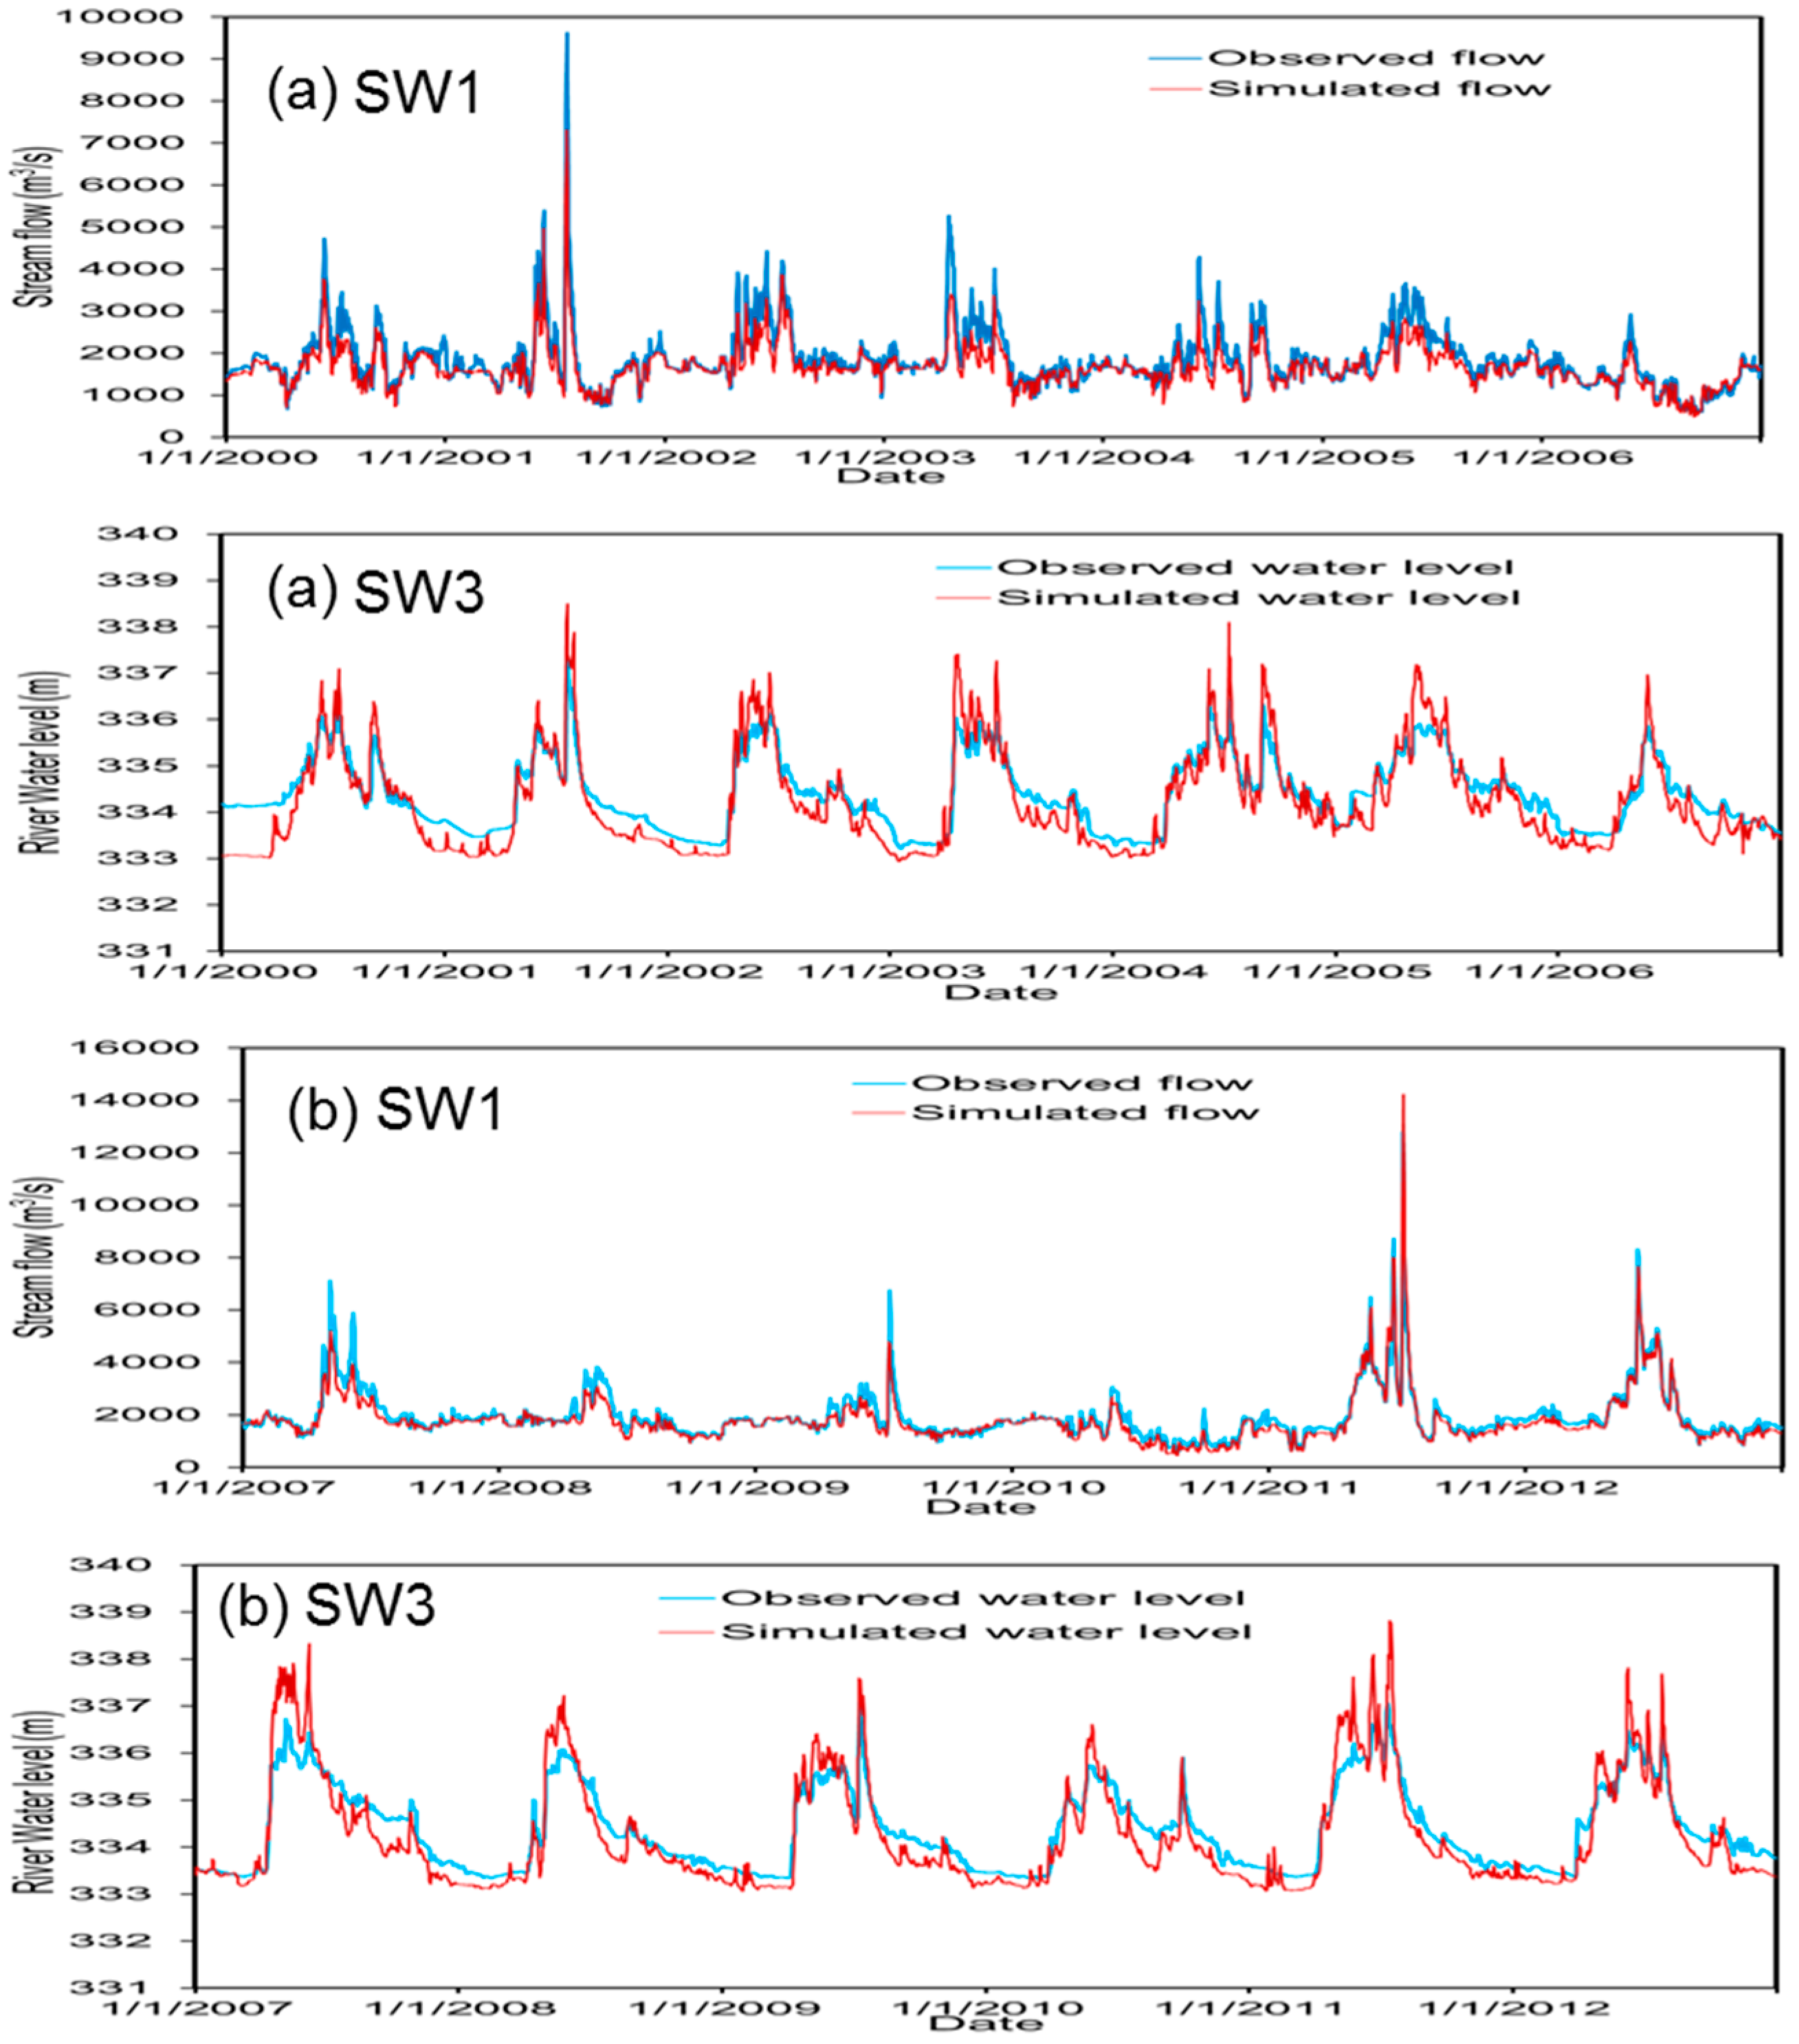
Based on the sensitivity analysis, it was found that horizontal hydraulic conductivity (loam) was the most sensitive parameter in the model. Horizontal hydraulic conductivity (clay loam), horizontal hydraulic conductivity (silty clay), specific storage (bedrock), specific yield (loam), evapotranspiration surface depth, water content at saturation (loam), degree-day melting coefficient, leakage coefficient of the bed material, channel roughness and overland surface roughness (forest) were ranked as the second, third, fourth, fifth, sixth, seventh, eighth, ninth, tenth and eleventh sensitive parameter, respectively. Since precipitation plays a negligible role (nearly 1.6%) in the rainfall-runoff processes in the study area, most of the sensitive parameters governing the channel routing and saturated groundwater flow play the major roles. Therefore, the model set up in this study favors mostly channel routing and saturated groundwater flow parameters. These parameters were changed during the model calibration stage. The monthly model calibration (Figure 3a) resulted in R2 = 0.88 and NSE= 0.76 at the outlet (SW1 station) of the study area. Santhi et al. [56] suggested an acceptable model evaluation when a R2 ≥ 0.6 and a NSE ≥ 0.5 are obtained. These evaluation statistics criteria showed that the developed model calibration was deemed satisfactory. The model validation resulted (Figure 3b) in R2 = 0.92, and NSE= 0.89 at the outlet of the study area using monthly data. Therefore, satisfactory model validation was also achieved.
The model calibration and validation considering groundwater levels (here showing the results for the GW1 well) showed satisfactory results (Figure 4). Total water balance during the simulation period was also used as an indicator of the model performance. During both calibration and validation periods, the total water balance error was less than 1%, which indicates an adequate model performance. Table 3 presents the calculated R2 and NSE values at various monitoring stations and wells based on monthly stream flow, stream (i.e., river) water level, and groundwater level data.

3.2. Impact of Climate Change on Precipitation and Temperature

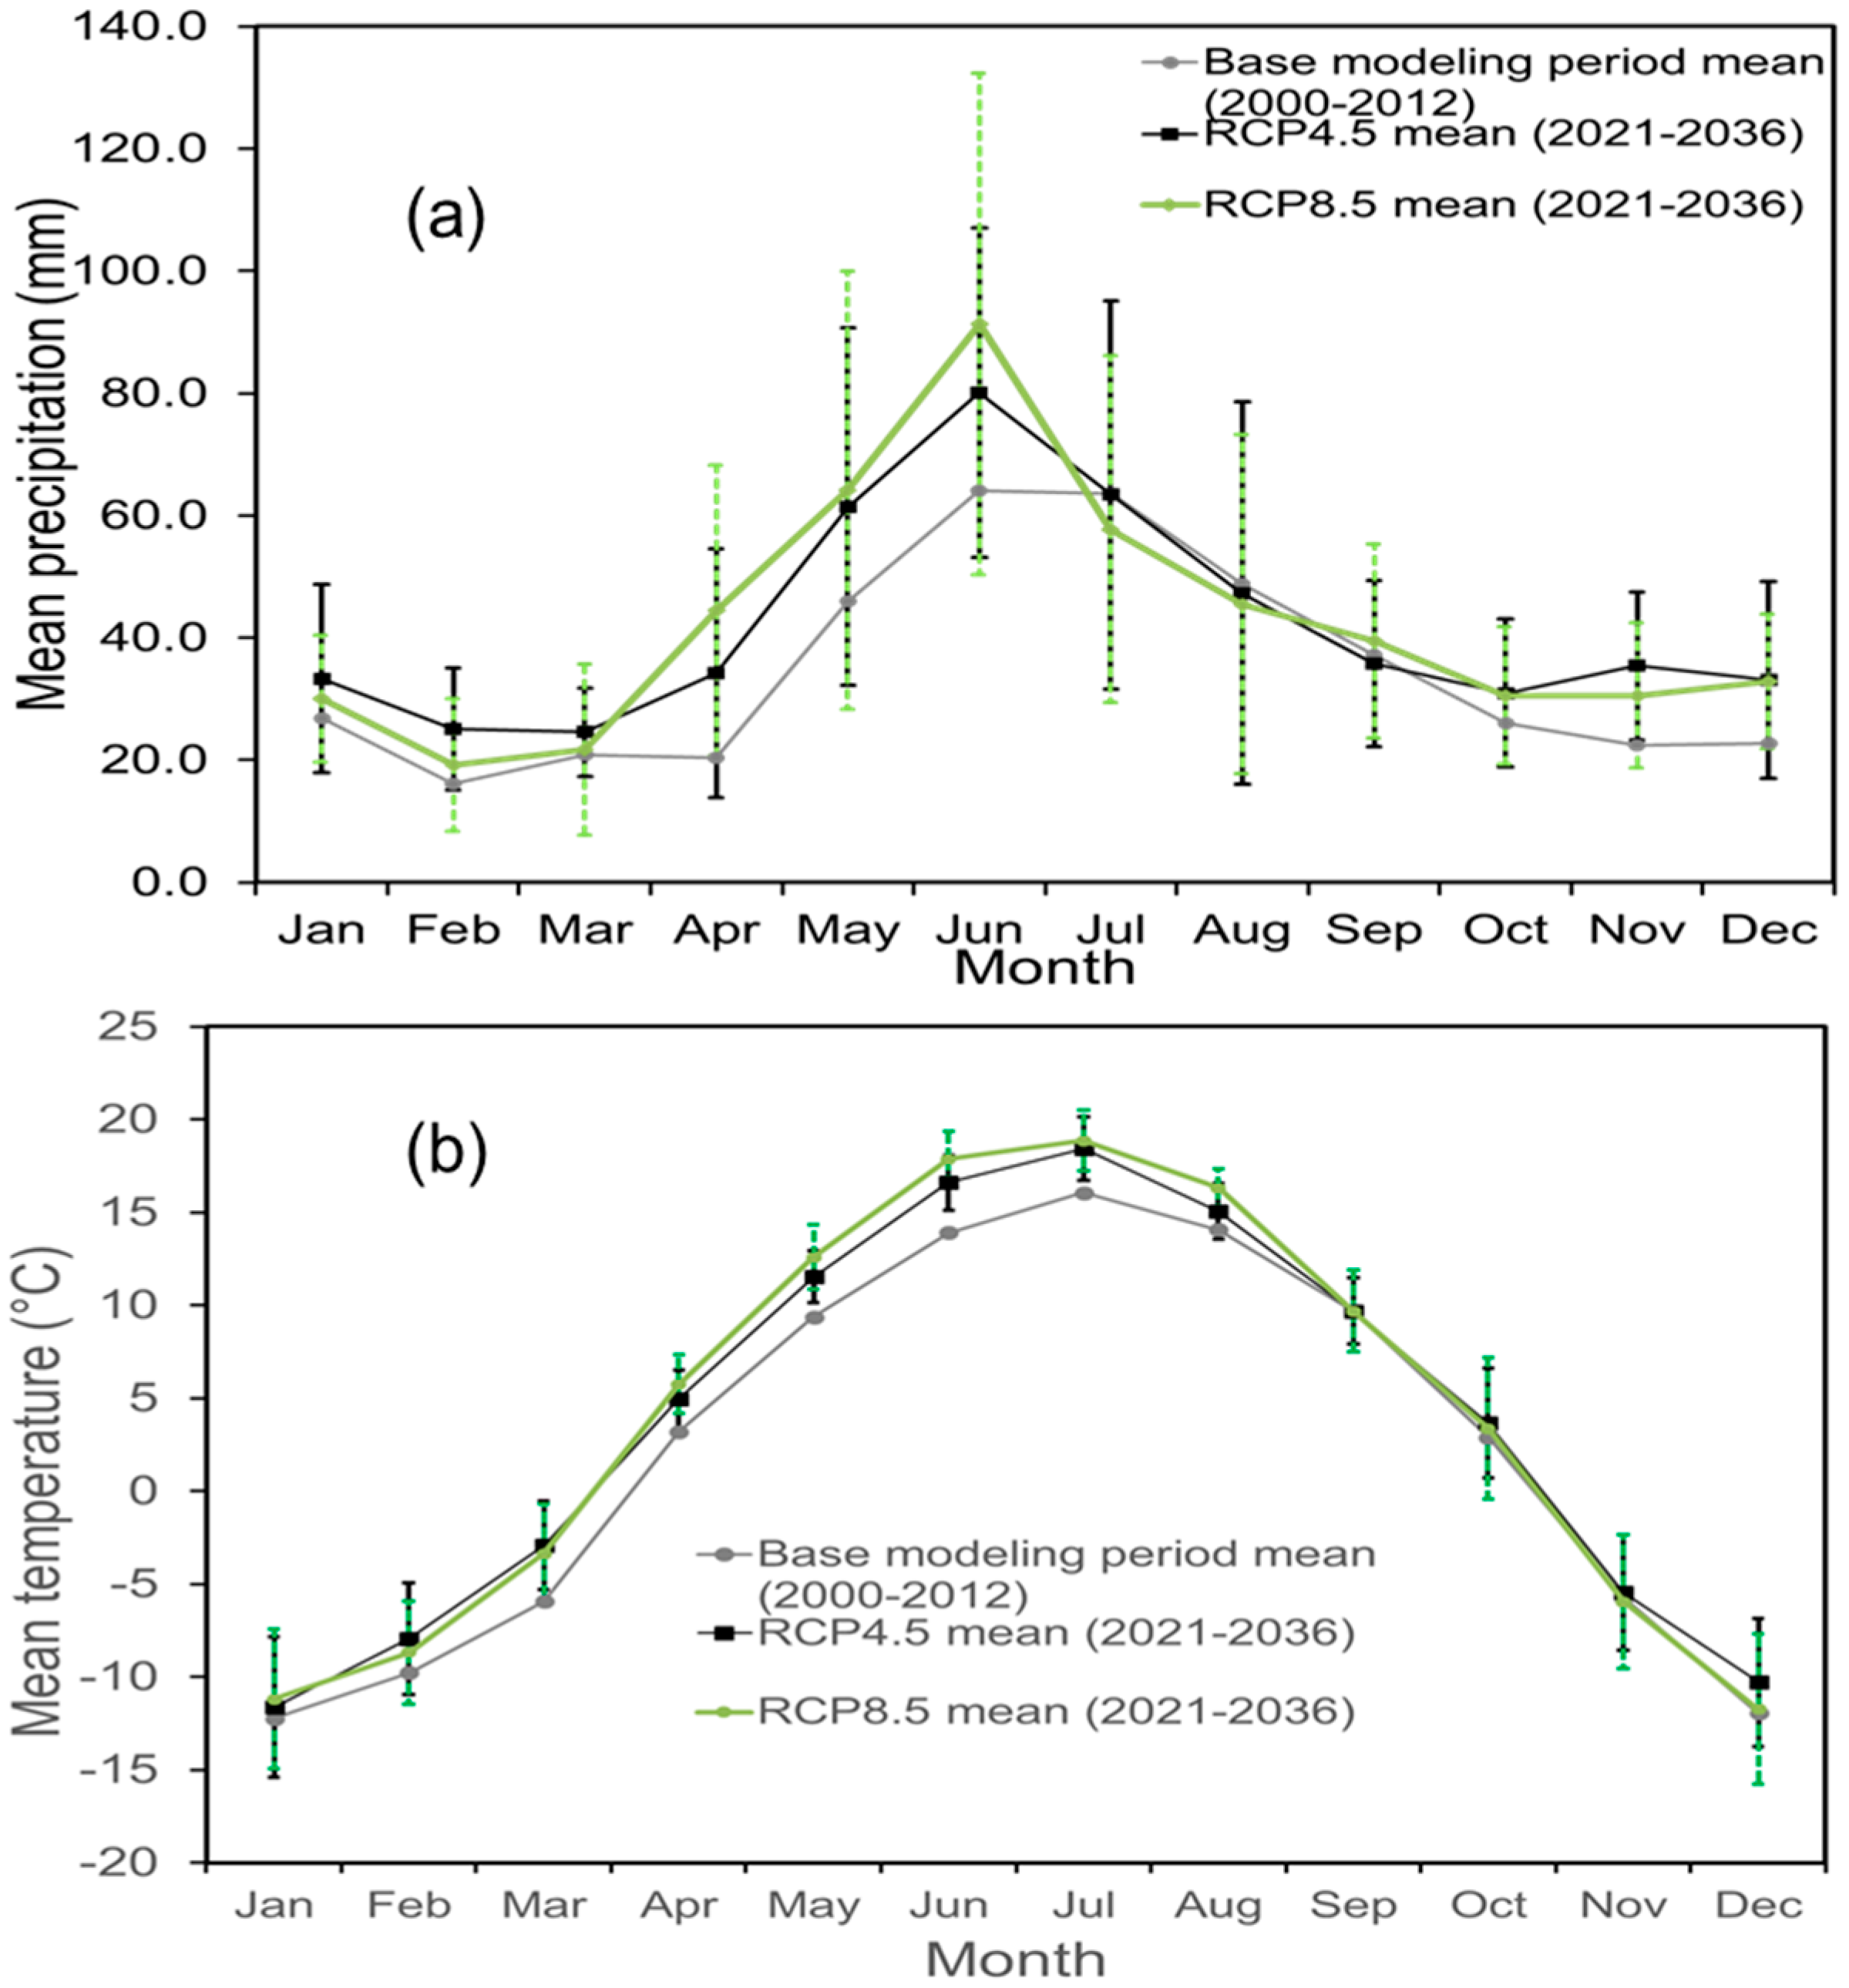
The future monthly precipitation in the study area under the RCP4.5 and RCP8.5 scenarios show variable patterns in 2021–2036 (Figure 5a) due to the anthropogenic increases in the atmospheric concentrations of GHG [57]. In this figure, the error bars of the standard deviation of monthly precipitation for the period of 2021–2036 are shown. Both the trend and peak of the mean projected monthly precipitation under the RCP4.5 and RCP8.5 scenarios in 2021–2036 follow the pattern of the base modeling period. This similar pattern also justifies why the CanESM2 projections were used to represent future climate over this region. It was also found that the mean monthly precipitation is higher under the RCP4.5 scenario than under the base modeling period for all months, except August and September. On the other hand, the mean monthly precipitation under the RCP8.5 scenario is higher for all months, except July and August, compared to the base modeling period. The mean monthly precipitation under the RCP8.5 scenario is higher for 4 months (April, May, June and September) than those under the RCP4.5 scenario. From the seasonal (winter: December–February, spring: March–May, summer: June–August, and fall: September–November) point of view, the highest and lowest seasonal precipitation under both RCP4.5 and RCP8.5 scenarios from 2021 to 2036 are expected in summer and winter, respectively (Table 4). The mean seasonal precipitation under the RCP4.5 and the RCP8.5 scenarios is also expected to increase in 2021–2036, with respect to the mean seasonal precipitation under the base modeling period. A greater increase in mean seasonal precipitation is expected during spring (33 mm and 43 mm under the RCP4.5 and RCP8.5 scenarios, respectively) than other seasons in both scenarios. The mean annual precipitation under the RCP4.5 and the RCP8.5 scenarios is expected to increase in 2021–2036, as compared to that under the base modeling period. The mean annual precipitation of 2021–2036 under the RCP4.5 and the RCP8.5 scenarios is expected to be 504 mm (σ = 92 mm), and 509 mm (σ = 102 mm), respectively. These numbers are higher than the mean annual precipitation under the base modeling period by 89 mm (21.4%) and 94 mm (22.6%), respectively.
The trend of mean monthly temperature under the RCP4.5 scenario is similar in every year, with the highest and lowest mean monthly temperature occurring in July and January, respectively, which are similar to those under the base modeling period (Figure 5b). However, under the RCP8.5 scenario this trend is similar in most of the months, except the lowest mean monthly temperature that is expected to occur in December. The mean monthly temperature under both scenarios is higher than the base modeling period for all months. The mean monthly temperature under the RCP8.5 scenario is higher in 6 months (January, April, May, June, July and August) than under the RCP4.5 scenario. The mean seasonal temperature under the RCP4.5 and the RCP8.5 scenarios is expected to increase in 2021–2036 with respect to the mean seasonal temperature under the base modeling period (Table 4) because of the anthropogenic increases in the GHG concentrations [57]. A greater increase in mean seasonal temperature is expected during spring (2.3 °C) and summer (2.92 °C) under the RCP4.5 and the RCP8.5 scenarios, respectively. The mean annual temperature would also increase under both scenarios in 2021–2036. On average, the mean annual temperature of 2021–2036 under the RCP4.5 and the RCP8.5 scenarios would be 3.46 °C (σ = 0.76 °C) and 3.62 °C (σ = 1.06 °C), respectively. The mean annual temperature under the RCP4.5 and the RCP8.5 scenarios is expected to increase by 1.5 °C and 1.66 °C, respectively, as compared to that under the base modeling period.

3.3. Land Use Changes due to HF Associated Activities

Based on the ALCES outputs, very little amount of land use change is predicted to arise from HF associated activities in 2030 compared to 2000 (Table 5). The change would occur in the land uses of minor roads (5.88 km2), well pads for oil and gas exploration and extraction (32.27 km2), and pipelines (21.22 km2). However, the land uses of major roads, power lines and seismic lines would not change. In this study, pipelines and minor roads were not considered for future scenarios of HF associated activities because of the narrow size (diameter) of the pipelines and smaller width of minor roads, which were not possible to include in 30 m by 30 m resolution of land use map. Only the change in well pads, which is 0.13% of the total study area, was considered. The results show that forest, agriculture, and perineal crops and pasture areas would be converted into clear cut area (i.e., well pads here) in 2030. The major decrease would occur in forest (23.27 km2). Agriculture, and perineal crops and pasture areas would decrease by 5.13 km2 and 3.87 km2, respectively, from 2000 to 2030 (Table 5). In Pennsylvania, Drohan et al. [58] also found similar conversion of forest and agricultural areas into gas well pads, which is clear cut area in this study.

3.4. Surface Water and Groundwater Under the RCP4.5, the RCP8.5, HF and Its Associated Activities Scenarios

3.4.1. Monthly, Seasonal and Annual Stream Flows

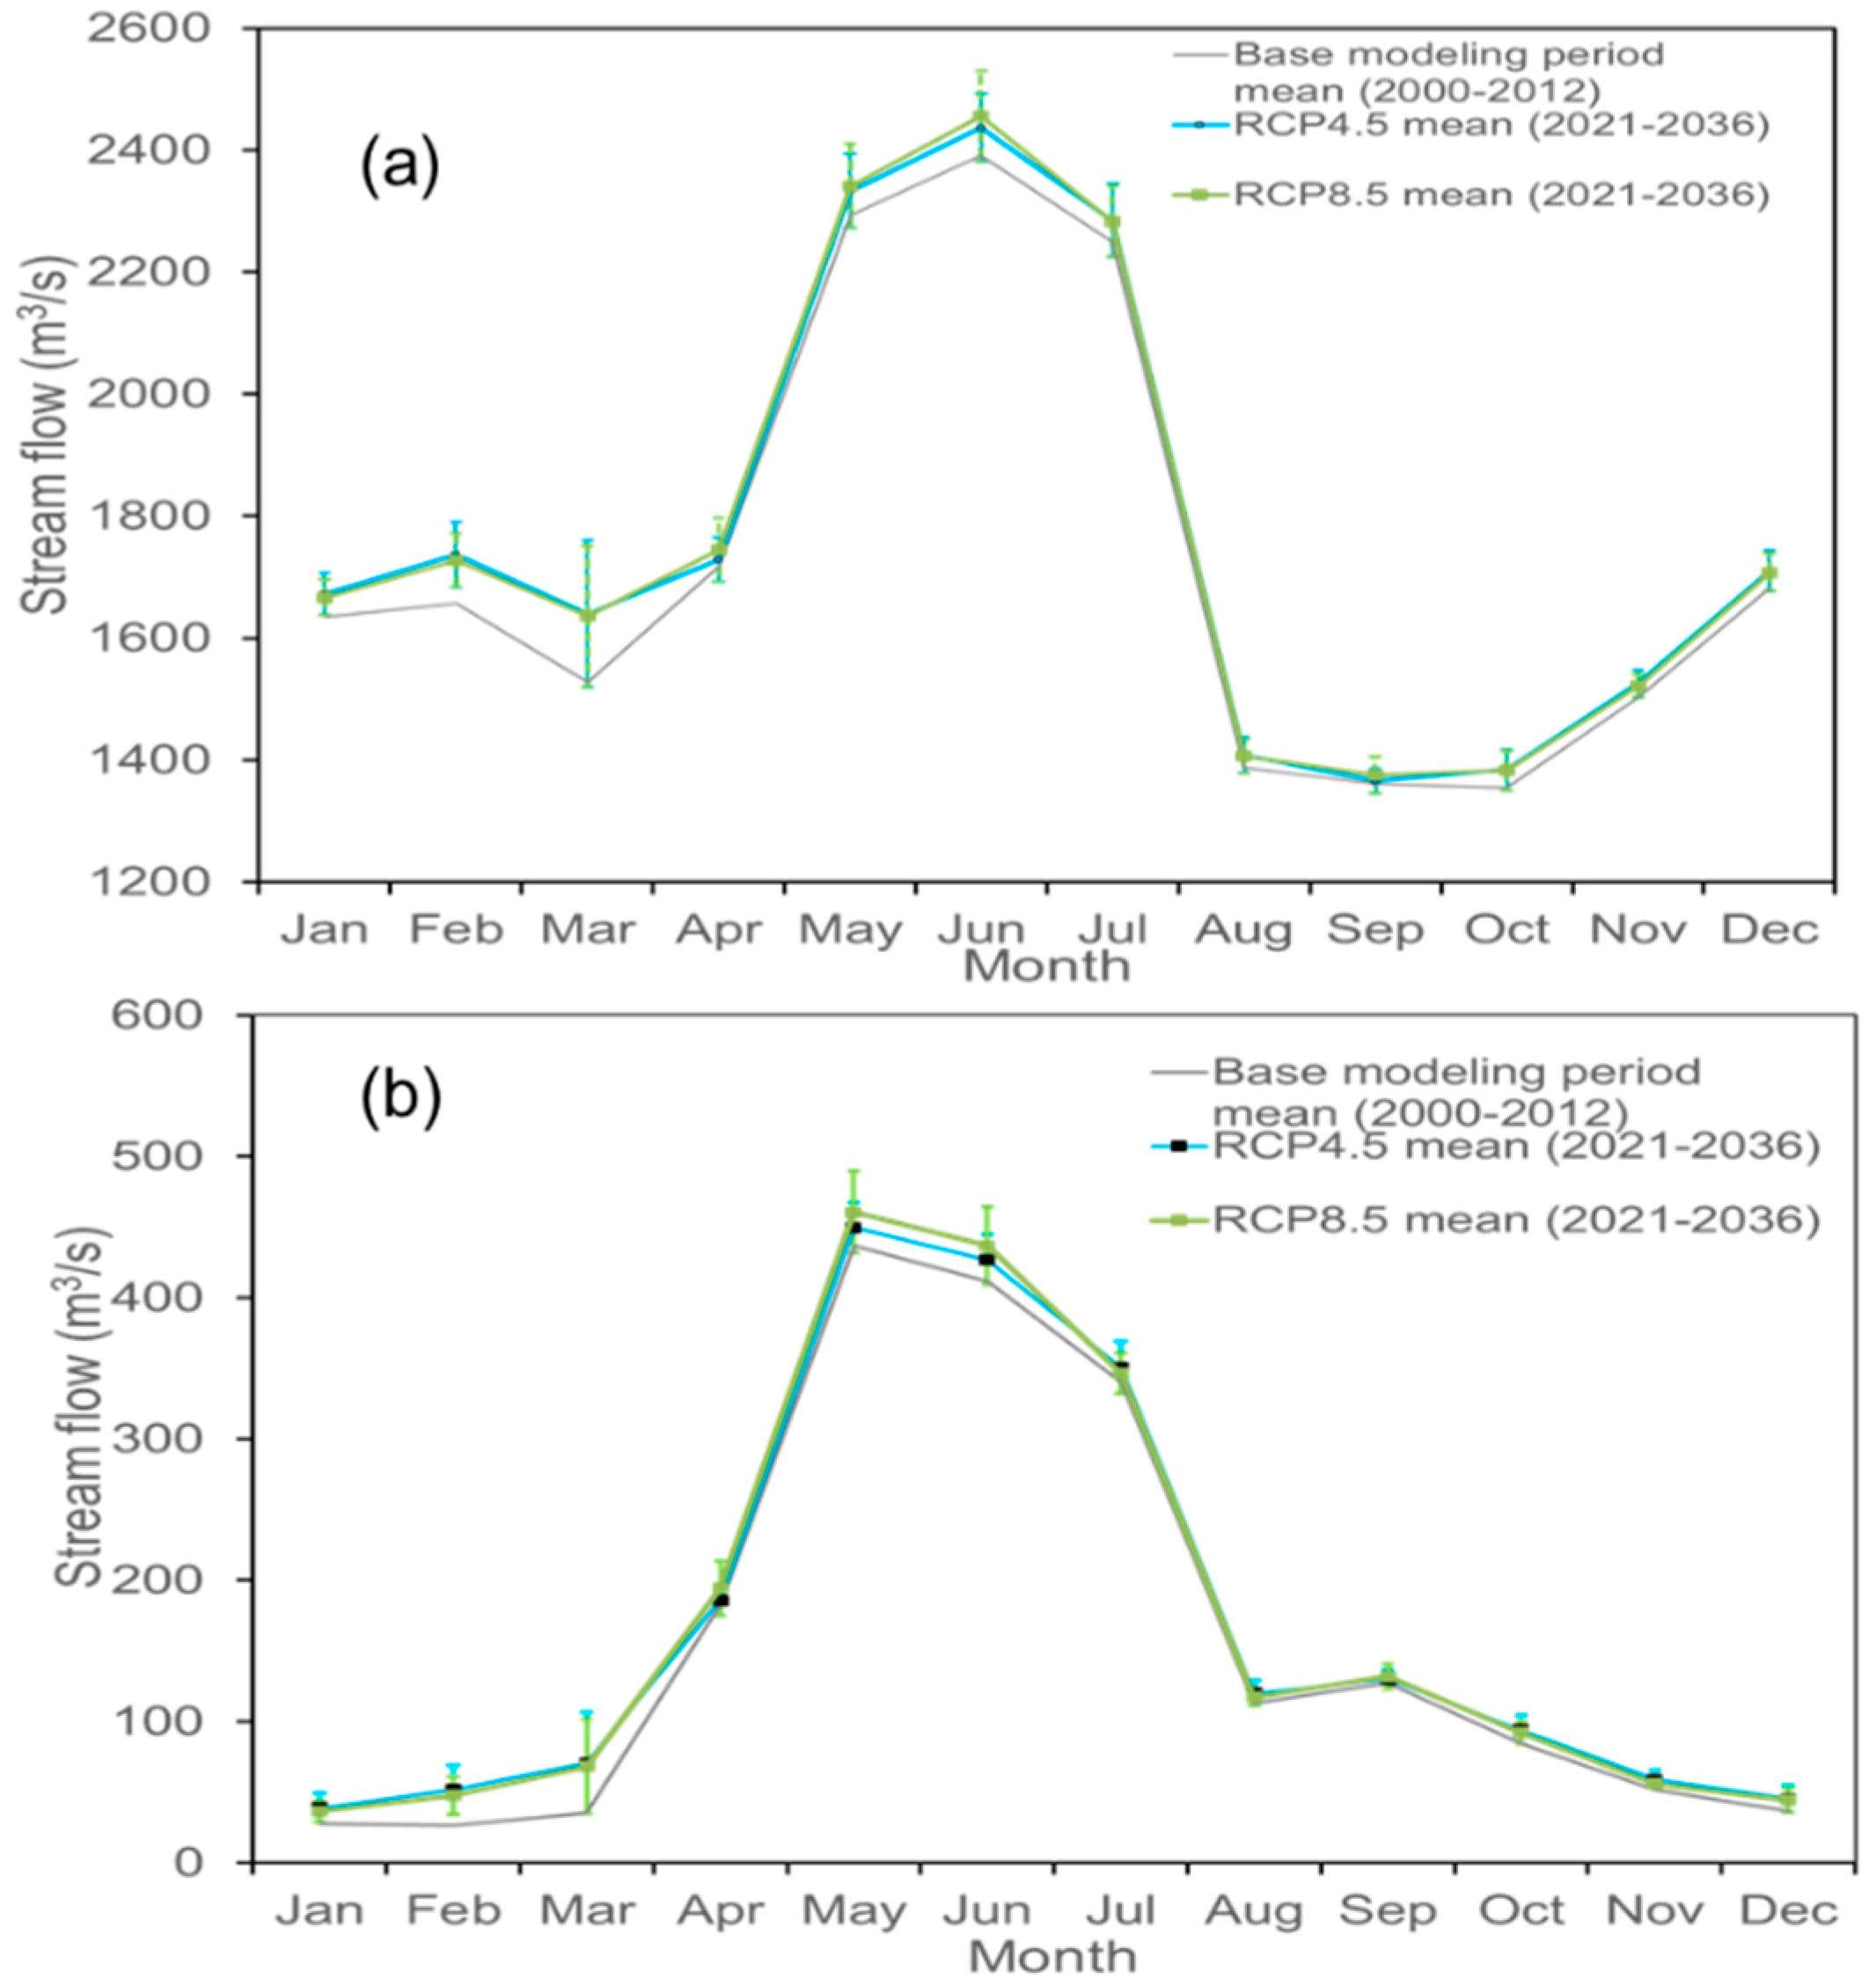
The integrated model simulated results were analyzed on a mean monthly basis. The results show that the mean monthly stream flows in 2021–2036 under the RCP4.5 and the RCP8.5 scenarios are higher than those under the base modeling period (2000–2012) during the whole year, due to the increased precipitation and temperature predicted under the RCP4.5 and the RCP8.5 scenarios (Figure 6). At the SW1 station (outlet of the study area), the highest mean monthly stream flow occurs in June in both scenarios and the base modeling period (Figure 6a). On the other hand, at the SW3 station, the highest mean monthly stream flow occurs in May in both scenarios and the base modeling period (Figure 6b). This variation occurs because of the spatial and temporal precipitation variability in and outside of the study area. The upstream parts of the Peace River, the Smoky River and the Little Smoky River (which are outside of the study area) contribute 88%, 8.1% and 2.3% of the stream flow at the outlet of the study area, respectively, which also supports the significance of precipitation variability outside of the study area on these results. At the SW1 station, the lowest mean monthly stream flow under both scenarios and the base modeling period occurs in September and October, respectively. At the SW3 station, the lowest mean monthly stream flow under both scenarios and the base modeling period occurs in January and February, respectively. Therefore, climate change significantly affects the pattern of mean monthly stream flows in the study area.
From the seasonal point of view, the mean seasonal stream flows at the SW1 station under the RCP4.5 and the RCP8.5 scenarios are also expected to increase in 2021–2036 with respect to those under the base modeling period (Table 6). This occurs due to the increased precipitation and temperature predicted under the RCP4.5 and the RCP8.5 scenarios with respect to the base modeling period. The highest and lowest water extraction from the Peace River reach, where the SW1 station is located, under both scenarios could be possible during summer and fall, respectively. It would occur due to the highest (i.e., on average 2043.12 m3/s and 2048.85 m3/s under the RCP4.5 and the RCP8.5 scenarios, respectively) and lowest (i.e., on average 1424.93 m3/s and 1424.32 m3/s under the RCP4.5 and the RCP8.5 scenarios, respectively) mean stream flows at the SW1 station during summer and fall, respectively. However, a greater increase in mean seasonal stream flow is expected during spring (2.96% and 3.41% under the RCP4.5 and the RCP8.5 scenarios, respectively) compared to other seasons due to a greater increase in mean precipitation during spring. At the SW3 station, almost similar trends to those at the SW1 station would occur under both scenarios. However, the highest and lowest water extraction from the Smoky River reach, where the SW3 station is located, under both scenarios could be possible during summer and winter, respectively (Table 7). It would occur because the highest (i.e., on average 299.19 m3/s and 302.09 m3/s under the RCP4.5 and the RCP8.5 scenarios, respectively) and lowest (i.e., on average 39.42 m3/s and 38.41 m3/s under the RCP4.5 and the RCP8.5 scenarios, respectively) mean stream flows at the SW3 station would occur during summer and winter, respectively. The mean seasonal stream flows at the SW1 and SW3 stations under the RCP8.5 scenario are higher in spring and summer than those under the RCP4.5 scenario due to the higher precipitation under the RCP8.5 scenario during these seasons. Therefore, more water extraction from both the Peace River and the Smoky River would be possible in spring and summer under the RCP8.5 scenario than under the RCP4.5 scenario. However, the mean seasonal stream flows at the SW1 and SW3 stations under the RCP8.5 scenario are lower in winter and fall than those under the RCP4.5 scenario due to the lower precipitation under the RCP8.5 scenario during these seasons. Therefore, less water extraction from both the Peace River and the Smoky River would be possible in winter and fall under the RCP8.5 scenario than under the RCP4.5 scenario.
On average, the mean annual stream flow at the SW1 and SW3 stations under the RCP4.5 scenario is expected to be 1768.72 m3/s (σ = 23.22 m3/s), and 168.60 m3/s (σ = 7 m3/s), respectively. On the other hand, the mean annual stream flow at the SW1 and SW3 stations under the RCP8.5 scenario is expected to be 1770.66 m3/s (σ = 27.57 m3/s), and 169.39 m3/s (σ = 10.07 m3/s), respectively. With respect to the mean annual stream flow at the SW1 (i.e., 1729.87 m3/s) station under the base modeling period, the mean annual stream flow at the SW1 station under the RCP4.5 and the RCP8.5 scenarios would increase by 2.24% (i.e., 38.85 m3/s), and 2.36% (i.e., 40.79 m3/s), respectively. In contrast, with respect to the mean annual stream flow at the SW3 (i.e., 156.22 m3/s) station under the base modeling period, the mean annual stream flow under the RCP4.5 and the RCP8.5 scenarios would increase by 7.92% (i.e., 12.38 m3/s), and 8.43% (i.e., 13.17 m3/s), respectively. It is to be noted that the upstream parts of three large rivers (which are outside of the study area) contributed 98.4% of the flow at the outlet of the study area based on the observed stream flow data in 2000–2012. The mean annual stream flow generated in the study area in the base modeling period (2000–2012) was 27.47 m3/s, and under the RCP4.5 and the RCP8.5 scenarios the stream flow generated in the study area would be 66.32 m3/s, and 68.26 m3/s, respectively. The increment of stream flow generated in the study area under the RCP4.5 and the RCP8.5 scenarios is 141.43% and 148.51%, respectively. A similar high-increase in stream flow due to the increased precipitation was found by Guo et al. [59] in the Xinjiang River basin, China, and Muhammad et al. [60] in the upper Assiniboine River Basin, Canada. Therefore, more annual water extraction from the river, and allocation to the stakeholders for future water supply could be possible under both scenarios in 2021–2036 than under the base modeling period.
When the HF scenario is added to the RCP4.5 scenario in 2021–2036, the mean monthly, seasonal and annual stream flows at the SW1 and SW3 stations would decrease with respect to those under the only RCP4.5 scenario due to water withdrawals for HF from the Smoky River. Those decrements are very small (less than 1%) compared to the stream flow generated in a large study area. Therefore, these results were not possible to show in Figure 6, but the results follow similar trends to those under the sole RCP4.5 scenario. Similar results are obtained when HF scenario is added to the RCP8.5 scenario. Although the impacts of HF on stream flow are very small in the large area, the impacts could be significant in a small catchment area where large amount of water is extracted from the nearby river for HF. Cothren et al. [18] did not find any noticeable change in stream flow at a large basin scale (127,300 km2), but found significant changes in sub-basin scale and in monthly time steps. From seasonal point of view, the highest and lowest decreases in mean seasonal stream flow at both stations under both scenarios would occur during winter (i.e., 0.22 m3/s), and spring (i.e., 0.12 m3/s) seasons, respectively. It would occur because the highest and lowest number of wells would be completed by HF collecting water from the Smoky River in 2021–2036 during winter and spring, respectively. However, those reductions would not decrease the mean monthly, seasonal and annual stream flows at the SW1 and SW3 stations under the effects of (i) HF and RCP4.5 scenario, and (ii) HF and RCP8.5 scenario than those under the base modeling period (Table 6 and Table 7).
When HF associated activities (construction of well pads) are combined with the HF and RCP4.5 scenario in 2021–2036, the mean monthly, seasonal and annual stream flows at the SW1 and SW3 stations are expected to increase with respect to those under the sole RCP4.5 scenario. This occurs because HF associated activities results in increasing surface runoff and stream flow due to increasing area of low hydraulic conductivity soil. However, the increment is very small (less than 1%) because of small amount of land use changes (i.e., 0.13% of the study area). Similar outcomes are expected when HF associated activities are combined with the HF and RCP8.5 scenario. Cothren et al. [18] found significant increase (10%) in stream flow in sub-basin scale (area 387 km2) due to the increase in well pad and shale gas infrastructure in South Fork of the Little Red River watershed, USA. Saha [61] also found similar increase in stream flow in the Mainstem sub-watershed (213.82 km2) of the Kiskatinaw River watershed, Canada. Therefore, significant additive impacts on stream flow could be possible in a small catchment area where large amount of HF associated activities would occur. Since the increments in this study are very small (less than 1%), those results were not possible to show in Figure 6. The highest and lowest increases in the mean seasonal stream flow at both stations under both (i) HF, its associated activities and RCP4.5 scenario, and (ii) HF, its associated activities and RCP8.5 scenario would occur during spring and winter (Table 6 and Table 7), respectively, because of the highest and lowest increases in surface runoff would occur during spring and winter, respectively. However, a slight greater increase (by 0.20 m3/s at the SW1, and 0.07 m3/s at the SW3) would occur during spring under the HF, its associated activities and RCP8.5 scenario than under the HF, its associated activities and RCP4.5 scenario because of higher precipitation during spring under the RCP8.5 scenario. On the other hand, a slight greater increase (by 0.07 m3/s at the SW1, and 0.02 m3/s at the SW3) would occur during winter under the HF, its associated activities and RCP4.5 scenario than under the HF, its associated activities and RCP8.5 scenario because of higher precipitation during fall and winter under the RCP4.5 scenario.

3.4.2. Monthly, Seasonal and Annual Groundwater Discharges

Similar to stream flow, the mean monthly groundwater discharges generated at the outlet of the study area would increase under the RCP4.5 and the RCP8.5 scenarios compared to those under the base modeling period due to the increased groundwater levels under both scenarios resulted from increased precipitation (Figure 7). The highest mean monthly groundwater discharge occurs in June in both scenarios and the base modeling period. The lowest mean monthly groundwater discharge under both scenarios and the base modeling period occurs in January and October, respectively. Because of climate change, the pattern of mean monthly groundwater discharge changes in the study area. From the seasonal point of view, the highest and lowest mean groundwater discharges at the outlet of the study area under both scenarios would occur during summer and winter, respectively (Table 8). However, a greater increase in mean seasonal groundwater discharge is expected during summer (i.e., 131.25% and 147.12% under the RCP4.5 and the RCP8.5 scenarios, respectively) than other seasons. Among all seasons, the increase in seasonal groundwater discharge of less than 100% would occur in winter due to the lower infiltration rate resulted from snow covered land area. The mean seasonal groundwater discharge under the RCP8.5 scenario is higher in spring and summer than those under the RCP4.5 scenario due to the higher precipitation under the RCP8.5 scenario during these seasons. On the other hand, the mean seasonal groundwater discharge under the RCP8.5 scenario is lower in winter and fall than those under the RCP4.5 scenario due to the lower precipitation under the RCP8.5 scenario during these seasons. The mean annual groundwater discharge generated at the outlet of the study area under the RCP4.5 and the RCP8.5 scenarios would be 35.96 m3/s (σ = 0.98 m3/s) and 36.55 m3/s (σ = 1.06 m3/s), respectively. The mean annual groundwater discharge under the RCP4.5 and the RCP8.5 scenarios would increase by 117.56% (i.e., 19.43 m3/s) and 121.12% (i.e., 20.02 m3/s), respectively, with respect to the base modeling period (i.e., 16.53 m3/s). Consequently, more annual water extraction from the Smoky River and the Peace River for the oil and gas industries in the study area would be possible under both scenarios than under the base modeling period without causing any substantial negative impact on regional groundwater levels and groundwater discharge.
Although adjacent groundwater levels of the Smoky River reach would decrease under the effects of HF and RCP4.5 scenario than those under the sole RCP4.5 scenario, the mean monthly groundwater discharge of the study area would increase under the effects of HF and RCP4.5 scenario than those under the sole RCP4.5 scenario. This would occur because the minor decrease would happen in groundwater level compared to surface water level due to low groundwater velocity and low hydraulic conductivity of soils. Therefore, the gradient between the groundwater and surface water systems would increase, and would result in increased groundwater discharge under the effects of HF and RCP4.5 scenario. However, these increments are very small (less than 1%) compared to the groundwater discharge generated in a large study area. Therefore, these results were not possible to show in Figure 7, but the results follow similar trends to those under the sole RCP4.5 scenario. From the seasonal point of view, the highest and lowest increases in mean seasonal groundwater discharge in the study area under the effects of HF and RCP4.5 scenario would occur during winter (0.06 m3/s) and spring (0.02 m3/s), respectively (Table 8). This would occur because the highest and lowest number of wells would be completed by using water-intensive HF in 2021–2036 during winter and spring, respectively. Similar results would happen when HF scenario is added to the RCP8.5 scenario. However, the mean seasonal groundwater discharge increases more (i.e., 0.01 m3/s) under the HF and RCP8.5 scenario during winter than that under the HF and RCP4.5 scenario. This happens because lower soil moisture condition would occur due to the lower precipitation in the study area during winter months under the RCP8.5 scenario than under the RCP4.5 scenario, which resulted in higher river water level declines in winter months under the HF and RCP8.5 scenario. Therefore, a higher gradient between groundwater and surface water would occur under the HF and RCP8.5 scenario, and result in higher groundwater discharge during winter. Similar trends occur across all seasons. The mean annual groundwater discharge at the outlet of the study area under the HF and RCP4.5 scenario, and the HF and RCP8.5 scenario would increase by 0.11% (i.e., 0.04 m3/s), with respect to the sole RCP4.5 and RCP8.5 scenarios, respectively. Although the impacts of HF on groundwater discharge are very small in this large study area, the impacts could be significant in a small catchment area where large amount of water is extracted from the nearby river for HF. The mean annual groundwater discharge of the study area under the HF and RCP4.5 scenario, and the HF and RCP8.5 scenario would increase by 117.80% (i.e., 19.47 m3/s) and 121.37% (i.e., 20.06 m3/s), respectively, with respect to the base modeling period. This increased groundwater discharge under both scenarios may result in some positive effects on stream water quality, such as cooler stream temperature during warm months (i.e., months in late spring, summer and fall), and warmer stream temperature during cold months (i.e., months in winter and early spring) in the river [62,63].
The mean monthly groundwater discharges in the study area under the effects of HF, its associated activities, and RCP4.5 scenario would increase with respect to those under the sole RCP4.5 scenario. However, the increment is less than 1% because of small land use changes. Therefore, those results were not possible to show in Figure 7. Although increasing well pads of low hydraulic conductivity soil generally results in increasing surface runoff and decreasing groundwater discharge, the outputs in this study found increasing groundwater discharge at the outlet of the study area. This occurs because most of the land use changes would occur in the forest area, which would provide additional precipitation from canopy interception in the study area. When well pads will be built in forested areas such as surrounding the GW1 and GW2 monitoring wells, canopy rain and snow interception in those areas will decrease and provide additional precipitation amount from canopy interception on those areas. This additional precipitation would result in increased soil moisture, which in turn would increase surface runoff, infiltration, and groundwater levels at those wells. The mean annual groundwater level at the GW1 well under the effects of HF, its associated activities, and RCP4.5 scenario would increase by 0.33 m compared to that under the sole RCP4.5 scenario. The mean annual groundwater level at the GW1 well under the effects of HF, its associated activities, and RCP8.5 scenario would increase by 0.36 m compared to that under the sole RCP8.5 scenario. Because of higher precipitation under the RCP8.5 scenario, the mean annual groundwater level at the GW1 well under the effects of HF, its associated activities and RCP8.5 scenario would increase more than under the effects of HF, its associated activities and RCP4.5 scenario. Therefore, HF associated activities would provide significant additive impacts on groundwater resources mainly in forest clear-cut area (i.e., forest area converted into well pads). Evans et al. [64] found groundwater level increase in forest-harvested area in northeast Alberta, Canada. In contrast, when well pads will be built in agricultural and pasturelands such as surrounding the GW3 and GW4 monitoring wells, additional precipitation from canopy interception will not generate in these areas similar to forested area. Therefore, groundwater level would decrease in those wells due to the increasing areas of low hydraulic conductivity soil, and surface runoff would increase. The mean annual groundwater level at the GW4 well under the effects of HF, its associated activities and RCP4.5 scenario would decrease by 0.04 m compared to that under the sole RCP4.5 scenario. The mean annual groundwater level at the GW4 well under the effects of HF, its associated activities and RCP8.5 scenario would decrease by 0.05 m compared to that under the sole RCP8.5 scenario. Because of higher precipitation and temperature under the RCP8.5 scenario, more surface runoff would occur, and consequently, the mean annual groundwater level at the GW4 well under the effects of HF, its associated activities and RCP8.5 scenario would decrease more than under the effects of HF, its associated activities and RCP4.5 scenario. Therefore, associated activities related to HF affect temporal groundwater levels locally due to various relationships of land use types with precipitation.
The highest and lowest increases in the mean seasonal groundwater discharge in the study area under the effects of HF, its associated activities and RCP4.5 scenario would occur during summer and winter, respectively (Table 8). Similar results would happen under the HF, its associated activities and RCP8.5 scenario. The mean annual groundwater discharge at the outlet of the study area under the effects of (i) HF, its associated activities and RCP4.5 scenario, and (ii) HF, its associated activities and RCP8.5 scenario would increase by 0.44% (i.e., 0.16 m3/s) and 0.45% (i.e., 0.17 m3/s), respectively, with respect to the sole RCP4.5 and RCP8.5 scenarios, respectively. The mean annual groundwater discharge at the outlet of the study area under the effects of (i) HF, its associated activities and RCP4.5 scenario and (ii) HF, its associated activities and RCP8.5 scenario would increase by 118.54% (i.e., 19.59 m3/s) and 122.15% (i.e., 20.19 m3/s), respectively, with respect to the base modeling period. This increased groundwater discharge under both scenarios of the CanESM2 may result in some positive effects on water temperature of the river (i.e., cooler stream temperature during warm months and vice versa) [62,63]. Therefore, HF and its associated activities in the RCP4.5 and the RCP8.5 scenarios would provide more groundwater discharge in the study area for future water supply for oil and gas exploration, and better water quality (stream temperature) compared to those under both base modeling period, and sole RCP4.5 and RCP8.5 scenarios.

3.5. Potential Regarding the Results

The results of this study provide a good prospect for future HF in the study area under the RCP4.5 and the RCP8.5 scenarios of the CanESM2 in 2021–2036 without causing any substantial negative impacts on stream flow and groundwater discharge compared to the base modeling period (2000–2012). These results provide valuable preliminary information to the watershed manager for developing future water allocation plans in the study area for HF and other development activities, irrigation, and forestry. Although the impacts of HF and its associated activities (construction of well pads) on stream flow and groundwater discharge are very small, significant impacts on stream flow and groundwater discharge could be possible in a small catchment area where large amount of HF and its associated activities would occur. In addition, this integrated modeling approach can be used for assessing future water resources in changing climate under the effects of water extraction from river for other water uses, such as irrigation, mining, manufacturing industries and municipal water supply, where water is more used than in HF.

4. Conclusions

This study evaluated how HF and its associated activities would affect surface water and groundwater in 2021–2036 under changing climate (i.e., RCP4.5 and RCP8.5 scenarios of the CanESM2) in a shale gas and oil play area of northwestern Alberta, Canada as a case study by using an integrated hydrologic model (i.e., MIKE-SHE and MIKE-11 models), and a cumulative effects landscape simulator (i.e., ALCES). The simulation results show climate change (i.e., RCP4.5 and RCP8.5 scenarios) during 2021–2036 would significantly increase precipitation and temperature in the study area, and therefore would result in increases in stream flow and groundwater discharge, with respect to those under the base modeling period (2000–2012). Stream flow and groundwater discharge under the RCP8.5 scenario would be higher during spring and summer (due to the higher precipitation), and lower during winter and fall (due to the lower precipitation) as compared to those under the RCP4.5 scenario. The simulation results show very small (less than 1%) reduction on stream flow due to water withdrawals for HF under both RCP4.5 and RCP8.5 scenarios because of the large size of the study area. However, groundwater discharge would increase negligibly (less than 1%) because of the increase in the gradient between groundwater and surface water systems. The offsetting impacts of HF would not decrease stream flow under the effects of both HF and RCP4.5 scenario, and HF and RCP8.5 scenario than those under the base modeling period. The results also demonstrate a very little (less than 1%) positive impact of HF related associated activities on stream flow and groundwater discharge because of insignificant changes in land use, although the impacts on groundwater levels are locally controlled and closely connected to land use type change. Therefore, associated activities would provide additive impacts on stream flow and groundwater discharge under the effects of both (i) HF, its associated activities and RCP4.5 scenario, and (ii) HF, its associated activities and RCP8.5 scenario. The results obtained from this study provide useful information to the oil and gas industries to expand their shale oil and shale gas exploration in the study area in 2021–2036, without facing public pressure on water extraction for HF. The results also provide useful information for developing future water resources management plan at regional level for HF and its associated activities to meet future energy demand by considering future climate change.

Author Contributions

G.C.S.: conceptualization, methodology, investigation, validation, formal analysis, writing—original draft preparation; M.Q.: conceptualization, supervision, writing—review and editing. All authors have read and agreed to the published version of the manuscript.

Funding

This research received no external funding.

Acknowledgments

The authors would like to thank Connie Van der Byl, Brad Stelfox, Greg Chernoff, Linda Smith, Sonia Portillo, Qiao Ying and Kevin Beneteau for their help.

Conflicts of Interest

The authors have declared no conflict of interest exists.

References

  1. McCarthy, J.J.; Canziani, O.F.; Leary, N.A.; Dokken, D.J.; White, K.S. Climate Change 2001: Impacts, Adaptation and Vulnerability; Intergovernmental Panel on Climate Change: Geneva, Switzerland, 2001. [Google Scholar]
  2. Solomon, S.; Qin, D.; Manning, M.; Chen, Z.; Marquis, M.; Averyt, K.B.; Tignor, M.; Miller, H.L. Climate Change 2007: The Physical Science Basis, Contribution of Working Group I to the Fourth Assessment Report of the IPCC; Cambridge University Press: Cambridge, UK, 2007. [Google Scholar]
  3. Oikonomou, P.D.; Kallenberger, J.A.; Waskom, R.M.; Boone, K.K.; Plombon, E.N.; Ryan, J.N. Water acquisition and use during unconventional oil and gas development and the existing data challenges: Weld and Garfield counties, CO. J. Environ. Manag. 2016, 181, 36–47. [Google Scholar] [CrossRef] [PubMed] [Green Version]
  4. Kennedy, M. BC Oil & Gas Commission—Experiences in Hydraulic Fracturing; Ministry of Economy: Warsaw, Poland, 2011. [Google Scholar]
  5. Jinno, K.; Tsutsumi, A.; Alkaeed, O.; Saita, S.; Berndtsson, R. Effects of land use change on groundwater recharge model parameters. Hydrol. Sci. J. 2009, 54, 300–315. [Google Scholar] [CrossRef]
  6. Saha, G.C. Groundwater-Surface Water Interaction under the Effects of Climate and Land Use Changes. Ph.D. Thesis, University of Northern British Columbia, Prince George, BC, Canada, 2014. [Google Scholar] [CrossRef]
  7. Brisk Insights. Hydraulic Fracturing Market Analysis by Shale Type, by Fracturing (Sliding Sleeve), Industry Size, Growth, Share and Forecast to 2022. 2016. Available online: http://www.briskinsights.com/report/hydraulic-fracturing-market-forecast-2015-2022 (accessed on 12 March 2019).
  8. Massachusetts Institute of Technology. The Future of Natural Gas. 2015. Available online: http://web.mit.edu/mitei/research/studies/natural-gas-2011.shtml (accessed on 12 March 2019).
  9. U.S. Energy Information Administration. Annual Energy Outlook 2020 with Projections to 2050; U.S. Department of Energy: Washington, DC, Canada, 2020. Available online: https://www.eia.gov/outlooks/aeo/pdf/aeo2020.pdf (accessed on 17 August 2020).
  10. Gallegos, T.J.; Varela, B.A. Trends in Hydraulic Fracturing Distributions and Treatment Fluids, Additives, Proppants, and Water Volumes Applied to Wells Drilled in the United States from 1947 through 2010—Data Analysis and Comparison to the Literature; U.S. Geological Survey Scientific Investigations, Report 2014–5131; U.S. Geological Survey: Reston, VA, USA, 2015; p. 15. [CrossRef] [Green Version]
  11. Entrekin, S.; Evans-White, M.; Johnson, B.; Hagenbuch, E. Rapid expansion of natural gas development poses a threat to surface waters. Front. Ecol. Environ. 2011, 9, 503–511. [Google Scholar] [CrossRef]
  12. Patterson, L.A.; Konschnik, K.E.; Wiseman, H.; Fargione, J.; Maloney, K.O.; Kiesecker, J.; Nicot, J.; Baruch-Mordo, S.; Entrekin, S.; Trainor, A.; et al. Unconventional oil and gas spills: Risks, mitigation priorities, and state reporting requirements. Environ. Sci. Technol. 2017, 51, 2563–2573. [Google Scholar] [CrossRef] [PubMed]
  13. Mayer, A.; Malin, S.; McKenzie, L.; Peel, J.; Adgate, J. Understanding self-rated health and unconventional oil and gas development in three Colorado communities. Soc. Nat. Resour. 2020. [Google Scholar] [CrossRef]
  14. Shank, M.K.; Stauffer, J.R., Jr. Land use and surface water withdrawal effects on fish and macroinvertebrate assemblages in the Susquehanna River basin, USA. J. Freshw. Ecol. 2015, 30, 229–248. [Google Scholar] [CrossRef] [Green Version]
  15. Barth-Naftilan, E.; Aloysius, N.; Saiers, J.E. Spatial and temporal trends in freshwater appropriation for natural gas development in Pennsylvania’s Marcellus Shale Play. Geophys. Res. Lett. 2015, 42, 6348–6356. [Google Scholar] [CrossRef]
  16. MacQuarrie, A. Case Study Analysis on the Impacts of Surface Water Allocations for Hydraulic Fracturing on Surface Water Availability of the Upper Athabasca River. Master’s Thesis, Royal Roads University, Victoria, BC, Canada, 2018. [Google Scholar] [CrossRef]
  17. Entrekin, S.; Trainor, A.; Saiers, J.; Patterson, L.; Maloney, K.; Fargione, J.; Kiesecker, J.; Baruch-Mordo, S.; Konschnik, K.; Wiseman, H.; et al. Water stress from high-volume hydraulic fracturing potentially threatens aquatic biodiversity and ecosystem services in Arkansas, United States. Environ. Sci. Technol. 2018, 52, 2349–2358. [Google Scholar] [CrossRef]
  18. Cothren, J.; Thoma, G.; Diluzio, M.; Limp, F. Integration of Water Resource Models with Fayetteville Shale Decision Support and Information System; University of Arkansas and Blackland Texas A&M Agrilife, Final Technical Report; University of Arkansas System: Fayetteville, AR, USA, 2013; p. 161. [Google Scholar] [CrossRef] [Green Version]
  19. Best, L.C.; Lowry, C.S. Quantifying the potential effects of high-volume water extractions on water resources during natural gas development: Marcellus Shale, NY. J. Hydrol. Reg. Stud. 2014, 1, 1–16. [Google Scholar] [CrossRef] [Green Version]
  20. Sharma, S.; Shrestha, A.; McLean, C.E.; Martin, S.C. Hydrologic Modelling to Evaluate the Impact of Hydraulic Fracturing on Stream Low Flows: Challenges and Opportunities for a Simulation Study. Am. J. Environ. Sci. 2015, 11, 199–215. [Google Scholar] [CrossRef]
  21. Shrestha, A.; Sharma, S.; McLean, C.E.; Kelly, B.A.; Martin, S.C. Scenario analysis for assessing the impact of hydraulic fracturing on stream low flows using the SWAT model. Hydrol. Sci. J. 2016, 62, 849–861. [Google Scholar] [CrossRef]
  22. Lin, Z.; Lin, T.; Lim, S.H.; Hove, M.H.; Schuh, W.M. Impacts of Bakken shale oil development on regional water uses and supply. J. Am. Water Resour. Assoc. 2018, 54, 225–239. [Google Scholar] [CrossRef]
  23. Buchanan, B.P.; Auerbach, D.A.; McManamay, R.A.; Taylor, J.M.; Flecker, A.S.; Archibald, J.A.; Fuka, D.R.; Walter, M.T. Environmental flows in the context of unconventional natural gas development in the Marcellus Shale. Ecol. Appl. 2017, 27, 37–55. [Google Scholar] [CrossRef] [PubMed] [Green Version]
  24. Vandecasteele, I.; Marí Rivero, I.; Sala, S.; Baranzelli, C.; Barranco, R.; Batelaan, O.; Lavalle, C. Impact of Shale Gas Development on Water Resources: A Case Study in Northern Poland. Environ. Manag. 2015, 55, 1285–1299. [Google Scholar] [CrossRef] [Green Version]
  25. IPCC. Summary for Policymakers. In Climate Change 2014: Mitigation of Climate Change: Contribution of Working Group III to the Fifth Assessment Report of the Intergovernmental Panel on Climate Change; Cambridge University Press: Cambridge, UK; New York, NY, USA, 2014. [Google Scholar]
  26. Abbott, M.B.; Bathurst, J.C.; Cunge, J.A.; O’Connell, P.E.; Rasmussen, J. An introduction to the European Hydrological System Systeme Hydrologique Europeen, “SHE”, 1: History and philosophy of a physically-based, distributed modelling system. J. Hydrol. 1986, 87, 45–59. [Google Scholar] [CrossRef]
  27. ALCES Group. ALCES 5 Technical Manual; ALCES Group: Fort McMurray, AB, Canada, 2013. [Google Scholar]
  28. Alberta Environment. Current and Future Water Use in Alberta. 2007. Available online: http://www.assembly.ab.ca/lao/library/egovdocs/2007/alen/164708.pdf (accessed on 18 August 2020).
  29. Gray, D.M.; Male, D.H. Handbook of Snow: Principles, Processes, Management and Use; Pergamon Press: Toronto, ON, Canada, 1981; p. 776. [Google Scholar]
  30. DHI. Mike She User Manual; Reference Guide; DHI: Horsholm, Denmark, 2009; Volume 2. [Google Scholar]
  31. Yan, J.J.; Smith, K.R. Simulation of integrated surface water and ground water systems—Model formulation. Water Resour. Bull. 1994, 30, 1–12. [Google Scholar] [CrossRef]
  32. Abbott, M.B.; Ionescu, F. On the numerical computation of nearly-horizontal flows. J. Hyd. Res. 1967, 5, 97–117. [Google Scholar] [CrossRef]
  33. DHI. Mike 11 A Modelling System for Rivers and Channels; Reference Manual; DHI: Horsholm, Denmark, 2017. [Google Scholar]
  34. Schut, G.H. Review of interpolation methods for digital terrain modelling. Can. Surv. 1976, 30, 389–412. [Google Scholar] [CrossRef]
  35. Task Committee on Hydrology Handbook of Management Group D of the American Society of Civil Engineers. Hydrology Handbook, 2nd ed.; ASCE: New York, NY, USA, 1996. [Google Scholar]
  36. Zeng, X. Global vegetation root distribution for land modeling. J. Hydrometeorol. 2001, 2, 525–530. [Google Scholar] [CrossRef]
  37. Myneni, R.; Knyazikhin, Y.; Glassy, J.; Votava, P.; Shabanov, N. User’s Guide FPAR, LAI (ESDT: MOD15A2) 8-Day Composite NASA MODIS Land Algorithm; FPAR, LAI User’s Guide, Terra MODIS Land Team (Report); Boston University: Boston, MA, USA, 2003; p. 17. [Google Scholar]
  38. Duan, Q.; Sorooshian, S.; Gupta, V. Effective and efficient global optimization for conceptual rainfall-runoff models. Water Resour. Res. 1992, 28, 1015–1031. [Google Scholar] [CrossRef]
  39. Pacific Climate Impacts Consortium. Statistically Downscaled Climate Scenarios. 2014. Available online: https://data.pacificclimate.org/portal/downscaled_gcms_archive/map/ (accessed on 15 April 2016).
  40. Meinhausen, M.; Smith, S.J.; Calvin, K.; Daniel, J.S.; Kainuma, M.L.T.; Lamarque, J.; Matsumoto, K.; Montzka, S.A.; Raper, S.C.B.; Riahi, K.; et al. The RCP greenhouse gas concentrations and their extensions from 1765 to 2300. Clim. Chang. 2011, 109, 213–241. [Google Scholar] [CrossRef] [Green Version]
  41. Riahi, K.; Rao, S.; Krey, V.; Cho, C.; Chirkov, V.; Fischer, G.; Kindermann, G.; Nakicenovic, N.; Rafaj, P. RCP 8.5—A scenario of comparatively high greenhouse gas emissions. Clim. Chang. 2011, 109, 33. [Google Scholar] [CrossRef] [Green Version]
  42. Roy, L.; Leconte, R.; Brissette, F.P.; Marche, C. The impact of climate change on seasonal floods of a southern Quebec River Basin. Hydrol. Process. 2001, 15, 3167–3179. [Google Scholar] [CrossRef]
  43. Saha, G.C. Climate change induced precipitation effects on water resources in the Peace Region of British Columbia, Canada. Climate 2015, 3, 264–282. [Google Scholar] [CrossRef] [Green Version]
  44. Saha, G.C.; Li, J.; Thring, R.W.; Hirshfield, F.; Paul, S.S. Temporal dynamics of groundwater-surface water interaction under the effects of climate change: A case study in the Kiskatinaw River Watershed, Canada. J. Hydrol. 2017, 551, 440–452. [Google Scholar] [CrossRef]
  45. Johnson, L.; Kralovic, P.; Romaniuk, A. Canadian Crude Oil and Natural Gas Production and Supply Costs Outlook (2016–2036); Study No. 159; Canadian Energy Research Institute: Calgary, AB, Canada, 2016; p. 66. [Google Scholar]
  46. Rivard, C.; Lavoie, D.; Lefebvre, R.; Sejourne, S.; Lamontagne, C.; Duchesne, M. An overview of Canadian Shale gas production and environmental concerns. Int. J. Coal Geol. 2014, 126, 64–76. [Google Scholar] [CrossRef]
  47. Ycharts Inc. Average Crude Oil Spot Price. 2015. Available online: https://ycharts.com/indicators/average_crude_oil_spot_price (accessed on 22 August 2015).
  48. Alberta Energy Regulator. Alberta Drilling Activity Monthly Statistics. December 2013. Available online: https://www.aer.ca/documents/sts/st59/ST59-2013.pdf (accessed on 15 August 2016).
  49. Alberta Energy Regulator. Alberta Drilling Activity Monthly Statistics. December 2014. Available online: https://www.aer.ca/documents/sts/st59/ST59-2014.pdf (accessed on 15 August 2016).
  50. Albek, M.; Ogutveren, U.B.; Albek, E. Hydrological modeling of Seydi Suyu watershed (Turkey) with HSPF. J. Hydrol. 2004, 285, 260–271. [Google Scholar] [CrossRef]
  51. Carlson, M.; Stelfox, B.; Purves-Smith, N.; Straker, J.; Berryman, S.; Braker, T.; Wilson, B. ALCES online: Web-delivered scenario analysis to inform sustainable land-use decisions. In Proceedings of the 7th International Environmental Modelling and Software Society, San Diego, CA, USA, 15–19 June 2014. [Google Scholar]
  52. Wijesekara, G.N.; Gupta, A.; Valeo, C.; Hasbani, J.G.; Qiao, Y.; Delaney, P.; Marceau, D.J. Assessing the impact of future land-use changes on hydrological processes in the Elbow River watershed in southern Alberta, Canada. J. Hydrol. 2012, 412–413, 220–232. [Google Scholar] [CrossRef]
  53. ALL Consulting. Horizontal Drilling and Hydraulic Fracturing Considerations for Shale Gas Wells; Bureau D’audiences Publiques Sur L’environement (BAPE): Saint-Hyacinthe, QC, Canada, 2010. [Google Scholar]
  54. NYSDEC. Statewide Spacing Unit Sizes and Setbacks. 2013. Available online: https://www.dec.ny.gov/energy/1583.html (accessed on 25 November 2016).
  55. Christensen, J.H.; Christensen, O.B. A summary of the PRUDENCE model projections of changes in European climate by the end of this century. Clim. Chang. 2007, 81, 7–30. [Google Scholar] [CrossRef]
  56. Santhi, C.; Arnold, J.G.; Williams, J.R.; Dugas, W.A.; Srinivasan, R.; Hauck, L.M. Validation of the SWAT model on a large river basin with point and nonpoint sources. J. Am. Water Resour. Assoc. 2001, 37, 1169–1188. [Google Scholar] [CrossRef]
  57. IPCC. IPCC Special Report; Emission Scenarios; Cambridge University Press: Cambridge, UK, 2000; p. 570. [Google Scholar]
  58. Drohan, P.J.; Brittingham, M.; Bishop, J.; Yoder, K. Early trends in land cover change and forest fragmentation due to shale-gas development in Pennsylvania: A potential outcome for the Northcentral appalachains. Environ. Manag. 2012, 49, 1061–1075. [Google Scholar] [CrossRef] [PubMed]
  59. Guo, H.; Hu, Q.; Jiang, T. Annual and seasonal streamflow responses to climate and land-cover changes in the Poyang Lake basin, China. J. Hydrol. 2008, 355, 106–112. [Google Scholar] [CrossRef]
  60. Muhammad, A.; Evenson, G.R.; Unduche, F.; Stadnyk, T.A. Climate change impacts on reservoir inflow in the Prairie Pothole Region: A watershed model analysis. Water 2020, 12, 271. [Google Scholar] [CrossRef] [Green Version]
  61. Saha, G.C. Investigation of Groundwater Contribution to Stream Flow under Climate and Land Use Changes: A Case Study in British Columbia, Canada. Int. J. Environ. Clim. Chang. 2015, 5, 1–22. [Google Scholar] [CrossRef]
  62. Price, K.; Leigh, D.S. Morphological and sedimentological responses of streams to human impact in the southern Blue Ridge Mountains, USA. Geomorphology 2006, 78, 142–160. [Google Scholar] [CrossRef] [Green Version]
  63. The Freshwater Blog. How Groundwater Influences Europe’s Surface Waters. 2017. Available online: https://freshwaterblog.net/2017/01/13/how-groundwater-influences-europes-surface-waters/ (accessed on 16 April 2018).
  64. Evans, J.E.; Prepas, E.E.; Devito, K.J.; Kotak, B.G. Phosphorus dynamics in shallow subsurface waters in an uncut and cut subcatchment of a lake on the Boreal Plain. Can. J. Fish. Aquat. Sci. 2000, 57 (Suppl. S2), 60–72. [Google Scholar] [CrossRef]
Figure 1. (a) Surface water monitoring stations and groundwater monitoring wells in the study area. Only those groundwater monitoring wells are shown here which were used for results and discussion section. (b) The location of the study area in Alberta, Canada.
Hydrology 07 00070 g001
Figure 2. Annual variation of the number of hydraulically fractured wells from 2021 to 2036.
Hydrology 07 00070 g002
Figure 3. Observed and simulated stream flows at the SW1 (outlet of the study area) station, and river water levels at the SW3 station by the developed model during (a) calibration and (b) validation periods.
Hydrology 07 00070 g003
Figure 4. Observed and simulated groundwater levels by the developed model at the GW1 well during (a) calibration and (b) validation periods.
Hydrology 07 00070 g004
Figure 5. Comparison of (a) mean monthly precipitation and (b) mean monthly temperature under the RCP4.5 and the RCP8.5 scenarios from 2021 to 2036 and the base modeling period (2000–2012). The error bars represent the standard deviation among monthly precipitation/temperature of 2021 to 2036.
Hydrology 07 00070 g005
Figure 6. Comparison of projected mean monthly stream flows at the (a) SW1 (outlet of the study area) and (b) SW3 stations under the RCP4.5 and the RCP8.5 scenarios from 2021 to 2036 and the base modeling period (2000–2012). The error bars represent the standard deviation among mean monthly stream flows of 2021 to 2036.
Hydrology 07 00070 g006
Figure 7. Comparison of projected mean monthly groundwater discharges generated at the outlet of the study area under the RCP4.5 and the RCP8.5 scenarios from 2021 to 2036 and the base modeling period (2000–2012). The error bars represent the standard deviation among mean monthly groundwater discharges of 2021 to 2036.
Hydrology 07 00070 g007
Table 1. Details of input data used for coupled MIKE-SHE/MIKE-11 model.
Type of DataData and FormatSource
Watershed
  • Canadian Digital Elevation Data of 17.77 m grid
  • Natural Resources Canada
  • Land use/land cover of 30 m by 30 m grid for year 2000
  • Natural Resources Canada
  • Channel geometry
  • Digitizing Digital Elevation Data and Google maps
  • Soil
  • Alberta Environment and Parks
Vegetation Characteristics
  • Rooting depths and Leaf area index of each land use type
  • Published reports and articles [35,36,37]
Climate
  • Observed precipitation, temperature, and reference evapotranspiration from 1985 to 2014
  • 14 weather stations in the study area from Alberta Agroclimatic Information Service, and Alberta Environment and Sustainable Resource Development
Hydrological
  • Daily stream flow and water level from 2000 to 2012
  • Water Survey of Canada
  • Daily Groundwater level from 2000 to 2012
  • Alberta provincial groundwater monitoring wells database
Table 2. Monthly variation of hydraulically fractured wells in 2013 and 2014.
MonthNumber of Wells in 2013Number of Wells in 2014Total Wells in 2013 and 2014Percentage to the Total Annual Wells in 2013 and 2014 (%)
January1820388.78
February29194811.09
March10354510.39
April39122.77
May713204.62
June925347.85
July2013337.62
August1922419.47
September1525409.24
October22254710.85
November1820388.78
December1621378.55
Total186247433100
Table 3. R2 (coefficient of determination) and NSE (Nash-Sutcliffe efficiency) values using observed and simulated stream flows, stream water levels, and groundwater levels data at various monitoring stations and wells during calibration and validation periods.
Monitoring Station/Well (Measuring Parameter)CalibrationValidation
R2NSER2NSE
SW1 (stream flow)0.880.760.920.89
SW1 (stream water level)0.770.690.840.82
SW2 (stream water level)0.480.560.520.59
SW3 (stream flow)0.920.630.90.75
SW3 (stream water level)0.910.710.860.65
GW1 (groundwater level)0.710.690.750.81
GW2 (groundwater level)0.690.700.680.65
GW3 (groundwater level)0.660.690.610.67
GW4 (groundwater level)0.730.770.870.85
Table 4. Mean seasonal precipitation and temperature under the base modeling period (2000–2012), the RCP (Representative Concentration Pathways) 4.5 and the RCP8.5 scenarios in 2021–2036. The values within the parentheses are standard deviation among mean seasonal precipitation and temperature, respectively, from 2021 to 2036. The values within the angle brackets are absolute changes in mean seasonal precipitation and temperature under the RCP4.5 and the RCP8.5 scenarios in 2021–2036, with respect to the mean seasonal precipitation and temperature under the base modeling period, respectively.
Precipitation (mm)Temperature (°C)
ScenarioWinterSpringSummerFallWinterSpringSummerFall
Base modeling period (2000–2012)668717290−11.312.2114.662.28
RCP4.5
(2021–2036)
91120191102−9.954.5116.692.63
(29)
<25>
(40)
<33>
(62)
<19>
(25)
<12>
(1.65)
<1.36>
(1.1)
<2.3>
(1.06)
<2.03>
(1.76)
<0.35>
RCP8.5
(2021–2036)
83130195101−10.534.9817.582.46
(15)
<17>
(49)
<43>
(70)
<23>
(28)
<11>
(2.4)
<0.78>
(1.48)
<2.77>
(1.13)
<2.92>
(2.04)
<0.18>
Table 5. Land use changes due to HF (Hydraulic Fracturing) associated activities from 2000 to 2030 in the study area. Change (%) = [(Area of 2030 land use related to HF associated activities-Area of 2000 land use)/Area of 2000 land use] × 100. Negative sign indicates decrease in land area.
Land Use TypeArea (km2) in 2000Area (km2) in 2030Change (km2)Change (%)
Forest8250.818227.54−23.27−0.28
Agriculture8178.858170.22−8.63−0.11
Perineal crops and pasture4365.254359.00−6.25−0.14
Water1606.991606.990.000.00
Grassland1175.261175.260.000.00
Shrub land287.82287.820.000.00
Road95.94101.825.886.13
Clear cut area23.9856.2532.27134.54
Total23,984.9023,984.90
Table 6. Mean seasonal stream flows at the outlet of the study area (SW1 station) under the (a) base modeling period (2000–2012), (b) RCP4.5 scenario, (c) HF and RCP4.5 scenario, (d) HF, its associated activities and RCP4.5 scenario, (e) RCP8.5 scenario, (f) HF and RCP8.5 scenario, and (g) HF, its associated activities and RCP8.5 scenario in 2021–2036. The values within the parentheses are standard deviation among mean seasonal stream flows from 2021 to 2036. The values within the angle brackets are relative changes in mean seasonal stream flows under the (i) RCP4.5 scenario, (ii) RCP8.5 scenario, (iii) HF and RCP4.5 scenario, iv) HF and RCP8.5 scenario, (v) HF, its associated activities and RCP4.5 scenario, and (vi) HF, its associated activities and RCP8.5 scenario in 2021–2036 with respect to the mean seasonal stream flows under the base modeling period (2000–2012).
Stream Flow (m3/s) at the SW1 Station (Outlet of The Study Area)
SeasonBase Modeling Period (2000–2012)RCP4.5 Scenario (2021–2036)HF and RCP4.5 ScenarioHF, Its Associated Activities and RCP4.5 ScenarioRCP8.5 Scenario (2021–2036)HF and RCP8.5 ScenarioHF, Its Associated Activities and RCP8.5 Scenario
Winter1657.581706.371706.15
<2.93%>
1706.60
<2.95%>
1700.711700.49
<2.59%>
1700.87
<2.61%>
(40.29)(34.62)
<2.94%><2.60%>
Spring1845.881900.471900.35
<2.95%>
1901.14
<2.99%>
1908.811908.69
<3.40%>
1909.68
<3.46%>
(72.27)(78.93)
<2.96%><3.41%>
Summer2009.662043.122042.96
<1.65%>
2043.76
<1.69%>
2048.852048.69
<1.94%>
2049.62
<1.99%>
(48.30)(53.37)
<1.66%><1.95%>
Fall1406.361424.931424.72
<1.31%>
1425.18
<1.34%>
1424.321424.11
<1.26%>
1424.55
<1.29%>
(25.49)(27.21)
<1.32%><1.27%>
Table 7. Mean seasonal stream flows at the SW3 station (near the water withdrawal location) under the (a) base modeling period (2000–2012), (b) RCP4.5 scenario, (c) HF and RCP4.5 scenario, (d) HF, its associated activities and RCP4.5 scenario, (e) RCP8.5 scenario, (f) HF and RCP8.5 scenario, and (g) HF, its associated activities and RCP8.5 scenario in 2021–2036. The values within the parentheses are standard deviation among mean seasonal stream flows from 2021 to 2036. The values within the angle brackets are relative changes in mean seasonal stream flows under the (i) RCP4.5 scenario, ii) RCP8.5 scenario, (iii) HF and RCP4.5 scenario, (iv) HF and RCP8.5 scenario, (v) HF, its associated activities and RCP4.5 scenario, and (vi) HF, its associated activities and RCP8.5 scenario in 2021–2036 with respect to the mean seasonal stream flows under the base modeling period (2000–2012).
Stream Flow (m3/s) at the SW3 Station (Near the Water Withdrawal Location)
SeasonBase Modeling Period (2000–2012)RCP4.5 Scenario (2021–2036)HF and RCP4.5 ScenarioHF, its Associated Activities and RCP4.5 ScenarioRCP8.5 Scenario (2021–2036)HF and RCP8.5 ScenarioHF, its Associated Activities and RCP8.5 Scenario
Winter36.3039.4239.20
<8.0%>
39.48
<8.76%>
38.4138.19
<5.21%>
38.45
<5.92%>
(12.28)(9.78)
<8.6%><5.81%>
Spring212.22241.42241.30
<13.70%>
241.62
<13.86%>
243.68243.56
<14.77%>
243.95
<14.95%>
(21.60)(27.26)
<13.76%><14.83%>
Summer288.30299.19299.03
<3.72%>
299.38
<3.84%>
302.09301.93
<4.73%>
302.32
<4.86%>
(15.16)(16.15)
<3.78%><4.78%>
Fall88.0494.3794.16
<6.95%>
94.45
<7.28%>
93.3793.16
<5.81%>
93.44
<6.14%>
(7.86)(6.86)
<7.19%><6.05%>
Table 8. Mean seasonal groundwater discharges at the outlet of the study area under the (a) base modeling period (2000–2012), (b) RCP4.5 scenario, (c) HF and RCP4.5 scenario, (d) HF, its associated activities and RCP4.5 scenario, (e) RCP8.5 scenario, (f) HF and RCP8.5 scenario, (g) HF, its associated activities and RCP8.5 scenario in 2021–2036. The values within the round and square brackets are absolute and relatives changes in mean seasonal groundwater discharges under the (i) RCP4.5 scenario, (ii) RCP8.5 scenario, (iii) HF and RCP4.5 scenario, (iv) HF and RCP8.5 scenario, (v) HF, its associated activities and RCP4.5 scenario, and (vi) HF, its associated activities and RCP8.5 scenario in 2021–2036 with respect to the mean seasonal groundwater discharges under the base modeling period (2000–2012), respectively.
Groundwater Discharge (m3/s) at the Outlet of the Study Area
SeasonBase Modeling Period (2000–2012)RCP4.5 Scenario (2021–2036)HF and RCP4.5 ScenarioHF, Its Associated Activities and RCP4.5 ScenarioRCP8.5 Scenario (2021–2036)HF and RCP8.5 ScenarioHF, Its Associated Activities and RCP8.5 Scenario
Winter15.8429.1029.1629.2227.5327.6027.62
(13.26)(13.32)(13.38)(11.69)(11.76)(11.78)
[83.71%][84.09%][84.47%][73.82%][74.21%][74.37%]
Spring17.6440.2540.2740.4343.5743.5843.78
(22.61)(22.63)(22.79)(25.93)(25.94)(26.14)
[128.17%][128.29%][129.19%][147.00%][147.05%][148.20%]
Summer19.2044.4044.4344.5947.4447.4647.69
(25.20)(25.23)(25.39)(28.24)(28.26)(28.49)
[131.25%][131.42%][132.24%][147.12%][147.19%][148.40%]
Fall13.4430.1030.1530.2627.6527.7127.80
(16.66)(16.71)(16.82)(14.21)(14.27)(14.36)
[123.96%][124.34%][125.15%][105.77%][106.16%][106.89%]