Abstract
Water quality evaluation is fundamental for water resources management. Water quality index (WQI) is an accurate and easily understandable method for assessing water quality for different purposes. In this study, the Iraqi water quality index (Iraq WQI) was constructed to be used to evaluate the Iraqi rivers for drinking. For this purpose, some statistical techniques, experts’ advice, literature reviews, and authors’ experience were used. First, the principal component analysis (PCA) method and the modified Delphi method were used to select the most influential water quality parameters and their relative weights. Second, the quality curves of selected parameters were drawn to calculate the WQI scores basing on the water quality standards. Of twenty-seven parameters, six parameters were chosen to be within the index depending on their effect on water quality in order to reflect the specific characteristics of the Iraqi waters. The Iraq WQI was applied to the Tigris River within Baghdad as a case study and for some sites on other Iraqi rivers, and gave acceptable results. Results revealed that the statistical techniques used in this paper can be applied in all Iraqi rivers considering their specific characteristics. Based on the reliability of the Iraq WQI, there is no longer a need to use Indices designed for water for other countries.
1. Introduction
Freshwater is the most important natural resource on earth and is essential for all forms of life [1]. Knowledge of the river fluctuation cycles in physical and chemical concentrations, including nutrients, and distinguishing the effects of physical and biogeochemical processes are important for water management [2,3].
Climate change observed worldwide has a significant effect on water resources forecasts and their possible future availability and quality [4,5]. The global population continues to rise, leading to an increase in activities that require large volumes of water. Most of these practices lead to high levels of pollution and breach the limits of sustainability around water resource use [6].
According to [7,8], water shortage, pollution, and salinity affect water supplies in Iraq which have a number of lakes, marshes, and two important rivers, Tigris and Euphrates, that unite in the Shatt al-Arab with their tributaries and branches.
Human activities influence almost every aspect of the hydrological cycles of rivers, such as evaporation, precipitation, and runoff [9]. Changing the nature of the basins of Iraqi rivers will result in an automatic change in the hydrological behavior of the rivers to ensure continuity of the system. These reactions result in poor water quality and changes in the environment of the ecosystem due to pollution, saltwater rise, and others [10].
Surface water quality is a very sensitive issue, critical for long-term economic development, social welfare, and sustainability of the environment [11].
There has been a rise in awareness and concern about water pollution around the globe in recent years. Therefore, new approaches to achieving sustainable management of water resources have been established globally. The regular monitoring of water resources is absolutely essential for assessing water quality for various uses [12,13].
The conventional methods for determining water quality, which is focused on comparing experimentally determined parameter values with existing standards, are not easy to evaluate water quality for large samples containing concentrations for many parameters [14].
In light of that, the water quality index (WQI) is considered a key element of sound water resource management, as it can be used to simplify the expressions of a complex set of river water quality variables [15]. WQI is typically a dimensionless number that combines multiple water quality variables into a single number by standardizing values to the rating curves and allowing for simple data monitoring interpretation [16]. The benefits and uses of water quality indices can be summarized as follows [14,17].
- Comparing water quality from different sources, therefore deciding the appropriate use of the water resource concerned.
- Making policy choices more objective and less subjective.
- To define the difference in conditions before and after the implementation of the regulatory policy or legislation.
- To give an integral image of the overall quality of the source to make it easier for non-technical stakeholders to understand.
The WQIs substantially decrease the volume of data and simplify the description of water quality status in a single number or a single word. The calculation of the index is based on the number of physical–chemical and bacteriological parameters by comparison according to the standards [14]. Horton WQI categorized water quality in the year 1965 [18].
Brown et al. then established a general index of water quality in 1970 [19]. In 1982 Steinhart et al. applied the Great Lakes ecosystem environmental quality index [20]. In 1995 the Canadian Water Quality Index was introduced [21]. The US National Sanitation Foundation Water Quality Index (NSFWQI), Oregon Water Quality Index (OWQI), and the British Columbia Water Quality Index (BCWQI) are frequently used. Then, Bhargava performed the first WQI for India, giving water quality in the range from 0–100 [12,22]. The biggest challenge for developing countries is designing cost-effective pollution control policies. There are therefore suggestions for such situations to use only a few critical parameters to evaluate the WQI [14,16].
In the literature, the water quality of the Iraqi rivers has been widely examined by indices designed for water in different countries. Nonetheless, the studies conducted did not yield reliable results when compared with the river raw data [11,23,24].
There have been some attempts to design water quality indices, which are specific to Iraq, but those attempts were not receiving attention [11,14,25,26].
The water quality indices are generally classified into four major groups [21]. First, the public indices, like the NSFWQI, that are used for general water quality [27]. Second, unique usage indices that identify water as drinking, industrial and environment protection, etc., on the basis of the type of use and application such as the OWQI [28]. The third is the indices that serve as a tool in the planning and decision-making of water quality management projects. The fourth category is the statistical method-based indices and does not consider personal opinions, which based on the relevance of water quality observations to make assumptions. The first three indices are also referred to as an approach to expert opinion. Different weights are given by the different panel of experts for the same variables [27].
The multivariate statistical techniques were used to assist in water quality monitoring, formulating a rapid response to water pollution [29,30,31,32]. The principal component analysis (PCA) is a multivariate statistical technique analytical method commonly used in the scientific community, since it allows to reduce the dimensionality of a data set while maintaining the characteristics of variables that contribute most to this variation [33,34].
There have been several attempts to develop general water quality indices for assessing the quality of the surface water. The Rand Corporation [19] developed the Delphi technique to integrate expert opinions without the adverse effects of group response, using a series of questionnaires. The anonymity of individual responses, statistical analysis of responses, and increasingly validated feedback are important features of the method [35].
In the process, panel members are presented with response patterns learned during the previous round, allowing them to display all respondents’ overall opinions, and if appropriate, they are asked to rethink their earlier responses. The process is ongoing until a desirable degree of consensus is gained between the respondents [36].
The problems facing the water sector in Iraq are the lack of rain due to climate change, population growth along with increased consumption, and the neighboring countries’ control on the rivers shared with Iraq, the other important problems are the increase in pollution and salinity levels, especially in the south of the country [37,38,39,40].
There is no specific water quality index for Iraqi waters, and the use of other indices designed for the waters of other countries will not be accurate and will not give real results [13,25].
In this context, the aims of the present study are to create the Iraqi Water Quality Index (Iraq WQI) by applying the authors’ experience, modified Delphi technique, and principal components analysis, taking into account the Iraqi water quality standards by constructing the curves of the water quality parameters. Deriving this index to be used in monitoring and comparing the water quality of Iraqi rivers and lakes for drinking purposes, and to observe the changes for better management of water resources.
2. Methodology
2.1. The Case Study River and Data
Due to its significant hydrological environment, location, and data availability, the Tigris River is chosen as a case study area. On both sides of the Tigris there are many cities, the most prominent of which is the Iraqi capital Bagdad. The river bisects the capital Baghdad, populated by about 7 million people, for a total of approximately 50 km [11], (Figure 1).
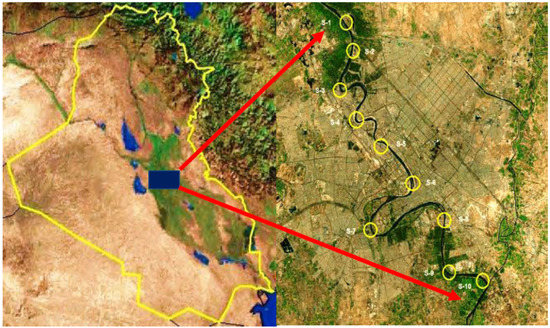
Figure 1.
The sampling stations on the Tigris River in Baghdad.
For several decades, the Baghdad Water Directorate continued a plan to track the water of the Tigris to forecast and regulate the water quality. The samples of water are collected and tested every day with standard methods of [41] at the Directorate’s laboratories as a part of the ongoing monitoring scheme at the stations on the river [42].
Ten intakes of water purification plants situated along the river in Baghdad (Figure 1) were chosen as the sampling stations for this work, they are:
(1) Al-Karkh, (2) Sharq Dijla, (3) Al-Sadr, (4) Al-Wathba, (5) Al-Karama, (6) Al-Kadhimya, (7) Al-Qadisia, (8) Al-Dora, (9) Al-Wahda, and (10) Al-Rasheed plant. These plants supply the city with its water requirements.
The SPSS v.25 software package of Windows [43] was used in the description of the data and PC analysis, Microsoft Excel [44], and GraphPad Prism version 8.00 for Windows [45] were used to draw and derive equations of the quality curves.
Monthly values of 27 water quality parameters in 10 stations for 5 years (16,200 measurements) used to derive the index, they are temperature (T), chlorides (Cl−), (turbidity (Tur), alkalinity (Alk), total hardness (TH), calcium (Ca+2), magnesium (Mg+2), electrical conductivity (EC), sulfate (SO4−1), total solids (TS), suspended solids (SS), hydrogen potential (pH), iron (Fe+2), fluoride (F), aluminum (AL+3), nitrite (NO2−1), nitrate (NO3−1), ammonia (NH3), silica (SiO2), phosphate (PO4−1), dissolved oxygen (DO), biological oxygen demand (BOD), chemical oxygen demand (COD), sodium (Na+), total dissolved solids (TDS), color, and total coliform (TC).
2.2. Development of the Water Quality Index
The general approach for creating an index of water quality can be summed up in the following four steps [18,46,47]:
- Selection of suitable water quality parameters.
- Weight assignment of the selected parameters.
- Development of the sub-indexes’ functions by the transformation of concentration of parameters into mathematical equations.
- Aggregation of sub-indices to construct the index.
In this study, in addition to the authors’ experiences and information from previous studies, two statistical methods were used for developing the index. The first statistical method is the principal components analysis (PCA), and the second is a modified Delphi method in the survey of expert opinions.
2.2.1. Parameter Selection
The principal Components Analysis
To choose the appropriate parameters, the judgment based on the experience of the authors is first applied. Some inactive parameters, having little values and little fluctuation are excluded. Table 1 shows the descriptive statistics (minimum, maximum, mean, std. deviation, and variance value) of 25 water quality parameters. It can be seen that the nine parameters in bold (pH, Fe+2, F, AL+3, NO2−1, NO3−1, NH3, SiO2, and PO4−1) have the very little mean and variance values. They are never a problem in Iraqi waters as confirmed by previous studies [3,23,48], therefore, they were excluded from participation in the derivation of the index.

Table 1.
Some descriptive statistics of the 25 water quality parameters included in this study, all in mg/L, except the T in (°C), Tur in (NTU), EC in (μS/cm−1), and pH. The nine parameters in bold have the little mean and variance values.
Then, a PCA for the 16 remaining parameters was done. PCA is a well-known multivariate analysis technique that allows the identification of patterns in a data series and expressing them in such a way that the similarities and differences can be observed, reducing the dimensionality without losing too much information [32]. Results of PCA are shown in Table 2, which shows that three principal components were selected, with a cumulative variance of 81.88%.
Table 2.
The selected PCs, commonalities of selected parameters and the Kaiser–Meyer–Olkin (KMO) and Bartlett’s Test.
According to the Kaiser–Meyer–Olkin (KMO) and Bartlett’s Tests of Sphericity, if the commonalities are larger than positive or negative 0.5, the corresponding parameters are chosen for the WQI construction [17,33,34]. All the 16 parameters, including EC, TS, TH, Cl−, Ca+2, SO4, TDS, Mg+2, Na+, BOD, COD, SS, DO, T, Alk, and Tur have commonalities larger than 0.5 and passed the KMO and Bartlett’s Test, indicating that they were the main parameters for explaining the water quality of the river.
The Modified Delphi Method
Delphi survey is a multistage facilitation technique where a group of experts is asked to participate in a series of successive questionnaires to establish an opinion or opinion consensus on a topic’s focus areas [34,35].
To know the parameters and their weights are to be included in the index and how the expected output is related to actual measurements of parameters, a panel was selected from 44 engineers and PhD holders with expertise in water quality management. The respondents received one questionnaire that asked them to consider 27 parameters of water quality for possible inclusion in a WQI (the 25 parameters in Table 2 in addition to total coliform and watercolor). The respondents were asked to pick and rate only 10 parameters. Respondents were asked to rate the parameters that they chose as contributors to the overall water quality according to their significance. This ranking was done on a 1 to 5 scale. Of the 44-member panel, 30 respondents (68% completed the questionnaire and returned it.
The 10 parameters the panel selects were: DO, COD, turbidity, TDS, nitrates, phosphates, pH, total coliform, TH, and Cl−.
These 10 parameters and the 16 which result from the PCA can be unified and replaced by these five most important parameters (TDS, TH, Cl−, DO, and COD), which include its overall representation and are known to cause the decline in the water quality of the Iraqi rivers whenever we head to the south of the country [37,38,39,40]. Therefore, turbidity, nitrates, phosphates, and pH were excluded and total coliform was added according to the panel’s recommendation. Based on the foregoing, the final list of parameters from which the index will be derived is: COD, DO, TC, TDS, TH, and Cl−.
2.2.2. Assignment of Weights
Table 3 below shows the weights that are given to the parameters according to the opinion of the experts’ committee, the authors’ experience, and the importance of these parameters in determining the quality of water in Iraqi rivers. Table 3 also includes the proposed categories of values of different water quality classifications of the Iraq WQI based on the Iraqi standard specifications and WHO specifications for drinking water [49,50].
Table 3.
Water quality categories proposed for Iraq water quality index (WQI), mathematical equations for function curves, and weights assigned for the six selected parameters.
The Iraq WQI is developed to classify the river’s water into five categories, viz. very good, good, acceptable, bad, and very bad.
2.2.3. Development of the Sub-Indices
Sub-indices functions are the equations that turn the ranges of concentrations via mathematical equations into index ratings. Then these scores are further translated to a specific scale based on their relative importance for impacting water quality [16]. Such functions of the sub-indices are defined in a specific range based on the standards of water quality and their concentrations to meet in a particular range [12]. To this end, mathematical expressions were fitted for every parameter to get the sub-index equation as given in Table 3. The corresponding difference between the parameter range and index is kept constant in this index to provide a more consistent indices value.
The development of sub-indices function by the weighted sum index method using the proposed categories values of different water quality classifications (Table 3) was plotted as water quality curves. A set of average curves—one for each parameter representing the variation in the level of water quality produced by the various possible measurements of each respective parameter—is drawn, with levels of (water quality) from 0 to 100 on the vertical axis, while various levels of the parameter were set along the horizontal axis, as shown in Figure 2.
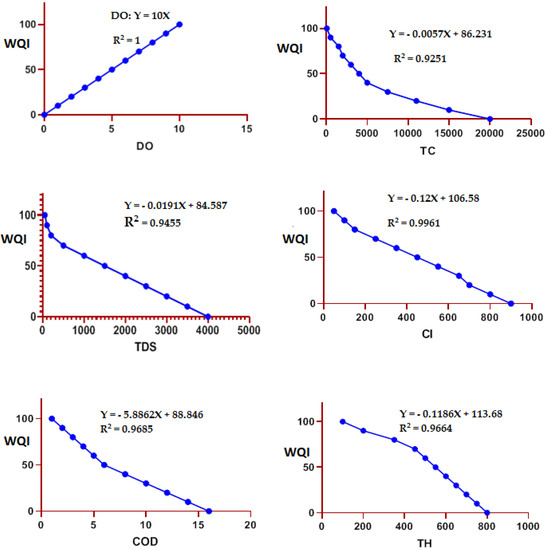
Figure 2.
The water quality curves of the sub-indices of the six parameters.
2.2.4. Aggregation of Sub-Indices
The score produced by each parameter was averaged-out to measure the effect of each individual parameter on a common single scale. For this reason, the following weighted-average aggregation function is used [15,51].
in which
- Iraq WQI = the Iraqi water quality index, a number between 0 and 100.
- Qi = the quality of the ith parameter, a number between 0 and 100.
- Wi = the unit weight of the ith parameter, a number between 0 and 1, and
- n = number of parameters.
Accordingly, the final formula for the Iraqi Water Quality Index will be as follows:
3. Results and Discussion
The initial 25 quality parameters were analyzed to develop the Iraq WQI. Nine ‘inactive’ parameters were removed by the experience method because they do not pose problems in the waters of Iraqi rivers [3,23,48,52,53], (Table 1). Applying the PCA method for the 16 reserved parameters produced three major components, whose cumulative variance is 81.89%, (Table 2). A weight vector and sub-scores for parameters were then calculated by employing the experts’ advice and drawing the quality curves.
The Iraqi Standards [49] and the World Health Organization [50] specify the quality of water for various uses. The six parameters, viz. total dissolved solids (TDS), dissolved oxygen (DO), chemical oxygen demand (COD), total hardness (TH), chlorides (Cl−), and total coliform (TC) are considered to significantly affect the surface water quality as the result an expert panel’s advice and PCA test. For all these parameters, a classification has been devised to categorize the quality of water into five classes. These classes include very good, good, acceptable, bad and very bad. The proposed water quality classification criteria along with class and index score are given in Table 3.
The following are some of the characteristics of these six parameters and the reasons for choosing them within the water quality index:
- Total Dissolved Solids (mg/L): It comprises inorganic salts (Ca+2, Mg+2, K+, Na+, HCO3−1, Cl−, and SO4−2) and some small quantities of organic matter [48]. Higher TDS may be harmful to aquatic life through salinity increase or water composition changes. The main sources of elevated TDS in river water may be from soil erosion, agricultural runoff, household waste pollution, and other human activities [54].
- Total Hardness (mg/L): It is used to describe the dissolved calcium and magnesium effect, to assess water solubility for drinking, domestic, and industrial uses attributed to the presence of HCO3−1, SO4−2, Cl−1, and NO3−1 of Ca and Mg [55].
- Chloride (mg/L): It is the salts of Ca+2, Mg+2, and K+ ions in water. The high chloride content may indicate pollution by industrial waste and domestic sewage [48].
- Chemical Oxygen Demand (mg/L): It is the quantity of oxygen needed to decompose the biodegradable and non-biodegradable organic wastes in water caused by urban wastewater discharge. COD refers to the pollutants which cause adverse conditions for microorganism development [56,57].
- Dissolved Oxygen (mg/L): It is essential for aquatic life. The decomposition of organic matter, industrial waste, dissolved gases, and agricultural runoff result in a lower DO level. The concentration of DO below 5.0 mg/L adversely affects aquatic life [58].
- Total coliform (TC) (MPN/100 mL): It is ten times more abundant in water than the fecal coliforms. Fecal coliform bacteria are sources of human and animal excreta pollution in water. Excreta-contaminated water contains harmful pathogens and is not safe for use [59].
The last two parameters (DO and TC) were chosen according to the advice of the surveyed experts and because of their health importance.
Validation of the Proposed Iraq WQI
The tigris River within Baghdad was taken as a case study, and initial data of 25 quality parameters for the previous 5 years were analyzed. The Tigris River monthly water monitoring data were divided by season into four groups. The final formula for index is applied, which is:
The yielded Iraq WQI scores for Tigris River within Baghdad were rated as Acceptable (69.4) in summer and Good (76.5, 74.8, 72.3) for the rest of the year, the average annual water quality of the Tigris River is Good (73.25) as shown in Table 4.
Table 4.
Application of the proposed index to the seasonal measurements of the Tigris River within Baghdad.
In this study, to ensure the validity of the proposed index for other Iraqi rivers, it was applied to estimate the yearly water quality of sites on some other Iraqi rivers (Diyala, Euphrates, Diwaniyah, Al-Gharraf, and Shatt al-Arab). The data of these sampling locations are taken from the published literature [24,60,61,62,63,64,65,66], the values of the missing parameters were offset from other studies of the same river and region as shown in Table 5.
Table 5.
The application of the proposed (Iraq WQI) index for sites on some Iraqi rivers.
It is observed from Table 5 that the Iraq WQI values are (69.52), (60.9), (66.75) for the Diyala River, Euphrates River, and Diwaniyah River respectively, which indicates that the water quality of these rivers in the site studied falls in the category “Acceptable” and the rivers water needs a traditional purification treatment (sedimentation, filtration and disinfection). Similar is the case for Al-Gharraf River where the index is 71.83, and the quality is relatively better under the category “Good”. In the case of Shatt Al-Arab, it is seen from Table 5 that the Iraq WQI value is 33.36, the corresponding quality class is “Bad” and this water needs more than the traditional purification treatment (reverse osmosis) before any use.
The quality of rivers waters in Iraq is graded whenever we head south, it is better in the northern regions and less in the center of the country, but in the south, it becomes bad, especially the waters of the Shatt al-Arab, which consists of the confluence of the Tigris and Euphrates rivers north of Basra. In general, the water quality of the Tigris and its Al-Gharaf branch is better than that of the Euphrates and Shatt Al-Arab rivers.
Iraq currently has three types of water quality issues to contend with. The first is the water shortage, the second is salinity, and the third is pollutant concentration in water related to municipal, industrial, and agricultural activities [67]. Water quality degradation is further compounded by drought events and is a major contributing factor to agricultural land desertification [68].
As the water flows downstream, the salinity of Iraq’s rivers worsens. Because of local geological features, land management, and agricultural irrigation and drainage activities within the Euphrates watershed, salinity along the Euphrates is higher than along the Tigris and its tributaries [69]. The Shatt al-Arab is suffering from the highest salinity due to the meeting of rivers and drainage channels with high salinity, reduced volumes of water flow, and tidal influence from the Arab Gulf [70].
The proposed index has significant improvement, especially in the step of selecting parameters to be suitable for Iraqi water and the nature of the land and climate of Iraq. The selected parameters for the current proposed WQI are according to the local natural and social situations.
As a result, 6 quality parameters from 27 parameters were selected. Total coliform was added by the expert panel to the WQI due to its health effects. The remaining 21 parameters were excluded due to the reasons mentioned above, or they have been replaced by what they represents. The selection of important water quality parameters will remove the effect of irrelevant parameters and thus produce more accurate results.
A potential problem that may occur is from the inactive parameters, since because of their small and safe value they are removed from the considered list at the first stage. However, if an emergency occurred, the value might generate explosive growth. As a result, in normal situations, the approach suggested is more practical than in emergencies.
From a regular point of view, some parameters (like PO4-1, NO3-1) and others may be critical in water quality evaluation for rivers in other countries and included in the international WQIs, however, in this study, they did not pass the statistical test, were not chosen by the experts and were not known to cause problems to Iraqi waters and for these reasons they were removed.
4. Conclusions
In this paper, an Iraqi Water Quality Index (Iraq WQI) is developed to provide a simple tool for assessment of the quality of surface water resources for drinking water supply. The Iraq WQI is developed based on the Iraqi standard of drinking water (IQS, 2009) by considering 27 parameters covering physical, chemical, and biological aspects of water. The proposed index provides a simpler means for water quality assessment, management, and is very useful for decision-makers, planners and field engineers for maintaining good health of surface water resources.
A WQI method is proposed in which experts’ opinions and principal component analysis are used to select more important water quality parameters, and each parameter is assigned a weight reflecting its relative importance. Evaluation scores of individual parameters are calculated by fitting a water quality curve for every selected parameter. Corresponding with the individual score and the weight, the WQI score is computed, which is applied to the Tigris River as a case study area and for other Iraqi rivers and it has been confirmed that this index can be applied to Iraqi rivers.
Author Contributions
Conceptualization, S.H.E., S.A.A., R.M.S. and N.A.-A.; data curation, S.H.E., S.A.A., R.M.S. and N.A.-A.; formal analysis, S.H.E., S.A.A. and R.M.S.; investigation, S.H.E., S.A.A. and R.M.S.; methodology, S.H.E., S.A.A., R.M.S. and N.A.-A.; project administration, N.A.-A.; validation, S.H.E., S.A.A., R.M.S. and N.A.-A.; visualization, S.H.E., S.A.A. and N.A.-A.; writing—original draft preparation, S.H.E., S.A.A., R.M.S. and N.A.-A.; writing—review and editing, S.H.E., S.A.A., R.M.S. and N.A.-A. All authors have read and agreed to the published version of the manuscript.
Funding
This research received no external funding.
Conflicts of Interest
The authors declare no conflict of interest.
References
- Katyal, D. Water quality indices used for surface water vulnerability assessment. Int. J. Environ. Sci. 2011, 2. [Google Scholar]
- Abbasi, S.A. Water Quality Indices State-of-the-Art; Pondicherry University, Centre for Pollution Control & Energy Technology: Pondicherry, India, 2002. [Google Scholar]
- Abed, S.A.; Ewaid, S.H.; Al-Ansari, N. Evaluation of water quality in the Tigris river within Baghdad, Iraq using multivariate statistical techniques. J. Phys. Conf. Ser. 2019, 1294, 072025. [Google Scholar] [CrossRef]
- Rehana, S.; Mujumdar, P.P. River water quality response under hypothetical climate change scenarios in Tunga-Bhadra river, India. Hydrol. Process. 2011, 25, 3373–3386. [Google Scholar] [CrossRef]
- Abbas, N.; Wasimi, S.A.; Al-Ansari, N. Impacts of climate change on water resources in Diyala river Basin, Iraq. J. Civ. Eng. Archit. 2016, 10, 1059–1074. [Google Scholar]
- Poff, N.L.; Brown, C.M.; Grantham, T.E.; Matthews, J.H.; Palmer, M.A.; Spence, C.M.; Wilby, R.L.; Haasnoot, M.; Mendoza, G.F.; Dominique, K.C.; et al. Sustainable water management under future uncertainty with eco-engineering decision scaling. Nat. Clim. Chang. 2016, 6, 25–34. [Google Scholar] [CrossRef]
- Al-Ansari, N.; Ali, A.; Knutsson, S. Present conditions and future challenges of water resources problems in Iraq. J. Water Resour. Prot. 2014, 6, 1066–1098. [Google Scholar] [CrossRef]
- Al-Ansari, N.; Ali, A.; Knutsson, S. Iraq water resources planning: Perspectives and prognoses. In Proceedings of the International Conference on Civil & Construction Engineering, Baghdad, Iraq, 26–27 January 2015. [Google Scholar]
- Issa, I.E.; Al-Ansari, N.; Sherwany, G.; Knutsson, S. Expected future of water resources within Tigris-Euphrates rivers basin, Iraq. J. Water Resour. Prot. 2014, 6, 421–432. [Google Scholar] [CrossRef]
- Al-Ansari, N. Management of water resources in Iraq: Perspectives and prognoses. Engineering 2013, 5, 667–684. [Google Scholar] [CrossRef]
- Ewaid, S.H. Irrigation water quality of Al-Gharraf Canal, south of Iraq. J. Phys. Conf. Ser. 2018, 1003, 012006. [Google Scholar] [CrossRef]
- Gitau, M.W.; Chen, J.; Zhao, M.A. Water quality indices as tools for decision making and management. Water Resour. Manag. 2016, 30, 2591–2610. [Google Scholar] [CrossRef]
- Ewaid, S.H.; Abed, S.A.; Al-Ansari, N. Crop water requirements and irrigation schedules for some major crops in Southern Iraq. Water 2019, 11, 756. [Google Scholar] [CrossRef]
- Li, P.; Abbasi, T.; Abbasi, S.A. Water quality indices. Environ. Earth Sci. 2014, 71, 4625–4628. [Google Scholar] [CrossRef]
- Sun, W.; Xia, C.; Xu, M.; Guo, J.; Sun, G. Application of modified water quality indices as indicators to assess the spatial and temporal trends of water quality in the Dongjiang river. Ecol. Indic. 2016, 66, 306–312. [Google Scholar] [CrossRef]
- Kachroud, M.; Trolard, F.; Kefi, M.; Jebari, S.; Bourrié, G. Water quality indices: Challenges and application limits in the literature. Water 2019, 11, 361. [Google Scholar] [CrossRef]
- Tripathi, M.; Singal, S.K. Use of principal component analysis for parameter selection for development of a novel water quality index: A case study of river Ganga India. Ecol. Indic. 2019, 96, 430–436. [Google Scholar] [CrossRef]
- Tyagi, S.; Sharma, B.; Singh, P.; Dobhal, R. Water quality assessment in terms of water quality index. Am. J. Water Resour. 2013, 1, 34–38. [Google Scholar]
- Brown, R.M.; McClelland, N.I.; Deininger, R.A.; O’Connor, M.F. A water quality index—Crashing the psychological barrier. In Indicators of Environmental Quality; Springer: Boston, MA, USA, 1972; pp. 173–182. [Google Scholar]
- Steinhart, C.E.; Schierow, L.-J.; Sonzogni, W.C. An environmental quality index for The Great Lakes 1. JAWRA J. Am. Water Resour. Assoc. 1982, 18, 1025–1031. [Google Scholar] [CrossRef]
- Vindo, J.; Satish, D.; Sapana, G. Assessment of water quality index of industrial area surface water samples. Int. J. ChemTech Res. 2013, 5, 278–283. [Google Scholar]
- Sutadian, A.D.; Muttil, N.; Yilmaz, A.G.; Perera, B.J.C. Development of river water quality indices—A review. Environ. Monit. Assess. 2016, 188, 58. [Google Scholar] [CrossRef]
- Ismail, A.H.; Abed, B.S.; Abdul-Qader, S. Application of multivariate statistical techniques in the surface water quality assessment of Tigris river at Baghdad stretch, Iraq. J. Univ. Babylon 2014, 22, 450–462. [Google Scholar]
- Al Obaidy, A.H.; Abid, H.S.; Maulood, B.K. Application of water quality index for assessment of Dokan lake ecosystem, Kurdistan region, Iraq. J. Water Resour. Prot. 2010, 2010, 2715. [Google Scholar]
- Al-Shujairi, S.O.H. Develop and apply water quality index to evaluate water quality of Tigris and Euphrates rivers in Iraq. Inter. J. Mod. Eng. Res. 2013, 3, 2119–2126. [Google Scholar]
- Ewaid, S.H.; Abed, S.A. Water quality index for Al-Gharraf river, southern Iraq. Egypt. J. Aquat. Res. 2017, 43, 117–122. [Google Scholar] [CrossRef]
- Kumar, D.; Alappat, B.J. NSF-water quality index: Does it represent the experts’ opinion? Pract. Period. Hazard. Toxic Radioact. Waste Manag. 2009, 13, 75–79. [Google Scholar] [CrossRef]
- Cude, C.G. Oregon water quality index a tool for evaluating water quality management effectiveness 1. JAWRA J. Am. Water Resour. Assoc. 2001, 37, 125–137. [Google Scholar] [CrossRef]
- Mahapatra, S.S.; Sahu, M.; Patel, R.K.; Panda, B.N. Prediction of water quality using principal component analysis. Water Qual. Expo. Health 2012, 4, 93–104. [Google Scholar] [CrossRef]
- Azhar, S.C.; Aris, A.Z.; Yusoff, M.K.; Ramli, M.F.; Juahir, H. Classification of river water quality using multivariate analysis. Procedia Environ. Sci. 2015, 30, 79–84. [Google Scholar] [CrossRef]
- Garcia, C.A.B.; Garcia, H.L.; Mendonca, M.C.S.; da Silva, A.F.; Alves, J.d.P.H.; da Costa, S.S.L.; Araujo, R.G.O.; Silva, I.S. Assessment of water quality using principal component analysis: A case study of the açude da Macela-Sergipe-Brazil. Water Resour. 2017, 7, 8. [Google Scholar]
- Chu, K.; Liu, W.; She, Y.; Hua, Z.; Tan, M.; Liu, X.; Gu, L.; Jia, Y. Modified principal component analysis for identifying key environmental indicators and application to a large-scale tidal flat reclamation. Water 2018, 10, 69. [Google Scholar] [CrossRef]
- Zeinalzadeh, K.; Rezaei, E. Determining spatial and temporal changes of surface water quality using principal component analysis. J. Hydrol. Reg. Stud. 2017, 13, 1–10. [Google Scholar] [CrossRef]
- Sahoo, M.M.; Patra, K.C.; Khatua, K.K. Inference of water quality index using ANFIA and PCA. Aquat. Procedia 2015, 4, 1099–1106. [Google Scholar] [CrossRef]
- De Carvalho, B.E.; Marques, R.C.; Netto, O.C. Delphi technique as a consultation method in regulatory impact assessment (RIA)—The Portuguese water sector. Water Policy 2017, 19, 423–439. [Google Scholar] [CrossRef]
- Saha, P.D. Water quality characteristics of different industrial wastewater by Delphi water quality index method. Inter. J. Environ. Eng. 2014, 6, 1–14. [Google Scholar] [CrossRef]
- Al-Ansari, N.; Knutsson, S. Toward prudent management of water resources in Iraq. J. Adv. Sci. Eng. Res. 2011, 2011, 53–67. [Google Scholar]
- Christen, E. Managing Salinity in Iraq’s Agriculture: Current State, Causes, and Impacts; International Center for Agricultural Research in the Dry Areas (ICARDA): Beirut, Lebanon, 2019. [Google Scholar]
- Al-Bahrani, H.S. Water quality deterioration of the Euphrates river before entering Iraqi lands. WIT Trans. Ecol. Environ. 2014, 182, 3–14. [Google Scholar]
- Ewaid, S.H.; Abed, S.A.; Kadhum, S.A. Predicting the Tigris river water quality within Baghdad, Iraq by using water quality index and regression analysis. Environ. Technol. Innov. 2018, 11, 390–398. [Google Scholar] [CrossRef]
- Rice, A.; Baird, E.W.; Eaton, R.B. Apha 2017 Standard Methods for Examination of Water and Wastewater; American Public Health Association; American Water Works Association; Water Environment Federation: Washington, DC, USA, 2017. [Google Scholar]
- Al-Sharqi, J. (Baghdad Water Authority, Baghdad, Iraq). Personal communication, 2020.
- IBM Corp. IBM SPSS Statistics for Windows, Version 25.0; IBM Corp.: Armonk, NY, USA, 2017. [Google Scholar]
- Microsoft Corporation. Microsoft Excel. 2018. Available online: https://office.microsoft.com/excel (accessed on 27 April 2020).
- GraphPad. GraphPad Prism Version 7.00 for Windows, GraphPad Software, La Jolla California USA. 2018. Available online: www.graphpad.com (accessed on 27 April 2020).
- Smith, D.G. A better water quality indexing system for rivers and streams. Water Res. 1990, 24, 1237–1244. [Google Scholar] [CrossRef]
- Dinius, S.H. Design of an index of water quality 1. JAWRA J. Am. Water Resour. Assoc. 1987, 23, 833–843. [Google Scholar] [CrossRef]
- Rabee, A.M.; Abdul-Kareem, B.M.; Al-Dhamin, A.S. Seasonal variations of some ecological parameters in Tigris river water at Baghdad Region, Iraq. J. Water Resour. Prot. 2011, 3, 262. [Google Scholar] [CrossRef]
- COQS. Iraqi Standard of Drinking Water No. 417; Second modification; Central Organization for Quality Control and Standardization; Council of Ministers: Baghdad, Iraq, 2009. [Google Scholar]
- WHO. Guidelines for drinking-water quality. In WHO Chronicle, 4th ed.; WHO: Geneva, Switzerland, 2011; Volume 38, pp. 104–108. [Google Scholar]
- Tian, H.; Yu, G.A.; Tong, L.; Li, R.; Huang, H.Q.; Bridhikitti, A.; Prabamroong, T. Water quality of the Mun river in Thailand—Spatiotemporal variations and potential causes. Int. J. Environ. Res. Public Health 2019, 16, 3906. [Google Scholar] [CrossRef]
- Mahdi, B.A.; Fawzi, N.A.-M. Iraq’s inland water quality and their impact on the North-Western Arabian Gulf. Marsh Bull. 2014, 9, 1–22. [Google Scholar]
- Al-Fatlawi, A.; Al-Jassani, M.; Al-Rifaie, J. Pollution assessment of Euphrates river in three governances of Iraq. In MATEC Web of Conferences; EDP Sciences: Les Ullis, France, 2018; p. 05022. [Google Scholar]
- Alobaidy, A.H.M.J.; Maulood, B.K.; Kadhem, A.J. Evaluating raw and treated water quality of Tigris river within Baghdad by index analysis. J. Water Resour. Prot. 2010, 2, 629. [Google Scholar] [CrossRef]
- Alam, M.J.B.; Islam, M.R.; Muyen, Z.; Mamun, M.; Islam, S. Water quality parameters along rivers. Int. J. Environ. Sci. Technol. 2007, 4, 159–167. [Google Scholar] [CrossRef]
- Ahmed, A.A.M. Prediction of dissolved oxygen in Surma river by biochemical oxygen demand and chemical oxygen demand using the artificial neural networks (ANNs). J. King Saud Univ. Eng. Sci. 2017, 29, 151–158. [Google Scholar] [CrossRef]
- Prakirake, C.; Chaiprasert, P.; Tripetchkul, S. Development of specific water quality index for water supply in Thailand. Songklanakarin J. Sci. Technol. 2009, 31, 91–104. [Google Scholar]
- Kannel, P.R.; Lee, S.; Lee, Y.S.; Kanel, S.R.; Khan, S.P. Application of water quality indices and dissolved oxygen as indicators for river water classification and urban impact assessment. Environ. Monit. Assess. 2007, 132, 93–110. [Google Scholar] [CrossRef]
- Sharma, D.; Kansal, A. Water quality analysis of river Yamuna using water quality index in the national capital territory, India (2000–2009). Appl. Water Sci. 2011, 1, 147–157. [Google Scholar] [CrossRef]
- Moyel, M.S.; Hussain, N.A. Water quality assessment of the Shatt al-Arab river, Southern Iraq. J. Coast. Life Med. 2015, 3, 459–465. [Google Scholar]
- Moyel, M.S. Assessment of water quality of the Shatt Al-Arab river, using multivariate statistical technique. Mesop. Env. J. 2015, 1, 39–46. [Google Scholar]
- Al-Saad, H.T.; Alhello, A.A.; Al-Kazaeh, D.K.; Al-Hello, M.A.; Hassan, W.F.; Mahdi, S. Analysis of water quality using physico-chemical parameters in the Shatt Al-Arab Estuary, Iraq. Int. J. Mar. Sci. 2015, 5. [Google Scholar] [CrossRef]
- Al-Rekabi, H.; Al-Ghanimy, D.B.G. Determine the validity of the Euphrates river (Middle Euphrates) for drinking purpose using a water quality index (CCME WQI). Mesop. Environ. J. 2015, 2, 1–11. [Google Scholar]
- Hassan, F.M.; Al-Jibouri, K.D.W.; Hakman, A.A. Water quality assessment of Diyala river in Diyala province, Iraq. Mesop. Environ. J. 2017, 4, 52–61. [Google Scholar]
- Abbas, A.A.A.; Hassan, F.M. Water quality assessment of Euphrates river in Qadisiyah province (Diwaniyah river), Iraq. Iraqi J. Agric. Sci. 2018, 48. [Google Scholar]
- Gatea, M.H. Study of water quality changes of Shatt Al-Arab river, south of Iraq. J. Univ. Babylon Eng. Sci. 2018, 26, 228–241. [Google Scholar]
- Rahi, K.A.; Halihan, T. Changes in the salinity of the Euphrates river system in Iraq. Reg. Environ. Chang. 2010, 10, 27–35. [Google Scholar] [CrossRef]
- Abdullah, A.D.; Karim, U.F.; Masih, I.; Popescu, I.; Van der Zaag, P. Anthropogenic and tidal influences on salinity levels of the Shatt al-Arab River, Basra, Iraq. Inter. J. River Basin Manag. 2016, 14, 357–366. [Google Scholar] [CrossRef]
- Rahi, K.A.; Halihan, T. Salinity evolution of the Tigris river. Reg. Environ. Change 2018, 18, 2117–2127. [Google Scholar] [CrossRef]
- Rahi, K.A. Salinity management in the Shatt Al-Arab river. Int. J. Eng. Technol. 2018, 7, 128–133. [Google Scholar] [CrossRef]
© 2020 by the authors. Licensee MDPI, Basel, Switzerland. This article is an open access article distributed under the terms and conditions of the Creative Commons Attribution (CC BY) license (http://creativecommons.org/licenses/by/4.0/).