Abstract
For modeling physical and mechanical phenomena that occur in unsaturated soils, it is very important to identify the correct relationship between suction and water content. This relationship defines the soil water retention curve (SWRC). Its shape depends on numerous factors, including grain size composition, particles’ thickening state and, above all, the hydraulic and stress soil history. In particular, the SWRC in wetting phase differs from SWRC in drying phase, showing a hysteretic behavior. Hysteresis domain is defined by the main drying and wetting curves; when moving from one phase to another, relationship between suction and water content defines secondary curves within them. In this paper, a laboratory experiment was carried out to determine main wetting and drying curves of a pyroclastic ash sample from southern Italy. In same site of the sample collection, a monitoring station was installed that measured the suction and water content values. The experimental curves were compared with the data recorded on the site. In this paper, moreover, an empirical procedure is proposed to model secondary curves (or scanning curves) within the hysteresis domain. The scanning curves obtained with this method were compared with data collected by the in-situ monitoring network, revealing the ability to describe a situation realistically with a good adaptation. With this procedure, it is therefore possible to minimize errors since it covers a hysteretic behavior.
1. Introduction
The relationship between water content and suction of an unsaturated soil is called the soil water characteristic curve (SWCC). These curves are having an increasingly important role in the assessment of the behavior of unsaturated soil property functions such as permeability, volume change, solute and thermal diffusivity and shear strength [1,2,3,4]. The accurate definition is of great importance for modeling many phenomena influenced by the unsaturated layers such as those of solute transport through vadose zone [5], shallow unconfined aquifers and water dynamics in subsurface drainage systems [6]. The use of the SWCC can be also found in engineering projects such as road embankments [7] and waste containment [8]. The proper interpretation of the unsaturated soils is also essential for studying shallow landslides strongly affected by nonstationary dynamics resulting from rainfall infiltration into soil slopes. Soil failures, in fact, could be caused not only by the groundwater table rising, but also by the loss in unsaturated shear strength due to the dissipation of matric suction in the unsaturated zones. Many physical-based shallow landslide models using the complete Richards equation and the extended Mohr–Coulomb failure criterion [9] valid for describing the shear strength of unsaturated soil were developed [10,11,12,13,14].
Many examples of the effect of various soil sample treatments on moisture retention and the use of the apparatus for studying hysteresis and moisture movement in unsaturated soil are illustrated by Richards and Fireman (1943) [15]. They have proposed an apparatus used for obtaining a quantitative measure of moisture transfer rates in unsaturated soil by employing a porous ceramic plate inside a pressure chamber. The basic and guiding principle was based on achieving the equilibrium of a pressurized gas and water flow through the plate.
SWCC are obtained by a best fitting of disconnected data points, collected from laboratory tests or in situ monitoring. Numerous fitting equations can be found in the technical literature [1,16,17,18,19] which differ in the number of parameters and values of the suction. Analyzing and defining these curves is not entirely simple. Malaya and Sreedeep [20] discuss the critical factors influencing the SWCC interpretation, such as the compaction state of the soil, suction measurement methodologies, stress history and sample aging. Nevertheless, the complex nature of the liquid-phase configuration in an unsaturated porous medium leads to the nonunique relationship between suction and volumetric water content. The curve is hysteretic, i.e., the water content at a given soil suction for the wetting path is less than that of the drying path. Various interpretations and reasons for the apparent hysteresis behavior of unsaturated soil are reported in the literature [21], as for example:
- irregularities in the cross-sections of the void passages;
- pore size distribution is not identical for wetting and drying cycle;
- contact angle of meniscus is different for the wetting and drying process, i.e., it is greater in an advancing meniscus then in a receding meniscus;
- entrapped air bubbles during wetting causes a reduction in water content.
Typical drying and wetting SWCC are presented in Figure 1, which indicates a continuous S-shaped relationship that is hysteretic. The initial drying curve, starting at θs saturated water content, at which the soil is completely saturated, is called the main drying curve (1); the wetting curve, starting from the residual water content θr, is called the main wetting curve (3). Besides these two main curves there are a number of scanning curves (i.e., curves 4–5). The entrapment of air generally occurs during the first drying (i.e., the initial drying curve starts at saturation, θs) and the first wetting processes of the soil. The volume of entrapped air is commonly about from 10% to 15% of the total volume of a specimen. For most soils, there is no further entrapped air during the second drying and wetting processes [22].
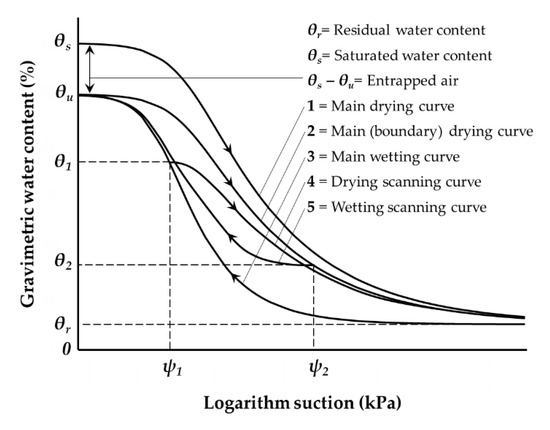
Figure 1.
Schematic illustration of soil water hysteresis curves.
Different studies dealt with this topic, trying an experimental quantification of hysteresis for different types of soils and evaluating its influence on unsaturated behavior. Even though many models and empirical solutions suggesting a representation of the hysteresis domain have been proposed [23,24,25], they are usually ignored, due to the large amount of data needed for calibration and the complexity of the numerical solutions. However, depending on the specific problems, recommended considering appropriate curves is recommended. The objective of this study is to find an empirical hysteresis model for pyroclastic soils that are characteristic of the South Italy area near to Vesuvio volcano. This area is affected by mudflows attributable mostly to the dynamic processes that develop in the unsaturated layers. A correct and coherent modeling of these phenomena requires an extensive knowledge of these soils. In the case presented here, some laboratory tests were carried out on soil samples in order to define the relationship between the hysteresis curves (i.e., main wetting curve and main drying curve). Later, for testing the performances, the obtained results and empirical model were compared with the in-situ data, collected by a monitoring network, which, as better indicated below, includes sensors for measuring suction and soil water content.
2. Experimental Site and Soil Data Collection
The monitoring network is located in a slope section of Pizzo d’Alvano mountain, in Campania region, (southern Italy) which is covered by pyroclastic deposits, consisting of alternating layers of unsaturated volcanic ash and pumice, with outcrops of carbonate rocks. This cover is the result of various eruptive phases of Somma-Vesuvio and Campi Flegrei volcano and others no longer active [26,27]. The phenomena observed along these areas are strongly influenced by unsaturated covers.
As reported in [28], this mountain is characterized by steep slopes (slope angle greater than soil friction angle); the flowslides take place essentially in shallow cohesionless air-fall deposits in primary deposition lying on fractured limestone, the water table is absent and the deposits are initially unsaturated. Failures, in fact, can occur in almost complete saturation or in states still far from saturation, conditioning the failure mechanisms (drained or undrained) and postfailure evolution (flowslide, slide). In recent years, a large number of mudflows have been triggered by heavy rainfall in an extensive area surrounding this mountain. For these events, the dynamics of subsurface circulation and the behavior of soils in unsaturated conditions played an important role, encouraging in-depth studies of these topics.
The monitoring station was installed in July 2015 and consists of seven tensiometers (UMS T1) for measuring the soil water tension ψ and eight FDR probes (5TE) for measuring the volumetric water content θ, located at different depths. The TS1 combines the principles of a pressure transducer tensiometer to measure the soil water tension and a pore water sampler that extracts soil solution through a porous ceramic: inside the TS1 a bidirectional miniature pump is integrated between pressure transducer and ceramic cup. A microcontroller controls the functions of pump and sensors. To refill the cup, a negative pressure, lower than the actual water tension in the surrounding soil, is established to draw water into the ceramic cup. Excess water is released through an exhaust back into the soil. The TS1 is designed for battery-powered in-the-field operation. Regarding 5TE, it measures the water content, electrical conductivity, and temperature of soil. The 5TE uses an oscillator running at 70 MHz to measure the dielectric permittivity of soil to determine the water content. A thermistor in thermal contact with the sensor prongs provides the soil temperature, while the screws on the surface of the sensor form a two-sensor electrical array to measure electrical conductivity. The working range is between apparent dielectric permittivity (εr) 1 (air) and 80 (water). Sensors record soil state continuously, making systematic measurements every minute. Data are sent to a data logger at 10 min intervals and can be downloaded directly on site or by a remote server.
In the area surrounding, layers of soil have been sampled to carry out the necessary laboratory tests and to define main physical characteristics. The stratigraphy observed on site is shown in Figure 2, and the physical properties (specific gravity G, porosity n, saturated hydraulic conductivity ksat, effective cohesion c′ and friction angle ϕ′) are indicated in Table 1. For more details on physical, size distribution and other properties, it is possible to refer to [29,30].

Figure 2.
Stratigraphy observed on site and sensor positions.

Table 1.
Main physical properties of the investigated soils.
3. Experimental Set-up and Testing Procedures
3.1. Laboratory Investigation of the Soil Water Curves
Into a cylindrical plexiglass container, a 6 cm thick pyroclastic ash sample was placed, with a TDR (Time Domain Reflectometry) probe (CS-640 Campbell Scientific, Inc.) and a tensiometer (2100F Soilmoisture Probe) positioned to measure the volumetric water content and the suction, respectively. The TDR probe was placed at half the thickness of the sample (3 cm, Figure 3a). The positioning of the tensiometer after filling the sample from the top, making sure to reach the depth of the TDR probe, is shown in Figure 3b. Table 2 shows some details on the initial characteristics of the deposit.
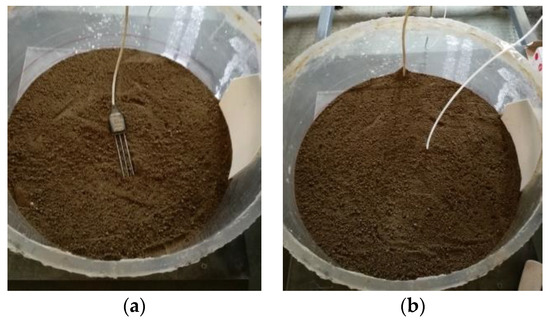
Figure 3.
Location of sensors. (a) TDR (Time Domain Reflectometry) probe. (b) Tensiometer.

Table 2.
Test details.
Then, a wetting phase was started by spraying water. During the test, volumetric water content and suction were monitored and recorded. Test continued until the deposit was at total saturation, that is, until the wet front reached the soil base and the suction was close to zero. The test ran for one hour and forty minutes. Water volume supplied was approximately 3 L, which is equivalent to a rainfall intensity of 22 mm/h and which is coherent with the porosity of the sample. Data acquisition frequency was 5 min for the TDR probe and one second for the tensiometer. After wetting phase, drying phase began, leaving the deposit in natural evaporation. Suction and water content values were monitored constantly. In this phase, value variation is characterized by longer response times compared to the wetting phase, and therefore, data acquisition frequency has been reduced. Both sensors recorded data every 60 min. This phase ran about 31 days, until the sample was close to the residual humidity conditions.
Figure 4a shows water content and suction trend during the wetting phase. The initial suction value was 63.7 kPa. Due to the water infiltration, suction values quickly dropped down to 10 kPa and, approximately 1 h and 20 min later, were close to 0 kPa. The TDR is similarly affected by the front of soil moisture, showing an increasing of volumetric water content that was obtained by using an appropriate sensor calibration for this soil as shown in the following equation (Equation 1) and proposed by [31]:
where εr is the relative dielectric permittivity, εw, εa, εs are the relative permittivities of free water, air, and solids, respectively, θ is volumetric water content, n is soil porosity, and the exponent α is the calibration parameter. At the end of the wetting phase, a volumetric water content of 44% was recorded, which is consistent with the total water applied. Furthermore, considering that the soil had a porosity of 45%, it can be assumed that the sample was completely saturated. Figure 4b shows volumetric water content and suction trend during the drying phase. The trend of increasing in suction was not linear and was faster during the last part. Instead, the volumetric water content had a linear decreasing trend, with an average reduction of 1.15% per day.
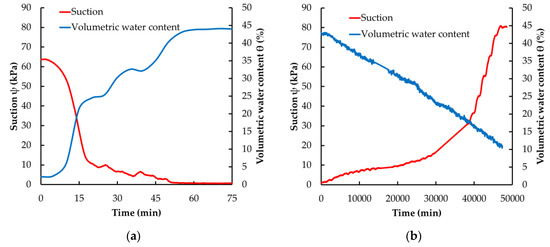
Figure 4.
(a) Wetting phase monitoring. (b) Drying phase monitoring.
The experimental measurements provided discrete points to define the relationship between suction and water content and therefore to calibrate the water retention curves. The suction and volumetric water content values recorded at the same time were coupled and interpolated with mathematical relationships of soil water retention curve. In particular, best fitting was obtained by using the models of [19] and [17]. A simplification has been made to both models by setting the residual water content to zero (θr = 0). With this simplification, the models assume the Equations (2) and (3), where θ and ψ are volumetric water content and suction, respectively, α and n are van Genuchten model parameters and λ and ψb are Brooks and Corey model parameters.
Figure 5a,b show the experimental data points, recorded at the same time, and the best fitting curves. Model parameters, shown in Table 3, were estimated with root-mean-square error method (RMSE). The saturated volumetric water content recorded in the drying phase is 3% lower than that of the wetting phase, due to a relative decrease in soil volume by consolidation. The wetting test was performed starting at an almost completely dry deposit and continuing until complete saturation conditions; likewise, the drying test started at saturated water content and continued until dry conditions. These procedures allowed the definition of the main wetting and drying curves.
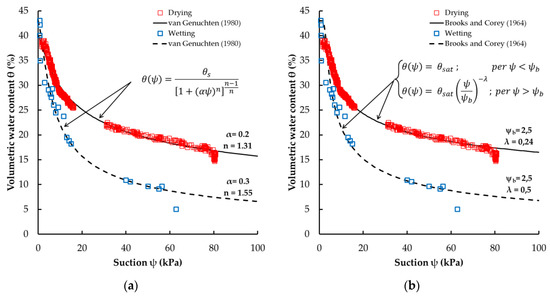
Figure 5.
Wetting and drying water retention curves. (a) Van Genuchten model [19]. (b) Brooks and Corey model [17].

Table 3.
Parameters of water retention curve models and root-mean-square error.
3.2. In Situ Data Processing
Data relating to the hydrological year, 1 October, 2015 to 30 September 2016, and all stored data were filtered and plotted in order to remove all “no_data” and “untrusted” values. All data recorded by each sensor were processed, except those located at 0.40 m depth because there is no tensiometer located there and those of sensor No. 2 because this was not working correctly. The main trends of the collected data are shown in Figure 6. In particular, on the left side, Figure 6 shows seasonal patterns of the suction and the saturation degree (Sr = θ/θs) recorded over the time, at the different depths, in 3 h steps. Suction values recorded in July–September 2016 were not continuous, due to some faults of measuring and recording data values. Graphs, on the right side of the Figure 6, indicate pairs of suction and saturation degree values compared with the main water retention curves determined experimentally by using the van Genuchten approach (see Figure 5). The curves are represented on a semilogarithmic graph that highlights the hysteresis that is formed between the two main retention curves. Graphs show that the more superficial layers are more affected by the humidity variation during the single rainfall events, while the deeper layers have a seasonal variation. All this is also highlighted on suction and saturation degree graphs; in fact, at shallow layers, the values are more distributed within the hysteresis domain, while at greater depths, data show a lower scattering and a moderate variability. With the aim of confirming the consistency and effectiveness of the main curves experimentally performed, it can be seen that all recorded data points are included within them.
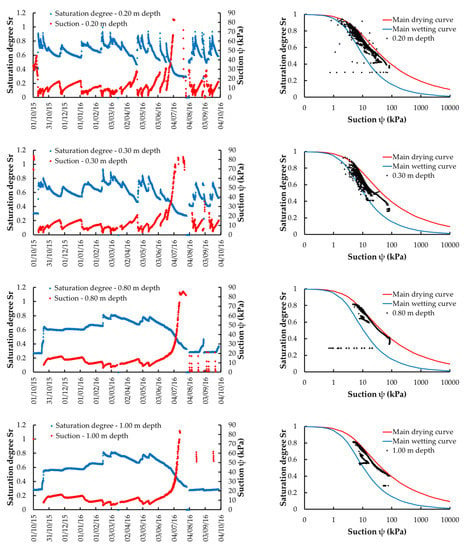
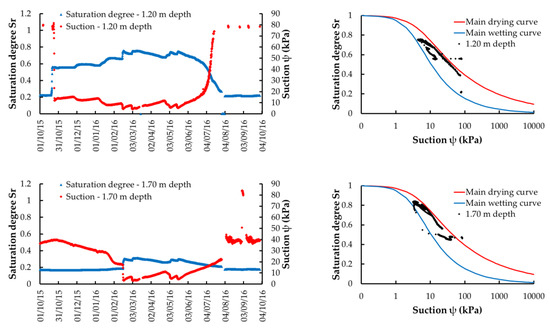
Figure 6.
(Left) Suction and degree of saturation trend at the different depths. (Right) Relation between suction and degree of saturation recorded on site and the main water retention curves.
4. Empirical Modeling of Hysteretic Soil Water Characteristic Curves
As the analyses of both experimental and in situ data show, these soils show marked hysteretic behavior. Wrong theories may be inferred by considering a single curve for the modeling of phenomena related to the unsaturated soil behaviors. The procedure described below aims to define a simple algorithm able to model the possible scanning curves, between the main drying and wetting curves, so to suggest a solution for minimizing mistakes. It is a simplified procedure for the identification of new curves, taking into account soil hydraulic history and the initial conditions of humidity and stress. To implement this procedure (Figure 7), it is necessary to know the main drying and wetting curves (specifically, it is necessary to know the parameters of the van Genucthen model of the two curves: αd and nd of the drying curve and αw and nw of the wetting curve). Furthermore, it is necessary to know soil initial conditions in terms of saturation degree (Srin) and in terms of suction (ψin). With the initial suction value, using the van Genucthen formulation (Equations (4) and (5)), saturation degree relative to the main drying curve (Srd) and relative to the main wetting curve (Srw) are calculated.
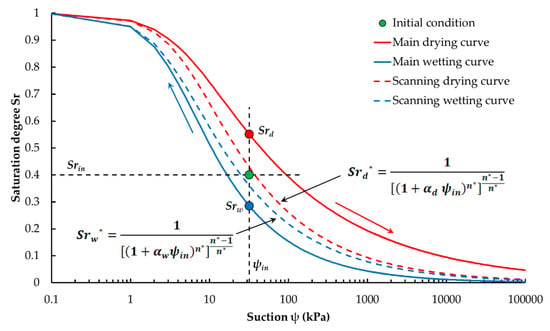
Figure 7.
Schematization of the proposed procedure.
With these values, a parameter (γ) is calculated, which gives information about the initial conditions’ distance to the main water retention curves. The estimate of γ is obtained with Equation (6). The values of γ vary between 0 and 1; in particular, assume the value 0 when Srin = Srd and the value 1 when Srin = Srw.
The parameter γ allows us to calculate a new value of the parameter n of the van Genuchten equation, indicated below as n*. The values of n* vary between nd and nw depending on whether γ = 0 or γ = 1.
As a result there will be two new relations (Equations (8) and (9)) for the SWRC using n* and αd for the drying path and n* and αw for the wetting one.
Figure 8a shows some curves obtained by applying the proposed procedure, both for a drying phase and a wetting phase. In particular, curves obtained with the same initial suction value (ψin) are shown when the parameter γ changes (and therefore when the saturation degree Sr varies). The graph shows that the curves with γ = 0 and γ = 1 coincide with the main drying and wetting curves. Furthermore, during the drying phase, the curves tend to resemble the main drying curve; during the wetting phase, they tend to resemble the main wetting curve.
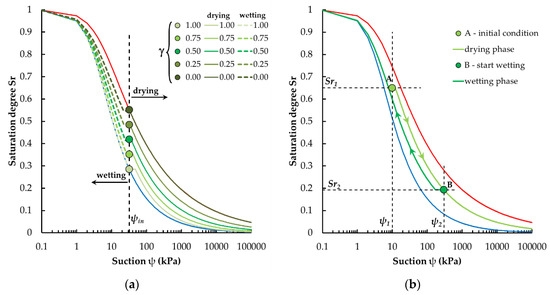
Figure 8.
(a) Curves obtained by applying the proposed procedure, both for a drying phase and a wetting phase. (b) Example of the proposed procedure.
To give an example of the proposed procedure, Figure 8b indicates an application of two phases. With reference to this figure, an initial condition A was chosen (ψ1 = 10; Sr1 = 0.65), and the procedure for defining the curve relating to the drying phase was applied; on this curve, a point B was then identified (ψ2 = 300; Sr2 = 0.19) from which a wetting phase starts. The above graphic example illustrates how this procedure has been able to perform the proper trend, simulating the hysteresis loop.
5. Results and Discussions
To evaluate the performance of the proposed method, the procedure was also applied to a real case provided by in situ monitoring station, by shutting off a wetting event and the subsequent drying event. To identify the wetting phase, a series with decreasing data suction values was selected; similarly, the drying phase was determined in the following dataset of increasing suction values. Only the data series recorded at a depth of 20 cm (tensiometer No. 7, TDR No. 8) and at a depth of 30 cm (tensiometer No. 6, TDR No. 7) were used, since the shallow soil layers usually have a quick response and more evident the wetting and drying events.
Table 4 indicates the local conditions, specified in terms of suction and degree of saturation at the beginning of the wetting phase and at the beginning of the subsequent drying phase (ψin, Srin), with saturation degree at main drying and wetting phase (Srd, Srw) calculated with the previous Equations (4) and (5) and parameters γ and n* by the Equations (6) and (7).

Table 4.
Values of the parameters adopted for the validation procedure and error statistics.
Equations (8) and (9) were then applied, using n*, αd and αw, for drying and wetting paths. The result of the procedure is shown in Figure 9. As the comparison in Figure 9 and static error values in Table 4 show, there is a close correspondence between the path identified by the scanning curves and that followed by the monitoring data. In fact, the new curves lend themselves to describing the selected series with sufficient margin of correctness. Opting for this solution avoids cases of overestimation or underestimation of the suction data, if the main curves are considered.
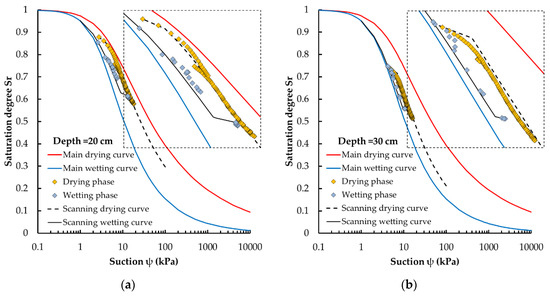
Figure 9.
Comparison between scanning curves and in situ dataset. at (a) 20 cm depth and (b) 30 cm depth.
The details of the in situ data compared with the main curves reveal, as expected, a gap between the real data and the one returned by the main curve. Therefore, applying this procedure certainly involves a reduction of mistakes and at the same time offers a solution that is simple and not time consuming. Insights in this direction can help improve performance or guarantee the optimal solution, especially for the models simulating natural processes conditioned by the mechanisms of the unsaturated layers. In fact, water contents can vary significantly resulting in a lateral shifting of the soil water characteristic curves. This consideration limits the possibility of using a unique SWRC for the estimation of unsaturated soil behavior, and more any other single factors holds potential for the implementation in geotechnical engineering practice. The use of appropriate curves and of procedures which can cover the hysteretic behavior represents certainly an additional power of the models for describing and, therefore, for correctly defining the physical processes. The method proposed here is simple to apply in most numerical models to describe the unsaturated soils, although with limitations. There are, in fact, some implicit assumptions related to the use of these scanning curves, which need to be specifically verified, but it represents an approach to avoid underestimation or overestimation of properties. It is also simple to apply because it uses the well-known and consolidated van Genucthen SWRC model without changing its structure.
Other authors have proposed approaches, without changing van Genucthen structure, for defining scanning curves. Han-Chen et al. [32] developed a model that used two shape functions, α and n, determined from the main drying and wetting curves, to construct a series of closed-form expressions of hysteresis scanning curves. In particular, the soil water content of the current time step can be evaluated using the relationship at the reversal points of van Genucthen equation for wetting and drying phase and updating the shape parameters αd, nd, or αw, nw. On the other hand, Zhou et al. [33] defined scanning gradients depending on a fitting parameter. Unlike these procedures, in the approach proposed here, it is necessary to know only the main curve parameters, without the need to calibrate others (i.e., [33]) or to dynamically change them (i.e., [32]).
The results show that the boundary curves defined by the laboratory test and the scanning curves identified by the empirical method are quite close to the in situ measured data. Gaps in some cases can be improved by further testing of the phenomenon. The following should be undertaken to increase the accuracy of the model: increasing of the number of measured data points and identifying more wetting and drying in situ cases. In addition, SWCC is soil-specific, and further experimental investigations are required to quantify for different soil types.
6. Conclusions
This study represents an attempt to learn more about the soil water characteristic curves and hysteretic behavior, which are indispensable for the unambiguous understanding of unsaturated soils. In particular, this paper presents a work carried out to identify and better understand the behavior under unsaturated conditions of soils typical of the area surrounding Mt Pizzo d’Alvano, in southern Italy. This knowledge is essential for several hydrological and geo-environmental problems; in fact, the possibility of obtaining solutions with reasonable accuracy greatly depends on the characterization of unsaturated soil, which includes the development of the soil-suction–water-content relationships. Here, an empirical representation of the SWCC with hysteresis behavior of unsaturated soils is presented, involving a simple model. The great advantage of this technique is its easy application to experimental saturation–suction data for a given soil. During the work, both laboratory experimentation activities and data from an in situ monitoring station were used. The laboratory tests allowed to define the main wetting and drying soil water retention curves, delimiting a hysteresis boundary, which was later confirmed by the analysis of suction and soil water content data collected by the in situ monitoring sensors. Furthermore, in order to obtain a more in-depth characterization of these soils, a novel empirical representation of the nonlinear SWCC with hysteresis behavior of unsaturated soils has been identified, that allows to better understand the scanning curves and to deal with the nonunique relationship between suction and water content. With the proposed procedure, knowing initial conditions of suction and water content, new SWRC parameters modeled with the van Genucthen approach are defined. This allows to model both wetting and drying scanning curves. The procedure was validated using the data recorded in situ, providing best fitting and encouraging results, which certainly need further information, such as an increased the number data points and at different sites for a new calibration, but already suggest useful information at this stage.
The model presented here deals only with the hydraulic behavior and does not take into account the deformation characteristics of soils, such as the influence of either the initial or current porosities. The great advantage of this technique is its easy application, and its implementation of the resulting equations into fully hydro-mechanical coupled models for numerical analyses of the triggering conditions of shallow landslides is straightforward though the next step.
There are different reasons that would influence the uniqueness of the SWCC; detailed studies of this issue are needed for the unambiguous understanding of unsaturated soil behavior.
Author Contributions
Conceptualization, G.C. and G.S.; Data curation, G.C.; Formal analysis, G.S.; Funding acquisition, G.C.; Methodology, G.S.; Software, G.S.; Supervision, G.C.; Validation, G.C.; Writing—original draft, G.S.; Writing—review & editing, G.C. All authors have read and agreed to the published version of the manuscript.
Funding
The authors gratefully acknowledge the financial support provided by the framework of the SILA—PONa3_00341 project An Integrated System of Laboratories for the Environment.
Conflicts of Interest
The authors declare no conflict of interest.
References
- Fredlund, D.G.; Xing, A. Equations for the soil–water characteristic curve. Can. Geotech. J. 1994, 31, 521–532. [Google Scholar] [CrossRef]
- Vanapalli, S.K.; Fredlund, D.G.; Pufahl, D.E.; Clifton, A.W. Model for the prediction of shear strength with respect to soil suction. Can. Geotech. J. 1996, 33, 379–392. [Google Scholar] [CrossRef]
- Erzin, Y.; and Erol, O. Swell pressure prediction by suction methods. Eng. Geol. 2007, 92, 133–145. [Google Scholar] [CrossRef]
- Sreedeep, S.; Singh, D.N. A critical review of the methodologies employed for soil suction measurement. Int. J. Geomech. 2011, 11, 99–104. [Google Scholar] [CrossRef]
- Patil, N.G.; Rajput, G.S. Evaluation of water retention functions and computer program “Rosetta” in predicting soil water characteristics of seasonally impounded shrink-swell soils. J. Irrig. Drain. Eng. 2009, 135, 286–294. [Google Scholar] [CrossRef]
- Fuentes, C.; Zavala, M.; Saucedo, H. Relationship between the storage coefficient and the soil-water retention curve in subsurface agricultural drainage systems: Water table drawdown. J. Irrig. Drain. Eng. 2009, 135, 279–285. [Google Scholar] [CrossRef]
- Gourley, C.S.; Schreiner, H.D. Field measurements of soil suction in saturated soils. In Proceedings of the First International Conference on Unsaturated Soils, Paris, France; Alonso, E.E., Delage, P., Eds.; Presses des Ponts et Chaussees, Balkema: Rotterdam, The Netherlands, 1995; Volume 2, pp. 601–607. [Google Scholar]
- Blatz, J.; Graham, J. A system for controlled suction in triaxial tests. Geotechnique 2000, 50, 465–469. [Google Scholar] [CrossRef]
- Fredlund, D.G.; Morgenstern, N.R.; Widger, R.A. The shear strength of unsaturated soils. Can. Geotech. J. 1978, 15, 313–321. [Google Scholar] [CrossRef]
- Collins, B.D.; Znidarcic, D. Stability analyses of rainfall induced landslides. J. Geotech. Geoenviron. Eng. 2004, 130, 362–372. [Google Scholar] [CrossRef]
- Tsai, T.L.; Chen, H.F. Effects of degree of saturation on shallow landslides triggered by rainfall. Environ. Earth Sci. 2010, 50, 525–534. [Google Scholar] [CrossRef]
- Capparelli, G.; Versace, P. FLaIR and SUSHI: Two mathematical models for early warning of landslides induced by rainfall. Landslides 2011, 8, 67–79. [Google Scholar] [CrossRef]
- Arnone, E.; Noto, L.V.; Lepore, C.; Bras, R.L. Physically-based and distributed approach to analyze rainfall-triggered landslides at watershed scale. Geomorphology 2011, 133, 121–131. [Google Scholar] [CrossRef]
- Intrieri, E.; Bardi, F.; Fanti, R.; Gigli, G.; Fidolini, F.; Casagli, N.; Costanzo, S.; Raffo, A.; Di Massa, G.; Capparelli, G.; et al. Big data managing in a landslide early warning system: Experience from a ground-based interferometric radar application. Nat. Hazards Earth Syst. sci. 2017, 17, 1713–1723. [Google Scholar] [CrossRef]
- Richards, L.A.; Fireman, M. Pressure-Plate Apparatus for Measuring Moisture Sorption and Transmission by Soils. Soil Sci. 1943, 56, 395–404. [Google Scholar] [CrossRef]
- Gardner, W.R. Some steady state solutions of the moisture flow equation with application to evaporation from the water table. Soil Sci. 1958, 85, 228–232. [Google Scholar] [CrossRef]
- Brooks, R.H.; Corey, A.T. Hydraulic Properties of Porous Media. Hydrol. Pap. Colo. State Univ. 1964, 24, 37. [Google Scholar]
- Brutsaert, W. Probability laws for pore size distributions. Soil Sci. 1966, 101, 85–92. [Google Scholar] [CrossRef]
- Van Genuchten, M.T. A closed form equation for predicting the hydraulic conductivity of unsaturated soils. Soil Sci. Soc. Am. J. 1980, 44, 892–898. [Google Scholar] [CrossRef]
- Malaya, C.; Sreedeep, S. Critical Review on the Parameters Influencing Soil-Water Characteristic Curve. J. Irrig. Drain. Eng. 2012, 138, 55–62. [Google Scholar] [CrossRef]
- Fredlund, D.G. The 1999 R. M. Hardy lecture: The implementation of unsaturated soil mechanics into geotechnical engineering. Can. Geotech. J. 2000, 37, 963–986. [Google Scholar] [CrossRef]
- Pham, H. An Engineering Model of Hysteresis for Soil Water Characteristic Curves. Master’s Thesis, University of Saskatchewan Saskatoon, Saskatoon, SK, Canada, 2001. [Google Scholar]
- Scott, P.S.; Farquhar, G.J.; Kouwen, N. Hysteretic effects on net infiltration. In Advances in Infiltration; ASAE St. Joseph, MI Publish: Phoenix, AZ, USA, 1983; Volume 1, pp. 163–170. [Google Scholar]
- Nimmo, J.R. Semi-empirical model of soil water hysteresis. Soil Sci. Soc. Am. J. 1992, 56, 1723–1730. [Google Scholar] [CrossRef]
- Viaene, P.; Vereecken, H.; Diels, J.; Feyen, J. A statistical analysis of six hysteresis models for the moisture retention characteristic. Soil Sci. 1994, 157, 345–355. [Google Scholar] [CrossRef]
- Rolandi, G.; Bellucci, F.; Heizler, M.T.; Belkin, H.E.; De Vivo, B. Tectonic controls on the genesis of ignimbrites from the Campanian volcanic zone, southern Italy. Miner. Petrol. 2003, 79, 3–31. [Google Scholar] [CrossRef]
- Sorbino, G.; Nicotera, M.V. Unsaturated soil mechanics in rainfall-induced flow landslides. Eng. Geol. 2013, 165, 105–135. [Google Scholar] [CrossRef]
- Damiano, E.; Olivares, L. The role of infiltration processes in steep slope stability of pyroclastic granular soils: Laboratory and numerical investigation. Nat. Hazards 2010, 52, 329–350. [Google Scholar] [CrossRef]
- Spolverino, G.; Capparelli, G.; Versace, P. An instrumented flume for infiltration process modeling, landslide triggering and propagation. Geosciences 2019, 9, 108. [Google Scholar] [CrossRef]
- Capparelli, G.; Damiano, E.; Greco, R.; Olivares, L.; Spolverino, G. Physical modeling investigation of rainfall infiltration in steep layered volcanoclastic slopes. J. Hydrol. 2020, 580, 124199. [Google Scholar] [CrossRef]
- Capparelli, G.; Spolverino, G.; Greco, R. Experimental Determination of TDR Calibration Relationship for Pyroclastic Ashes of Campania (Italy). Sensors 2018, 18, 3727. [Google Scholar] [CrossRef]
- Han-Chen, H.; Yih-Chi, T.; Chen-Wuing, L.; Chu-Hui, C. A novel hysteresis model in unsaturated soil. Hydrol. Process. 2005, 19, 1653–1665. [Google Scholar] [CrossRef]
- Zhou, A.N.; Sheng, D.; Sloan, S.W.; Gens, A. Interpretation of unsaturated soil behavior in the stress—Saturation space, I: Volume change and water retention behavior. Comput. Geotech. 2012, 43, 178–187. [Google Scholar] [CrossRef]
© 2020 by the authors. Licensee MDPI, Basel, Switzerland. This article is an open access article distributed under the terms and conditions of the Creative Commons Attribution (CC BY) license (http://creativecommons.org/licenses/by/4.0/).